3/2019 Strategy for Tile Drainage Water PROJECT NUMBER: MCR&PC / SP, (CON ) 2018 Annual Report
|
|
|
- Barbara Bailey
- 5 years ago
- Views:
Transcription
1 Vegetative Cover Crops as a Nitrate Reduction 3/2019 Strategy for Tile Drainage Water PROJECT NUMBER: MCR&PC / SP, (CON ) 2018 Annual Report Jeffrey Vetsch Univ. of Minnesota Southern Research and Outreach Center Waseca, MN Introduction / Justification Nitrogen (N) is an essential input for profitable corn production. Previous research (Randall and Mulla, 2001, Dinnes et al., 2002) has shown subsurface tile drainage systems deliver nitrate-n to surface waters and thereby degrade water quality. Row crop agriculture in the Midwest is under scrutiny to reduce NO 3 concentrations and loads in tile drainage. The use of cover crops and applying appropriate rates of N for corn are potential management strategies to reduce NO 3 losses in tile drainage water (Dinnes et al., 2002). The species of cover crop, establishment date and termination date could greatly affect their potential to sequester N. Cereal rye is effective at scavenging N when it s established early and not terminated until spring. Generally, Minnesota farmers who use cover crops either use cereal rye in a no-till system or seed a blend of annuals like annual rye, crimson clover and radish. The annual covers are terminated either by cold temperatures or tillage. The potential of fall/winter terminated covers to scavenge N in a corn - soybean rotation in Minnesota is not well known. The objective of this study was to measure the effects of vegetative covers (e.g. winter hardy and winter terminating cover crops) at various N rates on the following: 1) tile water flow, NO 3-N concentration and NO 3-N loss in tile drainage water and 2) corn and soybean yields, nitrogen uptake, and nitrogen use efficiency (NUE). Experimental Procedures A research experiment was initiated in 2016 at the Univ. of Minnesota Southern Research and Outreach Center drainage research facility on a poorly drained Canisteo-Webster clay loam soil complex. Thirty-six individual tile drainage plots were installed in Each plot, measures 20 ft. by 30 ft., has a separate drain outlet and is isolated from adjacent plots to minimize lateral flow. A single tile is placed four ft deep perpendicular to the rows. The plot spacing simulates a 50-ft. tile drain spacing. A randomized complete block design with 4 replications was used in this study. A restriction on randomization within blocks, based on previous tile flow history, helped balance variability in tile flow among the 36 plots. This restriction put plots with the greatest historical flow all in the same block. Nine treatments were comprised from a factorial combination of two management factors, cover crop species (termination date) and N rate each at three levels. The three cover crop treatments include: no cover crop, a late summer seeded cover of cereal rye (rye) with spring termination and a late summer seeded cover as a
2 blend (blend) of annuals (annual rye, crimson clover and radish) with late fall or winter termination due to freezing. Nitrogen rates for corn in 2017 were 3, 120 and 150 lb N/ac. The 3-lb rate was a control that received 3 lb N/ac from starter fertilizer. These control treatments allow for assessment of N contributions from the soil and cover crops. The 120-lb rate was near the 2016 MRTN for Minnesota for a 0.10 price ratio (N price / corn price). The 150-lb rate, 125% of the MRTN, allows us to test our hypothesis that the cereal rye cover terminated in spring may require a greater N rate to maximize corn production and better defines differences in NO 3 concentrations in tile drainage water. Nitrogen fertilizer was band-applied during corn planting as ammonium poly phosphate (APP, ) and UAN (28-0-0) and broadcast-applied at V4 as urea with a urease inhibitor (NBPT). Soybeans (Asgrow 20-35) were planted at 135,000 seeds/ac on 9 May 2016 and 17 May 2018 (Appendix Pic. 8). Weeds were controlled with broadcast applications of glyphosate (24 oz/ac of PowerMax) on 3 and 28 Jun 2016, 19 May 2018, and 7 and 27 Jun Soil residual herbicides were not used to eliminate the potential of herbicide carryover affecting cover crop growth. Soybean seed yield and moisture were measured by combine harvesting four rows on 10 Oct 2016 and 21 Oct Fall strip tillage was performed and a subsurface band of ( at 50 lb P 2O 5/ac and at 90 lb K 2O/ac) was placed 7-inches deep on 24 Oct 2016 and 31 Oct In 2017, corn (NuTech 5L-503AMX) was planted at 36,000 seeds/ac on 7 May with 2.5 gal/ac of APP applied in-furrow. In addition to APP, the 120 and 150 lb N/ac treatments received 9 gal/ac of UAN surface-dribbled 3 inches from the corn row at planting for a total of 30 lb N/ac at planting. Weeds were controlled with broadcast applications of Liberty at 24 oz/ac on 31 May and 16 Jun. Stand counts were taken from the center six rows (harvest rows) on 1 Jun and plots were thinned to a uniform population on 23 Jun. On 10 Jun, urea with NBPT (Factor 3 qt/ton) was broadcast-applied at 90 and 120 lb N/ac to the 120 and 150 lb N/ac treatments, respectively. Relative leaf chlorophyll content (RLC) was calculated from Minolta SPAD meter measurements from the ear leaf at R1 on 19 Jul. At R6 on 28 Sep, six random plants were harvested to determine corn stover and cob yield and harvest index. Grain yield and moisture were measured by combine harvesting four rows on 25 Oct. On 2 Nov, P and K fertilizer ( ) was broadcast-applied as and prior to strip tillage. Corn grain samples were analyzed for nutrient content after microwave acid digestion at a commercial lab. Nitrogen removal in corn grain was calculated from grain and stover yield and N concentration data. Nitrogen use efficiency parameters: partial factor productivity, PFP (the ratio of the grain yield to the applied rate of N) and agronomic efficiency, (the ratio of the increase in grain yield over N-control plots to the applied rate of N) were calculated as described by Snyder and Bruulsema (2007). For these NUE calculations the 3 lb N/ac rate from starter fertilizer was assumed to be the zero N control. Whole plant biomass samples were collected from all soybean plots at R6.5 on 10 Sep Total dry matter yield was calculated, a biomass sample was
3 analyzed for nutrient content, and total N, P, and K uptake were determined. Soybean seed samples were also analyzed for nutrient content (same method as corn grain) to determine crop removal of nutrients in the seed. During the growing season six whole corn plants were collected at V8 and VT to determine biomass yield, nutrient concentration, and nutrient uptake. These plants were weighed wet, chopped, subsampled, subsamples were weighed dry, ground, and analyzed for N and P concentration. Biomass yield and nutrient uptake were calculated after correcting for moisture and plant density. Cover crops were broadcast seeded by hand (simulate aerial seeding) at R6 prior to leaf drop in soybean on 2 Sep 2016 and 7 Sep 2018 and at R5.5 in corn on 13 Sep Seeding rates were 90 lb/ac for cereal rye and 12, 15, and 5 lb/ac for annual rye, crimson clover, and radish, respectively. Cover crop biomass yield was measured by cutting and collecting all material from 6.25 sq. ft. on 21 Oct 2016, 17 Apr 2017, 1 Nov 2017, and 16 May No biomass harvest was conducted in Nov of 2018 due to very little cover crop growth (Appendix Pic. 9). Since the blend cover crop terminated during the winter, these plots were not sampled in spring. Biomass samples was dried, weighed, ground, and analyzed for nutrient content using the same procedures as grain and whole plant samples. Tile drainage is measured via an automated collection system. Tile water collects in drainage wells, then is pumped via a sump pump through water meters that measure flow volume. Flow volume is recorded on a datalogger hourly. These hourly flow data are examined for outliers prior to summarizing daily. The previous 24-hours of flow are summed at 8 am each day. Whenever the sump pump turns on and pressurizes the system, a portion (flow-weighted) of flow is collected in containers. Tile water samples are taken from each plot once a week during normal tile flow and two or three times per week during heavy tile flow. Water samples are kept cool prior to collection and then frozen after collection. Soil samples were taken from all plots in Jun (0- to 6-inch depth) and in the spring and fall (0- to 6-, 7- to 12-, 13- to 24-, and 25- to 36-inch depths). Samples were immediately dried at 105º F, then ground and sieved to pass a 2-mm screen. June samples were analyzed for ph, Olsen P, exchangeable K and soil organic matter using standard soil test methods for the North Central Region. Spring and fall samples were analyzed for nitrate and ammonium-n. All soil samples were analyzed at commercial labs. All data were statistically analyzed using ANOVA with proc mixed in SAS (SAS 9.2, SAS Institute Inc., Cary, North Carolina). A two-factor factorial ANOVA compared the effects and interactions of cover crop species and termination data [none, cereal rye (spring termination), and annual blend (winter termination)] and total N rate (3, 120, and 150 lb/ac). Mean separations were determined using the P Diffs procedure in SAS with alpha=0.10 level of significance. Treatments followed by different letters within a row or column are
4 significantly different. Tile flow, concentration and loss data in 2018 were log transformed (base 10) to meet normality assumptions; therefore, the means presented in Table 6b were back transformed. Results and Discussion Weather Weather in 2016 was extraordinary and record breaking (Table 1). March and Apr were warmer and drier than normal, which resulted in early spring field work and planting in southern Minnesota. May and Jun had near normal temperature and precipitation, nearly ideal for crop development. Precipitation in Jul, Aug and Sep was 202, 246 and 403 percent of normal, respectively. Each of these months had a 24-hour rainfall event that exceeded three inches. Extensive runoff and tile flow (Figure 1), water ponding, and saturated soil conditions were observed during these months, especially Aug and Sep. Growing season (Apr-Sep) rainfall totaled a record inches or inches (86%) more than normal. Total annual rainfall totaled inches, a statewide record, and 157% of normal at Waseca. Near or slightly warmer than normal temperatures were observed throughout the 2016 growing season. Growing degree units (GDU) from 1 May through 9 Oct (first freeze) totaled 2,938 about 17% more than normal. Despite excessive rainfall in Jul, Aug and Sep, the 2016 growing season was a good one for crop production in south-central Minnesota. Weather data were measured at the SROC weather station located 0.4 miles from the drainage research site. Abundant and well distributed rainfall with moderate swings in temperatures describe the weather in 2017 (Table 1). The months of May, Jun, and Oct had significantly greater than normal precipitation; whereas, other months had near normal or less than normal precipitation. Growing season (Apr-Sep) rainfall totaled inches only 0.11 inches less than normal. Daily rainfall exceeded 2.00 inches on just one day (10 Jul, Figure 3) in 2017; therefore, leaching and tile drainage was minimal compared to recent growing seasons. January and Feb were considerably warmer than normal all other months were near normal. Growing season GDU s totaled 2656 and were 3% more than normal. Urea fertilizer with NBPT was broadcast-applied on 10 Jun 2017, only 0.02 inches of rainfall was recorded the next two days and daily maximum air temperatures were in the 90 s F. On 13 Jun, 1.73 inches of rainfall was recorded. Leaf burning due to ammonia volatilization from surface-applied unincorporated urea with NBPT was observed a few days after application; therefore, some of this fertilizer N was likely lost due to volatilization. Weather data characterizing the 2018 growing season at Waseca are presented in Table 1 and Figure 4. Abundant rainfall and large temperature deviations from normal describe the weather during the first few months of the growing season. April had near normal precipitation but much of it came as snow due to air temperatures which averaged 13 degrees F. less than normal. Soil remained frozen or partially frozen (varied in field) until mid-april. The months of May and Jun had greater than normal precipitation and were warmer than normal. July and Aug were near normal for both precipitation and temperature. Sep had 287% of normal
5 precipitation and was warmer than normal. On 4 and 5 Sep 6.44 inches of precipitation was recorded, this resulted in field and drainage culvert flooding. Growing season (Apr-Sep) rainfall totaled inches or 9.62 inches more than normal. Growing degree units (GDUs) for the season were 111% of normal. Soybean production in 2016 (setup year) Soybean yields averaged 75 bu/ac in this extraordinarily wet growing season (Table 2). Yields were slightly greater without a cover crop than with either rye or blend. Due to the early September seeding date and plentiful rainfall, it s unlikely this yield difference was due to plant competition or soil moisture. It likely resulted from foot traffic in plots during cover crop seeding as some plants in this very dense canopy were trampled down during seeding. Soybean production in 2018 Soybean yields were about 2 to 3 bu/ac greater without a cover crop than with blend and rye covers, respectively (Table 2). Due to minimal cover crop growth, it s unlikely this yield difference was due to plant competition or soil moisture. Foot traffic during cover crop seeding may have contributed to this reduction; however, much of the difference came from the no cover with 3 lb N/ac treatment (66.4 bu/ac). This treatment also had the highest yield in Prior to this study (2016), some parts of these control plots were used as grassed borders for easier access to the drainage culverts. Therefore, these grassed areas were not cropped to corn and soybean. We will analyze soil samples from these plots to see if they have lower levels of soybean cyst nematode compared to the rest of the field, which could partly explain their greater yield. Cover crop biomass Cover crop biomass on 21 Oct 2016 was 120% greater (194 lb/ac) with rye than with blend (88 lb/ac), when averaged across future N treatments (Table 3a). This biomass yield difference resulted in greater N and P uptake with rye (5.9 lb N/ac) than blend (3.0 lb N/ac), despite a greater N concentration in the blend. Significant cover crop N rate interactions showed biomass yield and N uptake were affected by the future N rate for corn with the blend cover but not with the rye cover. Moreover, the 120 lb N rate and blend cover had considerably greater biomass yield and subsequently greater N uptake. Since these N rates were not applied until spring 2017, it s unclear what these differences mean. They could be random in field variation or a remnant from the previous study on this plot. Whatever the reason, some annual blend plots had considerably greater biomass than others; whereas, the rye cover biomass was more consistent among plots within and across treatments. On 17 Apr 2017, rye biomass and N and P uptake was greater with the 150 lb N/ac rate (not yet applied) than with other N rates. By 17 Apr the blend cover had terminated and decomposed so much so it was difficult to locate which plots had blend without a plot plan (see appendix Pic. 5 and 6). On 17 Apr, N uptake in the rye biomass ranged from 5.7 to 10.9 lb/ac. The amount of sequestered N in this study is less than what is typically reported in the research literature.
6 Biomass yields were extremely low ( 13 lb/ac) on 1 Nov 2017 and were not affected by the main effects of cover crop species and N rate for corn (Table 3b). However, significant cover crop N rate interactions showed treatment #6 (rye with 150 lb N/ac for corn) had greater biomass yield and nutrient uptake than other treatments. It s unclear why these differences occurred; however, with such minimal growth and uptake the impact of these differences on crop production, water use, and soil health are likely negligible. Nitrogen concentration in cover crop biomass was greater with 120 and 150 lb N/ac for corn than with the control (3 lb N/ac), when averaged across cover crop species. On 16 May 2018, biomass yield of the rye cover averaged 46 lb/ac and was not affected by N rate for corn. Like fall, N concentration in cover crop biomass was greater when 120 and 150 lb N/ac was applied for corn than with the control. At termination, N uptake in cereal rye cover ranged from only 1.1 to 1.7 lb/ac. This small amount would likely have little effect on N leaching or subsequent crop production. Corn production in 2017 Corn biomass yield, N concentration, and N uptake at V8 and VT are presented in Table 4. When averaged across N rate, V8 corn biomass yield and N uptake was greatest with no cover, intermediate with blend, and least with rye. What is unclear is why the rye slowed early growth of corn. It could be due to less N availability and/or the extra residue from spring terminated rye (Pic. 6) kept the soil cooler thus slowing early growth. When averaged across cover crops, V8 biomass yield, N concentration, and N uptake were greater with 120 and 150 lb N/ac than with 3 lb N/ac (control). At the 3 lb N/ac rate, no cover had 82% greater biomass yield at V8 than rye. At VT, interaction between treatment main effects, cover crop and N rate, were found for biomass yield, N concentration, and N uptake. Generally, biomass yields were not different among cover crop treatments at 120 and 150 lb N/ac; whereas, biomass yields with the 3 lb N/ac control were greatest with no cover, intermediate with blend and least with rye. These data showed the cover crop treatments caught up to the no cover treatment by VT when fertilized with adequate N. This also suggests the reduction in growth with rye cover, when averaged across N rates, was most likely due to N deficiency. Nitrogen concentration and uptake at VT were not different among covers at 150 lb N/ac, but were less or trended less with no cover and rye at 120 lb N/ac. At 3 lb N/ac, N concentration with no cover was greater than blend and N uptake with no cover was greater than both blend and rye. These data showed in the control (3 lb N/ac) treatments, no cover had 10 and 17 lb/ac more N uptake at VT than the blend and rye, respectively. This suggests some of the N sequestered in the cover crops did not get released back to the corn crop by VT. The effects of cover crop species and N rates on corn production parameters are presented in Table 5. Corn grain moisture was wettest with rye at 3 lb N/ac and driest with no cover at 3 lb N/ac. These data showed delayed maturation of corn with rye and accelerated maturation with no cover, but only with 3 lb N/ac control treatment. When averaged across N rates, stover N concentration and uptake were greater with no cover than with rye or blend. When averaged across cover crop treatments, stover and grain N concentration and stover N
7 uptake increased with increasing N rate. No significant differences in final plant population due to treatments were observed in these data. Significant interaction between treatment main effects was observed for corn grain, cob, stover, and silage yield, grain N uptake, total N uptake, and RLC (Table 5). At 150 lb N/ac grain yields were not statistically different among the three cover crop treatments; however, at 120 lb N/ac grain yields were reduced compared with 150 lb N/ac for both no cover and rye cover. At 3 lb N/ac grain yields were greatest (150 bu/ac) with no cover, intermediate (120 bu/ac) with blend, and least (108 bu/ac) with rye. This 42 bu/ac spread in grain yield was expected as research (Badger and Kaiser, 2017) has shown corn yields can be reduced at less than optimum N rates when following cereal rye covers; therefore, corn grown following rye requires more N fertilizer to optimize production. Cob yields were not affected by cover crop treatments at 150 lb N/ac; however, at 3 lb N/ac cob yields ranked no cover > blend > rye. Corn stover yields were similar among cover crop treatments at both 120 and 150 lb N/ac. At 3 lb N/ac stover yield was greater with no cover than with rye and blend covers. The silage yield response to treatments was nearly identical to corn grain yield. Both cover crops reduced grain N uptake compared with no cover at 3 lb N/ac (Table 5). Rye cover reduced grain N uptake at 120 lb N/ac; however, no significant differences in grain N uptake were found among cover crop treatments at 150 lb N/ac. Total N uptake was greater with no cover than with rye at all N rates. Total N uptake was greater with no cover than with blend at 3 and 150 lb N/ac. Nitrogen uptake was generally less with cereal rye compared with no cover. This suggests some of the N sequestered by cereal rye was either lost, likely through gaseous N compounds, and/or still immobilized in soil organic matter. At VT/R1, RLC was similar among cover crop treatments at both 120 and 150 lb N/ac; whereas, at 3 lb N/ac RLC was greater with no cover and the blend than with rye (Table 5). At VT/R1, RLC data predicted no N deficiencies in corn at 120 lb N/ac; however, N deficiency symptoms were evident at R5 and yields were reduced in both no cover and rye cover treatments at the 120 lb N/ac rate (Appendix Pic. 7). These data suggest a considerable amount of N was taken up after VT/R1 and that N deficiency this late can reduce yield. Tile drainage and nitrate concentrations and loads in 2016 Tile drainage and nitrate concentrations in drainage water were measured during the 2016 growing season. The goal during this setup year of the study was to flush out residual NO 3-N from the previous research study and thereby remove any legacy effects in the tile drainage system. Over 17 inches of tile drainage was recorded in this record wet 2016 growing season (Fig. 1). This amount is twice as much as a typical growing season and therefore ideal for flushing out the system. The majority, nearly 13 inches, of drainage was recorded in Aug and Sep, which is very unusual. Nitrate-N concentrations in Jun ranged from 8 to 10 mg/l and modest differences due to legacy effects of previous study were observed (Fig. 2). By Sep 2016, NO 3-N
8 concentrations had declined to about 4.5 mg/l and variability among the newly seeded cover crop treatments was minimal. Tile drainage and nitrate concentrations and loads in 2017 (corn year) The effects of cover crop species and N rates for corn on tile flow, flow-weighted (FW) NO 3-N concentrations, NO 3-N loss (load), and flow adjusted loss in 2017 are presented in Table 6a. Tile flow began in Feb and some tile flow occurred in every month except Jan and Dec of 2017 (Fig. 3). Total annual flow averaged across treatments was only 4.2 inches, which is less than normal. Due to the lack of consistent flow in many months the flow data have been pooled into two periods, pre-n application (Pre) and post N application (Post). The first N treatments were applied at planting on 7 May; therefore, Pre was from 15 Feb to 7 May and Post was from 8 May to 16 Nov. Tile flow was not affected by treatment main effects, cover crop species and N rate for corn, or by interaction of these main effects. Some numeric differences were observed, these could be a result of treatment effects, seasonal flow variability (low flow year), and/or random variability. When averaged across N rates, FW NO 3-N concentrations were greatest with no cover, intermediate with blend, and least with rye (Table 6a). These concentration differences were consistent for Pre and Post periods and the annual average. When compared to cereal rye, annual average NO 3-N concentrations were 3.4 times greater with no cover and 2.6 times greater with blend. When averaged across cover crops, NO 3-N concentrations were not significantly affected by N rates for corn although some small numeric differences were observed. NO 3-N loss or load to surface waters during the Post period was greatest with no cover, intermediate with blend, and least with rye, when averaged across N rates for corn. There were no significant differences for NO 3-N load during Pre period or for the annual total. Flow-adjusted NO 3-N loss (Eq. 1) was greatest with no cover (1.9 lb/inch), intermediate with the blend (1.5 lb/inch), and least with cereal rye (0.6 lb/inch), when averaged across N rates for corn. Equation 1 total nitrate lost total flow = flow adjusted loss Tile drainage and nitrate concentrations and loads in 2018 (soybean) The effects of cover crop species and N rates (applied to 2017 corn) on tile flow, FW NO 3-N concentrations, NO 3-N loss and flow adjusted loss in 2018 are presented in Table 6b. Due to cold spring temperatures and frozen soils, significant tile flow did not begin until mid-april in 2018 (Fig. 4). Averaged across treatments, annual flow totaled 13.2 inches with 46% during the period from Apr Jun and 45% in Sep. Due to the lack of consistent flow in some months, flow data were pooled into quarterly periods: M-M (Mar-May), J-A (Jun-Aug), S-N (Sep-Nov), and D-F (Dec-Feb). During this research period (crop and drainage season), no flow was measured in Nov and Dec of 2018 and Jan of Tile flow was greater with rye cover than with no cover and blend in M-M, S-N, and the annual total, when averaged across the main effect of N rate for corn in At this time, we cannot determine if flow differences observed in 2018 are treatment effects, unexpected flow
9 trends (different from previous years flow trends), or random flow variation. Hopefully more years of data will aid in explaining these results. When averaged across N rates, FW NO 3-N concentrations were greater with no cover and blend than with rye in M-M and annual avg. (25% greater) and were greater with blend than rye in J-A (Table 6b). Nitrate-N concentrations increased with increasing N rate in J-A and annual avg. and were greater with 120 and 150 lb N/ac than control in other 3-month periods, when averaged across the main effect of cover crop. Significant cover crop specie N rate interactions for NO 3-N concentration showed NO 3-N concentrations were not significantly different between the 120 and 150 lb N/ac rates with blend and no cover; whereas, NO 3-N concentrations were greater with 150 lb N/ac than 120 with rye cover. In 2018, NO 3-N concentrations were quite low ranging from 1.7 to 6.5 mg/l in fertilized plots (120 and 150 lb N/ac rates). Usually NO 3-N concentrations in tile drainage water exceed the EPA drinking water standard of 10 mg/l. The record wet year of 2016 dramatically reduced NO 3-N concentrations during the setup year of this study and concentrations have generally remained relatively low since. Keeping NO 3-N concentrations <10 mg/l during the last two years of this study is partly due to cover crop treatments, cool wet falls, and appropriate N rates for corn. Nitrate loss from tile drainage was not affected by the main effect of cover crop in 2018, when averaged across the N rates for corn. Nitrate loss was greater with 120 and 150 lb N/ac than with the control (3 lb N/ac) for all 3- month periods and the annual total. Total NO 3-N loss ranged from 4.7 lb/ac in the control to 10.3 lb/ac in the 150 lb N/ac treatment, when averaged across the main effect of cover crop. Significant cover crop specie N rate interactions for NO 3-N loss showed NO 3-N losses were similar between the 120 and 150 lb N/ac with blend and no cover; whereas, NO 3-N losses were greatest with 150 lb N/ac with rye cover. These significant interactions are like those observed for FW NO 3-N concentration. In 2018, flow-adjusted NO 3-N loss was greater with no cover (0.68 lb/inch) and blend (0.67 lb/inch) than with rye cover (0.55 lb/inch), when averaged across the main effect of N rate for corn. When averaged across cover crops, flow-adjusted NO 3-N loss in tile drainage increased with increasing N rate. The significant cover crop N rate interaction for flow-adjusted NO 3-N loss showed flow-adjusted NO 3-N losses with a cereal rye cover crop were not significantly different between the control and 120 lb N/ac treatments (0.43 vs 0.48 lb/inch, respectively); however, with blend and no cover the 120 lb N/ac rate increased flow-adjusted losses compared with the control. Some similarities were found between the 2018 and 2017 tile water data. Generally, these data showed a cereal rye cover crop terminated in the spring reduced NO 3-N concentration and flow-adjusted loss in tile drainage water, especially when N fertilizer was applied near the recommended (MRTN) rate of 120 lb N/ac for corn after soybean. A blend of annual covers terminated in late fall reduced NO 3-N concentration and load compared to no cover during the corn year, but not nearly as much as cereal rye. Soil inorganic nitrogen
10 The effects of cover crops and N rates on soil NO 3-N at four soil depths are presented in Table 7a. For the fall 2016 sampling (21 Oct), soil NO 3-N was not significantly affected by treatment main effects at any depth. At the 0- to 6-inch depth NO 3-N ranged from 10.6 to 16.3 lb/ac among treatments and was numerically less with cereal rye (11.2 lb/ac) and blend (12.0 lb/ac) compared with no cover (14.5 lb/ac). For the spring 2017 sampling (17 Apr) soil NO 3-N was affected by cover crops at all depths. At 0- to 6-inch depth, soil NO 3-N was greatest with no cover, intermediate with blend and least with rye, when averaged across N rates for corn in 2017 (fertilizer N applied in May and Jun). At the 7- to 12-, 13- to 24-, and 25- to 36-inch depths, cereal rye had significantly less soil NO 3-N than no cover and blend. The 0- to 36-inch total soil NO 3-N was 51.2, 26.2, and 42.5 lb/ac for the no, rye, and blend cover crop treatments, respectively. These data showed cereal rye, which was terminated on 17 Apr in 2017, effectively sequestered soil N and thereby reduced the amount of NO 3-N that could be leached via tile drainage in the spring. Only one depth (7- to 12-inch) had significant differences among treatments for the fall 2017 sampling (26 Oct). Soil NO 3-N was less with no cover at 3 lb N/ac compared with rye and blend covers at 3 lb N/ac. Soil NO 3-N was greater in the fall of 2017 than in fall of 2016 and spring of 2017, which could affect NO 3-N losses in tile drainage in the spring of In spring of 2018, the main effect of cover crop did not affect soil NO 3-N at any depth, when averaged across N rates applied to corn in Soil NO 3-N was greater with 120 and 150 lb N/ac than with 3 lb N/ac (control) at all depths except the 0- to 6-inch depth, when averaged across the main effect of cover crop. There were no significant interactions between cover crops and N rate for corn. Soil NO 3-N in the spring of 2018 was considerably less (about half) than what was measured in the fall of This suggests residual soil N was lost from fall to spring or had leached below the soil sampling depth. It s unlikely this reduction was due to cover crop treatments because cover crops had no effect on spring 2018 soil NO 3-N. The effects of cover crops and N rates on total inorganic N (TIN) in soil at four soil depths are presented in Table 8a. For fall 2016 sampling, TIN was not significantly affected by treatment main effects at any depth and only small numeric differences were observed among cover crop treatments, when averaged across N rates. For spring 2017 sampling, soil TIN was affected by cover crops at the 0- to 6- and 7- to 12-inch depths. At 0- to 6-inch depth, TIN was greater with no cover than with blend and rye, when averaged across N rates. At the 7- to 12-inch depths, cereal rye had significantly less TIN than no cover and the blend. The 0- to 36-inch total for soil TIN was 78.3, 62.4, and 73.1 lb/ac for the none, rye, and blend cover crop treatments, respectively. Soil TIN was not affected by treatments at any depth for the fall 2017 sampling. In spring of 2018, treatment main effects did not affect TIN at the 0- to 6- and 7- to 12-inch depths. At the 13- to 24-inch depth, TIN was greater with 120 and 150 lb N/ac for 2017 corn than with the control (3 lb N/ac), when averaged across the main effect of cover crops. Similarly, at the 25- to 36-inch depth TIN was greater with 150 lb N/ac than with 3 and 120 lb N/ac. The general lack of consistent treatment effects on soil NO 3-N and TIN can be partly explained by poor cover crop growth, especially in fall of 2017 and spring of 2018, and by excessive rainfall in Sep of 2018.
11 Summary A research experiment initiated in 2016 continued in The objective of this research was to measure the effects of vegetative covers [e.g. winter hardy (cereal rye) and winter terminating (blend of annuals)] at various N rates on the following: 1) tile water flow, NO 3-N concentration, and NO 3-N loss in tile drainage water and 2) corn and soybean yields, nitrogen uptake and NUE. Cover crops seeded in September of 2016 reduced NO 3-N concentration, and NO 3-N loss in tile drainage water in 2017, especially with the cereal rye cover that was terminated in Apr before planting corn. The cereal rye also reduced NO 3-N concentration and flow-adjusted NO 3-N loss during the 2018 cropping season (soybean). Even though the cereal rye cover crop averaged only 234 and 46 lb/ac of biomass in 2017 and 2018, respectively, it reduced NO 3-N losses in tile drainage water in both years. In 2018 (soybean year), average FW NO 3-N concentrations and flow-adjusted NO 3-N losses increased as N rate for corn in 2017 increased. At the greatest N rate (150 lb N/ac) corn grain yields in 2017 were statistically the same among the three cover crop treatments; however, at the 2016 MRTN rate for corn following soybean (120 lb N/ac) grain yields were reduced compared with 150 lb N/ac for both the no cover and cereal rye treatments. Soybean yields were 2 to 3 bu/ac less with cover crops than without. This may be a result of cover crop treatments, plot traffic during cover crop seeding, or possible confounding from previous cropping history in a few plots. Outreach and Extension Activities This research information has been presented at several meetings: Ag Expo on 25 Jan 2017, the SROC Agronomy tour on 20 Jun 2017, MCR&PC research update in Shakopee on 7 Sep 2017, Ag Expo on 24 Jan 2018, Stearns Co. Farmers Fair 7 Mar 2019, and North American Farm and Power Show 14 Mar Acknowledgement This work was supported, in part, by the farm families of Minnesota and their corn check-off investment. The author greatly appreciates their support. The author also thanks co-investigators (Dr. Fabián Fernández, Dr. Scott Wells, and Dr. Daniel Kaiser) for their input and expertise and Kyle Holling for tile water monitoring and sample collection.
12 References Badger, S. D. E. Kaiser, and M. S. Wells Nitrogen Availability and Corn Production in Minnesota Following Cover Crops. ASA CSSA SSSA Annual Meeting. Oct Tampa, FL. Online: Dinnes, D.L., D.L. Karlen, D.B. Jaynes, T.C. Kaspar, J.L. Hatfield, T.S. Covlin and C.A. Cambardella Nitrogen management strategies to reduce nitrate leaching in tile-drained Midwestern Soils. Agron. J. 94: Randall, G.W., and D.J. Mulla Nitrate nitrogen in surface waters as influenced by climatic conditions and agricultural practices. J. Environ. Qual. 30: Snyder C.S., and T.W. Bruulsema IPNI Publ. No Norcross, GA., U.S.A. pp. 4.
13 Table 1. Monthly total precipitation, mean air temperature, and growing degree units (GDU, base 50/86) as compared to 30-year normal values at Waseca. Precipitation Mean Air Temp. GDUs Month Year Observed Normal Observed Normal Observed Normal inches ºF Jan Feb Mar Apr May Jun Jul Aug Sep Oct Nov Dec Apr-Sep Total Annual Total Jan Feb Mar Apr May Jun Jul Aug Sep Oct Nov Dec Apr-Sep Total Annual Total Jan Feb Mar Apr May Jun Jul Aug Sep Oct Nov Dec Apr-Sep Total Annual Total Yr normal,
14 Table 2. Soybean seed yield in 2016 (setup year) and 2018 as affected by cover crops and N rates applied for corn in Nitrogen rate for corn in 2017 Cover crop Mean yield, bu/ac None A Cereal rye B Annual blend B Mean: yield, bu/ac None A Cereal rye B Annual blend B Mean: Within each row or column uppercase letters indicate significance of main effects and lowercase letters indicate significant interaction of main effects at P<0.10.
15 Table 3a. Cover croop biomass yield, nutrient concentration, and uptake as affected by treatments. Treatments Cover Crop Biomass on 21 Oct Cover Crop Biomass on 17 Apr Trt Cover crop N rate Yield N conc. P conc. N uptake P uptake Yield N conc. P conc. N uptake P uptake # lb/ac lb/ac % lb/ac lb/ac % lb/ac Cereal rye ab 3.11 bc a Cereal rye ab 3.18 bc a Cereal rye a 2.94 c a Annual blend 3 77 c 3.40 b b Annual blend b 3.40 b a Annual blend c 3.83 a b 0.19 Stats for RCB Design with a two-factor factorial arrangement Cover crop Cereal rye 194 A 3.08 B A 0.77 A Annual blend 88 B 3.54 A B 0.39 B P > F: < < N rate for corn in B B 0.66 B B B 0.69 B A A 1.42 A P > F: Interaction (cover crop N rate) P > F:
16 Table 3b. Cover crop dry matter yield, nutrient concentration, and uptake as affected by treatments. Treatments Cover Crop Biomass on 1 Nov 2017 Cover Crop Biomass on 16 May 2018 Trt Cover crop N rate Yield N conc. P conc. N uptake P uptake Yield N conc. P conc. N uptake P uptake # lb/ac lb/ac % lb/ac lb/ac % lb/ac Cereal rye bc bc ab Cereal rye bc bc b Cereal rye a a a Annual blend ab ab a 8 Annual blend bc bc b 9 Annual blend c c b Stats for RCB Design with a two-factor factorial arrangement Cover crop Cereal rye Annual blend P > F: N rate for corn in B B A A A A P > F: Interaction (cover crop N rate) P > F:
17 Table 4. Corn dry matter yield and N uptake as affected by cover crops and N rates in Treatments V8 Corn Dry Matter Yield VT-R1 Corn Dry Matter Yield Trt Cover crop N rate Yield N conc. N uptake Yield N conc. N uptake # lb/ac lb/ac % lb/ac lb/ac % lb/ac 1 None c^ 1.11 d 63.3 d 2 None ab 1.40 c 93.8 c 3 None ab 1.58 ab ab 4 Cereal rye e 0.98 de 35.9 e 5 Cereal rye bc 1.51 bc 95.8 bc 6 Cereal rye ab 1.57 ab a 7 Annual blend d 0.95 e 42.9 e 8 Annual blend a 1.55 ab a 9 Annual blend ab 1.67 a a Statistical significance of treatment main effects for a two-factor factorial arrangement Cover crop No cover 1217 A A 6497 A Cereal rye 821 C C 5771 B Annual blend 1042 B B 6283 AB P > F: N rate for corn B 2.22 B 19.0 B 4623 B 1.01 C 47.4 C A 3.72 A 42.7 A 6827 A 1.49 B B A 3.76 A 40.7 A 7100 A 1.61 A A P > F: <0.001 <0.001 <0.001 <0.001 <0.001 Interaction (cover crop N rate) P > F: ^ Numbers followed by different letters are significantly different at α = 0.10 level. Capital letters signify differences in main effects and small letters are differences due to interaction between main effects.
18 Table 5. Corn production and nitrogen use efficiency parameters as affected by cover crops and N rates in Relative Relative Final Treatments Grain Grain Grain Cob Stover Silage Stover Grain Nitrogen uptake Leaf Plant NUE NUE Trt Cover crop N rate H 2 O Yield Yield Yield Yield Yield [N] [N] Stover Grain Total Chlor. Pop. PFP AE # lb/ac % bu/ac % tdm/a % % lb N/ac % pl*10 3 /ac bushel/lb N 1 None d^ 154 d 60.5 d 0.48 c 2.80 b 6.92 d d 87 e 72.7 c None cd 240 b 94.6 b 0.61 b 3.41 a 9.70 bc b 163 bc 99.0 ab None bc 254 a a 0.66 a 3.50 a a a 179 a 99.0 ab Cereal rye a 108 f 42.5 f 0.36 e 2.08 c 5.00 f e 60 f 67.1 d Cereal rye ab 226 c 89.1 c 0.62 b 3.45 a 9.43 c c 147 d 97.6 b Cereal rye bc 247 ab 97.2 ab 0.64 ab 3.35 a 9.84 ab ab 169 bc 98.7 ab Annual blend bc 120 e 47.1 e 0.41 d 2.16 c 5.40 e e 69 f 71.9 c Annual blend bc 244 b 95.9 b 0.64 ab 3.41 a 9.81 abc b 159 c 98.7 ab Annual blend bc 247 ab 97.3 ab 0.62 ab 3.35 a 9.83 ab ab 168 b a Statistical significance of treatment main effects for a two-factor factorial arrangement Cover crop No cover 18.0 B 216 A 85.0 A 0.58 A 3.24 A 8.93 A 0.42 A A 115 A 143 A 90.2 A Cereal rye 18.9 A 194 C 76.3 C 0.54 B 2.96 B 8.09 B 0.37 B B 102 B 125 B 87.8 B Annual blend 18.5 A 203 B 80.1 B 0.56 AB 2.98 B 8.35 B 0.38 B B 109 AB 132 B 90.2 A P > F: N rate for corn C 50.1 C 0.42 B 2.35 B 5.77 C 0.29 C 0.97 C 13.7 C 58 C 72 C 70.6 B B 93.2 B 0.62 A 3.42 A 9.64 B 0.41 B 1.14 B 28.2 B 128 B 156 B 98.4 A A 98.2 A 0.64 A 3.40 A 9.94 A 0.47 A 1.19 A 32.1 A 140 A 172 A 99.2 A P > F: <0.001 <0.001 <0.001 <0.001 <0.001 <0.001 <0.001 <0.001 <0.001 <0.001 < Interaction (cover crop N rate) P > F: <0.001 < <0.001 < ^ Numbers followed by different letters are significantly different at α = 0.10 level. Capital letters signify differences in main effects and small letters are differences due to interaction between main effects.
19 Table 6a. Tile flow, flow-wieghted NO 3 -N concentration, NO 3 -N loss, and flow-adjusted loss as affected by treatments in Cover N application Tile flow Flow-weighted NO 3 -N NO 3 -N lost Flow adj. Trt Crop Planting V4 Pre Post Total Pre Post Average Pre Post Total NO 3 loss # ---- lb/ac inch mg/l lb/ac lb/inch 1 None None None Rye Rye Rye Blend Blend Blend Stats for RCB Design with a two-factor factorial arrangement Cover crop No cover A 9.1 A 8.8 A A A Cereal rye C 2.5 C 2.6 C B C Annual blend B 7.1 B 6.8 B AB B P > F: <0.001 < <0.001 N rate for corn P > F: Interaction (cover crop N rate) P > F: Pre N applicatoin period (Feb - 7 May), Post (8 May - Nov). Numbers followed by different letters are significantly different at α = 0.10 level. Capital letters signify differences in main effects and small letters are differences due to interaction between main effects.
20 Table 6b. Tile flow, flow-wieghted NO 3 -N concentration, NO 3 -N loss, and flow-adjusted loss during 3-month periods as affected by treatments in Cover N application Tile flow Flow-weighted NO 3 -N NO 3 -N lost Flow adj. Trt Crop Planting V4 M-M J-A S-N Total M-M J-A S-N Avg. M-M J-A S-N Total NO 3 loss # ---- lb/ac inch mg/l lb/ac lb/inch 1 None e 1.2 d 1.4 b 1.6 d 1.0 c 0.3 d 1.7 d 3.1 d 0.35 d 2 None ab 5.4 a 3.1 a 3.9 ab 3.0 a 2.3 ab 5.1 a 11.1 a 0.88 ab 3 None a 6.5 a 3.4 a 4.4 a 3.4 a 2.3 ab 4.9 a 11.1 a 1.00 a 4 Rye d 1.7 c 1.5 b 1.9 cd 2.6 a 1.0 bc 2.8 bc 6.5 bc 0.43 cd 5 Rye de 2.8 b 1.7 b 2.1 c 2.2 ab 1.3 abc 3.0 bc 6.8 bc 0.48 c 6 Rye bc 4.8 a 2.8 a 3.4 b 3.7 a 2.6 a 4.9 a 11.4 a 0.78 b 7 Blend cd 2.3 bc 1.8 b 2.1 c 1.5 bc 0.8 c 2.6 c 5.2 c 0.48 c 8 Blend ab 4.8 a 2.7 a 3.6 ab 3.2 a 2.1 ab 4.1 ab 9.7 ab 0.81 ab 9 Blend ab 5.2 a 2.5 a 3.4 b 2.8 a 1.9 ab 3.6 abc 8.5 ab 0.77 b Stats for RCB Design with a two-factor factorial arrangement Cover crop No cover 2.7 B B 10.8 B 3.6 A 3.4 AB A A Cereal rye 4.2 A A 14.6 A 2.9 B 2.9 B B B Annual blend 2.8 B B 11.2 B 3.8 A 3.9 A A A P > F: N rate for corn B 1.7 C 1.6 B 1.9 C 1.6 B 0.6 B 2.3 B 4.7 B 0.42 C A 4.2 B 2.4 A 3.1 B 2.8 A 1.9 A 4.0 A 9.0 A 0.70 B A 5.4 A 2.9 A 3.7 A 3.3 A 2.2 A 4.4 A 10.3 A 0.84 A P > F: < Interaction (cover crop N rate) P > F: Three-month preiods M-M (Mar - May), J-A (Jun - Aug), S-N (Sep - Nov), no measured flow during winter period (Dec - Feb). Numbers followed by different letters are significantly different at α = 0.10 level. Capital letters signify differences in main effects and small letters are differences due to interaction between main effects.
21 Table 7a. Soil nitrate-n by depth as affected by cover crop species, nitrogen rate for corn, and sampling date. Fall 2016 Spring 2017 Fall 2017 Spring Mean Mean Mean Mean NO 3 -N, lb/ac to 6-inch depth Cover crop None A Cereal rye C Blend B Mean: to 12-inch depth None A 10.0b 16.0a 19.0a Cereal rye B 16.9a 17.9a 13.9ab Blend A 15.6a 16.8a 14.9ab Mean: B 7.8A 7.6A 13- to 24-inch depth None A Cereal rye B Blend A Mean: B 12.6A 14.1A 25- to 36-inch depth None A Cereal rye B Blend A Mean: C 7.4B 10.9A Nitrogen fertilizer rate for corn in 2017, lb N/ac. Numbers followed by different letters are significantly different at α=0.10 level. Capital letters signify differences in main effects and small letters are differences due to interaction between main effects.
22 Table 8a. Soil total inorganic-n by depth as affected by cover crop species, nitrogen rate for corn, and sampling date. Fall 2016 Spring 2017 Fall 2017 Spring Mean Mean Mean Mean Total inorganic-n, lb/ac to 6-inch depth Cover crop None A Cereal rye B Blend AB Mean: to 12-inch depth None A Cereal rye B Blend A Mean: to 24-inch depth None Cereal rye Blend Mean: B 23.9A 25.5A 25- to 36-inch depth None Cereal rye Blend Mean: B 19.4B 23.8A Nitrogen fertilizer rate for corn in 2017, lb N/ac. Numbers followed by different letters are significantly different at α=0.10 level. Capital letters signify differences in main effects and small letters are differences due to interaction between main effects.
23 Daily precipitation, inch Precipitation Drainage Cumulative tile drainage, inch 5 Jan Feb Mar Apr May Jun Jul Aug Sep Oct Nov Dec 0 Figure 1. Daily precipitation and cumulative tile drainage in 2016.
24 12 10 Cover crop seeded on September 2 Mean Nitrate-N, mg/l No cover crop Cereal rye Annual blend 0 Jun Jul Aug Sep Figure 2. Nitrate-N concentration in tile drainage as affected by cover crop treatments in 2016 (setup year).
25 0 10 Daily precipitation, inch Precipitation Drainage Cumulative tile drainage, inch 5 Feb Mar Apr May Jun Jul Aug Sep Oct Nov 0 Figure 3. Daily precipitation and cumulative tile drainage in 2017.
26 Daily precipitation, inch Precipitation Drainage Cumulative tile drainage, inch 5 Feb Mar Apr May Jun Jul Aug Sep Oct Nov 0 Figure 4. Daily precipitation and cumulative tile drainage in 2018.
27 Appendix Tables Appendix Table 1. Yield, nutrient concentration, and nurtrient removal in soybean seed in 2018 as affected by cover crops and nitrogen rates for corn. Soybean seed Treatments Seed Concentration Nutrient removal Trt Cover crop N rate (corn) H 2 O Yield N P K N P K # % bu/ac % lb/ac None a a None ab ab None bcd abc Cereal rye d d Cereal rye bcd cd Cereal rye bcd a Annual blend bc abc Annual blend bcd bcd Annual blend cd abcd Stats for RCB Design with a two-factor factorial arrangement Cover crop None 10.8 A 64.2 A A A 60.6 A Cereal rye 10.4 B 61.0 B B B 57.0 B Annual blend 10.5 B 62.1 B AB B 57.3 B P > F: N rate for corn in B B A P > F: Interaction (cover crop N rate) P > F:
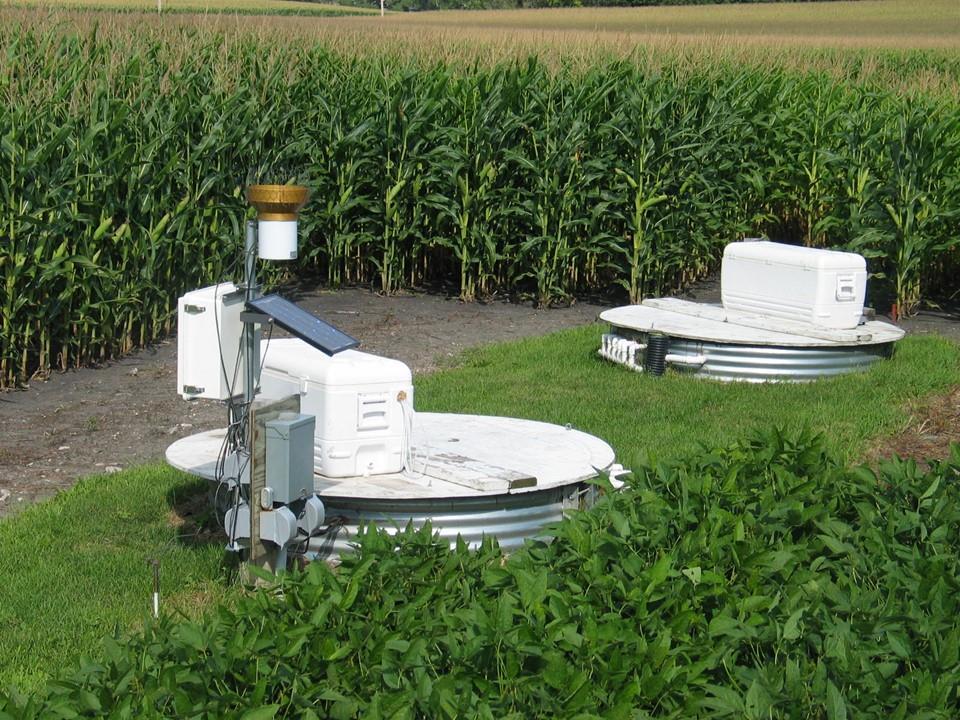
28 Appendix Pictures Pic. 1. Schematic diagram of tile drainage system. Pic. 2. Tile drainage well access culvert, data logger, and coolers for holding water sample collection bottles. Pic. 3. Plumbing inside culvert: sump well, pump, and water meters. Pic. 4. Strip tillage on 24 October 2016, injecting P and K fertilizer at time of tillage. Pic. 5. Spraying cereal rye with glyphosate on 17 April 2017 to terminate it prior to planting corn. Pic. 6. Planting corn into strip-till bands on 7 May Applying liquid starter fertilizer ( and UAN) at planting. Pic. 7. Nitrogen deficiency on lower leaves at R5 (6 September) with 120 lb N/ac and cereal rye cover crop. Pic. 8. Planting soybean into strip tilled bands and cereal rye cover on 17 May Pic. 9. Very little cereal rye growth on 1 November 2018.

29
30

31

32

33

34

35

36

37