Australian Farm Institute. Further development of the FarmGAS Calculator - an online tool assisting farmers
|
|
|
- Eric Phelps
- 5 years ago
- Views:
Transcription

1 final report Project Code: Prepared by: B.CCH.1043 Sally Davison Australian Farm Institute Date published: May 2012 PUBLISHED BY Meat and Livestock Australia Limited Locked Bag 991 NORTH SYDNEY NSW 2059 Further development of the FarmGAS Calculator - an online tool assisting farmers Meat & Livestock Australia acknowledges the matching funds provided by the Australian Government to support the research and development detailed in this publication. This publication is published by Meat & Livestock Australia Limited ABN (MLA). Care is taken to ensure the accuracy of the information contained in this publication. However MLA cannot accept responsibility for the accuracy or completeness of the information or opinions contained in the publication. You should make your own enquiries before making decisions concerning your interests. Reproduction in whole or in part of this publication is prohibited without prior written consent of MLA.

2 Milestone report MLA project code: B.CCH.1043 MLA project title: Further development of the FarmGAS Calculator - an online tool assisting farmers Project leader: Sally Davison, Australian Farm Institute MLA project manager/coordinator: Julian Hill, Ternes Agricultural Consulting Pty Ltd Milestone number: 6 Milestone Complete a final written report outlining the enhancements to FarmGAS, how to use them and detail the case studies. Project objectives To update and expand the FarmGAS Calculator to include greenhouse gas abatement activities and carbon sequestration based on relevant research, investigating the economic and emission implications of adopting mitigation practices. Success in achieving milestone The enhancements to the FarmGAS Scenario Tool are outlined in the report contained in Appendix 1, entitled FarmGAS Scenario Tool Enhancements, uses and future research needs. The design, calculations and application of the FarmGAS Calculator have been updated with the new Scenario Tool, and ongoing maintenance of the tool has also been improved. The report appended contains details of all the enhancements to the calculator, particularly regarding changes the user can make to estimation of greenhouse gas emissions from onfarm activities. During the process of completing case studies and testing the function of the Scenario Tool, many interesting aspects of the equations used to estimate greenhouse gas emissions from agriculture were found. For instance, the methodology for the estimation of agriculture emissions, and therefore the Scenario Tool, does not contain the necessary equation which
3 clearly defines that an X% increase in one factor will require an X% increase in another factor. This and other interesting features have been outlined in Appendix 1, including the affect they have on estimated emissions. Investigating how changes in emission factors or production factors affect emissions, lead the researchers to consider what future research needs exist in order to more accurately estimate emissions from agriculture, and the potential impact of mitigation activities on emissions. As an example, to make the Scenario Tool more realistic and more accurate, research into the relationships between factors is required. Further research may also increase knowledge and information about these factors on a region or local area basis. There is capacity to further improve the FarmGAS Scenario Tool, but in order to do so; research into various aspects of agriculture emissions and emission factors is required. Overall progress of the project The final Scenario Tool is being developed in its online format, and this stage of the project is 95% complete. The overall progress of the project has been delayed due to discovery of bugs in the original Excel model, which have needed correction. In addition, four change requests have been submitted, each relating to functional or maintenance features of the Scenario Tool. For example, the data generated from the National Carbon Accounting Toolbox (NCAT) estimating carbon sequestration for different tree species according to region, is now able to be edited by AFI staff. This means that if the NCAT is updated in future, the Scenario Tool will be able to be changed to include the updated data and ensure its ongoing accuracy. While essential to the function and accuracy of the Scenario Tool, these changes impacted heavily on the Excel model s design and the time required for online conversion. A full outline of the technical development is contained in Appendix 2 below. It is envisaged a final online version of the Scenario Tool will be provided to the Technical Committee for review by 1 April The case studies provided to MLA as part of the report for Milestone 5 will be updated to include screen shots of the final online calculator, once it has been approved. The case study report will then be formatted to a publishable format, and a step-by-step guide for the use of the Scenario Tool included. This publication relies on screen shots of the final online calculator, to ensure it is clear and easy to understand for a first-time user. As such, the online version of the tool must be finalized before this report can be completed. Once completed, these publications will be available online with the Scenario Tool. Depending on the complexity of the feedback and comments from the Committee, and the time required for amendment, the online FarmGAS Scenario Tool could be launched by 2 May However, the project plan contained in Appendix 3 provides further detail on this scheduled delivery.
4 Recommendations The final technical specifications have been provided by Sitback Solutions, as outlined in Appendix 2. The case studies and user guide have been completed in the Excel format. The final steps in the conclusion of this project are the delivery of the final online Scenario Tool, completion of the online case study and user guide report, and approval from the Technical Committee. Appendices Appendix 1. FarmGAS Scenario Tool Enhancements, uses and future research needs Appendix 2. Technical Specification submitted by Sitback Solutions March Appendix 3. Project plan submitted by Sitback Solutions March 2011.
5 Appendix 1. FarmGAS Scenario Tool Enhancements, uses and future research needs
6 FarmGAS Scenario Tool Enhancements, uses and future research needs Report to Meat & Livestock Australia March 2011
7 Table of Contents 1. Introduction Enhancements Overview Structure of the FarmGAS Scenario Tool Additional features of the FarmGAS Scenario Tool Options to revise production factors Options to revise emission factors Amendments to maintenance characteristics NGGI Compliance Potential uses for the Scenario Tool Impact of revised production or emission factors Future research needs... 19
8 1. Introduction The FarmGAS Calculator was developed in 2008 and released for public use in 2009, with over 1,100 people registering to use it in the 18 month period it has been available. The calculator utilizes the greenhouse emission calculation methodologies and factors detailed in the Australian Methodology for the Estimation of Greenhouse Gas Emissions and Sinks 2006 Agriculture published by the National Greenhouse Gas Inventory Committee. It is important to raise farmers awareness and understanding of issues associated with climate change adaptation and mitigation, and encourage consideration of greenhouse-efficient management practices. An online tool such as FarmGAS is able to be manipulated according to individual farm data,and can provide farmers with practical information relevant to their own enterprise. Since the Calculator was developed, understanding of methane and nitrous oxide emission abatement in agricultural systems has progressed significantly, facilitated by investment by the Department of Agriculture, Fisheries and Forestry Climate Change Research Program and investment by industry including Meat & Livestock Australia. At the same time, policy debate in Australia has evolved significantly and alternative emission reduction models have been gaining increasing interest. The prime focus of this project is the development of a new online calculator that expands and improves the original FarmGAS Calculator, enabling farmers to incorporate options for livestock emissions abatement based on the outputs of the Reducing Emissions from Livestock Research Program. However, with mixed production making up more than 80% of all farm enterprises it is important that the tool is relevant to demonstrating the impact of new research on mitigation options across commodity mixes, to increase farmers awareness of alternative management systems and enable them to consider the economic and emissions implications of these options. The new calculator, called the FarmGAS Scenario Tool is an expanded, improved version of the original calculator. Case studies have been developed to test the Scenario Tool as is has been developed, and will also be used to demonstrate how the Scenario Tool works. The following report details how the calculator has been enhanced from a user s perspective and for ongoing 1
9 maintenance, and what the Scenario Tool and associated case studies have highlighted in terms of the NGGI methodology and future research needs. 2. Enhancements 2.1. Overview The FarmGAS Calculator is a free online calculator which can be used to estimate greenhouse gas (GHG) emissions resulting from farm enterprise activities, both at the individual enterprise activity level and for the farm as a whole, and to examine the financial impacts that different greenhouse mitigation options may have on farm business profitability. The FarmGAS Calculator was developed in 2009 by the Australian Farm Institute using funding provided under the National Heritage Trust, administered by the Department of Agriculture, Fisheries and Forestry through the National Agriculture and Climate Change Action Plan: Implementation Program. An updated and expanded version of the Calculator, the FarmGAS Scenario Tool will be launched in The new Scenario Tool extends the capabilities of the Calculator through the provision of additional enterprise options, reporting features and the ability to alter relevant emission factors. Calculations of farm-related emissions in FarmGAS Scenario Tool are based on the methodology used by the Department of Climate Change in determining Australia s National GHG Inventory (NGGI). The Scenario Tool enables two estimates (two sets of results) to be produced, one set of Default emissions which utilise the production factors assumed in NGGI Methodology (2006), and the other producing Revised emissions based on choices and inputs from the User. The results of the two sets of calculations (Default and Revised) are summarised in individual enterprise and whole-farm reports. In addition to using the NGGI production and emission factors to calculate the default farm GHG emissions, the FarmGAS Scenario Tool provides the User with the option of entering User-defined factors. The results of the GHG calculations both NGGI-based and User defined are provided on an individual enterprise and whole farm basis. The following sections outline the structure of the FarmGAS Scenario Tool; how the Tool should interact with the user (and vice-versa); the associated uses of the Tool; and potential options for future research in the field of agriculture GHG emission estimation. 2
10 2.2. Structure of the FarmGAS Scenario Tool The individual enterprises included in the FarmGAS Scenario Tool are: Beef Cattle Breeding Beef Cattle Stores Sheep Beef Feedlot Pigs (intensive) Cropping either dryland and/or irrigated Horticulture Pastures and Savanna Trees potential carbon sequestration For each of these enterprises, greenhouse gas emissions and financial analysis can be performed, using separate worksheets. This gives the user the option of investigating GHG emissions only, or investigating the financial impact of GHG emissions and mitigation options. The financial information for each individual enterprise is entered using a gross margin format, with additional areas where off-farm income and expenditure items that haven t been included in the individual enterprise worksheets can be entered. This will help provide a more complete whole-farm financial summary. When the user logs in to the Scenario Tool, they will have the option of creating a new farm, or selecting a saved scenario. This Set-Up page provides the range of enterprise options for the user to select and build their whole-farm profile. The individual enterprise calculators will typically comprise an area in which the user enters the key production information (i.e. number of livestock, categories of stock, wool production, crop yields). Beneath the production data area is a sequence of additional fields where the user may elect to enter revised production and GHG emission factors. If the user chooses not to change GHG factors, then they don t need to progress further than the first page of each enterprise s GHG worksheet; except to view their results. This is a much more streamlined process, with the aim of making the development of a whole-farm GHG profile much easier. 3
11 The ability to change GHG factors is a new enhanced feature of the Scenario Tool, and each of these options is outlined in greater detail below Additional features of the FarmGAS Scenario Tool The new version of FarmGAS contains a number of additional features, including: More precise data entry livestock production details can now be entered on a monthly basis. In the original FarmGAS production variables were entered on a yearly or seasonal basis; The ability to change feed composition, production factors, stubble management, manure management systems and related emission factors; Beef feedlot enterprises can be continuous and/or short-term ; More crops can be added (up to 15), including dryland and irrigated crops; More horticulture crops can be added (up to 15); Farm Trees up to 15 plots can be entered, and, in the regions where it is applicable, up to 6 tree species and 2 soil types may be selected for each plot; The ability to estimate GHG emissions from nitrogen applied to pastures and from nitrogenfixing (e.g. legume) pastures; and The ability to estimate GHG emissions from the burning of pastures and savanna. When a user logs into the Scenario Tool, they will have the option of creating a new farm, or selecting a saved scenario. When a saved scenario is loaded, the user can also: access the related enterprise gross margins worksheets; add new enterprise GHG and gross margin worksheets. For example, if the User has saved a scenario with only two enterprises (Beef-breeding and Sheep), then more enterprises can be added to the scenario and saved; and copy an existing farm to create a new scenario. This enables the user to make multiple copies of a farm and have different items in each, to investigate the GHG emission implications of different management decisions. For example, the scenarios might have the same farm details, but different state/territory locations. The way in which results are shown is different in the new Scenario Tool. Users will be able to view individual enterprise and whole-farm GHG emission results as a PDF publication, including graphical representation of emissions. In this case, emissions will be shown by source and by type. In addition, 4
12 users can choose to print their results to a csv file, providing a more detailed outline of the data entered and results obtained. This option will also give users the ability to import data to another program, such as a spreadsheet, for further analysis and reporting Options to revise production factors The NGGI equations rely on basic production data in order to estimation greenhouse gas emissions. For instance, the NGGI requires the number of livestock, the area of crops, the type of crop and the yield of the crop. Because the NGGI relates to a national inventory, state or regional averages are required for all the additional production factors that are used in the emission equations. An example is in the estimation of methane emissions from a beef breeding enterprise. The data required by the NGGI to complete the equation is simply the number of each category of cattle averaged over a 12 month period. The feed intake, liveweight, liveweight gain, composition of feed; are all fixed assumptions under the Methodology. These assumptions do change according to the State the farm is in and the season (Autumn, Winter, Spring, Summer), however, when complying strictly to the Methodology, it is impossible to differentiate between beef breeding enterprises in different regions of NSW. This is necessary when developing a national inventory, as there s no need to show differences between farms. However, for the estimation of an individual farm s emissions, these differences become very important. The FarmGAS Scenario Tool allows the User to change the assumptions used in the Methodology. For instance, the average liveweight of the different classes of cattle can be changed to better reflect their enterprise. It should be noted, however, that in changing these assumptions the GHG emission result won t be the same as what it would be under the NGGI. This is explained in more detail in Chapter 2 below. The key production factors which can be changed in the Scenario Tool include: Numbers of livestock in each class are entered on a monthly basis The monthly number of cows lactating and calves still on their mother can be entered (the weaning and lactation rate is a fixed assumption in the NGGI) Estimates of milk production and consumption for each season in the livestock calculators Average liveweight of each category of livestock in each season Average livewight gain of each category of livestock in each season 5
13 Additional feed intake to account for milk production in livestock Feed factors such as dry matter digestibility Feed factor of crude protein content Relative feed intake Gross energy intake (energy content of feed) Percentage of gross energy intake yielded as methane Fertiliser Nitrogen applied on crops and pastures Stubble management options, including burning, baling or grazing Manure management options in intensive livestock enterprises (including spreading manure on pastures) Quantities and composition of feed used in intensive livestock enterprises Manure quantities in intensive piggeries Selection of irrigated or dryland crop production including horticultural crops Nomination of tree species in carbon sequestration estimation through farm forestry For each of these factors, the user is asked if they would like to change the assumed data. This gives the user the option of making the emission estimation more specific to their enterprise, but it is not prescriptive. When online, the Scenario Tool will also provide the user with information on each of these factors, why they are important and how they will impact the estimated GHG emissions. The NGGI equations utilise production information, and also emission factors, to estimate GHG emissions. These emission factors can be drawn from research in Australian conditions, but alternatively if local research isn t available an international number can be used. These emission factors apply across enterprises, and the Scenario Tool gives users the option to change the assumed emission factors Options to revise emission factors There are several emission factors used in the GHG calculations which apply across more than one enterprise. These are listed in the Global Emission Factors worksheet, and can be changed by the user. However, a recommendation is made to Users that they should not alter these factors unless the user has a strong understanding of the impact of changing these emissions factors. 6
14 The specific emission factors which can be changed are: Manure Emission Factor used in the estimation of methane emissions for all rangeland livestock. Methane Conversion Factor - used in the estimation of methane emissions for intensive livestock (feedlot and piggeries). Feedlot Emission Potential for the estimation of methane emissions. FracGASM the amount of Nitrogen volatilised in each manure management system. Emission Factors relating to animals used in the calculation of direct nitrous oxide emissions from manure deposited on soils (rangeland livestock) and from manure applied to soils (intensive livestock). Emission Factors relating to crops and pastures used in the calculation of direct nitrous oxide emissions from the application of Nitrogen fertiliser. Emission Factors organic crops and pastures used in the direct nitrous oxide emissions calculations for organic fertiliser applied to crops and/or pastures. Atmospheric Deposition Emission Factor for the estimation of indirect nitrous oxide emissions. FracGASF the fraction of fertiliser that is volatilised, which contributes to indirect nitrous oxide emissions. FracWET fertiliser the fraction of fertiliser available for leaching and runoff, contributing to indirect nitrous oxide emissions. FracLEACH the fraction of fertiliser available for leaching and runoff that is lost, contributing to indirect nitrous oxide emissions. Emission Factors for leaching and runoff the emission factor applied to the nitrogen fertiliser lost from the system. FracWET livestock fraction of animal waste that is available for leaching and runoff, contributing to indirect nitrous oxide emissions. Emission Factors stubble burning used for the estimation of indirect nitrous oxide emissions. Emission Factors burning temperate pastures and savanna grassland - used for the estimation of indirect nitrous oxide emissions. Composition of biomass Carbon mass fraction, Nitrogen/Carbon ratios can both the changed. Fuel loads- used for the estimation of indirect nitrous oxide emissions. Burning efficiencies - used for the estimation of indirect nitrous oxide emissions. 7
15 As mentioned, changing these emission factors in the Global Emission Factors worksheet will affect all the enterprise calculators. Alternatively, users can change emission factors applied to specific enterprises, within the enterprise worksheet. In this case, the emission factor will only change calculations in the specific enterprise. It is important to note that changing emission factors in the individual enterprise or across the whole farm will yield a result that does not match what the NGGI would calculate. This is because the NGGI uses default emission factors, and by changing these, the user would be departing from the NGGI methodology. The purpose in allowing the User to change these factors is to give them the opportunity to investigate the impact of some of these emission factors on GHG estimates. In addition, this feature will be very useful for researchers, by allowing them to investigate how an emission factor might affect the farm-level estimation of GHGs Amendments to maintenance characteristics The original online FarmGAS Calculator was developed in such a way that the administrators of the calculator could not access equations, data, labels or publications available on the FarmGAS website. This was a significant limitation to the ongoing maintenance of the calculator. It meant there was a risk FarmGAS would become outdated or inaccurate if methodologies for the estimation of GHG emissions were changed. The new Scenario Tool is being developed in a system which AFI staff will be able to access in a quick, easy way. Publications, text, inline help and some data will be able to be edited. For instance, if the NGGI methodologies were updated with new default liveweight estimates for beef cattle, the default would be able to be changed by AFI staff, and when a user logged back into the Scenario Tool their results would be updated to include the new default. This means there is less chance of a user s results becoming outdated and inaccurate, they would not need to make any changes to their farm profile but the new default would be incorporated into their results. A specific enhancement which is worth noting is that of carbon sequestration data in the tree calculator. The estimated quantity of carbon sequestered in trees is derived from the National 8
16 Carbon Accounting Toolbox (NCAT). The NCAT data is gathered by running scenarios through the model and correlating it with the region, tree species and age of trees specified by the User in the Scenario Tool. If the NCAT is updated in future, and the estimation rates of carbon sequestration are changed, the FarmGAS Scenario Tool is in danger of becoming outdated. However, in the new maintenance system, AFI staff can access the trees data, and update or change whenever required. This means the Scenario Tool will be more likely to stay relevant, accurate and up to date over a long period of time. There will be a page of the Scenario Tool website dedicated to providing the User with additional information and resources. This may be links to other websites, research papers or information sheets. AFI staff will be able to add any new papers, websites or case studies to this page whenever required. 9
17 3. NGGI Compliance As previously explained, changing production or emission factors is a departure from the NGGI Methodology. This means that the GHG emission result a User receives from the Scenario Tool may not be compliant with the NGGI. The table below outlines which default calculations comply with the Methodology, and how the results may differ. Factors such as FracWET (the proportion of nitrogen in animal wastes which can leach), can have a significant impact on estimated emissions. Under the NGGI, the default value of FracWET is an estimate of the proportion of the region (state/territory) where nitrogen in wastes will leach and runoff in the soil. On a particular farm, the soil type and climatic conditions may increase or decrease the amount of nitrogen leaching. In the Scenario Tool, the default value for FracWET is assumed to be either 1.0 or zero, depending on the farm region selected. The ability to change the FracWET value, rather than a default percentage, deviates from the NGGI but better reflects the farm-level conditions. This also applies to all of the calculators where FracWET is a factor, such as the sheep calculator and manure management in the intensive livestock calculators. Similarly, in the crop enterprise calculations, factors such as FracWET and the fraction of the crop residue (stubble) which is burnt, do not use the NGGI default values. The NGGI default values are based on the proportion of the state or region which is estimated to burn stubble, whereas because the Scenario Tool is designed to reflect conditions at the farm level, the proportion of crops burnt can be selected by the User. Consequently, where selected default emission factors deviate from the NGGI, the default calculations and resulting GHG estimates will also deviate from those which operate under strict compliance with NGGI. In these cases, compliance with the NGGI defaults can be achieved by entering the NGGI default values in the revised factors. For example, in estimating emissions from a wheat crop in NSW, the NGGI default factor for the fraction of the crop burnt is 0.23 (23% of wheat stubble is estimated to be burnt in NSW). In the Scenario Tool, the default factor is set as zero. If the user wishes to strictly comply with the NGGI, they will need to enter the relevant NGGI factors. These options will be fully outlined in the user guide and also through inline help functions for the online version. Table 1 below outlines the compliance of the enterprise calculators with the NGGI methodology. 10
18 Table 1: Compliance of the enterprise calculators with the Methodology used in the estimation of agriculture emissions in the National Greenhouse Gas Inventory (NGGI). Enterprise Default calculations* Revised calculations Adjustments to calculations for NGGI compliance Beef - Breeding Do they comply with the NGGI? All compliant - except Milk production and consumption. Milk production/consumption is dependent upon appropriate seasonal numbers being entered by the User. Although the calculator uses the lactation % values in NGGI 2006 Table D.4 in the Default calcs, the monthly numbers of Heifer and Steer calves should reflect the proportions in Table D.4 for the relevant State/Territory (e.g. for NSW/ACT, the Heifer/Steer calf numbers should be at least 85% of the 2yr old cows). What modifications 'away' from the NGGI can be made? The User can select/deselect changes to: * Milk production/consumption (% of cows lactating and kgs daily milk produced/consumed) * Liveweight and Liveweight Gain * Dry Matter Digestibility of Feed Intake (%) * Crude Protein Content of feed intake * Additional Feed Intake for Milk Production The User can also make adjustments to: * Gross Energy Intake (default 18.4) * Intake relative to maintenance * % of Gross Energy Intake yielded as methane How can I make my results compliant with the NGGI? To ensure that the Default and Revised calculations match the NGGI methodology, the number of 'Cows 2yrs and older lactating' should be the same proportion (%) in each season as in the NGGI 2006 Table D.4. The number of hiefer and steer calves will need to be adjusted to match this. For example, in NSW/ACT simulation, 75% of the 2 year old cows should be entered in the classification 'Cows 2yr & older lactating' in Spring and Summer in order to reflect NGGI assumptions. Most of the production variables and emission factors can be revised 'globally' for all classes of animals in each of the four seasons - or 'individually', with revisions made to selected classes of animals in selected seasons. Other 'global' emission factors can be revised in the Emission Factors worksheet - such as the Manure Emission Factor, FracWET, FracGASM, FracLEACH, Atmospheric Deposition, Faecal & Urine and Leaching/Run-off emission factors. Beef - Stores All calculations comply with the NGGI User can select/deselect changes to: * Liveweight and Liveweight Gain * Dry Matter Digestibility of Feed Intake (%) * Crude Protein Content of feed intake The User can also make adjustments to: * Gross Energy Intake * Intake relative to maintenance * % of Gross Energy Intake yielded as methane To ensure that the Default and Revised calculations match the NGGI methodology, the User need only to select NOT to change the individual Emission Factors. Most of the production variables and emission factors can be revised 'globally' for all classes of animals in each of the four seasons - or 'individually', with revisions made to selected classes of animals in selected seasons. Other 'global' emission factors can be revised in the Emission Factors worksheet - such as the Manure Emission Factor, FracWET, FracGASM, FracLEACH, Atmospheric Deposition, Faecal & Urine and Leaching/Run-off emission factors. 11
19 Enterprise Default calculations* Revised calculations Adjustments to calculations for NGGI compliance Sheep Do they comply with the NGGI? All compliant - except for the portion of Breeding Ewes lactating and Lambs receiving milk. These production factors are dependent upon appropriate seasonal numbers being entered by the User. Although the calculator uses the 'Proportion of lambs receiving milk' and 'Lambing Rates' values in NGGI 2006 Table F.6 in the Default calcs, the monthly numbers in 'Breeding Ewes lactating (lamb at foot)' and 'Number of lambs on their mother' should reflect the proportions in Table F.6 for the relevant State/Territory. For example, for NSW/ACT, the 'Number of lambs on their mother' should be 40%, 10%, 20% and 30% in Spring, Summer, Autumn & Winter months, respectively. Breeding Ewes lactating should be 82% of the Breeding Ewes in each season. What modifications 'away' from the NGGI can be made? User can select/deselect changes to: * Milk Intake - by adjusting seasonal numbers of 'Breeding Ewes lactating' and 'Number of lambs on their mother' * Liveweight and Liveweight Gain * Dry Matter Digestibility of Feed Intake (%) * Feed Available (tonnes DM / ha) * Crude Protein Content of feed intake * Additional Feed Intake for Milk Production The User can also make adjustments to: * Feed Intake (Kgs DM /head /day) How can I make my results compliant with the NGGI? To ensure that the Default and Revised calculations match the NGGI methodology, the User need only to select NOT to change the individual Emission Factors. Wool Production - the NGGI values for Kgs/Day clean wool production is based on ABS average greasy wool production per head multiplied by the State clean yield percentage. These factors can be entered by the User and the values apply in both Default and Revised calculations. Feedlot All compliant - provided the User enters the NGGI default values for Average Liveweight, Average Daily Weight Gain, Daily Feed Intake and Dry Matter Digestibility of Feed. These values are shown in the FarmGAS Feedlot data entry worksheet and are based on the average number of days on feed. Also, the User needs to select "Solid Storage & Drylot" as the Manure Management System(s) (MMS) User can select/deselect changes to: * Liveweight and Liveweight Gain * Feed Intake * Dry matter Digestibility of Feed * Composition/proportions of feed components * Alternate Manure Management Systems * Spread Drylot manure on farm pastures and/or crops (on a proportional basis from each of two MMS). To ensure that the Default and Revised calculations match the NGGI methodology, the User should ensure that Average Liveweight, Average Daily Weight Gain, Feed Intake and DM digestibility of Feed match the NGGI default shown and select NOT to change the Feed factors and Manure Management Systems or the 'global' Emission Factors. 12
20 Enterprise Default calculations* Revised calculations Adjustments to calculations for NGGI compliance Pigs (intensive) Do they comply with the NGGI? All compliant - Default Feed and Manure factors have been calculated to match the NGGI-equivalent values. These values are shown in the FarmGAS Pigs data entry worksheet. The User may select from the range of NGGI Manure Management System(s) (MMS). What modifications 'away' from the NGGI can be made? User can select to change the Feed and Manure Quantities - for an expanded selection of Pig classes. That is, the NGGI is based on four classes of pigs. FarmGAS provides nine classes of pig (expanded from the 'Other Pigs' NGGI class) - including suckers, weaners, growers and finishers. How can I make my results compliant with the NGGI? The Piggery-relevant Emission Factors can be revised 'globally' - in the Emission Factors worksheet. These factors are: the Manure Conversion Factor, FracGASM - and if the option to spread manure on pastures/crops is selected, the Atmospheric Deposition factor, and FracWET and FracLEACH. Cropping Crop Residues - The 'Fraction (of crop area) Burnt' is assumed to be 0.0, rather than the fractions listed in Table L.1 (Crop and pasture attributes) of the 2006 NGGI. Fertiliser (Nitrogen) applied - the quantity of Nitrogen applied as fertiliser is entered by the User. The values in Table K.1 of the 2006 NGGI are not used. User can enter the relevant Fraction Burnt value (as per Tabel L.1 of the 2006 NGGI). The User can revise all of the crop Emission Factors and a number of Crop Attributes (crop residue ratio, fraction removed and fraction burnt). User can enter the relevant Fraction Burnt value (as per Tabel L.1 of the 2006 NGGI). This will result in the Default and Revised emissions calculations aligning with the NGGI. The Crop-relevant emission factors can be revised "globally", or on an individual crop basis. These factors include the Nitrous Oxide emissions from Nitrogen fertiliser application and crop residues (including legumes), Atmospheric Deposition, FracGASF, FracWET and FracLEACH. The User can also modify the quantities of crop Residues and amounts of Residues removed including by burning of the stubble. Horticultural crops Fully compliant. Emissions are dependent on the quantity of Nitrogen applied in fertiliser. The User can revise most of the Emission Factors relating to Nitrogen Fertiliser application. The Nitrous Oxide factor from Nitrogen Fertiliser can be modified for each crop and relevant emission factors can be revised "globally". These factors include the Nitrous Oxide emissions from Atmospheric Deposition, FracGASF, FracWET and FracLEACH. 13
21 Enterprise Default calculations* Revised calculations Adjustments to calculations for NGGI compliance Pastures Do they comply with the NGGI? Compliant. The User can include estimates of pasture residues not removed by grazing, baling and/or burning. What modifications 'away' from the NGGI can be made? The User can include estimates of N-Fixing pasture residues not removed by grazing, baling and/or burning. How can I make my results compliant with the NGGI? If emissions from N-Fixing pastures are to be included in the calculation, the User can enter the area of N-Fixing (legume) pastures and % legume, then an estimate of the quantity (tonnes DM / year) of residues from these pastures. Savanna Compliant. User enters areas of Savanna Grasslands and Woodland, and areas Burnt each year. Pasture areas, % legume in pastures, % of pastures burnt and quantity of Nitrogen applied (fertiliser) can be entered by the User. User can revise the Emission Factors relating to pastures - including Nitrous Oxide EF (N-Fixing crops/pastures, N-Fertiliser), FracWET, FracLEACH, 'other gases' emissions from burning, Biomass/Fuel Loads and burning efficiencies. Areas and % Burnt can be entered by the User. May require DCCEE advice on the Inventory quantities (or % of State / Territory) relating to areas burnt. The User can revise the Emission Factors relating to Savanna including 'other gases' emissions from burning, Bio-mass/Fuel Loads and burning efficiencies. Trees Compliant to the extent that Tree Carbon growth = annual amounts derived from NCAT simulations. User cannot adjust data. User cannot adjust data. * For all livestock and cropping enterprises the FracWET default value is either 1.0 or 0.0, depending on the Region (location) selected on FarmGAS entry screen. That is, the FracWET emission factor is used like a switch - it either occurs or it doesn't. The NGGI applies a percentage because it's estimating the area of a State where this occurs. However, the User can change the FracWET value using the global emission factors worksheet. 14
22 4. Potential uses for the Scenario Tool The Australian Government made an election commitment in August, 2010, to implement a Carbon Farming Initiative (CFI), which would provide farmers and other landholders with the opportunity to participate in carbon markets and to generate revenue from the sale of offset units earned by undertaking recognised greenhouse gas sequestration or mitigation activities on farms. The aim will be to create a scheme which recognises and rewards farmers and other landholders for taking actions that are considered to reduce the net amount of greenhouse gases produced in Australia. This can be achieved either by actions that sequester greenhouse gases (i.e. remove greenhouse gases from the atmosphere through processes such as photosynthesis that convert CO 2 to non-gaseous carbon compounds such as wood) or mitigation (i.e. actions which reduce the normal amount of emissions associated with a particular activity such as a process that reduces CO 2 emissions from a coal-burning power station). The CFI consultation paper identifies a range of activities in livestock, crop and forestry production where the opportunity exists for farmers to take action that will either sequester greenhouse from the atmosphere (forestry development) or will mitigate the amount of greenhouse gases that would normally be produced (livestock and crop production and land management). The CFI consultation paper identifies a range of activities that it is anticipated will be the subject of accredited methodologies that will be able to be implemented by farmers to earn CFI offset credits. An example of a practical use for the FarmGAS Scenario tool is in the investigation of the change in GHG emissions at the farm level, as a result of a mitigation activity. This may help a farmer in deciding whether or not to participate in the CFI. For most of the activities identified in the consultation paper as potentially being able to generate offsets, there is a way to investigate it using the Scenario Tool. The table below outlines how a user could test each CFI offset option using the FarmGAS Scenario Tool. 15
23 Table 2: How to investigate Carbon Farming Initiative options using the FarmGAS Scenario Tool. CFI potential option How to implement in Scenario Tool Individual calculators this applies to Reforestation Estimated carbon sequestration for the trees calculator generated from NCAT. It can be estimated by different plots, but sequestration rates will depend on the state and region entered by the user when setting up the farm Trees Option 1: A straight 'fudge' factor can be applied once the livestock enterprise has been set up. This fudge factor is a percentage of methane or nitrous oxide emissions, and does not depend on, or affect, other factors such as feed composition or liveweight gain. Beef breeding, Beef stores, Feedlot, Sheep, Pigs Reduced methane emissions from livestock Option 2: Feed factors can be changed to reflect higher quality feed. For instance, DMD and CPC could be increased to reflect better pastures and grain supplements. However, this may impact on the liveweight gain of the animals, the time at which they're turned off, and subsequently the number of stock on hand throughout the year. These items are not linked in the Scenario Tool, which means that if DMD and CPC are increased, the user will need to estimate changes in other production factors. Option 3: If breeding is the means by which methane emissions have been reduced, and assuming it's because the animals are more efficient at converting feed, gross intake yielded as methane can be adjusted. Alternatively intake relative to maintenance could be changed. Again, the impact this has on other production factors will need to be considered. Option 4: Increase growth rates while keeping feed intake the same. This is similar to Option 3, but can only be directly manipulated in the intensive livestock calculators. Again, the impact this will have on other production factors needs to be considered. Beef breeding, Beef stores, Sheep, Feedlot and Pigs Beef breeding, Beef stores Feedlot and pigs Reduced emissions from fertiliser Manure management Burning of crop stubble (savanna also) Option 1: Change the global emission factors that impact on direct nitrous oxide emissions from fertiliser, and indirect nitrous oxide emissions through altering FracWET, FracGASF or FracLEACH. Once these are changed in the global emissions factors sheet, they will apply across all calculators, including pastures. Pastures, crops, horticulture Option 2: Change the emission factors that impact on nitrous oxide emissions from fertiliser and indirext emission factors by the individual crops rather than applying globally across all crops. Crops, horticulture Option 3: There are default nitrogen fertilier application rates assumed for crop types. The Scenario Tool allows the user to provide data on nitrogen fertiliser application, rather than taking national defaults. Crops, horticulture Option 1: the manure management system can be changed from the default (in feedlots the default is solid storage and drylot). Feedlot and pigs Option 2: emission factors relating to methane and nitrous oxide emissions can be changed for individual manure management systems in the global emission factors sheet. Feedlot and pigs Option 1: change the % of crop assumed to be burnt for the individual crops. Defaults are generally applied according to crop type. Crops Option 2: Change the emission factors that apply to stubble and pasture burning in the global emissions sheet (burning of savannas can be analysed - ability to alter biomass, fuel load or burning efficiency) Crops, pastures 16
24 5. Impact of revised production or emission factors Estimates of GHG emissions can be affected, to varying degrees, by changes in key production and emission factors. For example, in pasture-fed beef cattle, increasing animals liveweight above the default value results in a similar (but proportionally smaller) increase in both methane and nitrous oxide emissions. That is, a 10% increase in liveweight results in around 7% increase in emissions. Increasing the dry matter digestibility of feed to reflect improved pasture, results in a slight reduction in emissions. That is, a 10% increase in dry matter digestibility results in approximately 0.2% reduction in emissions. There are many instances of this, but one example of the how changes to production and emission factors affect the GHG emissions in a beef breeding enterprise are outlined in Table 3. 17
25 Table 3: Effect on GHG emissions changes to emission and production factors Methane calculations (enteric & wastes) Production / Emission Factor Does not apply in (regions): How revised values are entered Revised values (increase/decrease) Effect on GHG estimate - Methane W Liveweight Direct entry by the User Increase LWG Liveweight Gain Direct entry by the User Increase Methane increases with increased weight - up to 873 kgs, after which methane production declines. Methane increases - small positive relationship. Negative values (weight loss) can also be entered. DMD Dry Matter Digestibility of Feed Direct entry by the User Increase Methane increases - small positive relationship. LC Proportion of Cows lactating Values calculated from monthly number of cows lactating entered by the User Increase Increased feed intake results in increased Methane. FA Feed adjustment Direct entry by the User Increase Slight increase in Methane. GEI Gross energy intake (content) Warm regions Default value of 18.4 can be changed by User Increase Increased Methane - as it is the quantity of energy in feed dry matter. L Intake relative to maintenance Warm regions Initial values are calculated based on production variables. User can review the calculated values and amend them. Increase Increased Methane resulting from surplus energy. GEI Per cent of gross energy methane that converts to methane yield % Warm regions Initial values are calculated based on production variables. User can review the calculated values and amend them. Increase Increased Methane - it is a direct ratio. MEF Methane Emission Factor Direct entry by the User - in the 'Emission Factors' (global) worksheet Increase Directly related - emission factor is the ratio of Methane to kgs of manure. Affects Methane from wastes. Nitrous Oxide calculations (wastes) Production / Emission Factor Does not apply in (regions): How revised values are entered Revised values (increase/decrease) Effect on GHG estimate - Nitrous Oxide W Liveweight Direct entry by the User Increase Nitrous Oxide decreases in a similar proportion (%). LWG Liveweight Gain Direct entry by the User Increase Nitrous Oxide decreases by a small amount (lower comparative %) as increased quantity of N is retained in the animals body. DMD Dry Matter Digestibility of Feed Direct entry by the User Increase Nitrous Oxide decreases. CP Crude Protein content in feed Nitrous Oxide increases (by around the same magnitude (%)). LC Proportion of Cows lactating Values calculated from monthly number of cows lactating entered by the User Increase Total emissions increase due to the increased quantity of additional feed consumed. FA Feed adjustment Direct entry by the User Increase Total emissions increase due to the increased quantity of additional feed consumed. Milk produced (breeding MP & MC cows) & Milk consumed (by calves) L Intake relative to maintenance Direct entry by the User Increase Nitrous Oxide decreases by a small amount. Initial values are calculated based on production variables. User can review the calculated values and amend them. Nitrous Oxide increases by a very small amount (around one-tenth of the % change). EF Emission Factors Direct entry by the User - in the 'Emission Factors' (global) worksheet Increase Nitrous Oxide emissions will increase as the quantities of N in the waste are multiplied by the factors. FracWET Direct entry by the User - in the 'Emission Factors' (global) worksheet Increase Nitrous Oxide will increase - FracWET is the fraction of N available for leaching & runoff. FracLEACH Direct entry by the User - in the 'Emission Factors' (global) worksheet Increase Nitrous Oxide will increase - FracLEACH is the fraction of N in wastes which will leach & runoff. 18
26 6. Future research needs Completing case studies of different farm production systems provided information on what equations or emission factors are not realistic, or provide disproportional GHG emission estimations. Some examples of these oddities in the NGGI Methodology are outlined below, for the purpose of contributing to discussion of future research needs for Australian agriculture. The FarmGAS Scenario Tool conforms closely to the NGGI, while allowing the user to revise many of the underlying production and emission factors. Although the user can change the factors, in many cases these factors are not empirically related. That is, the calculator does not assume that a change in one factor will flow-on to another. The factors are not interrelated and this can result in unrealistic modelling of the enterprise and subsequent GHG estimates. For example, the user may revise the values for dry matter digestibility, crude protein content in feed in the beef cattle enterprise. But the calculations are not empirically related and the values entered by the user may not properly reflect how these values interact in the real world. If cattle are fed more, high-quality feed, in the real world there would be a demonstrated increase in liveweight gain and the average liveweight of the animal, plus the farmer would not need to keep the animals on feed for as long. The Scenario Tool does not carry out changes in related factors automatically, but rather relies on the user being able to identify that an increase in the quality and amount of feed will increase liveweight gain. Currently, the NGGI methodology (and the Scenario Tool) does not contain the necessary equation which clearly defines that an X% increase in one factor will require an X% increase in another factor. To make the Scenario Tool more realistic and more accurate, research into the relationships between factors is required. Further research may also increase knowledge and information about these factors on a region or local area basis. Additional research may also provide better information on the extent to which particular pastures and feed additives affect energy content and methane yield, which may have a considerable impact on the level of methane emissions from livestock. Stubble burning as a crop residue management option attracts very interesting emission estimation equations, and emission factors. Methane and nitrous oxide emissions from residue burning have emission factors based on Australia-specific conditions. These emission factors are and for methane and nitrous oxide, respectively (Equation 4F_2 of the NGGI 2006 Methodology). 19
27 However, the emission factor for crop residues attracts an international default emission factor of As such, GHG emissions appear proportionally higher because one emission factor is not related to local conditions, while the others are. Further research could develop an emission factor for crop residue that is suited to Australian conditions, which would allow GHG emissions to be compared between residue decomposition and stubble burning, without distortion. Similarly, the emission factor applied to nitrogen-fixing legumes and pastures is based on the international default value of (Equation 4D1_5 in the NGGI 2006 Methodology). In comparison, the emission factors applied to emissions from synthetic nitrogen fertiliser application are specific to Australian conditions, and for dryland crops and pastures they are and respectively. It is clear the emission factor for nitrogen-fixing legumes and pastures is three and fourfold higher than that of nitrogen fertiliser application. This may not reflect the true situation in the field. Further research could provide an Australian-specific emission factor for nitrogen-fixing crops and pastures. In terms of the equations estimating GHG emissions from livestock, there are a number of interesting characteristics of the equations which affect emission estimates. For instance there is a limit on the affect of emissions from sheep, when increasing dry matter availability (DMA) in feed, as a result of the way the equation is set up. Estimated methane emissions from sheep are closely related to the quantity and quality of feed consumed by the animal. In this regard, the availability of dry matter (in tonnes/hectare) is a key factor in the calculation of the amount of feed consumed (intake). The equation used to determine the intake of feed relative to the amount of feed available (4A.3_2) reaches a limit at 2.9 tonnes/hectare of DMA. DMA quantities greater than this will have no effect on estimated emissions, because the equation does not allow it. This may be reflective of the real-life situation, but is largely unknown currently due to a lack of research. Under the NGGI methodology, it is assumed wastes from feedlots are managed through a solid storage and drylot system. As such, only one emission factor is provided for estimating emissions from wastes from feedlots. However, feedlot managers may allocate wastes into different systems. To estimate emissions from alternative manure management systems, the Scenario Tool uses the international emission factors which apply for a range of systems. In the absence of feedlot-specific emission factors, there could be some overestimation or indeed underestimation of emissions from different manure management systems. 20
28 Emission mitigation technologies have been developed for nitrogen fertilisers and animal wastes on soils. These include nitrification inhibitors which have been found to reduce nitrous oxide emissions by 16% in some situations, however the technology is not proven across multiple systems and production environment. As such, there is no clear equation which describes the nitrous oxide emission reduction from the use of this technology. In addition, there may be production affects from using this technology, which again has not been investigated. For farmers to determine whether it is financially viable to use this technology, and/or to carry out other mitigation activities, they need to be able to estimate the emission reduction specific to their production environment. Research into these affects would better inform farmers in making these decisions. In this regard, the new FarmGAS Scenario Tool provides a modelling system that can be used to analyse a range of farming systems across Australia. In addition, by providing a means for farmers and researchers to apply the NGGI methodology to a farm situation provides an important contribution to ongoing research on the estimation of farm-level greenhouse gas emissions estimation in Australia. 21
29 Appendix 2. Technical Specification submitted by Sitback Solutions March 2011.
30 Australian Farm Institute Online Calculator Development Technical Specification March 2011
31 1 SCOPE Background and context Target audience 4 2. TECHNICAL PLATFORM/FUNCTIONAL REQUIREMENTS Hosting Production server details Development server details Host company contact details Tech stack MySQL DB PHP Apache Webserver Operating system Source control DNS Backups and restores Migration plan Supported browsers & screen resolution Supported browsers & screen resolution CSV download Print to PDF Login, signup & forgotten password Accessibility Optimisation 9
32 2.14 SEO considerations Stress testing INTEGRATED SYSTEMS Business Catalyst (BC) Existing calculator XLS tool AFI brand guidelines / Creative CLASS DEFINITIONS TEST PLANS WORKFLOW/NEW SCREENS REPORTING REQUIREMENTS Google Analytics reporting Tool usage reporting WIREFRAMES 22
33 1 Scope 1.1 Background and context This document is the technical specification for the AFI Online Calculator development project. It includes all information required by the development team during development. 1.2 Target audience SItback Solutions (SBS) development resources. AFI project stakeholders. Site maintenance and support team (post launch) 2. Technical platform/functional requirements 2.1 Hosting The AFI production website is hosted in on SBS managed managed infrastructure Production server details IP address: URL: (temporary URL during development) URL: Development server details Development server also managed by Sitback Solutions. IP address: URL: Host company contact details All server related issues can be managed by SItback Solutions as per the overarching AFI/SBS support and maintenance SoW via Tickets have been logged under the Scenario Tool milestone. 2.2 Tech stack This section covers all installed components and version numbers as of the time of document creation. Moving forward, all components should be patched as appropriate.
34 2.2.1 MySQL DB Ver 8.41 Distrib , for redhat-linux-gnu on i686 Server version log Protocol version PHP PHP (cli) (built: Nov :24:03) Copyright (c) The PHP Group Zend Engine v2.2.0, Copyright (c) Zend Technologies Apache Webserver Server version: Apache/2.2.3 Server built: Aug :32: Operating system CentOS release 5.5 (Final) 2.3 Source control All code developed is managed in the Unfuddle source repository for the AFI project. Access controlled by SItback Solutions. All code can be provided to AFI at any point required. 2.4 DNS The DNS records for the dev farm tool are managed by SBS via NetRegistry. The DNS records for the production URL are managed by Brennan IT> Domain Name: Last Modified: Registrar ID: Registrar Name: Status: farminstitute.org.au 04-Sep :06:25 UTC Distribute.IT Distribute.IT ok
35 Registrant: NSW Farmers Registrant ID: ACN Eligibility Type: Non-profit Organisation Registrant Contact ID: Registrant Contact Name: Registrant Contact DIT NSW Farmers Association Visit whois.ausregistry.com.au for Web based WhoIs Tech Contact ID: Tech Contact Name: Tech Contact DIT Brennan IT Visit whois.ausregistry.com.au for Web based WhoIs Name Server: ns1.brennanit.net.au Name Server IP: Name Server: ns2.brennanit.net.au Name Server IP: Name Server: ns3.brennanit.net.au Name Server IP: Backups and restores Backups are an automatic process performed daily. Server wide or individual file restoration from a previous backup can be requested at any time. We perform daily backups of all files on the server and every month, a complete file backup is done. Differential backups are then done at regular intervals throughout the month. The backup system has complete granularity - we can restore an entire server or drill down to a single file. Depending on how recently the full monthly backup was done, there may also be up to three distinct time periods, known as restore points, from which to choose to restore any files. 2.6 Migration plan A summary of the migration plan and status is as follows: Obtain backup of live data - DONE Validation of extracted data - DONE Mapping of live data into new DB schema - UNDERWAY Development of script to migrate live data to new DB schema - UNDERWAY Testing of DB migration scripts - TO DO
36 Temporarily deactivate current scenario tool - TO DO Obtain updated live data just prior to launch - TO DO Run tested script to migrate live data in new DB schema - TO DO Test mapping of live data - TO DO Once the data migration has been completed and the data validated, then DNS switchover (deployment) can occur resulting in the new scenario replacing the currently live tool for all users 2.7 Supported browsers & screen resolution Due to the restrictions of the current AFI CMS platform the scenario tool has been built as a stand alone tool (as per the currently live tool). This has the benefit of only loosely coupling the scenario tool with the AFI CMS. Should AFI decide to change the current CMS for any reason the scenario tool does not need to be re-built. It s core architecture can also be reused for other similar type tools elsewhere, independent of the AFI CMS. However to facilitate ongoing scenario tool management, some integration with the CMS has been set up to make it easy for AFI non-technical resources to perform key types of updates: 1. Calculator front end Labels, error messages, inline help etc are stored in the underlying database and a custom UI has been developed to enable AFI resources to manage mentioned tool aspects with no technical resources required. 2. Management of attachments via BC PDFs, docs, PPTs etc are all managed via the current AFI CMS. The scenario tool simply references required documents. Should documents need to be updated this is performed via the CMS as per existing business processes. 2.8 Supported browsers & screen resolution As a large number of calculator users are know to use old browsers, the system
37 must be built to work on IE6 at a screen resolution of 760x600 - this caters for an 800px wide screen resolution. Supported browsers include: - IE, v6,7,8 (PC) - FireFox v2,3 (Mac and PC) - Safari v5 (Mac) - Opera v10 (Mac) - Chrome v6 (Mac and PC) Certain scenario features designed to add value for users unfortunately are simply not supported on older browsers (in essence IE6). Graceful degradation techniques will therefore be applied where appropriate. This ensures that all tool features function in a manner that operates, but that may provides a reduced level of service rather than failing completely. In summary, users with modern browsers will provide users with a more feature rich experience whereas users with older deprecated browsers will still have access to a fully functional tool. Page weight and loading times are particularly important given the target audience. Special attention is to be given to ensure page weight (directly proportional to how long the tool takes to load ) is kept to a bare minimum via techniques including: Image size optimisation JavaScript and CSS minification HTML code streamlining Avoidance of non-required library inclusion 2.9 CSV download The tool will enable users to download the data relating to completed scenarios into a CSV file for offline review and manipulation of data via Excel Print to PDF The tool will enable users to print tool summary information to PDF and will include graphical representation of information via bar chart generation.
38 2.11 Login, signup & forgotten password The tool will enable to user to perform all aforementioned functions will forgotten passwords ed out the user via a text based (exact contents TBD - AFI to provide). will be used as the primary key for all user accounts. Users will enter their address and password to enter the calculator. The user account will not be linked to Business Catalyst but used purely for access to the calculator. The DB schema will be developed in a way to support additional calculators associated to the same user account down the track if required by AFI Accessibility Sitback Solutions makes every attempt to meet best practice accessibility guidelines. These guidelines are typically applied to information based websites, some guidelines may not be possible in light of the complex calculator functionality. For example, the required use of tables will cause issues for online screen readers, however the tool dictates the use of such tables to render tabular information. Alt tags will be implemented across all images within the calculator Optimisation The following optimisation considerations will be adhered to throughout the development: The tool will be built to support low bandwidth connectivity. No video/flash-based content will be included. No large images will be used Minify will be applied to JS files as appropriate and CSS coding practice to assist with minimizing page weight. All menu items will be text based, not image based. All form submission buttons will be text based, not image based. Sitback Solutions will make every effort to optimise the site for low bandwidth
39 users, however, we cannot guarantee the users connection speed SEO considerations User friendly URLS will be utilised within the calculator, however other Search Engine Optimisation techniques will not be considered due to the fact the calculator is a closed environment which will not be accessible to search engines Stress testing The calculator will be stress testing to ensure predicted traffic volumes do not have a negative impact on speed. The target audience is not expected to result in a level of web traffic that will have a detrimental affect in the tool. 3. Integrated systems This section covers all systems that constitute website functionality but that are managed externally to the core platform 3.1 Business Catalyst (BC) Documents within the calculator will be housed/linked to from Business Catalyst. 3.2 Existing calculator Data from the existing calculator has already been obtained and validated. Scripts will be developed to migrate the MSSQL data into the new MySQL DB schema. An initial import will be performed along with the required testing of the scripts once the new schema has been defined. A subsequent impart of the current data will be performed prior to UAT. And prior to go live a fresh dump from the current tool will be obtained and imported to ensure any new data produced in the interim is imported into the new tool. 3.3 XLS tool All required calculator algorithms have been provided in the XLS version of the tool. During development, Sitback Solutions found the XLS too to be substantially more complex than first anticipated. This impacted initial project timelines. Many calculations required cross-referenced information between different pages and many cells. Some calculations referenced over 50 other calculations within the calculator tool.

40 Another issue was the inconsistent reference points, were the same value could be derived from multiple places, which is understandable given the complexity of the calculator. The latest spreadsheet version is available in to authorised users. XLS tool examples below:


41 3.4 AFI brand guidelines / Creative Existing AFI look and feel has been incorporated into the screens developed.
42

43 Multiple creative screens, including an Uber Template, have been developed. The Uber template included form fields, user options, and styles that the HTML developers applied across the calculator. General Screen

44 Uber Template
45 4. Database schema scenario ( id INT NOT NULL AUTO_INCREMENT, dtm_created timestamp NOT NULL default CURRENT_TIMESTAMP, dtm_updated timestamp NOT NULL, farm_name VARCHAR(255), scenario_name VARCHAR(255), state VARCHAR(30), region BIGINT, uid INT, PRIMARY KEY (id), INDEX scenario_id(id), INDEX scenario_uid(uid) ); scenario_data ( id BIGINT NOT NULL AUTO_INCREMENT, sid INT, data_key VARCHAR(255), data_value VARCHAR(255), PRIMARY KEY (id), INDEX data_key(data_key), INDEX sid(sid), INDEX data_key_sid(data_key, sid) ); scenario_data_extended ( sdid BIGINT, data_key VARCHAR(255), data_value VARCHAR(255), INDEX crop_data_key(data_key), INDEX sdid(sdid), INDEX crop_data_key_sdid(data_key, sdid) ); region ( id INT NOT NULL AUTO_INCREMENT, name VARCHAR(255), state VARCHAR(30), PRIMARY KEY (id) ); user ( id INT NOT NULL AUTO_INCREMENT, dtm_created timestamp NOT NULL default CURRENT_TIMESTAMP, dtm_updated timestamp NOT NULL, dtm_lastaccessed timestamp NOT NULL, VARCHAR(255),
46 ); password VARCHAR(50), title VARCHAR(255), name VARCHAR(255), surname VARCHAR(255), address_1 VARCHAR(255), address_2 VARCHAR(255), region INT, state VARCHAR(30), postcode VARCHAR(6), phone_1 VARCHAR(20), phone_2 VARCHAR(20), mobile VARCHAR(20), fax VARCHAR(20), admin TINYINT DEFAULT 0, PRIMARY KEY (id), INDEX user_ _password( , password), INDEX user_id(id) properties ( idx_key varchar(255), message_type varchar(15), message_format varchar(8), value TEXT ); cache ( idx_key varchar(255), value TEXT ); default_data ( id INT NOT NULL AUTO_INCREMENT, data_key VARCHAR(255), data_value VARCHAR(255), PRIMARY KEY (id), INDEX lookup_key(data_key) ); tree_reference ( id INT NOT NULL AUTO_INCREMENT, name VARCHAR(255), ref_type VARCHAR(255), PRIMARY KEY (id), INDEX lookup_key(id) ); tree ( id INT NOT NULL AUTO_INCREMENT, sid VARCHAR(255),
47 ); region INT, state VARCHAR(255), tid VARCHAR(255), PRIMARY KEY (id), INDEX lookup_key(region) tree_data ( tid INT, age INT, carbon DECIMAL(7,3) );
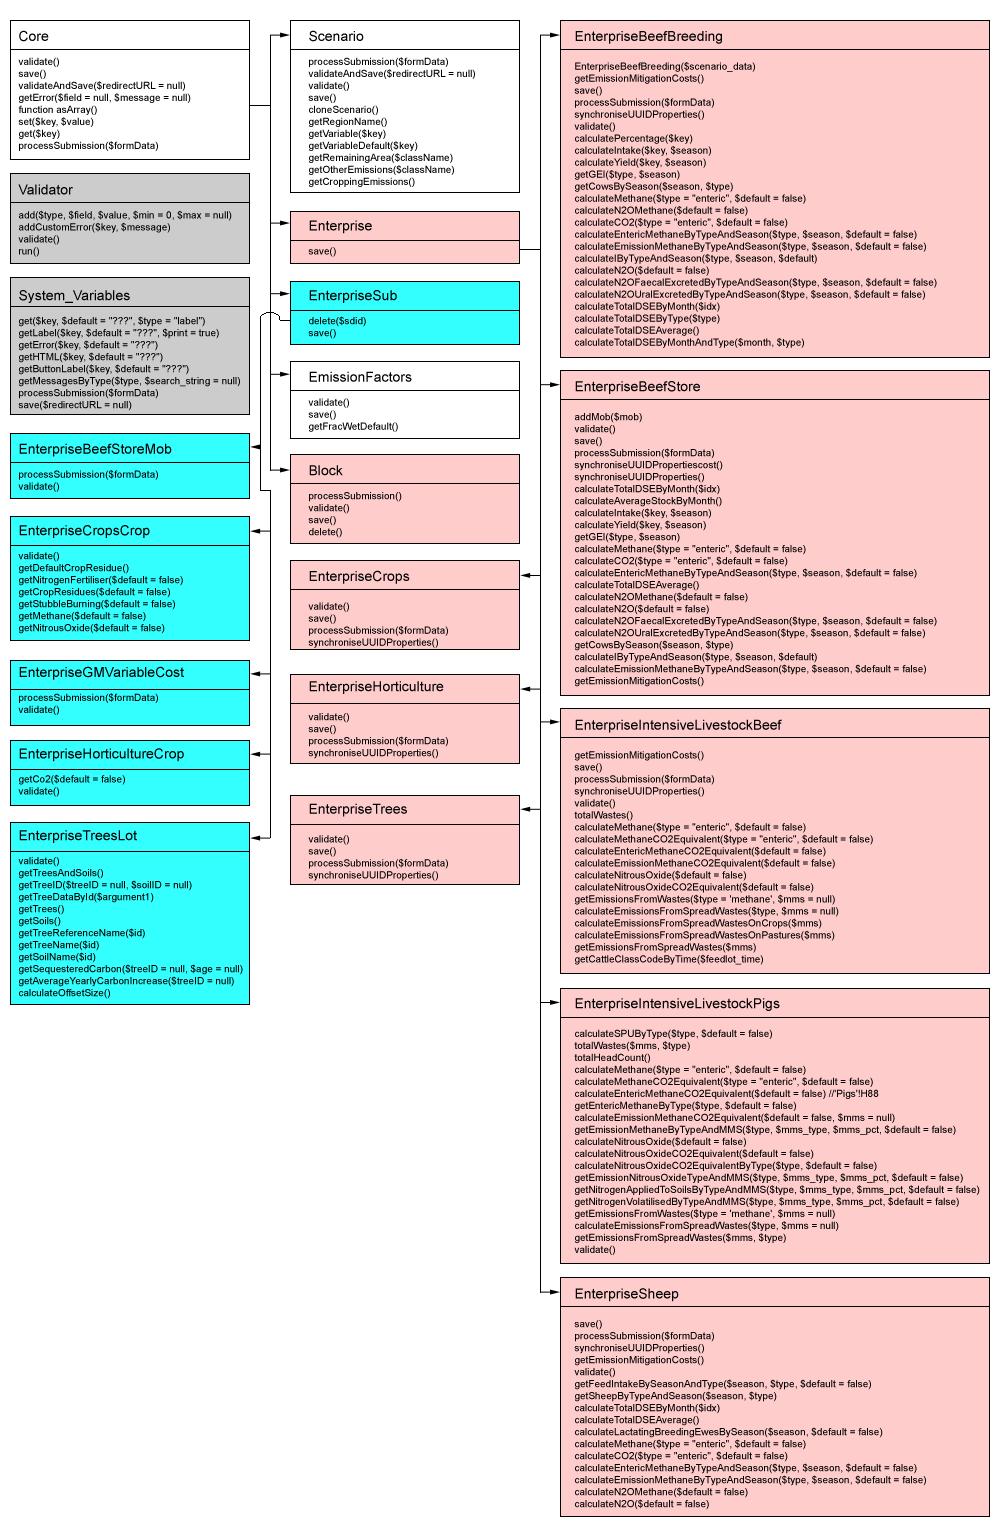
48 5. Class definitions
49 6. Test plans UAT test cases and completion matrices to be produced during development. AFI supplying test cases as scenarios are tested: Example at the above link for authorised users. 7. Workflow/New Screens Home Screen inc Log in/register Dashboard Enterprise Scenario Key Initial Screen (for each Enterprise) Enterprise Scenario Detail/Workflow Screens (for each Enterprise) Confirmation and Overview Screen (reporting) Footer Screens - e.g. privacy, contact, terms and condition, about 8. Reporting requirements 8.1 Google Analytics reporting Sitback Solutions will integrate Google Analytics on all calculator screens and provide access details to AFI for analysis. AFI will have full administrator access to all reports, GA account: UA GA code: <script type="text/javascript"> var _gaq = _gaq []; _gaq.push(['_setaccount', 'UA ']); _gaq.push(['_trackpageview']); (function() { var ga = document.createelement('script'); ga.type = 'text/javascript'; ga.async = true; ga.src = (' == document.location.protocol? ' : ' + '.googleanalytics.com/ga.js'; var s = document.getelementsbytagname('script')[0]; s.parentnode.insertbefore(ga, s); })(); </script>
 Existing account logins (per week) Number of new scenarios (per week)")
50 Example screen shot. 8.2 Tool usage reporting The database schema has been created to support basic reporting requirements. Provision of DB script driven reports covering the following will be provided via automated New account set ups (per week) Existing account logins (per week) Number of new scenarios (per week) The development of a reporting user interface (AFI login and real time reporting application) is outside of the scope of this project.
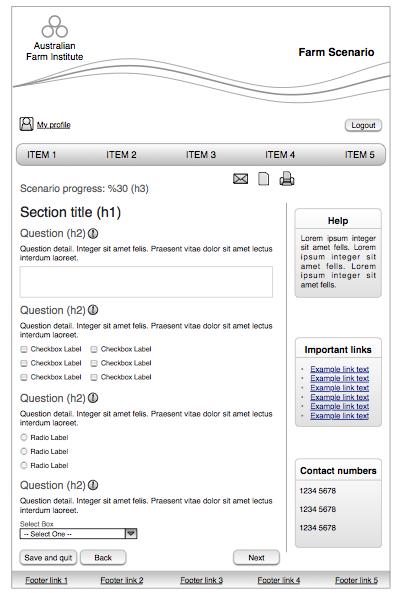
51 9. Wireframes Working versions below for reference only.
52

53

54
55 Appendix 3. Project plan submitted by Sitback Solutions March 2011.
56 407/21 Hickson Rd WALSH BAY SYDNEY 2000 p w. sitbacksolutions.com.au abn Online Calculator Development Project Progress Report March 2011 Sitback Solutions PTY LTD
57 Contents 1.0 Project Plan! Key dates/milestones! Milestones achieved:! Project Management Report! Technical Development Report! Unfuddle (Issue tracker) report! Financials! Technical Documentation! 12 Sitback Solutions PTY LTD
58 1.0 Project Plan See related PDF - Online Calculator Development_ PDF Sitback Solutions PTY LTD
59 2.0 Key dates/milestones 2.1 Milestones achieved: - Milestone 1 - Project commencement - Technical Specification - delivered - Technical Environment set up - complete - Creative concept - approved - Database schema - complete - Final XLS received - ongoing - Application layer development - complete - User profile management - complete - Completion of change requests (Amendment to Calculator & Amendment to Standard Reference Weight, Misc Calculator issues, Tree data needs to be editable) - complete 2.2 Upcoming milestones: 1. AFI to supply field labels, error messages, informational text, linked documents - ASAP 2. Development status: 2.1. Calculator development - 95% complete 2.2. HTML/CSS - 95% complete 2.3. Inline application help - editable by AFI 3. Testing Scenarios released for component testing when complete, Beef Breeding and Beef Stores are being reviewed by AFI now. Development and testing to be complete 1 April Sitback Solutions PTY LTD
60 3.0 Project Management Report 3.1 Communications Key Contacts Name Organisation/ Phone Title Mick Keogh AFI/Executive Director (02) Sally Davison AFI/Project Manager (02) Patrick Madden AFI/Policy Economist au (02) Alison Barry SBS/Project Manager Kiel Van Daal SBS/Project Manager Paul Armstrong SBS/Technical Director Nathan Feick SBS/Technical Developer Project Communications The project will be managed using online management tool Unfuddle - please see Section Unfuddle (Issue tracker) report. The AFI project information is here: Key project members have access to Unfuddle. 3.3 Escalation All issues to be raised with Project Managers, followed by escalation to Mick Keogh (AFI Director) and Sitback Solutions business owners (Paul Armstrong/Kiel Van Daal). 3.4 Resource Sitback Solutions has adequately resourced the project with resources whose skills sets match requirements. AFI will managed internal review process with appropriate internal/external stakeholders as required. 3.5 Risks Risks identified as at January: - Amendments/errors discovered in calculator (affecting Project Plan Line integrate xls algorithms). Action: AFI/SBS to monitor and adjust timeline if required. Sitback Solutions PTY LTD
61 3.6 Progress update The SBS Project Management team can confirm the project status is currently AMBER as at 10 March. The project status has moved to amber due to the following: - Calculator algorithms are significantly more complex than originally thought while scoping the project. - A number of bugs within the.xls which were addressed, and a revised.xls and/or response was supplied for each instance. A number of initiatives have been put in place to deliver the revised plan including: An additional development resource has been committed to the project - development is 95% complete An additional CSS/HTML resource has been committed it the project - HTML/CSS is now complete Tasks (E.g. development, HTML/CSS and change request activities) have been run in parallel where possible. Testing will be executed on a scenario basis, AFI and SBS to develop test plan - in progress now. (Potential status options: Green = on track, Amber = minor issues are impacting project status, Red = delivery is in jeopardy.) Sitback Solutions PTY LTD
62 4.0 Technical Development Report 4. 1 Technical Overview A number of technical tasks have been completed. Integrating the XLS algorithms has proved to be more complex than originally scoped. Additional time has been allocated, and SBS is also dedicating additional resources to enable HTML/CSS development and development streams to run in parallel. Bugs found as we go are being addressed with Patrick Madden, revised spreadsheets and/or direction is being provided quickly so development is not majorly delayed. 4.2 Progress Update The SBS Technical team can confirm the technical development project component status is currently AMBER as at 10 March. (Potential status options: Green = on track, Amber = minor issues are impacting project status, Red = delivery is in jeopardy.) Sitback Solutions PTY LTD
63 5.0 Unfuddle (Issue tracker) report Active Tickets # Summary Status Actions 18 Import current data into local MS SQL 2005 New SBS to use data within ticket in migration 19 Project plan Assigned SBS to update as required 22 Technical specification Assigned SBS to update during development 42 Calculator - notes and bugs New AFI/SBS to update 49 Excel spreadsheet - Version 5-4 Jan updated with corrected formulae New Ongoing 52 Inline help New Ongoing 53 Issues in Feedlot Sheet New AFI to advise 55 General Case Studies Open AFI/SBS to use in testing 60 Testing - Beef Breeding Open AFI/SBS to use in testing 64 Testing - Beef Stores Open AFI/SBS to use in testing 65 Reports Open AFI to provide Sitback Solutions PTY LTD
64 6.0 Financials 6.1 Invoice Schedule Milestone Invoice Amount (ex gst) Date 1 $14,900 1/9/10 2 $14,900 24/11/10 3 $14,900 1/4/11 4 $14,900 14/4/11 5 CR - $9,000 Calc Amendment 6 CR - $4,500 Standard Reference Weight 7 CR - $5,160 Misc Bug Fixes 8 CR - $4,500 Trees Data 21/1/11 TBC TBC TBC * invoice dates to move inline with new project plan 6.2 Change Requests The following change requests have been approved: 1) Please find below detail to integrate changes listed in Amendment to FarmGAS Scenario model document (supplied 20/12/10). The following activities, and related timing will be required: 1) Set up sheet - Add in graphical region selector - Write JavaScript to trigger on state selection - Write code to present new regions based on state selection - Integrate with current set up model to accept region input - Testing and PM Time: 1.5 days 2) 2) Emission Factors sheet - Change object model to include new FracWET options - Update default data to include new values - Update existing calculations to include new values - Update summary display to reflect new calculations - Testing and PM Sitback Solutions PTY LTD
65 Time: 3.5 days 3) Sum-Calcs-Default and Sum-Calcs-User sheets - Update existing and new calculations to factor in changes to Omission Factor sheet - Update summary display to reflect new calculations - Testing and PM Time: 2.5 days The total time required is 7.5 days ($9,000 ex GST) 2) Thanks for the updated xls (Ticket 23, 19/1). In relation to the amendments to Standard Reference Weight in Beef Breeding, Beef Stores and Feedlot, the following activities are required to ensure the correct values are being referenced. Introduce correct lookup table for standard reference weights - beef and feedlot Update calculators in beef feedlots, beef breeding and beef stores to accommodate new table Update formulas to retrieve data lookup table Testing value return Regression testing - due to the complexity of the calculator, this is one area we are being strict around to ensure that no adverse knock on effects occur at this stage of development. Please note, no new fields will be added and data will calculated as per revised spreadsheet. To implement, this will take 3.75 days ($4,500 ex GST) including development, project management and testing. 3) Trees Data Sitback Solutions will ensure the trees scenario data is editable by AFI via the administration section of the calculator. This will take 3.75 days to implement and activities include: - technical development (HTML/CSS and backend development) - testing - one round of review post technical development - project management - documentation (integrate data schema into the project technical specification). Please note: while every effort will be made to ensure the interface is user friendly, the tree data is complex and contains a significant amount of editable information. Training on the system will be included, however this section will be more complex than updating (for example) system messages. The cost is $4,500 ex GST. 4) The below activities and timings outline additional development time required for the Online Calculator: 1) Crops - s/Liaison with AFI - Update lookup of emission values - Reevaluate and update formulas to use correct emission values reference Effort: 1 day 2) Beef Stores (values) - s/Liaison with AFI - Reevaluate and update formulas relating to default reference weight - Reevaluate and update formulas relating to Spread on crops and Pastures MMS - Bug found in default emission values table in XLS. Reviewed formulas in calculator to ensure same bug was not implemented. Effort: 1.5 days 3) Stubble burning (Emission Factors) - s/Liaison with AFI - Confirming and reviewing code to ensure that a lookup was not required relating to Feedlot MMS Effort: 0.5 days Sitback Solutions PTY LTD Sitback Solutions PTY LTD

66 4) Misc Calculator Bugs Activities for the below involved identifying errors, investigating, liaison with AFI, implementing fix where required and testing: Summary Total Effort: 4.3 days ($5,160 ex gst) Sitback Solutions PTY LTD
FarmGAS Calculator Scenario Tool (ST)
") June 2014 FarmGAS Calculator Scenario Tool (ST) User Guide Version 3.0 2014 Australian Farm Institute ISBN 978-1-921808-31-9 (Web) Australia s Independent Farm Policy Research Institute Australian Farm
June 2014 FarmGAS Calculator Scenario Tool (ST) User Guide Version 3.0 2014 Australian Farm Institute ISBN 978-1-921808-31-9 (Web) Australia s Independent Farm Policy Research Institute Australian Farm
Modelling Greenhouse Gas Emissions Abatement Options for Beef and Sheep Farm Businesses
 final report Project code: B.CCH.2011 Prepared by: Mick Keogh, Adam Tomlinson, Professor Julie Cotter and Roderick Glass Australian Farm Institute, Australian Centre for Sustainable Business and Development
ECONOMICS OF REDUCING METHANE EMISSIONS FROM CATTLE PRODUCTION IN CENTRAL QUEENSLAND
 ECONOMICS OF REDUCING METHANE EMISSIONS FROM CATTLE PRODUCTION IN CENTRAL QUEENSLAND Project number NAP3.226 Final Report prepared for MLA by: Dr John Rolfe Centre for Primary Industried Research Central
GHG Emissions from Manure Management
 GHG Emissions from Manure Management The National Agricultural Manure Management Program The quantification of emissions and mitigations from manure management in Australia has been limited. In recognition
Herd Management Method
 Herd Management Method Carbon credits from cattle management Stephen Wiedemann FSA Consulting Background >80% of GHG emissions from Aust. grassfed beef arise from enteric methane 1 The emissions intensity
SOUTH AFRICA S PERSPECTIVE
 CURRENT KNOWLEDGE FOR ESTIMATION OF EMISSIONS AND PRIORITIES FOR MITIGATION AND ADAPTATION: SOUTH AFRICA S PERSPECTIVE Luanne Stevens 1, L. Du Toit 2 and M. Scholtz 3 1 North-West 2 Tshwane 3 ARC-Animal
Carbon Farming in Australia. Richard Eckard
 Carbon Farming in Australia Richard Eckard Australian Emissions Context DCCEE 2013 Australian Emissions Context Agriculture 57% of all methane 75% of all nitrous oxide Enteric Methane 11.5% of National
research report The Impact of a Carbon Price on Australian Farm Businesses: Grain Production Australia s Independent Farm Policy Research Institute
 research report June 2011 The Impact of a Carbon Price on Australian Farm Businesses: Grain Production A report prepared by the Australian Farm Institute with funding from GrainCorp Operations Limited
Worksheets accompanying the agriculture sector
 Worksheets accompanying the agriculture sector Domestic livestock emissions from enteric fermentation and manure management Worksheet 4.1 (1 of 2) Methane emissions Livestock type Number Emission factor
GrassGro 3 easier, faster analysis of grazing systems
 GrassGro is a decision support tool developed by CSIRO to assist decisionmaking by farmers and managers of grassland resources. GrassGro helps analyse opportunities and risks that variable weather imposes
Animal numbers in New Zealand Revised 2004 Agricultural sector calculations: emissions from domestic livestock and agricultural soils
 Animal numbers in New Zealand Revised 2004 Agricultural sector calculations: emissions from domestic livestock and agricultural soils Dairy Dairy Non-dairy Non-dairy Sheep Sheep Goat Goat Deer Deer Swine
The impact of a carbon price on Australian farm businesses: Grain production
 The impact of a carbon price on Australian farm businesses: Grain production Australian Farm Institute, May 2011. Summary Farm level modelling was carried out of the impact of an economy-wide carbon price
Greenhouse Gas Emissions on Northern Ireland Dairy Farms
 Greenhouse Gas Emissions on Northern Ireland Dairy Farms - A carbon footprint time series study January 2017 Statistics and Analytical Services Branch, DAERA Contents Page Executive Summary 1 Chapter 1:
A simple carbon offset scenario tool (COST) for assessing dairy farm abatement options
 for assessing dairy farm abatement options") 20th International Congress on Modelling and Simulation, Adelaide, Australia, 1 6 December 2013 www.mssanz.org.au/modsim2013 A simple carbon offset scenario tool (COST) for assessing dairy farm abatement
20th International Congress on Modelling and Simulation, Adelaide, Australia, 1 6 December 2013 www.mssanz.org.au/modsim2013 A simple carbon offset scenario tool (COST) for assessing dairy farm abatement
Australian carbon policy: Implications for farm businesses
 Australian carbon policy: Implications for farm businesses Australian carbon policy Carbon markets and prices Some CFI case studies Farm business implications Key messages Atmosphere Sequestration Mitigation
Eskdalemuir A comparison of forestry and hill farming; productivity and economic impact
 Eskdalemuir A comparison of forestry and hill farming; productivity and economic impact Contents Executive Summary 3 1.0 Introduction and Objectives 4 2.0 Forestry survey and model 6 3.0 Agricultural output
Pasture Management for Carbon and
 Pasture Management for Carbon and Livestock Methane and Nitrous Oxide Daniel L. Martino daniel.martino@carbosur.com.uy Chicago - 23 April 2010 Technical Working Group on Agricultural Greenhouse Gases (T-AGG)
Nutrient Budgeting. An Overview of What, How and Why. June 2014
 Nutrient Budgeting An Overview of What, How and Why 2014 Topics to Cover 1. Why the need for nutrient budgets 2. What is OVERSEER? 3. Principles Behind OVERSEER 4. User Inputs 5. Importance of accurate
research report The Impact of a Carbon Price on Australian Farm Businesses: Beef Production Australia s Independent Farm Policy Research Institute
 research report June 2011 The Impact of a Carbon Price on Australian Farm Businesses: Beef Production A report prepared by The Australian Farm Institute with funding from Meat & Livestock Australia 2011
Greenhouse gas emissions and dairy farms. Zita Ritchie Dairy Extension Officer DPI Victoria Warrnambool
 Greenhouse gas emissions and dairy farms Zita Ritchie Dairy Extension Officer DPI Victoria Warrnambool 0 Overview 1. What are greenhouse gases (GHGs)? 2. Source of agricultural greenhouse gas emissions
Greenhouse Gas Emissions by Irish Agriculture:
 Briefing Note Greenhouse Gas Emissions by Irish Agriculture: Consequences arising from the Food Harvest Targets Trevor Donnellan & Kevin Hanrahan Agricultural Economics Department Teagasc Briefing Note
HIGHER SCHOOL CERTIFICATE EXAMINATION AGRICULTURE. 2/3 UNIT (COMMON) SECTION I (20 Marks)
 SECTION I (20 Marks)") STUDENT NUMBER CENTRE NUMBER N E W S O U T H W A L E S HIGHER SCHOOL CERTIFICATE EXAMINATION 1996 AGRICULTURE 2/3 UNIT (COMMON) SECTION I (20 Marks) Total time allowed for Sections I, II, III, and IV Three
STUDENT NUMBER CENTRE NUMBER N E W S O U T H W A L E S HIGHER SCHOOL CERTIFICATE EXAMINATION 1996 AGRICULTURE 2/3 UNIT (COMMON) SECTION I (20 Marks) Total time allowed for Sections I, II, III, and IV Three
Climate Change and Agriculture in NZ OECD Committee on Agriculture 19 November 2009
 Climate Change and Agriculture in NZ OECD Committee on Agriculture 19 November 2009 Hayden Montgomery Senior Analyst International Climate Change Ministry of Agriculture and Forestry Outline of presentation
6. AGRICULTURE [CRF sector 4]
![6. AGRICULTURE [CRF sector 4]](/thumbs/96/128046014.jpg "6. AGRICULTURE [CRF sector 4]") AGRICULTURE Netherlands NIR 2004 RIVM Report 773201008 6. AGRICULTURE [CRF sector 4] 6.1 Sector overview The agricultural sector in the Netherlands comprises three subcategories: enteric fermentation by
AGRICULTURE Netherlands NIR 2004 RIVM Report 773201008 6. AGRICULTURE [CRF sector 4] 6.1 Sector overview The agricultural sector in the Netherlands comprises three subcategories: enteric fermentation by
PUBLISHED BY Meat & Livestock Australia Limited Locked Bag 991 NORTH SYDNEY NSW 2059
 finalreport Project code: Prepared by: NBP.224 Dr Scott Dalzell School of Land, Crop & Food Sciences & School of Animal Studies The University of Queensland Qld 4072 Date published: February 2007 ISBN:
Emissions Reduction Fund Opportunities for cattle producers
 Emissions Reduction Fund Opportunities for cattle producers Opportunities for cattle producers Cattle producers can run projects under the ERF Two specific methods: Feeding nitrates to beef cattle Beef
STOCKTAKE REPORT 2015
 STOCKTAKE REPORT 2015 This document includes costings for English cattle and sheep enterprises in the year ending 31 March 2015 CONTENTS Welcome... 1 Glossary of abbreviations... 1 Cost and price changes
Successful Approaches to Reducing Greenhouse Gas Emissions from Australian Agriculture :
 Successful Approaches to Reducing Greenhouse Gas Emissions from Australian Agriculture : Minimising Loss of Valuable Resources James Shevlin, David Ugalde and Anthony McGregor Australian Greenhouse Office
Carbon Credit Potential from Intensive Rotational Grazing under Carbon Credit. Certification Protocols
 Carbon Credit Potential from Intensive Rotational Grazing under Carbon Credit Certification Protocols Kurt Stephenson Dept of Ag & Applied Econ Virginia Tech Blacksburg, VA 24061 Email: Kurts@vt.edu Phone
Greenhouse Gases and Ammonia In Irish Agriculture
 Greenhouse Gases and Ammonia In Irish Agriculture Current Agriculture / Land Use Policy in Ireland Is Climate Change a consideration? Gary Lanigan, Patrick Forrestal, William Burchill, Owen Fenton, Rogier
Opportunities for Australian horticulture in the Carbon Farming Initiative
 Opportunities for Australian horticulture in the Carbon Farming Initiative David Putland Growcom Project Number: AH11020 AH11020 This report is published by Horticulture Australia Ltd to pass on information
Livestock development and climate change: The benefits of advanced greenhouse gas inventories
 Livestock development and climate change: The benefits of advanced greenhouse gas inventories About this booklet Livestock development and climate change outcomes can support each other. More productive
Effect of ruminant production systems on C-footprint of milk and meat
 Effect of ruminant production systems on C-footprint of milk and meat Groupe Aliments et alimentation de l alliance AllEnvi, Paris, le 25 Octobre 2016 Greenhouse gas emisson from livestock 14,5% des émissions
Hurunui-Waiau Nutrient Budgeting Case Studies
 Hurunui-Waiau Nutrient Budgeting Case Studies Report Prepared by Rebecca Hyde & James Hoban This report outlines some considerations for the nutrient working group, relating to the Overseer nutrient budgeting
Technical Annex: The Smart Agriculture Inventory
 Technical Annex: The Smart Agriculture Inventory Acknowledgements The Committee would like to thank: The team that prepared this Annex: Ewa Kmietowicz and Indra Thillainathan. A number of stakeholders
EQUATION 11 = ( x DE%) EQUATION 12 = ( x DE%)
 EQUATION 12 = ( x DE%)") 4 AGRICULTURE Based on a review of other energy systems (e.g., ARC, 1980), a linear relationship between digestible energy and net energy was derived for digestibilities below 65 per cent as follows (see
4 AGRICULTURE Based on a review of other energy systems (e.g., ARC, 1980), a linear relationship between digestible energy and net energy was derived for digestibilities below 65 per cent as follows (see
New South Wales Department of Primary Industries. Adaptation to Climate Change in Southern Livestock Program
 final report Project Code: Prepared by: B.SBP.0074 Phillip Graham New South Wales Department of Primary Industries Date published: September 2012 PUBLISHED B Meat and Livestock Australia Limited Locked
The Carbon Navigator. Pat Murphy, Paul Crosson, Donal O Brien, Andy Boland, Meabh O Hagan
 The Carbon Navigator Pat Murphy, Paul Crosson, Donal O Brien, Andy Boland, Meabh O Hagan Course outline Introduction to the Carbon Navigator Mitigation Options in the Carbon Navigator Using the Carbon
The Dairy Carbon Navigator
 The Dairy Carbon Navigator Improving Carbon Efficiency on Irish Dairy Farms The Farm Carbon Navigator was developed by Teagasc and Bord Bia as an advisory tool to support the Sustainable Dairy Assurance
Northern beef case study
 MLA Cost of Production This case study outlines how a northern beef producer would calculate their cost of production for beef, using the MLA Cost of Production calculator. The northern beef herd used
PigGas Pork Industry Greenhouse Gas Calculator and Case Studies
 PigGas Pork Industry Greenhouse Gas Calculator and Case Studies Final Report APL Project 2009/1011.335 January 2013 NSW Department of Primary Industries Ian Kruger, Greg Mills & Patrick Madden 4 Marsden
Agricultural GHG Emissions projections..and mitigation actions to Presentation to Oireachtas Committee on Climate Action.
 Agricultural GHG Emissions projections..and mitigation actions to 2030 Presentation to Oireachtas Committee on Climate Action Dec 12 th 2018 Overview Ireland s GHG challenge - agriculture Scenarios for
Farming in a carbon-priced economy implications for farm businesses.
 www.farminstitute.org.au Farming in a carbon-priced economy implications for farm businesses. Mick Keogh Australian Farm Institute Australian carbon policy The Carbon Farming Initiative (CFI) Implications
The economics of farm level emissions
 The economics of farm level emissions Ross Kingwell Department of Agriculture & Food (WA) and University of Western Australia The Big Picture The economics of farm-level emissions crucially depend on how
Economic outcomes of the Kyoto Protocol for New Zealand
 Economic outcomes of the Kyoto Protocol for New Zealand ABARE Report to New Zealand Ministry of Agriculture and Forestry November 2001 1 Introduction In August 2001 the New Zealand Ministry of Agriculture
NEW ZEALAND. Submission to the Subsidiary Body for Scientific and Technological Advice (SBSTA) Views on issues related to agriculture.
 Views on issues related to agriculture.") NEW ZEALAND Submission to the Subsidiary Body for Scientific and Technological Advice (SBSTA) Views on issues related to agriculture September 2013 Context The thirty-eighth session of the Subsidiary Body
NEW ZEALAND Submission to the Subsidiary Body for Scientific and Technological Advice (SBSTA) Views on issues related to agriculture September 2013 Context The thirty-eighth session of the Subsidiary Body
Department of Agriculture, Fisheries and Forestry, Queensland. B. Keywords: profitability, greenhouse gas emissions, carbon sequestration
 Producing Climate Clever Beef in northern Australia S. G. Bray AC, D. Walsh B, R. Gowen A, K. Broad A, B. Daniels A A Department of Agriculture, Fisheries and Forestry, Queensland. B Department of Resources,
Analysis of supplemental feed use in the new zealand sheep industry
 Analysis of supplemental feed use in the new zealand sheep industry MPI Technical Paper 2017/57 Prepared for the Ministry for Primary Industries ISBN No: 978-1-77665-677-6 (online) ISSN No: 2253-3923 (online)
Utilisation How much? From 40-50% to 60-80% (depending on previous system and subdivision)
") Why rotational grazing? Good individual performance is possible with correct sward height management! But higher production/hectare possible with rotational grazing systems Quantity You will grow more
Why rotational grazing? Good individual performance is possible with correct sward height management! But higher production/hectare possible with rotational grazing systems Quantity You will grow more
Harming farming The cost to agriculture from the government s emissions reduction plan
 Harming farming The cost to agriculture from the government s emissions reduction plan A sector by sector proportional emissions reduction approach will mean agriculture will have to reduce emissions by
Optimising farm resource allocation to maximise profit using a new generation integrated whole farm planning model
 85 Optimising farm resource allocation to maximise profit using a new generation integrated whole farm planning model J. M. RENDEL 1, A.D. MACKAY 2, A. MANDERSON 2 and K. O NEILL 1 1 AgResearch, Private
Reducing gaseous emissions from manure management in Ireland
 Reducing gaseous emissions from manure management in Ireland Gary Lanigan, William Burchill, Patrick Forrestal, Eddy Minet, Fred Bourdin, Grainne Meade, Ray Brennan, Enda Cahalane, Catherine Watson, Owen
EMISSION OF GREEN HOUSE GASES FROM MANURE MANAGEMENT OF CATTLE AND BUFFALOES IN ROMANIA
 EMISSION OF GREEN HOUSE GASES FROM MANURE MANAGEMENT OF CATTLE AND BUFFALOES IN ROMANIA Dana Popa 1*, Livia Vidu 1, R. Popa 1, Gh. Mărginean 1, Nicoleta Defta 1, V. Băcilă 1, A. Bota 2 1 University of
Sustainability of Beef Cattle Systems in Uruguay. What type of sustainable system that we need to make focus?
 Highlighting Producer Members: The Value of Sustainability Sustainability of Beef Cattle Systems in Uruguay. What type of sustainable system that we need to make focus? Ing. Agr. M.Sc. Gonzalo Becoña Plan
Agricultural GHG Emissions projections..and mitigation actions to ICSF, Dublin. Mar 13 th 2019
 Agricultural GHG Emissions projections..and mitigation actions to 2030 ICSF, Dublin Mar 13 th 2019 Overview Ireland s GHG challenge Focus on agriculture Scenarios for future emissions (without mitigation)
LIFE CYCLE ASSESSMENT OF SHEEP
 LIFE CYCLE ASSESSMENT OF SHEEP PRODUCTION IN ONTARIO FINAL SUMMARY REPORT OCTOBER 12 2017 Antoine Léger-Dionne, Jr. Eng., Analyst François Charron-Doucet, Eng., M.Sc., Scientific Director Edouard Clément,
Rice Industry Environment Policy
 Rice Industry Environment Policy The Australian rice industry cares about and depends upon a healthy environment. Water, soil, air, habitat and local communities are fundamental resources for the industry
research report The Impact of a Carbon Price on Australian Farm Businesses: Cotton Farming Australia s Independent Farm Policy Research Institute
 research report June 2011 The Impact of a Carbon Price on Australian Farm Businesses: Cotton Farming A report prepared by the Australian Farm Institute with funding from Cotton Australia 2011 Australian
Enterprise Budgeting... 1 Crop Inputs Introduction... 46
 Contents Enterprise Budgeting... 1 Crop Inputs... 3 Introduction... 4 Fertiliser... 4 Lime... 4 Slurry and Manure... 4 Nutrient Planning... 6 Residual Values of Fertilisers, Manures and Lime... 8 Pesticide
Climate Change: Land Management, Agriculture and Forestry Workshop, 17 th August, Burning of savannas 10% Burning of residues 1%
 The abatement challenge for Australian Agriculture Richard Eckard, Greenhouse in Agriculture The University of Melbourne and Department of Primary Industries, Victoria. Introduction According to the National
Introduction BEEF 140
 Beef Cattle Introduction Markets and price drivers Recent years have seen greater volatility in the market. Reasons range from the effective closure of the EU beef intervention scheme, the horsemeat scare,
Horticulture Balanced Scorecard - Economic Assessment
 Balanced Scorecard - Economic Assessment Access Economics Pty Ltd Project Number: AH09029 AH09029 This report is published by Australia Ltd to pass on information concerning horticultural research and
Prime lamb case study
 Prime lamb case study MLA Cost of Production The following case study outlines how a prime lamb producer would calculate their lamb cost of production using the MLA Cost of Production calculator. The prime
Appendix 5: Farm modelling methodology
 Appendix 5: Farm modelling methodology Perrin Ag Consultants Limited Box 596 Rotorua 1330 Eruera Street Rotorua, New Zealand Ph 07 3491212, Fax 07 349 1112 consult@perrinag.net.nz www.perrinag.net.nz MEMORANDUM
Green House Gas Emissions from Agriculture
 Green House Gas Emissions from Agriculture The story so far Mark Gibson Environment, Knowledge Transfer Gary J. Lanigan Agri-environment Research Outline of talk Green House Gases (GHG s) The challenge
6. AGRICULTURE [CRF sector 4]
![6. AGRICULTURE [CRF sector 4]](/thumbs/90/103262843.jpg "6. AGRICULTURE [CRF sector 4]") Netherlands Environmental Assessment Agency Page 127 of 228 6. AGRICULTURE [CRF sector 4] Major changes in the Agriculture sector with respect to the National Inventory Report 2005 Emissions: Compared
Netherlands Environmental Assessment Agency Page 127 of 228 6. AGRICULTURE [CRF sector 4] Major changes in the Agriculture sector with respect to the National Inventory Report 2005 Emissions: Compared
The impact of the Carbon Pollution Reduction Scheme on Australian Agriculture
 The impact of the Carbon Pollution Reduction Scheme on Australian Agriculture Mick Keogh, Executive Director, Australian Farm Institute. Abstract. Three separate modelling analyses have been carried out
Canterbury Regional Council. IN THE MATTER OF Plan Change 5 STATEMENT OF EVIDENCE OF ANDREW NEIL BURTT. On behalf of BEEF + LAMB NEW ZEALAND
 BEFORE THE Canterbury Regional Council IN THE MATTER OF Plan Change 5 to the Canterbury Land & Water Regional Plan STATEMENT OF EVIDENCE OF ANDREW NEIL BURTT On behalf of BEEF + LAMB NEW ZEALAND Dated
LIVESTOCK AND CLIMATE CHANGE
 LIVESTOCK AND CLIMATE CHANGE The challenges of accounting for GHG emissions in livestock supply chain Dr Anne Mottet, Livestock Policy Officer, FAO-AGAL AnimalChange regional workshop, Nairobi, 2d and
Grain & Graze National Feedbase Project. Production vs ground cover tradeoffs in the Murrumbidgee region
 Grain & Graze National Feedbase Project Production vs ground cover tradeoffs in the Murrumbidgee region JM Lilley & AD Moore 18 May 2007 Enquiries should be addressed to: Dr Julianne Lilley CSIRO Plant
Effective Integration of Livestock & Cropping. Simon Vogt Rural Directions Pty Ltd
 Effective Integration of Livestock & Cropping Simon Vogt Rural Directions Pty Ltd Background MLA Profitable Integration of Cropping and Livestock project Currently collecting and analysing 100 x multi-year
Economics and GHG emissions of Irish cattle systems
 Economics and GHG emissions of Irish cattle systems Paul Crosson, E.G. O Riordan and M. McGee Livestock Systems Research Department, Animal & Grassland Research and Innovation Centre, Teagasc, Grange,
A.S.A. Johnstown Castle
 1 The challenge of sustainability for Irish Agriculture Karl Richards, Trevor Donnellan, Kevin Hanrahan, Laurence Shalloo, Mary Ryan, John Finnan, Pat Murphy, Gary Lanigan A.S.A. Johnstown Castle 16 January
Joint Submission from Beef + Lamb New Zealand and Deer Industry New Zealand to:
 Joint Submission from Beef + Lamb New Zealand and Deer Industry New Zealand to: The New Zealand Productivity Commission on the Low-emissions economy draft report - April 2018 21 June 2018 About the submitters
SHEEPMEAT & GRASSFED BEEF RD&A PRIORITIES Breeder productivity for sheep and cattle
 2018-19 SHEEPMEAT & GRASSFED BEEF RD&A PRIORITIES Breeder productivity for sheep and cattle Research, development and adoption activities that lead to a better understanding of, and develop tools or practices
Table 1: Key parameters, financial results and budget for the Waikato/Bay of Plenty intensive sheep and beef farm model
 FARM MONITORING 2012 WAIKATO/BAY OF PLENTY INTENSIVE SHEEP AND BEEF Key results from the Ministry for Primary Industries 2012 sheep and beef monitoring programme KEY POINTS Farmer confidence levels are
TABLE 3 SECTORAL REPORT FOR AGRICULTURE (Sheet 1 of 2)
") TABLE 3 SECTORAL REPORT FOR AGRICULTURE (Sheet 1 of 2) GREENHOUSE GAS SOURCE AND CO 2 CH 4 N 2 O NO x CO NMVOC SINK CATEGORIES 3. Total agriculture I. Livestock A. Enteric fermentation 1. Cattle Option
TABLE 3 SECTORAL REPORT FOR AGRICULTURE (Sheet 1 of 2) GREENHOUSE GAS SOURCE AND CO 2 CH 4 N 2 O NO x CO NMVOC SINK CATEGORIES 3. Total agriculture I. Livestock A. Enteric fermentation 1. Cattle Option
AGRICULTURE 4 AGRICULTURE CHAPTER 4. IPCC Guidelines for National Greenhouse Gas Inventories: Reference Manual
 4 AGRICULTURE CHAPTER 4 AGRICULTURE IPCC Guidelines for National Greenhouse Gas Inventories: Reference Manual 4 AGRICULTURE 4. AGRICULTURE 4. Overview Agricultural activities contribute directly to emissions
Mainstreaming GHG Mitigation and Adaptation across Irish Agriculture Gary Lanigan, Teagasc John Muldowney DAFM
 Mainstreaming GHG Mitigation and Adaptation across Irish Agriculture Gary Lanigan, Teagasc John Muldowney DAFM Agricultural Greenhouse Gas Research Initiative - Ireland Presentation Overview Background
Greenhouse Gases and Ammonia In Irish Agriculture Gary Lanigan, Patrick Forrestal, William Burchill, Owen Fenton and Karl Richards
 Greenhouse Gases and Ammonia In Irish Agriculture Gary Lanigan, Patrick Forrestal, William Burchill, Owen Fenton and Karl Richards Agri-Environment Meeting Tullamore 06/04/17 GHG & Ammonia Emissions Irish
Dry Matter Intake and Manure Production for Management Intensively Grazed Dairy Cattle
 Understanding Nutrient & Sediment Loss at Breneman Farms - 7 Introduction Dry Matter Intake and Manure Production for Management Intensively Grazed Dairy Cattle Fall 2009 Kevan Klingberg, Dennis Frame,
This article was presented on June 26, 1996 at the Purdue Hay Day.
 This article was presented on June 26, 1996 at the Purdue Hay Day. CUT FEED EXPENSES BY UTILIZING CORN RESIDUES, STOCKPILED PASTURE AND COVER CROPS 1 G. S. Premachandra, Keith D. Johnson, and Miles E.
LIVESTOCK AND CLIMATE CHANGE
 LIVESTOCK AND CLIMATE CHANGE The challenges of accounting for GHG emissions in livestock supply chain Dr Anne Mottet, Livestock Policy Officer, FAO-AGAL AnimalChange regional workshop, Campinas, 9-10 February
final report Herd Productivity
 final report Project code: B.PRS.0405 / PIRD.04.Q01 Prepared by: Chris Ollson Mt Surprise Beef Group Date published: March 2007 ISBN: 9781741918700 PUBLISHED BY Meat & Livestock Australia Limited Locked
Absolute emissions 1 (million tonnes CO 2 -eq) Average emission intensity (kg CO 2 -eq/kg product) Milk 2 Meat 2 Milk Meat Milk 2 Meat 2
 Average emission intensity (kg CO 2 -eq/kg product) Milk 2 Meat 2 Milk Meat Milk 2 Meat 2") 4. Results 4. Cattle This study estimates that in 25, total emissions from cattle production amount to 4 623 million tonnes C 2 -eq. These emissions include emissions associated with the production of
4. Results 4. Cattle This study estimates that in 25, total emissions from cattle production amount to 4 623 million tonnes C 2 -eq. These emissions include emissions associated with the production of
UNDER 16 MONTH BULL BEEF (SUCKLER)
") UNDER 16 MONTH BULL BEEF (SUCKLER) 1. SYSTEM DESCRIPTION (HIGH CONCENTRATE) Production of young bulls from the suckler herd which are slaughtered before they reach 16 months of age. These young bulls are
UNDER 16 MONTH BULL BEEF (SUCKLER) 1. SYSTEM DESCRIPTION (HIGH CONCENTRATE) Production of young bulls from the suckler herd which are slaughtered before they reach 16 months of age. These young bulls are
Sand (%) Silt (%) Clay (%)
 Silt (%) Clay (%)") Farmer name Farm Code Farm herd number Data year Annual rainfall (mm) N deposition (kg/ha) Longitude: Latitude: Dairy system characterization Calving pattern Milk produced All year round Manufacturing
Farmer name Farm Code Farm herd number Data year Annual rainfall (mm) N deposition (kg/ha) Longitude: Latitude: Dairy system characterization Calving pattern Milk produced All year round Manufacturing
What is the Greenhouse Gas Contribution from Agriculture in Alberta?
 What is the Greenhouse Gas Contribution from Agriculture in Alberta? The most recent GHG inventory estimated that in 2002 nationwide, agricultural related GHG emissions contributed about 59,000 kt (kilotonnnes)
FOOD FOR VICTORY * * * * * * * * * *
 FOOD FOR VICTORY * * * * * * * * * * - WHEAT TO MEAT HOGS, BEEF CATTLE, SHEEP By H. A. Lindgren * * * * * * * * * * Oregon State System of Higher Education Federal Cooperative Extension Service - Oregon
AB 32 and Agriculture
 AB 32 and Agriculture California's Climate Change Policy: The Economic and Environmental Impacts of AB 32 October 4, 2010 Daniel A. Sumner University of California Agricultural Issues Center OUTLINE Agriculture
Agriculture and Climate Change
 Agriculture and Climate Change in the UK 8 November 2010 Dr Mike Segal Deputy Chief Scientific Adviser & Director of Strategy and Evidence Group Overview The UK Climate Projections (June 2009) show that
7.0 - nutrient uptake, removal and budgeting
 7.0 - nutrient uptake, removal and budgeting - nutrient uptake - nutrient removal - nutrient budgeting 7.0 nutrient uptake, removal and budgeting NUTRIENT UPTAKE The generalised relationship between plant
Completing the Cool Farm Tool
 Completing the Cool Farm Tool FAO Climate Smart Agriculture Workshop. May 2013 Jon Hillier and Emma Keller (Unilever) 1 CFT structure and system requirements Excel based, compatible with all versions of
KYOTO PROTOCOL FOR NEW ZEALAND
 Economic implications of the KYOTO PROTOCOL FOR NEW ZEALAND sensitivity analysis abare e Report 03.11 Economic implications of the KYOTO PROTOCOL FOR NEW ZEALAND abare e Report 03.11 sensitivity analysis
Pasture Stick. Plate Meter. Estimating Dry Matter Intake. C-Dax Pasture Meter 3/31/2014
 Tuesday March 18, 2014 If you do not monitor it you can not manage it. Tools for monitoring pasture growth. Mat Haan Extension Dairy Educator Penn State Extension Berks County MANAGING PASTURE SURPLUS
Property Management Plan
 A. Landholder Our Place 2014 Property Management Plan Prepared by Burnett Catchment Care Association September 2014 This Property Management Plan was prepared by the Burnett Catchment Care Association
Tools for Carbon footprinting farm enterprises
 Tools for Carbon footprinting farm enterprises The system boundary: What s in and what s out? carbon footprints are actually greenhouse gas footprints Different tools apply different system boundaries
Agriculture & Business Management Notes...
 Agriculture & Business Management Notes... Using Partial Budgeting to Analyze Drought Management Strategies Quick Notes... To minimize financial hardship under drought conditions, partial budgeting is
Farmland and climate change: factors and lessons from farmed landscapes. ELO Biodiversity Conference Brussels 9 December 2015
 Farmland and climate change: factors and lessons from farmed landscapes ELO Biodiversity Conference Brussels 9 December 2015 Europe s environmental challenges Marginal agricultural areas Challenges: maintain