Phosphorus for the Ontario CCA 4R Nutrient Management Specialty
|
|
|
- Abner Richard
- 6 years ago
- Views:
Transcription


1 Ontario CCA 4R Nutrient Management Workshop Wednesday, 18 January 2017 Woodstock, Ontario, Canada Phosphorus for the Ontario CCA 4R Nutrient Management Specialty Tom Bruulsema, Phosphorus Program Director

2 Lake Erie - 20 July 2016


3 4R: right means sustainable
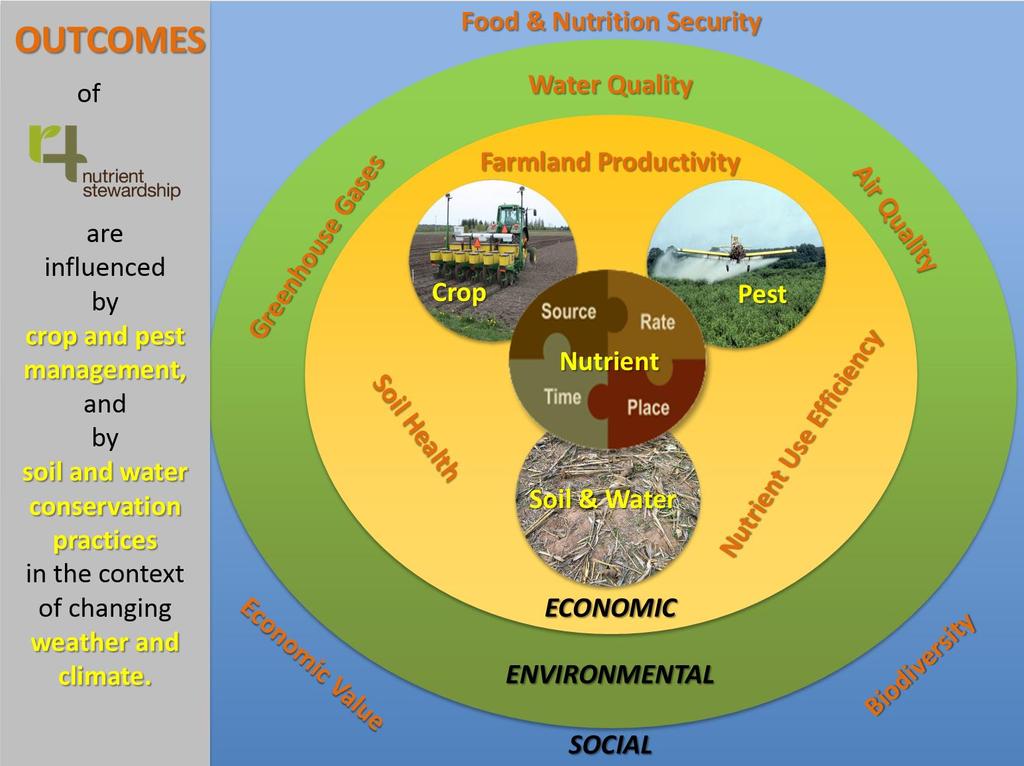
4 Nutrient Stewardship Metrics for Sustainable Crop Nutrition Enablers (process metrics) Outcomes (impact metrics) Extension & professionals Infrastructure Research & innovation Stakeholder engagement Actions (adoption metrics) Cropland area under 4R - requires regional definition of 4R 1. Farmland productivity 2. Soil health 3. Nutrient use efficiency 4. Water quality 5. Air quality 6. Greenhouse gases 7. Food & nutrition security 8. Biodiversity 9. Economic value
5
6 4R Adaptive Management for Plant Nutrition Policy Level Regulatory, Infrastructure, Product Development Regional Level Agronomic scientists, Agri-service providers Farm Level Producers, Crop advisers DECISION SUPPORT based on scientific principles Recommendation of right source, rate, time, and place (BMPs) DECISION Accept, revise, or reject ACTION Change in practice EVALUATION of OUTCOME Cropping System Sustainability Performance LOCAL SITE FACTORS Climate Policies Land tenure Technologies Financing Prices Logistics Management Weather Soil Crop demand Potential losses Ecosystem vulnerability
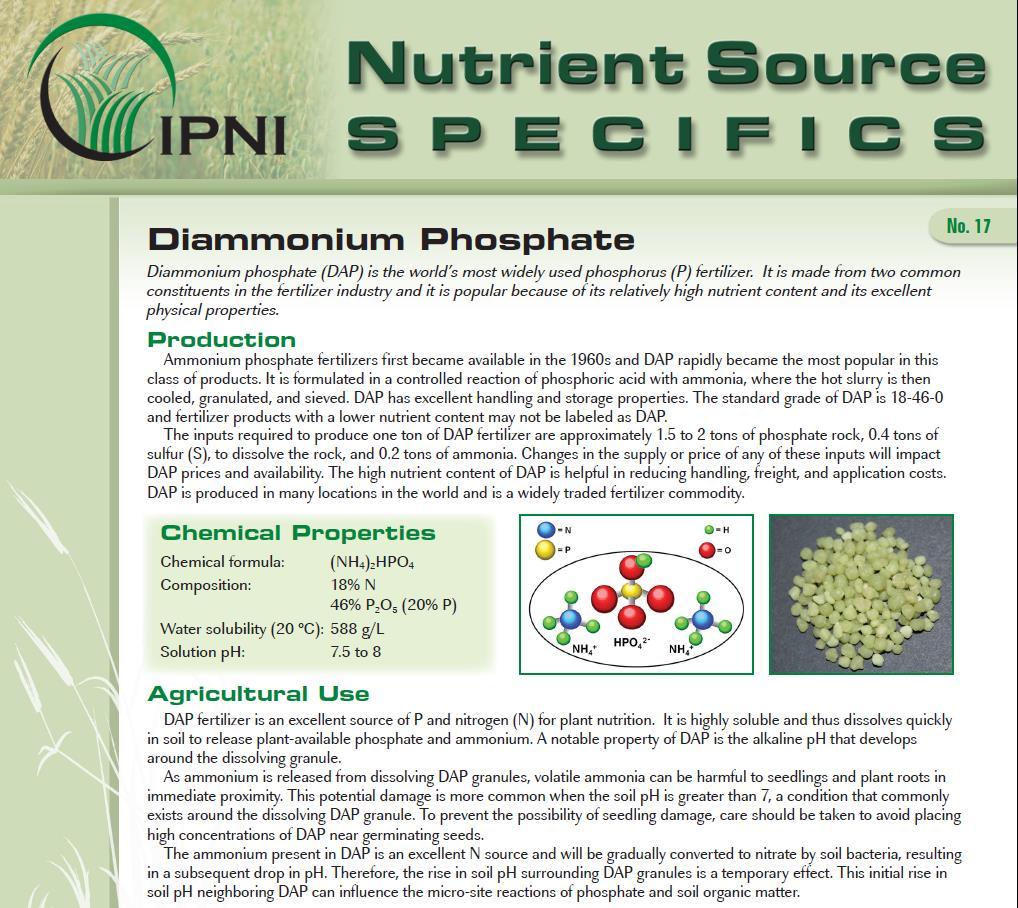
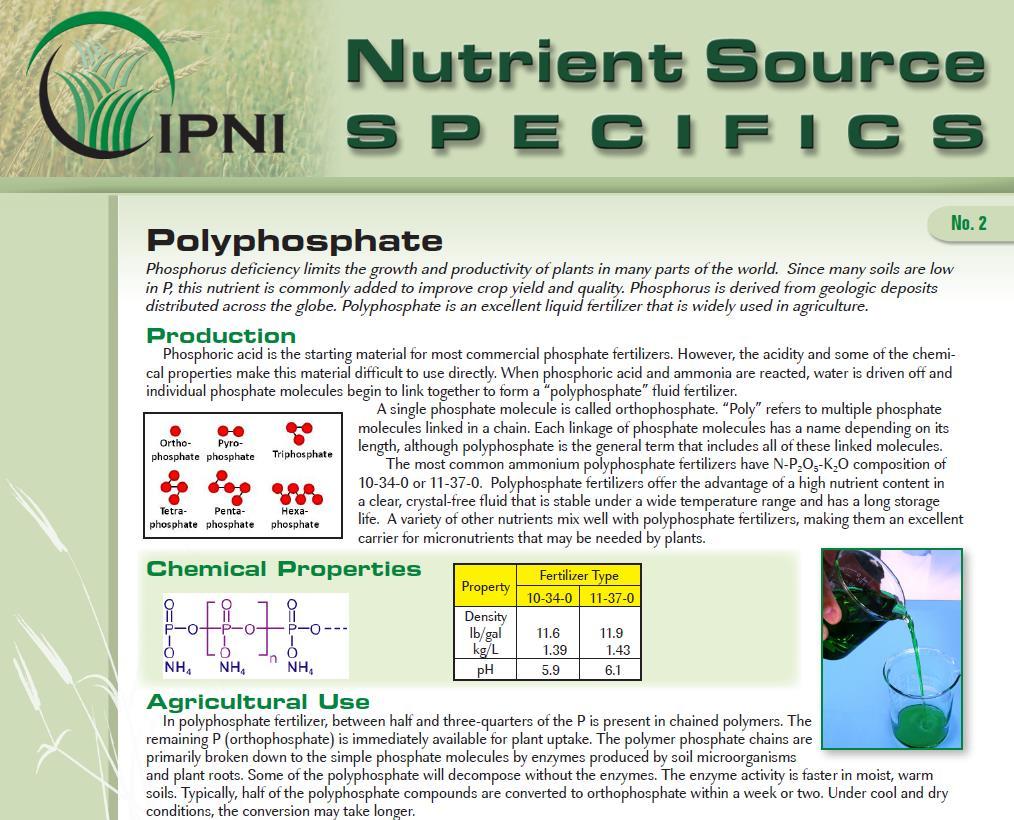
7 III Phosphorus starting page 78 in the Guide Performance Objective 1: Discuss the most common sources of phosphorus used in Ontario. MAP DAP APP TSP Biosolids Manure (Chris Brown and Trevor Robak)


8 Fertilizer P is Soluble P MAP ( ) has water solubility of 370 g/l = 84,000 mg P per litre In the soil solution, crops require 0.1 to 0.3 mg P per litre Maumee river target for DRP = mg P per litre
9
10


11 Concentrated Superphosphate (Triple superphosphate) Contains 46% P 2 O 5 P 2 O 5 4R PNM 3-20
12 Biosolids 1. Amount of P in biosolids is roughly equal to dietary P supply. 2. Total biosolids from sewage treatment in North America contains an equivalent of 8% of crop P removal. 3. Currently, half the biosolids are land applied, to less than 1% of the cropland. 4. Good source of zinc. 5. Low analysis sources: 1. Issues with bulk and transportability. 2. Accuracy of reported nutrient analysis guaranteed minimum does not apply well to bulk materials


13 Struvite crystallization is promising technology nutrient rich streams mixed with MgCl in a controlled chemical precipitation Precipitation reaction: Mg +2 NH 4+ PO 4-3 Removes up to 90% P and 20% N Low salt index and low heavy metal content Produces a slow-release N, P and Mg fertilizer Ostara Technology Crystal Green Mg
14 Performance Objective 2: Discuss considerations to determine the right source of phosphorus based on: crop type and cropping system; climate (temperature, precipitation, leaching, and runoff patterns); soil texture and the effect of soil ph; environmental concerns in the local area (surface and groundwater); crop stage.

15 Performance Objective 3: Interpret how soil test phosphorus levels relate to crop yield response and potential environmental impacts.
16 Soil test P and runoff P in Ontario STP DRP Six soil series, ten sites each, ranging in soil test P. Standardized runoff boxes, rainfall applied at 3 per hour for 30 minutes runoff. Wang et al., J. Environ. Qual. 39:
17 Soil test P and P leaching through Ontario soil columns
18 Ontario soil test P distribution 60% 40% 2001: 25% 16% 59% 20% 2015: 36% 19% 44% 0% >38 Soil Test P (Olsen), ppm

 (38)")
19 Phosphorus legacy differs by region (11) (23) (38) (Olsen)

20 Performance Objective 4: Evaluate how different soil test phosphorus extraction methods affect the interpretation of crop yield response and potential environmental impacts.

21 Soil test P extractants differ chemically
22 Ontario Soil Test P calibration 100% Relative yield 90% 80% 70% 60% Soil test P (ppm Olsen)
23

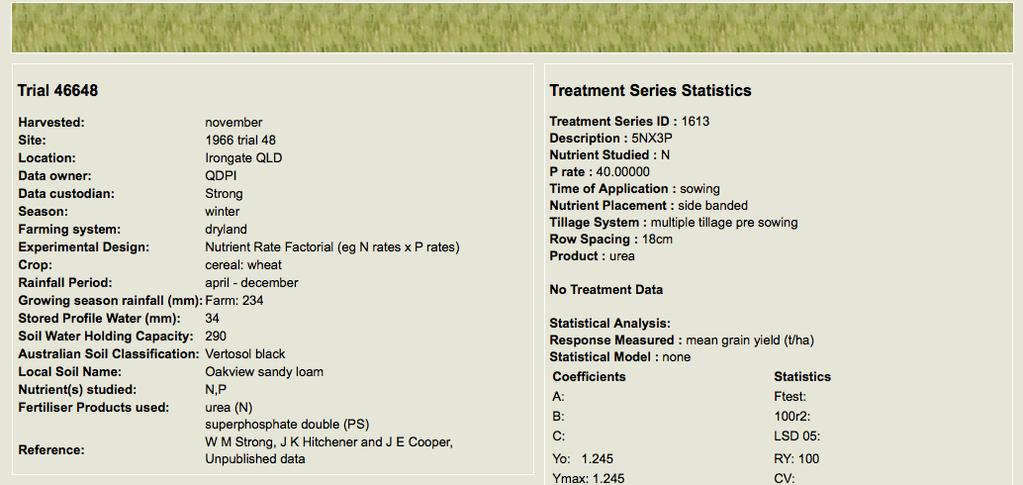

24 Australia Better Fertilizer Decisions for Crops
25 Performance Objective 5: Estimate the environmental risk of applying phosphorus above crop response optimums. Increases soil test P Risk can be assessed by Ontario P Index in NMAN Risk depends on placement, current soil test P, soil hydrology, slope, etc.
26 Performance Objective 6: Justify the considerations for phosphorus application rate based on: soil characteristics including leaching; topography and runoff; crop conditions, crop type, and growth stage. Sandy soils that leach N may not leach P P leaching generally only in P-saturated soils Macropore flow from surface to tile can deliver P Topography, soil texture influence runoff and erosion Match crop condition to expected removal Most P applied pre- or at planting. Exceptions: potatoes, forages.
27 Performance Objective 7: Calculate phosphorus credits from: previous phosphorus application Current STP = old STP + (P balance/25) [25 may be 37 or 50 depending on soil] Manure OMAFRA Pub 811: P2O5 = 2.29*P; available P = 40% of total P biosolids and other organic amendments NASM plan Limitations of minimum guarantee for registered products Wastewater Analysis for P Greenhouse nutrient feedwater O. Reg 300/14 OMAFRA, 2016
28 Performance Objective 8: Justify the potential need to adjust the phosphorus application rate based on legacy phosphorus and application method. Legacy P = that which has accumulated as a result of past human activity Reflected in soil test P Also present in stream banks and river sediments Application method: maximum safe rates for band-placed or in seed row.
29 Performance Objective 9: Discuss the importance of the following on phosphorus application timing: intensity of precipitation; type of precipitation; duration of precipitation; runoff. Broadcast applications of phosphorus sources should be avoided when substantial rainfall is imminent or forecast to occur before the material can be incorporated into the soil Late summer early fall Frozen or snow-covered soil
30 Performance Objective 10: Discuss the mechanisms of phosphorus loss to surface water. Particulate Soil erosion, from cultivated (tilled) fields Dissolved Surface runoff, from grass forest, or no-till soils
31 Performance Objective 11: Discuss reduction strategies and management for particulate phosphorus loss. Control soil erosion Prevent excessive buildup of soil test P Ontario P Index RUSLE 2.0 for Ontario - Agren s SoilCalculator - Sandra Cooke (Conservation Ontario) and Kevin McKague (OMAFRA)
32 12. Discuss reduction strategies and management for dissolved phosphorus loss. Manures and fertilizers contain soluble P. In contact with soil, soluble P is adsorbed, precipitated, retained. Without soil contact, soluble P dissolves in rainwater. Runoff risks vary with season Lower risk applying in late summer or early fall Cover crops, tillage and soil compaction can be managed to increase infiltration Drawdown of soil test P Drainage water management
33 13. Right Time Discuss how phosphorus contamination of surface water can occur from tile drainage due to timing of application. Macropores Cracking in clay Earthworm channels Bypassing the matrix Minimal sorption of dissolved P Avoid broadcasting P when there is >50% chance of intense rain
.")
34 Less P is lost with more time between broadcast and runoff Concentration of dissolved P in surface runoff from plots cropped to tall fescue during rainfall simulations that occurred 1 to 29 days after broadcast application of triple superphosphate fertilizer (Smith et al., 2007).
35 14. Right Place Discuss the importance of the following climate and weather phenomena to determine the optimal placement or method of application of phosphorus: a. intensity. b. type of precipitation. c. duration of precipitation. d. runoff.

36 Placing P in the soil reduces P loss from a single immediate runoff event Concentration of dissolved and total P in runoff from a clay loam soil in North Carolina, from artificial rainfall immediately following application of superphosphate fertilizer. Incorporation was to a depth of 5 inches by rotary tillage following application. Data from Tarkalson and Mikkelson (2004).
37 15. Discuss the relationship between tillage practices/system on phosphorus management. Stratification Mycorrhizae Soil temperature and moisture
38 Soil test P stratification Interaction of conservation tillage and right place samples M3P (ppm) :1 line Core depth (inches) Top M3P (0-2", ppm) :1 line 5-8 Dr. Laura T. Johnson, Heidelberg University, Ohio, USA Total M3P (0-8", ppm)
39 16. Discuss the considerations for phosphorus placement and method of application based on the risk of phosphorus runoff. Broadcast Incorporated Banded Spatial variability Agronomic Environmental Logistical
40 17. Plan the best placement or application method for phosphorus to minimize the transport of phosphorus offsite. 4R principles for right place Source, rate, and time Where are the roots? Concentrate to overwhelm soil sorption Erosion control by no-till Spatial variability Planning 1. Sustainability goals 2. Information 3. Field-specific plans 4. Implement 5. Monitor for effectiveness
41 18. Discuss how phosphorus contamination of surface water can occur from tile drainage due to placement and method of application. Acute risks: Phosphorus on the surface the first to come in contact with rain Liquid manure with large volume of water Chronic risk: conservation tillage and stratification. In both cases, water enriched in P can move through macropores to tile drains. Macropores: cracks, or earthworm channels
42 19. Discuss how to use drainage water management to reduce phosphorus nutrient losses to surface water Controlling the level of the soil water table Reduces total water drainage May increase or decrease dissolved P concentration Generally decreases loss 10-15% if combined with subirrigation (requires retention pond) Requires flat fields with minimal slopes.
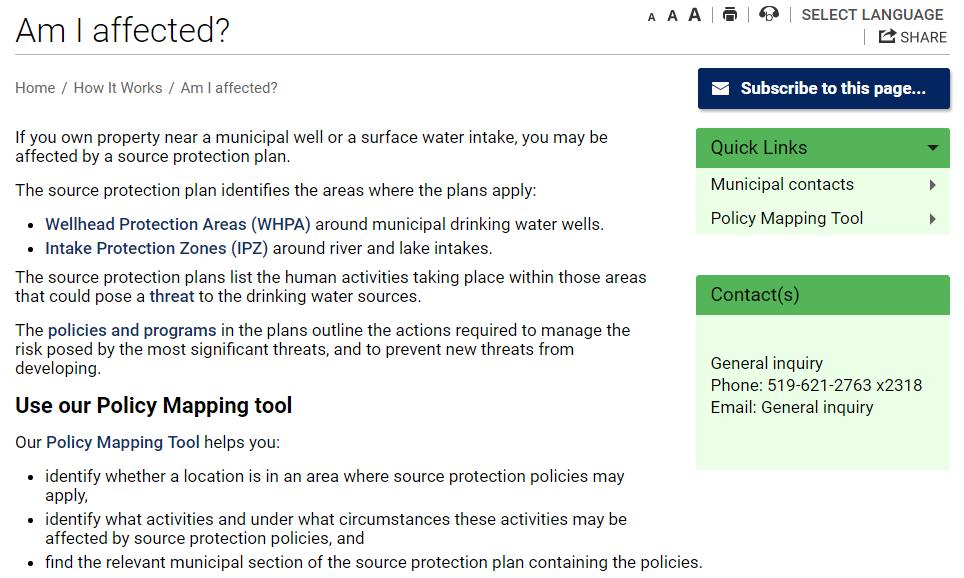
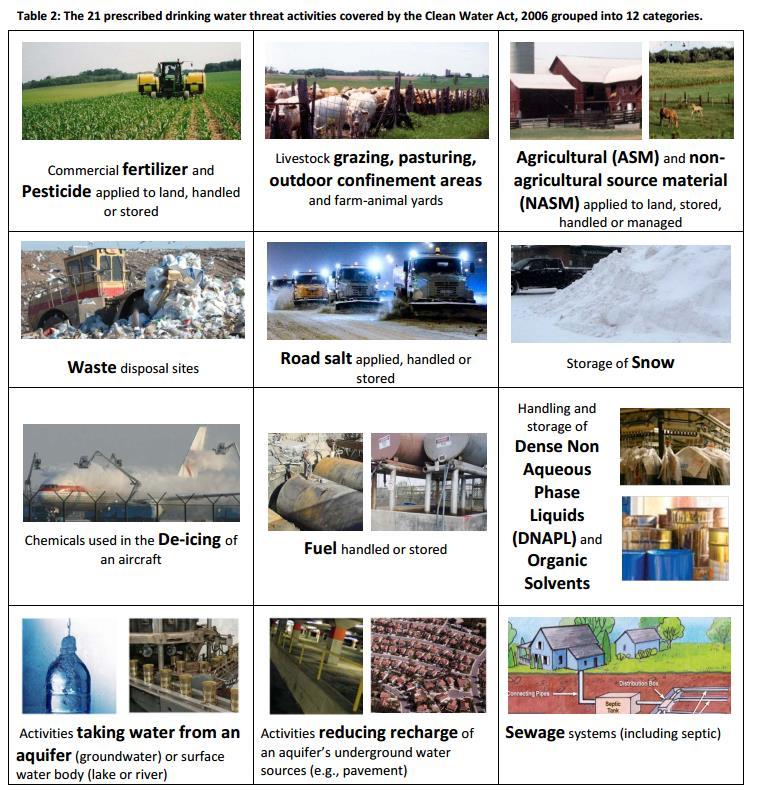
43 20: Discuss how to use water quality vulnerability assessment tools on a site specific basis for phosphorus nutrient planning. 22 source water protection plans in Ontario Risk management zones Restrictions on animal penning, manure storage, fertilizer use NMPs may be required or encouraged
44

45 Takes effect July
46
47
48 21. Evaluate phosphorus management decisions using a water quality vulnerability assessment Phosphorus Index USLE A = R x K x LS x C x P Water runoff class Soil hydrological group Max field slope within 150 m of surface water Soil test P Fertilizer rate and method Manure rate and method Application rate In relation to crop removal Setback distance
49 Ontario Phosphorus Index Phosphorus Index for Site < > 50 Generalized Interpretation of Phosphorus Index for Site Minimum Setback 1 from Surface Water if P 2 O 5 is applied up to crop removal 2 [ft (m)] Minimum Setback from Surface Water if P 2 O 5 is applied over crop removal [ft (m)] Very low potential for P movement from the site. If farming practices are maintained at the current level there is a small chance that P losses from this site will have an adverse impact on surface waters. 10 (3) 100 (30) Low potential for P movement from the site. The chance for an adverse impact to surface water exists. Some remedial action should be taken to lessen the potential for P loss if application is close to surface water. 10 (3) 100 (30) Moderate potential for P movement from the site and for an adverse impact on surface waters to occur unless remedial action is taken. In areas close to surface water, soil and water conservation along with P management practices are needed in order to reduce the risk of P movement and water quality degradation. 10 (3) 200 (60) High potential for P movement from site and for an adverse impact on surface waters. Remedial action is required to reduce the risk of P movement. All necessary soil and water conservation practices plus a P management plan must be put in place to avoid the potential for water quality degradation. 100 (30) Do not apply over crop removal
50 22. Be able to evaluate how changing a specific phosphorus management strategy will affect the outcome of a risk assessment Site Characteristic Soil Erosion Water Runoff Class Phosphorus Soil Test Management Practices that will Lower P Index Any practice to reduce soil erosion. In some instances, tile drainage installation may change the effective soil hydrologic group rating. The management of fertilizer and manure application methods/rates will control the rate at which the phosphorus level in the soil changes. Example of BMPs Reduce slope length; tillage to increase surface residue; plant cover crops; crop rotation, strip cropping, contour tillage. Tile drains may reduce runoff water volumes and thus lower risk of P loss in surface runoff. They also increase risk of P loss through tile drains by increasing connectivity. The phosphorus level of a field can be lowered on a long-term basis by reducing or eliminating application rates of manure/fertilizer and/or using crops with higher P removal capabilities.
51 Site Characteristic Commercial Fertilizer Application Rate Commercial Fertilizer Application Method Manure /Biosolid Application Rate Manure /Biosolid Application Method Management Practices that will Lower P Index Applying less fertilizer to a field will lower the level of phosphorus accordingly. The use of an application method that incorporates the fertilizer quickly and efficiently will result in a lower rating factor. Applying less manure to a field will lower the level of phosphorus accordingly. The use of an application method that incorporates the manure quickly and efficiently will result in a lower rating factor. Example of BMPs A reduction in the commercial fertilizer application rate from 60 lbs P 2 O 5 /acre to 30 lbs P 2 O 5 /acre will reduce the P Index by 1 point. By changing the application method from Non-Incorporated to Placed with Planter, the P Index is reduced by 10.5 points. A reduction in the manure/biosolid application rate from 60 lbs P 2 O 5 /acre to 30 lbs P 2 O 5 /acre will reduce the P Index by 3 points. Changing the application method from Non-Incorporated on Bare Soil to Injected will cause the P Index to be reduced by 10.5 points.
52 23. Evaluate management strategies, including modifying phosphorus transport processes, which will reduce phosphorus loss to surface water and groundwater Tile drainage Grassed borders and waterways Terraces WASCoBs water and sediment control basins Buffer strips Cover crops Furrow management Wetlands
53 24: Discuss how tillage system (including no-till) affects environmental losses of phosphorus. Tillage Acute effects reflected in Ontario P Index (USLE) Chronic effect of stratification is not
54 25: Compare the differences in the geographic scale, soil, topography, and location of watersheds (e.g. national, regional, local) on the environmental impacts of phosphorus on surface and groundwater resources. Scale streams, ponds, reservoirs, large rivers, lakes Soil texture & risk of runoff Topography Location (region)
55 26. Discuss the role of phosphorus, including legacy phosphorus, in the eutrophication process and the potential consequences of eutrophication Eutrophication Harmful algal blooms Hypoxia Legacy from past human activities Nutrients, land, water flows
56 Summary Sustainable Phosphorus Management 1. Key Challenge: Increasing BOTH crop productivity AND water quality 2. 4R Nutrient Stewardship It s not only up to scientists It s not only up to producers, advisers and ag retailers We all play a role 3. 4R Phosphorus Research Options available for source, rate, time and place, but practice change depends on quantified impacts Research continuing on edge-of-field impacts
Phosphorus for the Ontario CCA 4R Nutrient Management Specialty
 Ontario CCA 4R Nutrient Management Workshop Thursday, July 21, 2016 Holiday Inn, Guelph Phosphorus for the Ontario CCA 4R Nutrient Management Specialty Tom Bruulsema, Phosphorus Program Director Lake Erie
The 4Rs for the Lake Erie Watershed
 Ag Retailers Leading Improvements in Resource Management for Water Quality Toledo, OH 12 December 2013 The 4Rs for the Lake Erie Watershed Tom Bruulsema, Director, Northeast Region, IPNI Formed in 2007
4R Nutrient Stewardship Opportunities for Ontario
 Ontario Agri Business Association Crops Update London, Ontario 9 December 2014 4R Nutrient Stewardship Opportunities for Ontario Tom Bruulsema, Director, Northeast Region, IPNI Formed in 2007, the International
4R Phosphorus Management for Sustainable Crop Nutrition
 MVTL 2018 Agronomy Update New Ulm, MN February 1, 2018 4R Phosphorus Management for Sustainable Crop Nutrition Heidi Peterson Phosphorus Program Director Stillwater, Minnesota hpeterson@ipni.net The International
CCA 4R Nutrient Management Specialist Exam
 CCA 4R Nutrient Management Specialist Exam ONTARIO PERFORMANCE OBJECTIVES The American Society of Agronomy International Certified Crop Adviser Program Effective October 2015 Copyright 2015 The American
CCA 4R Nutrient Management Specialist Exam
 CCA 4R Nutrient Management Specialist Exam ONTARIO PERFORMANCE OBJECTIVES The American Society of Agronomy International Certified Crop Adviser Program Effective October 2015 Copyright 2015 The American
To 4R or Not to 4R Is There an Option?
 To 4R or Not to 4R Is There an Option? August 3, 2014 Setting the Stage for 4R Nutrient Stewardship in Ontario Phosphorus in the Great Lakes with the focus on the western basin of Lake Erie. Multiple Point
4R Nutrient Management Specialist Exam Region 4
 4R Nutrient Management Specialist Exam Region 4 PERFORMANCE OBJECTIVES The American Society of Agronomy International Certified Crop Adviser Program Effective December, 2015 Copyright 2015 The American
4R Nutrient Management Specialist Exam Region 6
 4R Nutrient Management Specialist Exam Region 6 PERFORMANCE OBJECTIVES The American Society of Agronomy International Certified Crop Adviser Program October 2017 Copyright 2017 The American Society of
The 4Rs of Nutrient Stewardship
 Livestock and Poultry Environmental Learning Center Educational Webcast Series 30 November 2012 The 4Rs of Nutrient Stewardship Tom Bruulsema, PhD, CCA Director, Northeast Region IPNI North America Formed
Precision Phosphorus Application for the Lake Erie Watershed
 St. Louis, MO 30-31 July 2014 Precision Phosphorus Application for the Lake Erie Watershed Tom Bruulsema, Director, Northeast Region, IPNI Formed in 2007 from the Potash & Phosphate Institute, the International
Modeling the Influence of Agricultural Practices on Watershed Export of Phosphorus
 Modeling the Influence of Agricultural Practices on Watershed Export of Phosphorus Rem Confesor Jr., Ph.D. Sr. Research Scientist NCWQR, Heidelberg University 310 E. Market St., Tiffin, OH rconfeso@heidelberg.edu
Phosphorus Product Properties for 4R Nutrient Stewardship. Tom Bruulsema, Phosphorus Program Director, IPNI
 Phosphorus Product Properties for 4R Nutrient Stewardship Tom Bruulsema, Phosphorus Program Director, IPNI The International Plant Nutrition Institute is supported by leading fertilizer manufacturers.
Reducing Phosphorus Loss to Lake Erie: Application & Timing of Nutrients. Ontario Ministry of Agriculture, Food and Rural Affairs (OMAFRA)
") Reducing Phosphorus Loss to Lake Erie: Application & Timing of Nutrients Ontario Ministry of Agriculture, Food and Rural Affairs (OMAFRA) Great Lakes Commission Joint Action Plan The Great Lakes Commission
Reducing Phosphorus Loss to Lake Erie: Application & Timing of Nutrients Ontario Ministry of Agriculture, Food and Rural Affairs (OMAFRA) Great Lakes Commission Joint Action Plan The Great Lakes Commission
La venue de ce conférencier a été rendue possible grâce au soutien financier du ministère de l Agriculture, des Pêcheries et de l Alimentation
 La venue de ce conférencier a été rendue possible grâce au soutien financier du ministère de l Agriculture, des Pêcheries et de l Alimentation Scientific Workshop «Management of Variability for the Optimization
Phosphorus Fertilizer Decisions
 Phosphorus Fertilizer Decisions Tom Bruulsema, Phosphorus Program Director Malcolm Stambaugh, Crop Specialist & Stewardship Advocate Alan Madison, Producer & Stewardship Advocate The International Plant
Introduction. Manure Management Facts Prioritization and Rotation of Fields for Manure Application. July 2014
 Manure Management Facts Prioritization and Rotation of Fields for Manure Application July 2014 Introduction Farmers apply synthetic fertilizer and manure to their land to replace the nutrients removed
Managing Phosphorus Cycling for Food Security
 Phosphorus as a Resource Sustainable Solutions for Infrastructure, Food Security and the Environment Ryerson University, Toronto, Ontario 19 June 2014 Managing Phosphorus Cycling for Food Security Tom
Best Management Practices to Minimize Nutrient Losses from Manured Fields. Hailin Zhang. Oklahoma State University
 Best Management Practices to Minimize Nutrient Losses from Manured Fields Hailin Zhang Oklahoma State University Pathways of P Transport Inputs Manure Outputs Fertilizer Erosion of particulate P NPK Release
beneficial management practices
 beneficial management practices introduction Phosphorus is an essential nutrient for crop growth. Alberta soils are generally deficient or low in phosphorus for optimum crop production (
GLASI GLASI. Priority Subwatershed Project. Great Lakes Agricultural Stewardship Initiative
 GLASI GLASI Great Lakes Agricultural Stewardship Initiative Priority Subwatershed Project Wigle Creek Priority Subwatershed Project Essex Region Conservation Authority Up to $75,000 per eligible farm business
New Practices for Nutrient Reduction: STRIPs and Saturated Buffers. Matthew Helmers and Tom Isenhart Iowa State University
 New Practices for Nutrient Reduction: STRIPs and Saturated Buffers Matthew Helmers and Tom Isenhart Iowa State University Situation Increasing concern for local and regional waters Substantial demand for
Strategies for Phosphorus Management on Cropland. Renee Hancock, NE NRCS State Water Quality Specialist
 Strategies for Phosphorus Management on Cropland Renee Hancock, NE NRCS State Water Quality Specialist Phosphorus Essential nutrient for growth of crops. Often needs to be applied to land for optimal crop
Nutrient Application Planning for Pastures with SnapPlus. and. The Wisconsin P Index
 Nutrient Application Planning for Pastures with SnapPlus and The Wisconsin P Index Laura Ward Good, UW-Madison Soil Science Department 2012 What s ahead: Wisconsin P Index P Index for pastures UW-Extension
FIELD PHOSPHORUS RISK ASSESSMENT
 NEBRASKA DEPARTMENT OF ENVIRONMENTAL QUALITY AGRICULTURE SECTION * 1200 N STREET, SUITE 400 * LINCOLN, NE 68509-8922 TEL: (402)471-4239 *FAX: (402) 471-2909 * WEB SITE: www.ndeq.state.ne.us APPENDIX F
Using No-till and Cover Crops to Reduce Phosphorus Runoff
 Using No-till and Cover Crops to Reduce Phosphorus Runoff How to Avoid SRP in Surface Water Dr. K. Rafiq Islam, Research Scientist Jim Hoorman, Assistant Professor, Agriculture and Natural Resources hoorman.1@osu.edu
December 2002 Issue # PHOSPHORUS MANAGEMENT ON HIGH PHOSPHORUS SOILS. Angela Ebeling, Keith Kelling, and Larry Bundy 1/ Introduction
 December 2002 Issue #12 2002 PHOSPHORUS MANAGEMENT ON HIGH PHOSPHORUS SOILS Angela Ebeling, Keith Kelling, and Larry Bundy 1/ Introduction Soil phosphorus (P) is important for crop production. Phosphorus
for Watershed Planning Laura Ward Good UW-Madison Soil Science Department February 8, 2011
 Wisconsin P Index Basics for Watershed Planning Laura Ward Good UW-Madison Soil Science Department February 8, 2011 Wisconsin P Index Basics for Watershed Planning What it is What makes it change How it
The Phosphorus Management Tool
 The Phosphorus Management Tool Heather Hutchinson Nutrient Management Specialist June 18, 2013 Understanding Phosphorus Why are soils high in phosphorus? Why is phosphorus a problem? How is phosphorus
NUTRIENT MANAGEMENT (ac.) CODE 590
 CODE 590") IG-590-1 NATURAL RESOURCES CONSERVATION SERVICE CONSERVATION PRACTICE INSTALLATION GUIDELINES NUTRIENT MANAGEMENT (ac.) CODE 590 GUIDELINES APPLICABLE FOR ALL PURPOSES Nutrient management activities shall
IG-590-1 NATURAL RESOURCES CONSERVATION SERVICE CONSERVATION PRACTICE INSTALLATION GUIDELINES NUTRIENT MANAGEMENT (ac.) CODE 590 GUIDELINES APPLICABLE FOR ALL PURPOSES Nutrient management activities shall
MANAGING PHOSPHORUS LOSSES. Rich. McDowell, AgResearch
 MANAGING PHOSPHORUS LOSSES Rich. McDowell, AgResearch BIOAVAILABILITY: N-, CO-, OR P-LIMITATION Co-Limited Co-Limited 14% 19% N-Limited 13% P-Limited 73% N-Limited 17% P-Limited 64% Where does it come
The soil is a very. The soil can. The manure. Soil Characteristics. effective manure treatment system if manures are applied at the proper rate.
 The soil is a very effective manure treatment system if manures are applied at the proper rate. The soil can filter pollutants and prevent them from reaching groundwater. The manure application rate should
Re: Recommendations for Regulating Phosphorus from Livestock Operations in Manitoba
 Manitoba Conservation Operations Division Headquarters Environmental Programs Box 46, 200 Saulteaux Crescent Winnipeg MB R3J 3W3 Telephone: (204) 945-8553 http://www.gov.mb.ca/conservation May 6, 2005
Appendix X: Non-Point Source Pollution
 Appendix X: Non-Point Source Pollution Sources Nonpoint source of pollution, unlike pollution from industrial and sewage treatment plants, comes from many different sources. Nonpoint source pollution is
PENNSYLVANIA PHOSPHORUS INDEX UPDATE
 PENNSYLVANIA PHOSPHORUS INDEX UPDATE Jennifer Weld Department of Ecosystem Science and Management, Penn State University 2017 Pennsylvania Inter-Agency Nutrient Management Annual Conference November 2,
Modeling Sediment and Nutrient Loads Input to Great Lakes and Effects of Agricultural Conservation Practices on Water Quality
 Modeling Sediment and Nutrient Loads Input to Great Lakes and Effects of Agricultural Conservation Practices on Water Quality C. Santhi and CEAP National Assessment Team Texas A&M University System, Temple,
4Rs for Healthy Soils & Healthy Waters
 4Rs for Healthy Soils & Healthy Waters C.S. Snyder, PhD, CCA Nitrogen Program Director, Conway, AR Healthy Soils and Healthy Waters Workshop Columbus, OH September15-16, 2014 www.ipni.net Acknowledging
EXTENSION Know how. Know now. EC195 (Revised August 2012)
") EXTENSION Know how. Know now. EC195 (Revised August 2012) The Nebraska Phosphorus Index (2012): Background And Users Guide Charles S. Wortmann, Extension Soils Specialist Charles A. Shapiro, Extension
EXTENSION Know how. Know now. EC195 (Revised August 2012) The Nebraska Phosphorus Index (2012): Background And Users Guide Charles S. Wortmann, Extension Soils Specialist Charles A. Shapiro, Extension
Cropping System Nutrient Management
 Cropping System Nutrient Management A Crop Advisor and Extension Specialist View Chris Snip Crop Sales Specialist Agris Co-op Cottam Jake Munroe Soil Fertility Specialist Field Crops OMAFRA Stratford Goals
Given the complexities, we must look at practice-based metrics in conjunction with performance-based metrics when assessing results
 May 24, 2017 Ms. Madhu Malhotra, Manager Ministry of the Environment and Climate Change Climate Change and Environmental Policy Division Land and Water Policy Branch 40 St. Clair Avenue West, Floor 10
Fertilizer Application Patterns and Trends, and Their Implications for Water Quality in the Western Lake Erie Basin
 Fertilizer Application Patterns and Trends, and Their Implications for Water Quality in the Western Lake Erie Basin Prepared by Great Lakes Science Advisory Board Science Priority Committee Fertilizer
Note: You must show your certification card. NRCS will verify your certification status
 USDA-NRCS Nutrient Management Planning Proficiency Areas and Performance Objectives for Certified Crop Advisers (CCAs) Certified Professional Agronomists (CPAg) Certified Professional Soil Scientist (CPSS)
MANURE MANAGEMENT IMPACTS ON PHOSPHORUS LOSS WITH SURFACE RUNOFF AND ON-FARM PHOSPHORUS INDEX IMPLEMENTATION. AN OVERVIEW OF ONGOING RESEARCH
 MANURE MANAGEMENT IMPACTS ON PHOSPHORUS LOSS WITH SURFACE RUNOFF AND ON-FARM PHOSPHORUS INDEX IMPLEMENTATION. AN OVERVIEW OF ONGOING RESEARCH Antonio P. Mallarino, professor Brett. L. Allen and Mazhar
4R Nutrient Stewardship for Florida Agriculture
 4R Nutrient Stewardship for Florida Agriculture Steve Phillips, Ph.D. Director, North American Program IFAS/UF In-service training Gainesville, FL February 25, 2015 4R Nutrient Stewardship The foundation
Dominant glacial landforms in the lower Great Lakes region exhibit different soil chemistry and potential risk of phosphorus loss
 Dominant glacial landforms in the lower Great Lakes region exhibit different soil chemistry and potential risk of phosphorus loss J. Plach, M. Macrae, M. Williams, B. Lee, and K. King JANINA PLACH University
Nutrient reduction strategies and ongoing research in Ohio
 Nutrient reduction strategies and ongoing research in Ohio Mark Williams & Kevin King USDA ARS Soil Drainage Research Unit, Columbus, OH 2014 SERA17 Meeting Des Moines, IA 2011 Phosphorus loading has been
Trends in phosphorus loads from agricultural watersheds in Lake Erie and the prevalence of soil P stratification. Laura Johnson
 Trends in phosphorus loads from agricultural watersheds in Lake Erie and the prevalence of soil P stratification Laura Johnson Heidelberg Tributary Loading Program Algal blooms returned to Lake Erie in
TECHNICAL NOTES U.S. DEPARTMENT OF AGRICULTURE NATURAL RESOURCES CONSERVATION SERVICE. TEXAS Revised December, 2012
 TECHNICAL NOTES U.S. DEPARTMENT OF AGRICULTURE NATURAL RESOURCES CONSERVATION SERVICE TEXAS Revised December, 2012 AGRONOMY TECHNICAL NOTE NUMBER 15 PHOSPHORUS ASSESSMENT TOOL For Texas BACKGROUND AND
Antonio Mallarino Professor, Department of Agronomy. Introduction
 2003 Integrated Crop Management Conference - Iowa State University 121 USING THE IOWA PHOSPHORUS INDEX FOR AGRONOMIC AND ENVIRONMENTAL MANAGEMENT OF FERTILIZER AND MANURE PHOSPHORUS Antonio Mallarino Professor,
P can runoff in stormwater and cascade downstream
 Multiple Benefits Michael Weintraub, Graham MacDonald, Laura Johnson, Phillip Haygarth, Tom Bruulsema, box Katrina Tiequan Zhang, Jianbo Shen, Paul Withers, Douglas Smith, AndrewText Sharpley, Macintosh,
LAND APPLICATION METHODS - SETBACKS
 LAND APPLICATION METHODS - SETBACKS Samuel Mullins ODA-DLEP Inspector 2017 Manure Science Review Ohio Regulatory Agencies Ohio Department of Agriculture Division of Livestock Environmental Permitting State
On-Field Ohio! Evaluate/Revise Ohio Phosphorus Risk Index. Elizabeth (Libby) Dayton, SENR, OSU Kevin King, USDA-ARS
 Dayton, SENR, OSU Kevin King, USDA-ARS") On-Field Ohio! Evaluate/Revise Ohio Phosphorus Risk Index Elizabeth (Libby) Dayton, SENR, OSU Kevin King, USDA-ARS OEPA Lake Erie Phosphorus Task Force One Major Finding Agriculture is a primary source
On-Field Ohio! Evaluate/Revise Ohio Phosphorus Risk Index Elizabeth (Libby) Dayton, SENR, OSU Kevin King, USDA-ARS OEPA Lake Erie Phosphorus Task Force One Major Finding Agriculture is a primary source
Modeling Sediment and Nutrient Loads Input to Chesapeake Bay and Effects of Agricultural Conservation Practices on Water Quality
 Modeling Sediment and Nutrient Loads Input to Chesapeake Bay and Effects of Agricultural Conservation Practices on Water Quality C. Santhi and CEAP National Assessment Team Texas A&M University System,
Modeling the Impacts of Agricultural Conservation Strategies on Water Quality in the Des Moines Watershed
 Modeling the Impacts of Agricultural Conservation Strategies on Water Quality in the Des Moines Watershed Presenter: Jeff Arnold, Supervisory Research Engineer, USDA-ARS C. Santhi, M. White, M. Di Luzio
Optimizing yield while minimizing phosphorus water quality impacts: Some do s and don ts
 13 Integrated Crop Management Conference - Iowa State University 165 Optimizing yield while minimizing phosphorus water quality impacts: Some do s and don ts Antonio P. Mallarino, professor and Extension
Re: Response to New Horizons: Ontario's Draft Agricultural Soil Health and Conservation Strategy
 Paul Smith December 31, 2017 Senior Policy Advisor Agricultural Soil Health and Conservation Strategy Ministry of Agriculture, Food and Rural Affairs 1 Stone Road West, 2 nd floor Guelph, ON N1G 4Y2 Re:
Role of Soils in Water Quality. Mike Marshall Extension Associate Texas A&M-Institute of Renewable Natural Resources
 Role of Soils in Water Quality Mike Marshall Extension Associate Texas A&M-Institute of Renewable Natural Resources Water Quality in Texas Water is a finite resource that can be impaired by pollution from
HOW CHANGES IN NUTRIENT MANAGEMENT REGULATIONS WILL AFFECT FORAGE PRODUCTION
 HOW CHANGES IN NUTRIENT MANAGEMENT REGULATIONS WILL AFFECT FORAGE PRODUCTION Dick Wolkowski and Larry Bundy Department of Soil Science University of Wisconsin What are the issues Forage producers typically
Vermont Phosphorus Index User Guide. version 6.0 October 2017
 Vermont Phosphorus Index User Guide version 6.0 October 2017 The Phosphorus Index is a tool developed to assess the potential for phosphorus runoff from individual fields based on soil and field characteristics
Missouri Concentrated Animal Feeding Operation Nutrient Management Technical Standard
 Missouri Concentrated Animal Feeding Operation Nutrient Management Technical Standard March 4, 2009 Division of Environmental Quality Water Protection Program I Introduction A. Authority and Purpose Missouri
Phosphorus Risk Assessment Index Evaluation Using Runoff Measurements
 Volume 8, Number 1 Phosphorus Risk Assessment Index Evaluation Using Runoff Measurements Bahman Eghball and John E. Gilley USDA-ARS, Lincoln, NE Introduction Manure and composted manure are valuable and
Western Lake Erie Watersheds
 Western Lake Erie Watersheds 7.1 Million Acres 70% Oh, 12% In, & 18% Mi About 76% Cropland, 3/4 Corn & Soybeans Maumee Drains 2/3 rds Area Average Annual Export From the Maumee WS is 1.1 Pounds of P per
Phosphorus Site Index Update University of Maryland Phosphorus Management Tool
 Phosphorus Site Index Update University of Maryland Phosphorus Management Tool Joshua M. McGrath Associate Professor Soil Fertility and Nutrient Management Specialist Laboratory for Agriculture and Environmental
NUTRIENT TRACKING TOOL
 NUTRIENT TRACKING TOOL A Cooperative Project Between Texas Institute for Applied Environmental Research (TIAER) USDA NRCS USDA ARS US EPA Funding support for this project was provided in part through a
Phosphorus Loading to Western Lake Erie: Trends and Sources
 Phosphorus Loading to Western Lake Erie: Trends and Sources Western Lake Erie Conference Toledo Yacht Club March 13, 28 Dr. David B. Baker National Center for Water Quality Research Heidelberg College
Degradation of the resource Fertility loss Organic matter Tilth degradation. Water quality Sediment Nutrients
 Near Blue River ca. 1980 Degradation of the resource Fertility loss Organic matter Tilth degradation Water quality Sediment Nutrients Program cost Cheaper to prevent Still expensive Long-term productivity
A Close Look at Lake Erie HABS and Current Research Efforts
 --- Ohio Water Environment Association --- OHIO SEA GRANT AND STONE LABORATORY A Close Look at Lake Erie HABS and Current Research Efforts Dr. Christopher J. Winslow Interim Director, Ohio Sea Grant College
Objective 1: Manage the demonstration site using common agricultural practices and monitor runoff quantity and quality.
 Appendix B Objectives/Tasks Accomplishments By J. Kjaersgaard, South Dakota State University. Objective 1: Manage the demonstration site using common agricultural practices and monitor runoff quantity
On-Field Ohio! Evaluate/Revise the Ohio P Risk Index using Field Scale Edge-of-Field Monitoring Data
 On-Field Ohio! Evaluate/Revise the Ohio P Risk Index using Field Scale Edge-of-Field Monitoring Data OSU: Libby Dayton, Chris Holloman, Shane Whitacre, Sakthi Subburayalu, Greg LaBarge, USDA-ARS: Kevin
Impact Metrics of 4R Nutrient Stewardship
 Manitoba Agronomists Conference Managing Crops to Maintain Markets 13 December 2017 Impact Metrics of 4R Nutrient Stewardship Tom Bruulsema, VP, Americas & Research, IPNI Allison Thomson, Field to Market
Bob Broz University of Missouri Extension
 Bob Broz University of Missouri Extension brozr@missouri.edu 573-882-0085 What is the purpose on the nutrient reduction committee? Reduce nutrient loading into the Mississippi River and into the Gulf of
Summary of Water Monitoring Data
 Clay County Drainage Site Summary of Water Monitoring Data 2011 2015 Introduction The Red River Valley in northwestern Minnesota is experiencing an increase in the amount of agricultural subsurface drainage
Nutrients From Cropland to Lake Erie: Perspectives from Detailed River Monitoring,
 Indiana Certified Crop Advisor Conference Indianapolis Marriot East Indianapolis, Indiana December 12, 2017 Nutrients From Cropland to Lake Erie: Perspectives from Detailed River Monitoring, 1975-2016
WASA Quiz Review. Chapter 2
 WASA Quiz Review Chapter 2 Question#1 What is surface runoff? part of the water cycle that flows over land as surface water instead of being absorbed into groundwater or evaporating Question #2 What are
FATE AND MANAGEMENT OF PHOSPHORUS IN AGRICULTURAL SYSTEMS. Andrew Sharpley
 FATE AND MANAGEMENT OF PHOSPHORUS IN AGRICULTURAL SYSTEMS Andrew Sharpley Blue Waters, Green Pastures, and the Elephant in the Room Today s presentation Why are we here? Source & transport Risk management
Annual P Loss Estimator (APLE)
") Annual P Loss Estimator (APLE) User-friendly Model for Annual, Field-Scale Phosphorus Loss Peter Vadas USDA-ARS Madison, WI Phosphorus input to water bodies continues to be an issue Agriculture continues
Annual P Loss Estimator (APLE) User-friendly Model for Annual, Field-Scale Phosphorus Loss Peter Vadas USDA-ARS Madison, WI Phosphorus input to water bodies continues to be an issue Agriculture continues
Nutrient Management for Vegetable Production
 Nutrient Management for Vegetable Production Richard Smith, Farm Advisor Monterey County Farm Water Quality Planning Project UC Cooperative Extension/ USDA Natural Resources Conservation Service Fertilizers
Part B: Phosphorus Loss Potential due to Management Practices and P Source Characteristics
 not suffer from such impacts. Surface waters having high water quality may require the implementation of policies and management practices to protect them from deterioration due to excess inputs of nutrients.
AGRONOMY 375 Exam II Key November 2, 2018
 1 AGRONOMY 375 Exam II Key November 2, 2018 3 pts 1. a) Latitude, previous crop residue, and soil drainage all influence soil temperature, which is critical in determining early season corn crop growth
Wisconsin s Improving Nutrient Management WI Dept. of Agriculture, Trade and Consumer Protection
 Wisconsin s Improving Nutrient Management Sue.Porter@WI.gov 608-224-4605 WI Dept. of Agriculture, Trade and Consumer Protection 2011 NM Highlights 1.8 M acres planned in 2011 up 23% 238 more farmers wrote
Saturated Buffer. Subsurface Drainage PURPOSE N REDUCTION LOCATION COST BARRIERS
 Saturated Buffer To intercept tile drainage prior to discharging to surface waters and redistribute the water laterally in the soil profile of the streamside buffer. Subsurface drainage, also known as
August 1994 Bulletin #XCM-175
 Best Management Practices For Phosphorus Fertilization August 1994 Bulletin #XCM-175 Principal author: In association with: Reagan M. Waskom Extension Water Quality Specialist Colorado State University
Evolution of P-Loss Risk Assessment Tools
 Evolution of P-Loss Risk Frank J. Coale Professor Agricultural Nutrient Management Specialist Department of Environmental Science & Technology College of Agriculture & Natural Resources University of Maryland
Soil and Water Conservation Research under Intensive Potato Production Systems in New Brunswick
 Agri-Food Soil and Water Conservation Research under Intensive Potato Production Systems in New Brunswick T. L. Chow 1, H.W. Rees 1, and J.-L, Daigle 2 Quebec New Brunswick Technical Exchange Workshop
Phosphorus Chemistry and Sequestration in Soil
 Phosphorus Chemistry and Sequestration in Soil Elizabeth (Libby) Dayton Research Scientist / Soil Environmental Chemistry School of Environment and Natural Resources Ohio State University Today s Presentation
Nutrient Management. The width of the buffer strip depends on slope, soil, runoff volume, sediment load and type of vegetation.
 Nutrient Management Goals of Nutrient Management Maximize economic return on nutrients Efficient use and conservation of nutrient resources Maintain or improve soil quality Maintain or improve water quality
This powerpoint has been adapted from a presentation at the Agronomy Society of America meetings in San Antonio, Texas in October 2011.
 This powerpoint has been adapted from a presentation at the Agronomy Society of America meetings in San Antonio, Texas in October 2011. More information is available in the following publication: Good,
Alum and Gypsum Treated Poultry Manure and Fertilizer Phosphorus Losses with Runoff with or without Incorporation into the Soil
 Alum and Gypsum Treated and Phosphorus Losses with Runoff with or without Incorporation into the Soil Final Project Report to the Iowa Egg Council Antonio P. Mallarino and Mazhar U. Haq Department of Agronomy,
A Presentation of the 2011 IA MN SD Drainage Research Forum. November 22, 2011 Okoboji, Iowa
 A Presentation of the 2011 IA MN SD Drainage Research Forum November 22, 2011 Okoboji, Iowa 1 Phosphorus Loss Through Subsurface Tile Drainage A.P. Mallarino, M.U. Haq, M.J. Helmers, R.S. Kanwar, C.H Pederson,
Northwest Regional Certified Crop Adviser
 Northwest Regional Certified Crop Adviser Performance Objectives Prepared by Northwest Regional CCA Board CONTENTS Introduction... iii Soil Fertility Competency Areas...1 1 Basic concepts of soil fertility...2
Should I be Concerned About High Soil Test Levels on my Farm?
 Should I be Concerned About High Soil Test Levels on my Farm? Ohio Swine Symposium, February 11, 2015 Greg LaBarge, Field Specialist Agronomic Systems Ohio State University Extension labarge.1@osu.edu
Phosphorus Update. Addy Elliott Colorado State University Department of Soil and Crop Sciences
 Phosphorus Update Addy Elliott Colorado State University Department of Soil and Crop Sciences Phosphorus Application Considerations In order to provide sufficient nutrients to crops while preserving water
Integrating erosion and phosphorus runoff assessment with nutrient management planning in SnapPlus
 Integrating erosion and phosphorus runoff assessment with nutrient management planning in SnapPlus L Laura Ward Good Department of Soil Science University of Wisconsin-Madison What is nutrient management
Modeling the Effects of Agricultural Conservation Practices on Water Quality in the Pacific Northwest Basin
 Modeling the Effects of Agricultural Conservation Practices on Water Quality in the Pacific Northwest Basin Presenter: R. Srinivasan, Professor, Texas A&M C. Santhi and CEAP National Assessment Team Texas
Phosphorus Site Index
 Phosphorus Site Index An Introduction Fundamentals of Nutrient Management June 2, 2010 Heather Hutchinson Nutrient Management Specialist University of Maryland Understanding Phosphorus Why are soils high
Using Paired Edge of Field Data to Assess Impacts of Management on Surface and Subsurface P Loss
 Using Paired Edge of Field Data to Assess Impacts of Management on Surface and Subsurface P Loss Kevin W. King, Mark R. Williams, and Norm R. Fausey USDA ARS Soil Drainage Research Unit Columbus, OH Edge-of-field
Land Application and Nutrient Management
 MODULE D Land Application and Nutrient Management Figure 34-13. Relationship between the concentration of dissolved P in subsurface drainage from 30 cm deep lysimeters and the Mehlich-3 extractable soil
Impact of Degree of Fertilizer and Manure Incorporation and Timing of First Runoff Event on Phosphorus Losses to Surface Runoff
 Impact of Degree of Fertilizer and Manure Incorporation and Timing of First Runoff Event on Phosphorus Losses to Surface Runoff Ivan O Halloran University of Guelph, Ridgetown, ON Context The 4R Nutrient
Environmental Consideration of Dairy Systems
 Environmental Consideration of Dairy Systems Phosphorus and Water Quality Neil Hansen, Colorado State University neil.hansen@colostate.edu Environmental Issues Agricultural nutrients in surface and ground
Watershed BMPs. Notes from NRCS online site on BMPs. Focus on key BMPs
 Notes from NRCS online site on BMPs http://www.nrcs.usda.gov/technical/standards/nhcp.html Focus on key BMPs Function, benefits, and drawbacks listed Definition Novotny & Olem: BMPs are methods and practices