SOUTHERN INDIANA 2008 FLOODS: DAMAGE ASSESSMENT AND WEB MAPPING
|
|
|
- Jewel Cummings
- 6 years ago
- Views:
Transcription
1 SOUTHERN INDIANA 2008 FLOODS: DAMAGE ASSESSMENT AND WEB MAPPING Ejaz Hussain KyoHyouk kkim Jie Shan, Associate Professor purdue.edu Tel: School Of Civil Engineering Purdue University Feb 18, 2009 Flooding along White River in Daviess County, Background photo (courtesy of J. & R. Armes) 1


2 Acknowledgement Images provided courtesy of USGS Croplands data layer courtesy National Agricultural Statistics Service, USDA Precipitation data courtesy National Weather Service Indiana GIS data courtesy Indiana map, IN.Gov 2
3 OUTLINE Flood development- rainfall data and pattern Methods Assessment Web mapping Conclusion 3
4 JUNE 2008 RAINFALL 30 th May,2008, 1-3 inches of rain caused light flooding in Wabash river 4 th -5 th June- 1-5 inches of rainfall developed into flooding in central and southern Indiana 6 th June another cycle of rain in central and eastern Illinois 7 th June, highest (official) rainfall of 9.5 inches in Center Point in Clay county June 1-7, 2008 about 7-10 inches of rain in Midwest Clay, Owen and Greene Counties This week-long rain caused flooding in the Wabash and White rivers Average June rainfall of 8 inches, about 4 inch above normal 4
5 JUNE 2008 FLOOD SEVERITY Disaster area State of emergency in 23 counties declared by the State Governor 39 counties of central Indiana declared as major disaster by the President of US About 51 counties were affected by the flood Initial Estimated loss of about 126 Million to 1 Billion $ 3 (three) persons dead 5
6 PRECIPITATION ON JUNE 1-7, 2008 Courtesy National Weather Service 6
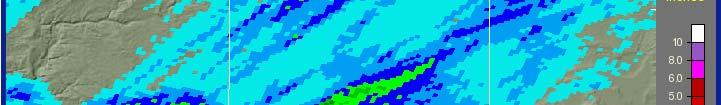
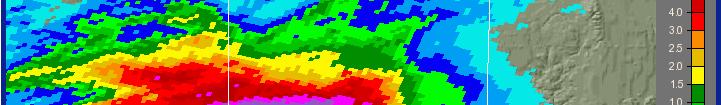
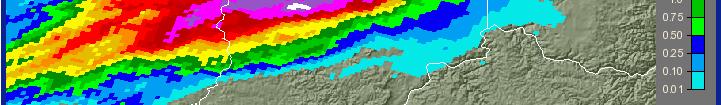
7 PRECIPITATION ON JUNE 7, 2008 Courtesy National Weather Service 7
8 STUDY AREA-USGS GAGE STATIONS ALONG RIVERS 8
9 Feet Water Levels for Wabash River Jun 8-Jun 10-Jun 10-Jun 10-Jun 12-Jun Clinton,IN Terre Haute,IN Riverton,IN Hutsonville,IL Vincennes,IN Mount Carmel,IL Gauge Stations Levelyear07 LevelYear 08 Flood Stage An average of about 12 feet water level increase in about five days Courtesy USGS Highest water level recorded Mt Carmel, IL June 14, feet ( remained 8 days above flood stage) 9
10 Fe eet Water Levels for White River Jun 9-Jun 12-Jun 10-Jun Spencer,IN Newberry,IN Above Peterburg,IN Peterburg,IN Gauge Stations Level year 07 Level Year 08 Flood Stage Courtesy USGS 10
11 DATASET Landsat TM and ETM+ Images, June 9, 2007 and June 11, 2008 Coverage: South West Indiana Resolution-30 M, 7 Bands (Used 6 bands) Four scene of the same area for each year MODIS Images Pre flood -May 28, 29 - Two scenes Post flood- June 8 to June 19, scenes( seven cloud covered) Resolution-500 m, 7 Bands USDA cropland data layer-2007 Indiana GIS data- county boundaries, rivers, streams and floodplains INDOT roads and streets data

12 STUDY AREA LANDSAT IMAGES LANDSAT TM_JUNE 09, 2007 LANDSAT TM_JUNE 09, 2007 LANDSAT TM- JUNE 11,
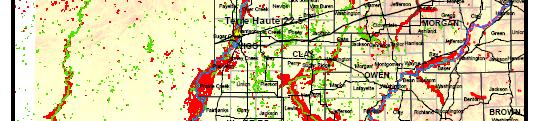
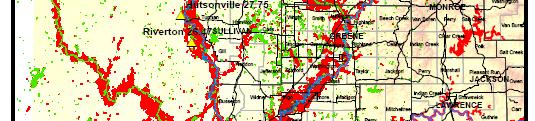
13 IMAGE CLASSIFICATION Two steps Analysis Segmentation-division of image into spatially continuous and homogeneous regions Classification-Classification of image objects rather than individual pixels, fuzzy rule based technique Use of spectral, contextual and texture features for classification Classification of 2007 and 2008 Landsat data Water, Vegetation, Open Area, Wet Areas and Built Up Areas For flood extent assessment Water No water 13
14 CLASSIFICATION RESULTS VIGO CLAY OWEN VIGO CLAY OWEN SULLIVAN GREENE SULLIVAN GREENE KNOX DAVIESS KNOX DAVIESS GIBSON PIKE GIBSON PIKE Miles Miles WATER_2007 WATER_
15 FLOOD EXTENT AND AFFECTED AREAS County Area (Hectares) Flooded area (Hectares) % Flooded area Vigo VIGO CLAY OWEN Clay Owen SULLIVAN GREENE Sullivan Greene KNOX DAVIESS Knox Daviess Pike GIBSON PIKE Total Flood area = 93,000 Hectares Excluding 2007 water Miles 15
16 16
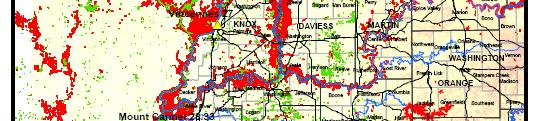
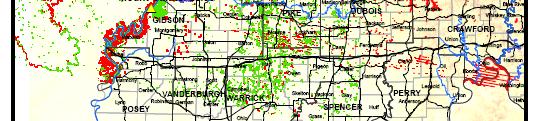
17 DAMAGE ASSESSMENT USDA CROPLAND DATA Prepared in collaboration of NASS USDA,FSA and participating State s Governments VIGO CLAY OWEN SULLIVAN Focus on Corn, Soybean and Cotton GREENE agricultural regions in participating states. Digital categorized geo-referenced data layer of major crops acreage Resource SAT-1 (AWiFS) Indian Remote Sensing Satellite Resolution-56 m, 4 bands KNOX DAVIESS PIKE GIBSON Miles 17

18 USDA CROPS DATA-2007 VIGO CLAY OWEN VIGO CLAY OWEN SULLIVAN GREENE SULLIVAN GREENE KNOX DAVIESS KNOX DAVIESS GIBSON PIKE GIBSON PIKE Miles Miles Corn Soybean Wheat Pasture Woods USDA Crops 2007 USDA Crops With_2008 Water Layer 18
19 CROPS DAMAGE ESTIMATE Assessment of damages to corn, soybeans, wheat, pasture/hay and forested area only Assumed the areas under same crops as in year 2007 and 100% planted before flood occurrence Results based on flood affected crops areas, not a measure of the degree of physical ldamage, some of these may recover but to what percentage? Degree of physical damages /recovery of crops will depend upon, Ponding time, Erosion, Partial or total submerge, Saturation period of soils/fields, ld Formation of dense surface crust, Deposition of mud on plants 19
20 CROP DAMAGE SUMMARY-NINE COUNTIES CROP S DAMAGE (%) IN THE INDIANA JUNE 2008 FLOOD % damage Vigo Clay Owen Sullivan Greene knox Daviess Pike Gibson Counties Corn Soybean Wheat Pasture,Hay,Grass Forest,Shrubs 7 7 An average of about 15% of corn and soybeans areas affected by floods 20
21 CROP DAMAGE SUMMARY-NINE COUNTIES Crops area under flood (Hectare) Pasture, Forest, County Corn Soybean Wheat Hay Shrubs Vigo Clay Owen Sullivan Greene Knox Daviess Pike Gibson Total Area
22 CROPS DAMAGE MAP VIGO CLAY OWEN SULLIVAN GREENE Corn Soybean Wheat Pasture Woods KNOX DAVIESS GIBSON PIKE Miles 22
23 FLOOD AFFECTED ROADS INDOT 2005 roads and streets data Roads passing through floodplains are mostly affected Flood affected roads includes, State Roads (SR 42, SR 246, SR 57, SR 157, SR 59) US Highway (US 231) County Roads and City streets 23
24 FLOOD AFFECTED ROADS VIGO CLAY OWEN VIGO CLAY OWEN SULLIVAN SULLIVAN GREENE GREENE KNOX DAVIESS KNOX DAVIESS PIKE GIBSON PIKE GIBSON Miles INDOT ROADS Miles FLOOD AFFECTED ROADS 24
25 FLOOD AFFECTED ROADS Km Vigo Clay Owen Sullivan Greene Knox Daviess Gibson Pike Counties Roads INDOT (km) Roads Under Flood (km) 25
26 pdf 26
27 FLOODPLAINS GENERAL VIGO CLAY OWEN VIGO CLAY OWEN SULLIVAN GREENE SULLIVAN GREENE KNOX DAVIESS KNOX DAVIESS GIBSON PIKE GIBSON PIKE Miles Miles FLOODPLAINS FLOOD WATER IN FLOODPLAINS Hectares FLOOD WATER OUT OF FLOODPLAINS Hectares
28 MODIS IMAGE FLOOD EXTENT VIGO CLAY OWEN SULLIVAN GREENE KNOX DAVIESS GIBSON PIKE Miles MODIS 2008 MODIS FLOOD WATER 28
29 COMPARISON-LANDSAT - MODIS FLOOD EXTENT Miles Miles LANDSAT FLOOD WATER MODIS FLOOD WATER 29
30 Web Mapping Uncountable information is being produced by governments, universities, companies and individuals. These data can be shared and published to the public very effectively with web-based technologies and web-gis. Google Earth plug-in (web version of Google Earth) was used because of its powerful visualization functionalities, easiness and cost-effectiveness. 30
31 Google Earth plug-in Released in the end of May, Most of Google Earth visualization functionalities can be embedded into one s own website. Google Earth plug-in add-on is installed on client computer. Javascript library (GE-API) is provided for customization. Currently support the following OS and browser: -Windows 2000, XP, Vista (IE 6.0+,FireFox2.0+, Flock 1.0+) -Apple Mac OS X 10.4 and higher (Safari 3.1+,Firefox 3.0+) Data is published in KML or KMZ formats. 31
32 Brief function list Display of background imagery (satellite & aerial) provided by Google Earth Display of predefined layers (terrain, borders, roads and 3D models) Placement of KML, KMZ and 3D models Creation and placement of geometry objects (placemark, line and polygon) Mouse and keyboard event management for customization and user interface 32
33 Web interface
34 Web interface 34
35 Web interface 35
36 Web interface
37 Web interface 37
38 Web interface 38
39 CONCLUSIONS Floods Highest recorded rainfall of 10 and average of 4 above normal in June Near historic flood water levels average of about 12 higher than flood stage, lasted for 6 to 8 days Damages in both Wabash and White rivers 93,000 hectares of flood affected area, 67,000 hectares of crops area An average of 15 % damage to both Corn and Soybeans 1080 km of roads length ( different segments) submerged under water, mostly the county roads Knox, Greene and Daviess are worst hit, both in flood affected area and roads damage 6,000 hectares of additional flood affected area beyond the floodplain Data and maps Timely availability on internet ( flood maps) helps to quickly visualize the disaster impact, to plan remedial measures and flood affected area residents can view and assess the amount of flooding and damages to their properties 39
40 URL s View Flood Map at dmaps A Google Earth view is available at Contact: Prof. Shan, jshan@purdue.edu Demonstration 40


41 41
Remote Sensing Uses in Agriculture at NASS
 Remote Sensing Uses in Agriculture at NASS United States Department of Agriculture (USDA) National Agriculture Statistics Service (NASS) Research and Development Division Geospatial Information Branch
Cropland Mapping with Satellite Data
 Cropland Mapping with Satellite Data Rick Mueller Head/Spatial Analysis Research USDA/National Agricultural Statistics Service Border-Area Water Management Remote Sensing Workshop Agenda Cropland Data
To provide timely, accurate, and useful statistics in service to U.S. agriculture
 NASS MISSION: To provide timely, accurate, and useful statistics in service to U.S. agriculture What does NASS do? Administer USDA s Statistical Estimating Program Conduct the 5-year Census of Agriculture
EVALUATING THE ACCURACY OF 2005 MULTITEMPORAL TM AND AWiFS IMAGERY FOR CROPLAND CLASSIFICATION OF NEBRASKA INTRODUCTION
 EVALUATING THE ACCURACY OF 2005 MULTITEMPORAL TM AND AWiFS IMAGERY FOR CROPLAND CLASSIFICATION OF NEBRASKA Robert Seffrin, Statistician US Department of Agriculture National Agricultural Statistics Service
Remote Sensing for Monitoring USA Crop Production: What is the State of the Technology
 Remote Sensing for Monitoring USA Crop Production: What is the State of the Technology Monitoring Food Security Threats from Space - A CELC Seminar Centurion, SA 21 April 2016 David M. Johnson Geographer
ArcGIS Agricultural Land-Use Maps: The Mississippi Cropland Data Layer Fred L. Shore, Ph.D., Thomas L. Gregory, and Rick Mueller
 ESRI Federal User Conference, 1/31/06-2/02/06, Washington, D.C. ArcGIS Agricultural Land-Use Maps: The Mississippi Cropland Data Layer Fred L. Shore, Ph.D., Thomas L. Gregory, and Rick Mueller Abstract:
Urban Monitoring of Spatial Development of Moscow State Region
 State Region Boris Feldman, NIiPI of Urban planning, Moscow, Russia Alexander Antonov, NIiPI of Urban planning, Moscow, Russia Roman Feldman, NIiPI of Urban planning, Moscow, Russia 1. Moscow Oblast According
Remote sensing applications in natural resources mapping and management An Indian Context
 Remote sensing applications in natural resources mapping and management An Indian Context International Workshop on Operational Mapping/Monitoring of Agricultural Crops in South/Southeast Asian Countries
Collaboration of Space Research Institute NASU-SSAU with EC JRC on satellite monitoring for food security: background and prospects
 Collaboration of Space Research Institute NASU-SSAU with EC JRC on satellite monitoring for food security: background and prospects Prof. Nataliia Kussul 1 Space Research Institute NASU-SSAU, Ukraine Context
Research and Conservation Opportunities Arising from a High Resolution LiDAR Mission for the Long Point Biosphere Reserve and Surrounding Region
 Research and Conservation Opportunities Arising from a High Resolution LiDAR Mission for the Long Point Biosphere Reserve and Surrounding Region Dr. Stewart J. Sweeney, Environmental Management Branch,
Expert Meeting on Crop Monitoring for Improved Food Security, 17 February 2014, Vientiane, Lao PDR. By: Scientific Context
 Satellite Based Crop Monitoring & Estimation System for Food Security Application in Bangladesh Expert Meeting on Crop Monitoring for Improved Food Security, 17 February 2014, Vientiane, Lao PDR By: Bangladesh
Utilization of the SWAT Model and Remote Sensing to Demonstrate the Effects of Shrub Encroachment on a Small Watershed
 Utilization of the SWAT Model and Remote Sensing to Demonstrate the Effects of Shrub Encroachment on a Small Watershed Jason Afinowicz Department of Biological and Agricultural Engineering Texas A&M University
4. Present Activities and Roles
 4. Present Activities and Roles The present missions, authorities, activities and roles of the various agencies involved with flood protection, floodplain management and flood-damage reduction are identified
Dynamic Maps of Open Surface Water Bodies in Oklahoma at 30- m Spatial Resolution during
 Dynamic Maps of Open Surface Water Bodies in Oklahoma at 30- m Spatial Resolution during 1984-2014 Xiangming Xiao Center for Spatial Analysis Earth Observation and Modeling Facility Department of Microbiology
Research projects of Landuse changes in Latvia
 Research projects of Landuse changes in Latvia Ilmars Krampis University of Latvia, faculty of Geography and Earth Science Juris Zariņš Latvian State Forest Research Institute "Silava" Joint NASA LCLUC
Groundwater and Agricultural Bioenergy
 Groundwater and Agricultural Bioenergy Feedstock Production Noel Gollehon Natural Resources Conservation Service, USDA 2011 Ground Water Protection Council Annual Forum Atlanta GA September 26, 2011 September
Assessment of Agricultural Flood Damages Along the James River in South Dakota
 Assessment of Agricultural Flood Damages Along the James River in South Dakota Ron S. Beyer Hydraulic Engineer Omaha District US Army Corps of Engineers 2007 Eastern South Dakota Water Conference October
Irrigation Impact and Trends in Kansas Agricultural 1
 Irrigation Impact and Trends in Kansas Agricultural 1 D.H. Rogers, G. A. Clark and M. Alam 2 Abstract: Total irrigated acreage in Kansas remains at approximately 3 million acres, which is about 15 percent
Estimating Soil Carbon Sequestration Potential: Regional Differences and Remote Sensing
 Estimating Soil Carbon Sequestration Potential: Regional Differences and Remote Sensing Tris West Environmental Sciences Division Technical Working Group on Agricultural Greenhouse Gases (T-AGG): Experts
Highway Surface Drainage
 Highway Surface Drainage R obert D. M iles, Research Engineer Joint Highway Research Project, and Assistant Professor of Highway Engineering, School of Civil Engineering Purdue University IN T R O D U
Image Classification I
 Image Classification I Classification is the process of labeling image pixels using predetermined categorical classes. Components: Image features Classification scheme Signatures Training Classifiers Classification
Use of Remote Sensing to Measure Land Use Change from Biofuel Production
 Studies assert that the conversion process of native ecosystems to agriculture for biofuel production may result in carbon releases from native biomass and negatively affect the greenhouse gas profile
NERIN-Fire activities (ongoing and future)
") NERIN-Fire activities (ongoing and future) T. Loboda 1, I. Csiszar 1, A. Terekhov 2, D. Ershov 3, E. Loupian 4,O. Ravsal 5 1 University of Maryland, USA; 2 Institute of Space Research, Kazakhstan; 3 Center
NERIN-Fire activities (ongoing and future) T. Loboda 1, I. Csiszar 1, A. Terekhov 2, D. Ershov 3, E. Loupian 4,O. Ravsal 5 1 University of Maryland, USA; 2 Institute of Space Research, Kazakhstan; 3 Center
Illinois in Drought. June 19, 2012, Updated June 21, 2012
 June 19,, Updated June 21, Illinois in Drought The ISWS now considers central and southern Illinois to be fully in drought based on several impacts including the early season onset of reservoir drawdown
Incorporating Ecosystem Services into Monarch. Buffer Strips. Habitat Restoration Planning using Riparian
 Incorporating Ecosystem Services into Monarch Habitat Restoration Planning using Riparian Buffer Strips Copyright: Google Images Copyright: Google Images Zachary H. Ancona and Darius J. Semmens U.S. Geological
Opportunities and challenges for monitoring tropical deforestation and forest degradation in dynamic landscapes using Sentinel-2!
 Sentinel-2 For Science Workshop 20-22 May, 2014 ESA-ESRIN Frascati Opportunities and challenges for monitoring tropical deforestation and forest degradation in dynamic landscapes using Sentinel-2 Dirk
Efficient Fertilizer Use Soil Sampling for High Yield Agriculture: by Dr. Harold Reetz
 SECTION CONTENTS: Soil Sampling Sampling Procedures Sampling Patterns Options Auxiliary Data Layers Sampling Under Different Tillage Systems Identifying Missed Opportunities Through Intensive Sampling
FOREST COVER MAPPING AND GROWING STOCK ESTIMATION OF INDIA S FORESTS
 FOREST COVER MAPPING AND GROWING STOCK ESTIMATION OF INDIA S FORESTS GOFC-GOLD Workshop On Reducing Emissions from Deforestations 17-19 April 2007 in Santa Cruz, Bolivia Devendra PANDEY Forest Survey of
DMC 22m Sensors for Supertemporal Land Cover Monitoring. Gary Holmes DMC International Imaging Ltd June 2014
 DMC 22m Sensors for Supertemporal Land Cover Monitoring Gary Holmes DMC International Imaging Ltd June 2014 DMC 2 nd Generation Satellites UK-DMC2 and Deimos-1 launched 29 th July 2009 650km swath width
Identification of Agricultural Crops by Computer Processing of ERTS MSS Data
 Purdue University Purdue e-pubs LARS Technical Reports Laboratory for Applications of Remote Sensing 1-1-1973 Identification of Agricultural Crops by Computer Processing of ERTS MSS Data Marvin E. Bauer
Object-oriented Classification and Sampling Rate of Landsat TM Data for Forest Cover Assessment. Yasumasa Hirata 1, Tomoaki Takahashi 1
 Object-oriented Classification and Sampling Rate of Landsat TM Data for Forest Cover Assessment Yasumasa Hirata 1, Tomoaki Takahashi 1 1 Forest Management Department, Forestry and Forest Products Research
Need Additional Information? LEGAL DISCLAIMER ACKNOWLEDGEMENT:
 LEGAL DISCLAIMER This work was implemented as part of the CGIAR Research Program on Climate Change, Agriculture and Food Security (CCAFS) hosted by BISA-CIMMYT in South Asia. The views expressed in this
LAKE COUNTY HYDROLOGY DESIGN STANDARDS
 LAKE COUNTY HYDROLOGY DESIGN STANDARDS Lake County Department of Public Works Water Resources Division 255 N. Forbes Street Lakeport, CA 95453 (707)263-2341 Adopted June 22, 1999 These Standards provide
Objectives of the Study
 Integration of AGNPS, GIS, and Remote Sensing for Estimating Nonpoint Source Pollution in the Saginaw Bay, Michigan Chansheng He Department of Geograophy Western Michigan University Kalamazoo, MI 49008
North Appalachian Expermental Watershed
 WatershedWiki Hydrology-(CEE-434/534) North Appalachian Expermental Watershed Sagar Gautam 1 Table of Content Abstract Introduction Description of the study area Method/Procedures Approach Results Disscussion
Identification of Crop Areas Using SPOT 5 Data
 Identification of Crop Areas Using SPOT 5 Data Cankut ORMECI 1,2, Ugur ALGANCI 2, Elif SERTEL 1,2 1 Istanbul Technical University, Geomatics Engineering Department, Maslak, Istanbul, Turkey, 34469 2 Istanbul
Dynamics and Drivers of Land Cover & Land Use Changes in Bangladesh Integration of Satellite Data with Socioeconomic Dataset
 LC/LUC and Impacts on Environment in SSEA Intl. Regional Science Team Meeting Philippines, May 28-30, 2018 Dynamics and Drivers of Land Cover & Land Use Changes in Bangladesh Integration of Satellite Data
INTRODUCTION cont. INTRODUCTION. What is Impervious Surface? Implication of Impervious Surface
 Mapping Impervious Surface Changes In Watersheds In Part Of South Eastern Region Of Nigeria Using Landsat Data By F. I. Okeke Department of Geoinformatics and Surveying, University of Nigeria, Enugu Campus
Forest and land cover change detection is one of the major applications of satellite-based remote
 4.3 Trend, Nature and Rate of Forest Cover Change 4.3.1 Extent of Ikhoho Forest Cover in the year 2000 and to 2010 Forest and land cover change detection is one of the major applications of satellite-based
JECAM and the Manitoba Super Site
 JECAM and the Manitoba Super Site GEO-DRI Drought Monitoring Workshop May 10 & 11, 2010 Grant Wiseman, M.Sc. AAFC, AESB, Winnipeg, Canada grant.wiseman@agr.gc.ca Joint Experiments on Crop Assessment and
Integrating Agricultural Land Management into a Watershed Response Model
 Integrating Agricultural Land Management into a Watershed Response Model Adam Freihoefer, Tom Beneke, & Aaron Ruesch Wisconsin Department of Natural Resources NCASI Northern Region Meeting May 6, 2014
Satellite image classification of vegetation and surface water for assessment of flood damage to agricultural crops
 Satellite image classification of vegetation and surface water for assessment of flood damage to agricultural crops Lisa Colson 2, Mark Lindeman 1, Dath Mita 1, Tatiana Nawrocki 2, Paulette Sandene 1,
Emerging Technologies and Methods in Earth Observation for Agricultural Monitoring Feb. 13, 2018 National Agricultural Library
 State of the Practice, USDA-FAS Perspective 1 Emerging Technologies and Methods in Earth Observation for Agricultural Monitoring Feb. 13, 2018 National Agricultural Library USDA Bob Tetrault: Deputy Director,
Agricultural Trip Generation - Linking Spatial Data and Travel Demand Modeling using SAS
 MWSUG 2017 Paper AA18 Agricultural Trip Generation - Linking Spatial Data and Travel Demand Modeling using SAS Alan Dybing, North Dakota State University UGPTI, Fargo, ND ABSTRACT Data linkages from GIS
Using Open Data and New Technology To Tackle the Greening of the CAP from a broader perspective
 Using Open Data and New Technology To Tackle the Greening of the CAP from a broader perspective Prague, 21 st of October Marcel Meijer & Jeroen van de Voort Outline Setting the scene Open Data related
Production of the Missouri Land Cover Data Layer Brief Notes 1/00 DRAFT
 Production of the Missouri Land Cover Data Layer Brief Notes 1/00 DRAFT This land cover data layer was derived from Thematic Mapper (TM) satellite data from 1991, 1992, and 1993 (listed below). For most
Mangrove deforestation analysis in Northwestern Madagascar Stage 1 - Analysis of historical deforestation
 Mangrove deforestation analysis in Northwestern Madagascar Stage 1 - Analysis of historical deforestation Frédérique Montfort, Clovis Grinand, Marie Nourtier March 2018 1. Context and study area : The
Climate Data and Drought Research
 Climate Data and Drought Research Can NLWIS Help the Drought Research Initiative? A. Howard: Agriculture and Agri-Food Canada What is the National Land and Water Information Service? An across-canada,
Mapping smallholder agriculture using simulated Sentinel-2 data; optimization of a Random Forest-based approach and evaluation on Madagascar site
 Mapping smallholder agriculture using simulated Sentinel-2 data; optimization of a Random Forest-based approach and evaluation on Madagascar site Lebourgeois, V., Dupuy, S., Vintrou, E., Ameline, M., Butler,
COMPARATIVE STUDY OF NDVI AND SAVI VEGETATION INDICES IN ANANTAPUR DISTRICT SEMI-ARID AREAS
 International Journal of Civil Engineering and Technology (IJCIET) Volume 8, Issue 4, April 2017, pp. 559 566 Article ID: IJCIET_08_04_063 Available online at http://www.iaeme.com/ijciet/issues.asp?jtype=ijciet&vtype=8&itype=4
AIMS pilot project. Monitoring the rehabilitation of degraded landscapes from Food Assistance for Assets programmes with satellite imagery
 Fighting Hunger Worldwide AIMS pilot project Monitoring the rehabilitation of degraded landscapes from Food Assistance for Assets programmes with satellite imagery September 2017 BEFORE road construction
Figure Zimbabwe Crop Assessment Route
 1 of 8 June 2, 2009 Satellite Imagery Indicates 2009 Corn Area in Zimbabwe Is Less Than Corn Area in 2000 USDA s Foreign Agricultural Service (FAS) performed a mid-season crop assessment in Zimbabwe from
APPENDIX B. If the GRANIT Data Mapper gets stuck during an operation, use the refresh button in your browser.
 APPENDIX B ANSWERING QUESTIONS THAT REQUIRE THE GRANIT DATA MAPPER ONLINE TOOLS AND PRINTED MAPS (Remaining questions are answered during field checking) Each of the questions in the table on the following
Rapid Land Use and Land Cover Database Development
 Rapid Land Use and Land Cover Database Development Utility of the Land Use and Land Cover Database Socio-Economic Climate Change Water Quantity Water Quality 2 Overview of the Mapping Approach Goal: Develop
GFW Frequently Asked Questions
 10 G Street, NE Suite 800 Washington, DC 20002 USA (PH) +1 (202) 729-7600 www.wri.org GFW Frequently Asked Questions GFW overview What is Global Forest Watch? Global Forest Watch (GFW) is a dynamic online
ACE 427 Spring Lecture 9. USDA Crop Reports. by Professor Scott H. Irwin
 ACE 427 Spring 2013 Lecture 9 USDA Crop Reports by Professor Scott H. Irwin Required Readings: Good, Darrel L. and Scott H. Irwin. USDA Corn and Soybean Acreage Estimates and Yield Forecasts: Dispelling
CropWatch Introduction and Crop Area Estimation
 CropWatch Introduction and Crop Area Estimation Bingfang Wu wubf@irsa.ac.cn Institute of Remote Sensing and Digital Earth (RADI) Chinese Academy of Sciences (CAS) 4 scales Global (60 CPSZs) 6 MPZs 31 key
Outline of Presentation
 2017 Crop Outlook David Widmar, Sr. Research Associate, Center for Commercial Agriculture Chris Hurt, Professor, Department of Agricultural Economics 2017 Crop Outlook Webinar July 3, 2017 Outline of Presentation
CHANGES ON FLOOD CHARACTERISTICS DUE TO LAND USE CHANGES IN A RIVER BASIN
 U.S.- Italy Research Workshop on the Hydrometeorology, Impacts, and Management of Extreme Floods Perugia (Italy), November 1995 CHANGES ON FLOOD CHARACTERISTICS DUE TO LAND USE CHANGES IN A RIVER BASIN
system that supports soil and crop water management.
 NEWS ON IRRIGATING THE SOIL TO MAXIMIZE THE CROP AN APPROACH FOR WHEAT TO EFFICIENT AND ENVIRONMENTALLY SUSTAINABLE IRRIGATION WATER MANAGEMENT IN KENTUCKY Ole Wendroth, Javier Reyes, Xi Zhang, and Chad
Kansas Irrigated Agriculture s Impact on Value of Crop Production
 Paper No. MC03-301 An ASAE Meeting Presentation Kansas Irrigated Agriculture s Impact on Value of Crop Production by Danny H. Rogers Professor Biological & Agricultural Engineering Department Kansas State
Project Brief: Small Forestland Owner Parcel Identification and County GIS Data Compilation for Washington State WRIAs 23 & 49
 Project Brief: Small Forestland Owner Parcel Identification and County GIS Data Compilation for Washington State WRIAs 23 & 49 Prepared For: Mary McDonald Program Director Small Forest Landowner Office
Role of Remote Sensing in Flood Management
 Role of Remote Sensing in Flood Management Presented by: Victor Veiga (M.Sc Candidate) Supervisors: Dr. Quazi Hassan 1, and Dr. Jianxun He 2 1 Department of Geomatics Engineering, University of Calgary
Assessment and mapping of GRASSLAND ecosystems condition and their services in Bulgaria, Contr. Д-33-90/
 1 General typology of grassland ecosystems We consider Grassland ecosystem as a natural or seminatural vegetation type. It could be part of farm holdings like pastures, meadows, uncultivated lands, etc.
Landscape-Scale Postfire Vegetative Condition Monitoring Using Multi- temporal Landsat Imagery on the Cerro Grande Fire
 Landscape-Scale Postfire Vegetative Condition Monitoring Using Multi- temporal Landsat Imagery on the Cerro Grande Fire RS 2006 : April 27, 2006 Salt Lake City, UT Jess T. Clark Remote Sensing Applications
AGRICULTURE & FOOD SECURITY. The Rangelands Decision Support Tool. Vegetation & Surface Water Monitoring
 AGRICULTURE & FOOD SECURITY The Rangelands Decision Support Tool Vegetation & Surface Water Monitoring Lilian Ndungu James Wanjohi Pasture Image Courtesy of Oxfam at https://commons.wikimedia.org/wiki/file:oxfam_east_africa_-_somalilanddrought011.jpg
Estimating Groundwater Recharge within Wisconsin s Central Sands
 Estimating Groundwater Recharge within Wisconsin s Central Sands Adam Freihoefer and Robert Smail Wisconsin Department of Natural Resources [study objective] Identify a defensible approach to quantify
A Hydrologic Study of the. Ryerson Creek Watershed
 A Hydrologic Study of the Ryerson Creek Watershed Dave Fongers Hydrologic Studies Unit Land and Water Management Division Michigan Department of Environmental Quality May 8, 2002 Table of Contents Summary...2
FOR SALE. Contact: Panola & Quitman Counties, Miss. Total Size Location. Description. Cropland Soils Improvements
 Spring Hill Farm 1,221.08 +/- ac. Panola & Quitman Counties, Miss. Total Size Location Description Cropland Soils Improvements 1,221.08+/- tax ac.; 1,223.21+/- FSA farmland ac.; 1,138.74+/- FSA cropland
SPACE MONITORING of SPRING CROPS in KAZAKHSTAN
 SPACE MONITORING of SPRING CROPS in KAZAKHSTAN N. Muratova, U. Sultangazin, A. Terekhov Space Research Institute, Shevchenko str., 15, Almaty, 050010, Kazakhstan, E-mail: nmuratova@mail.ru Abstract The
Urban Ecosystem Analysis Roanoke, Virginia
 June 2002 Urban Ecosystem Analysis Roanoke, Virginia Calculating the Value of Nature Report Contents 2-3 Project Overview 4 Major Findings 5 Roanoke Area Green Data Layer 6 Tree Canopy Loss Over Time 7
MINIMIZING THE RISK OF MANURE RUNOFF THIS FALL/WINTER. Nichole Embertson, Ph.D. Whatcom Conservation District
 MINIMIZING THE RISK OF MANURE RUNOFF THIS FALL/WINTER Nichole Embertson, Ph.D. Whatcom Conservation District Whatcom Speaker Series October 16, 2014 What is on your mind right now?? Agronomics = Nutrient
Landsat 5 & 7 Band Combinations
 Landsat 5 & 7 Band Combinations By James W. Quinn Landsat 5 (TM sensor) Wavelength (micrometers) Resolution (meters) Band 1 0.45-0.52 30 Band 2 0.52-0.60
An Agro-Climatic Zoning Approach to Achieve Optimum Agricultural Production in the Kurdistan Region, Iraq
 Middle East Journal of Agriculture Research Volume : 05 Issue : 03 July-Sept. 2016 Pages: 340-346 An Agro-Climatic Zoning Approach to Achieve Optimum Agricultural Production in the Kurdistan Region, Iraq
Natural Resources & Environmental Stewardship
 Natural Resources & Environmental Stewardship Fundamentals of Nutrient Management Melissa L. Wilson Department of Environmental Science & Technology Ag Nutrient Management Program University of Maryland,
Naomi Feger SF Bay RWQCB January 6, 2017
 Harmful Algal Blooms North Bay Watershed Association January Meeting Naomi Feger SF Bay RWQCB January 6, 2017 Why are Harmful Algal Blooms (HABs) a Problem in California HABs create significant water quality
Assessing Real Time - Drainage Water Management
 Assessing Real Time - Drainage Water Management Jim Klang, PE Kieser & Associates, LLC 536 East Michigan Ave / Suite 300, Kalamazoo, MI 49007 (269) 344-7117 Photo Credit: Purdue Engineering Today s Talk
Purdue University Department of Agronomy
 1 of 7 7/7/2015 1:23 PM Purdue University Department of Agronomy Corny News Network Follow @PurdueCornGuy 7 July 2015 URL: http://www.kingcorn.org/news/articles_15 /WaterloggedCorn_0707.html R.L. (Bob)
Identifying and and Understanding Carbon Cycle Implications of of North American Natural and and Anthropogenic Disturbances:
 Identifying and and Understanding Carbon Cycle Implications of of North American Natural and and Anthropogenic Disturbances: 1982-2005 Progress Progress Report Report NRA-04-OES-01 NRA-04-OES-01 Christopher
Crop Monitoring in Australia Using Digital Analysis of Landsat Data
 Purdue University Purdue e-pubs LARS Symposia Laboratory for Applications of Remote Sensing 1-1-1981 Crop Monitoring in Australia Using Digital Analysis of Landsat Data Ken W. Dawbin David W. Beach Follow
Turbidity Monitoring Under Ice Cover in NYC DEP
 Turbidity Monitoring Under Ice Cover in NYC DEP Reducing equifinality by using spatial wetness information and reducing complexity in the SWAT-Hillslope model Linh Hoang 1,2, Elliot M. Schneiderman 2,
Interaction of weather and field variability on profitability in crop production
 Proceedings of the Integrated Crop Management Conference Proceedings of the 28th Annual Integrated Crop Management Conference Dec 1st, 12:00 AM Interaction of weather and field variability on profitability
Rappahannock County Riparian Buffer Study. Submitted by: Center for Coastal Resources Management Virginia Institute of Marine Science.
 Rappahannock County Riparian Buffer Study Submitted by: Center for Coastal Resources Management Virginia Institute of Marine Science To: Rappahannock County and U.S. Army Corps of Engineers Project Number
TARGETING WATERSHEDS FOR RESTORATION ACTIVITIES IN THE CHESAPEAKE BAY WATERSHED. Technical Documentation October 4, 2002
 TARGETING WATERSHEDS FOR RESTORATION ACTIVITIES IN THE CHESAPEAKE BAY WATERSHED Technical Documentation October 4, 2002 Acknowledgements and Disclaimer This project was funded by the Chesapeake Bay Foundation,
Mapping Potato Productivity over the U.S. Eastern Seaboard using a Geospatial Crop Model
 Mapping Potato Productivity over the U.S. Eastern Seaboard using a Geospatial Crop Model Jonathan P. Resop ASABE Annual International Meeting Kansas City, Missouri, July 22nd, 2013 Topics of Discussion
MOBILE BAY. Darius Hixon (Project Lead) Austin Clark Tyler Lynn Manoela Rosa. Monitoring Marsh Conditions in Coastal Alabama. Conservation Initiatives
 Austin Clark Tyler Lynn Manoela Rosa. Monitoring Marsh Conditions in Coastal Alabama. Conservation Initiatives") National Aeronautics and Space Administration MOBILE BAY MOBILE ECOLOGICAL BAY ECOLOGICAL FORECASTING FORECASTING II II Monitoring Marsh Conditions in Coastal Alabama Monitoring Using NASA Marsh Earth
National Aeronautics and Space Administration MOBILE BAY MOBILE ECOLOGICAL BAY ECOLOGICAL FORECASTING FORECASTING II II Monitoring Marsh Conditions in Coastal Alabama Monitoring Using NASA Marsh Earth
REMOTE SENSING, NORMALIZED DIFFERENCE VEGETATION INDEX (NDVI), AND CROP YIELD FORECASTING XIJIE LV THESIS
, AND CROP YIELD FORECASTING XIJIE LV THESIS") REMOTE SENSING, NORMALIZED DIFFERENCE VEGETATION INDEX (NDVI), AND CROP YIELD FORECASTING BY XIJIE LV THESIS Submitted in partial fulfillment of the requirements for the degree of Master of Science in
REMOTE SENSING, NORMALIZED DIFFERENCE VEGETATION INDEX (NDVI), AND CROP YIELD FORECASTING BY XIJIE LV THESIS Submitted in partial fulfillment of the requirements for the degree of Master of Science in
Laura Zanolli Geography Major/GIS/Geology/Water Resources Portland State University
 Laura Zanolli Geography Major/GIS/Geology/Water Resources Portland State University The canopy is one part of a system of shade and cover that promotes bank stability and along with vegetation helps to
Theresa M. Possley Nelson, PE. Wisconsin Department of Natural Resources
 Theresa M. Possley Nelson, PE Wisconsin Department of Natural Resources WLWCA March 10, 2015 Aaron Ruesch Dave Evans Andrew Craig Adam Freihoefer Ann Hirekatur Impaired Waters & TMDLs Nonpoint Source Implementation
Introduction to Surface Irrigation
 Introduction to Surface Irrigation Kabul, Afghanistan February 2011 7 This watershed rehabilitation and restoration training was prepared by the U.S. Department of Agriculture (USDA) team of Jon Fripp
New Tech Predicts Local Corn Supply. -The Opportunities and Limits of Statistical Ag Data-
 New Tech Predicts Local Corn Supply -The Opportunities and Limits of Statistical Ag Data- Presented by: Steffen Mueller, PhD Principal Economist Biofuel and Bioenergy Research University of Illinois at
STUDY ON SOIL MOISTURE BY THERMAL INFRARED DATA
 THERMAL SCIENCE, Year 2013, Vol. 17, No. 5, pp. 1375-1381 1375 STUDY ON SOIL MOISTURE BY THERMAL INFRARED DATA by Jun HE a, Xiao-Hua YANG a*, Shi-Feng HUANG b, Chong-Li DI a, and Ying MEI a a School of
Soil Map Lewis County, Kentucky (Denham Farm, Sand Hill/Trinity, Lewis Co., KY) Web Soil Survey National Cooperative Soil Survey
 Web Soil Survey National Cooperative Soil Survey") 83 37' 43'' W (Denham Farm, Sand Hill/Trinity, Lewis Co., KY) 83 36' 18'' W 38 40' 37'' N 271500 271700 271900 272100 272300 272500 272700 272900 273100 273300 38 40' 37'' N 38 39' 54'' N 4282900 4283100
83 37' 43'' W (Denham Farm, Sand Hill/Trinity, Lewis Co., KY) 83 36' 18'' W 38 40' 37'' N 271500 271700 271900 272100 272300 272500 272700 272900 273100 273300 38 40' 37'' N 38 39' 54'' N 4282900 4283100
1.6 Rainfed areas Areas that have no irrigation whatsoever and are precipitation dependent.
 Croplands Definitions Document 1.0 Background Key to effective mapping is to have a precise and clear definition of what is mapped. It is the first and primary step. For example, irrigated areas are defined
Evaluation of a method of estimating agricultural chemical use
 Environmental Exposure and Health 409 Evaluation of a method of estimating agricultural chemical use F. S. Faruque 1, T. Carithers 2, K. Wilson 3, W. Williams 1, H. Li 1, W. May 2 & J. Olivier 2 1 Department
2 Okanogan County Regional Setting
 1 1 1 1 1 1 1 1 0 1 0 1 Okanogan County Regional Setting.1 Okanogan County Profile Okanogan County is in North Central Washington State. The county borders Canada in the North and the southern and eastern
Environmental Resource Inventories. What are ERIs? Significance of information How to use them
 Environmental Resource Inventories What are ERIs? Significance of information How to use them Environmental Resource Inventory - ERI Compiled by the environmental commission Information about the natural
Understanding Juniper Forest Encroachment into Grasslands in Oklahoma and the Impacts on Primary Production, Evapotranspiration, and Climate
 Understanding Juniper Forest Encroachment into Grasslands in Oklahoma and the Impacts on Primary Production, Evapotranspiration, and Climate Jie Wang 04/24/2018 Earth observation and modeling Department
Afforestation/Reforestation Afforestation/Reforestation Clean Development Mechanism Projects in Uttar Pradesh State August
 Afforestation/Reforestation Clean Development Mechanism Projects in Uttar Pradesh State August 9, 2014 Suresh Chauhan TERI, New Delhi Presentation outlines 1. Guidelines for preparing Project Design Document
Potential for Site Specific Management in Midwest Mint Production
 Potential for Site Specific Management in Midwest Mint Production Mary S. Gumz and Stephen C. Weller Introduction Peppermint (Mentha piperita) and the spearmints (M. spicata and M. cardiaca) ( mint ) are