Farm Labor. Special Note
|
|
|
- Katrina Jennings
- 6 years ago
- Views:
Transcription

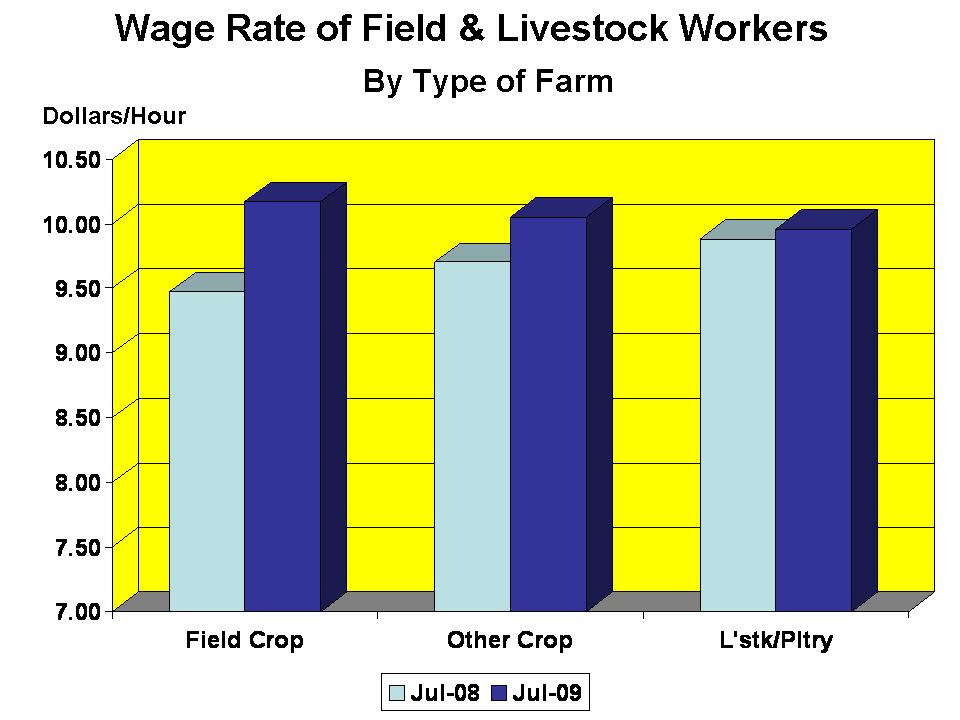
1 Washington, D.C. Farm Labor Released August 21,, by the National Agricultural Statistics Service (NASS),, U.S. Department of Agriculture. For information on call Mark Aitken at , office hours 7:30 a.m. to 4:00 p.m. ET. Special Note NASS is in the process of modifying report layouts in order to improve readability. This report issue is published using both layouts but all future issues will only be produced with the new layout, which is available on the NASS website: This is the last issue using this layout. Hired Workers Up 6 Percent, Wage Rates up 3 Percent From a Year Ago There were 1,238,000 hired workers on the Nation s farms and ranches during the week of July 12-18,, up 6 percent from a year ago. Of these hired workers, 875,000 workers were hired directly by farm operators. Agricultural service employees on farms and ranches made up the remaining 363,000 workers. Farm operators paid their hired workers an average wage of $10.64 per hour during the July reference week, up 30 cents from a year earlier. Field workers received an average of $10.04 per hour, up 38 cents from last July, while livestock workers earned $10.03 per hour compared with $9.98 a year earlier. The field and livestock worker combined wage rate, at $10.04 per hour, was up 30 cents from last year. The number of hours worked averaged 39.8 hours for hired workers during the survey week, down 2 percent from a year ago. The largest increases in the number of hired workers from last year occurred in California, and in the (Michigan, Minnesota, and Wisconsin), Corn Belt I (Illinois, Indiana, and Ohio), Appalachian II (Kentucky, Tennessee, and West Virginia), and (Oregon and Washington) regions. Critically dry, deteriorating pastures in California led to increased supplemental feeding and a stronger demand for livestock workers. In the, Corn Belt I, and Appalachian II regions, a cooler, drier reference week compared with last year s wet conditions allowed field activities to progress rapidly. Therefore, more hired workers were necessary. Increased pear and grape acreage in the region heightened the demand for hired workers. Also, hot, dry weather caused dryland pasture conditions to decline, which led to more livestock movement to irrigated fields and increased supplemental feeding. These factors led to a stronger demand for hired workers. The largest decreases in the number of hired workers from last year occurred in Florida and in the (Arkansas, Louisiana, and Mississippi), and Mountain II (Colorado, Nevada, and Utah) regions. In Florida, declining demand from the equine, dairy, and horticulture industries due to the continuing economic downturn kept the number of hired workers below last year. Wet conditions in the region compared with last year s dry reference week caused hired worker demand to be lower. In the Mountain II region, development of most field crops remained behind normal due to the cool, wet spring. Therefore, fewer hired workers were needed. Hired worker wage rates were generally above a year ago in most regions. The largest increases occurred in the, Corn Belt II (Iowa and Missouri), and Mountain III (Arizona and New Mexico) regions, and in Florida. The higher wages in the region were due to strong demand for highly skilled workers on fruit operations. In the Corn Belt II region and in Florida, there were more salaried workers working fewer hours. This pushed the average wage higher. In the Mountain III region, a higher percentage of nursery and greenhouse workers caused the average wage to increase. Sp Sy 8 (8-09)

2 August 2 NASS, USDA
3 Farm Employment Hired Workers 150 Days or More 149 Days or Less : Employment and Wage Rates, United States, July 12-18,, with Comparisons 1 July 6-12, 2008 April 12-18, July 12-18, 1,000 1,000 1, Agricultural Services Workers Working on Farms Hired Farm & Service Workers 1, ,238 Hours per Week Hours per Week Hours per Week Hours Worked Hired Wage Rate for All Hired Workers 2 3 Dollars per Hour Dollars per Hour Dollars per Hour Type of Worker Field & Livestock Combined Field Livestock Excludes AK. 2 Benefits, such as housing and meals, are provided some workers but the values are not included in the wage rates. 3 Excludes Agricultural Service Workers August 3 NASS, USDA
4 U.S. and Region 2 Northeast I Northeast II Hired Workers: Number and Hours Worked by Region and United States, July 12-18, 1 Number of Workers Hired Expected to be Employed 150 Days or More 149 Days or Less Number of Hours Worked 1,000 1,000 1,000 Hours per Week Appalachian I Appalachian II Southeast FL Cornbelt I Cornbelt II Northern Plains Southern Plains Mountain I Mountain II Mountain III CA HI US 3 1 Excludes Agricultural Service Workers. 2 Region map on page Excludes AK. August 4 NASS, USDA
5 Northeast I Northeast II Hired Workers: Wage Rates for Type of Worker and All Hired Workers by Region and United States, July 12-18, 1 U.S. Type of Worker and Region 2 Field Livestock Field & Lvstk Combined Wage Rates for All Hired Workers Dollars per Hour Dollars per Hour Dollars per Hour Dollars per Hour Appalachian I Appalachian II Southeast FL Cornbelt I Cornbelt II Northern Plains Southern Plains Mountain I Mountain II Mountain III CA HI US Excludes Agricultural Service Workers. 2 Region map on page Excludes AK. August 5 NASS, USDA
6 U.S. and Region 2 Northeast I Northeast II Hired Workers: Number and Hours Worked by Region and United States, April 12-18, 1 Number of Workers Hired Expected to be Employed 150 Days or More 149 Days or Less Number of Hours Worked 1,000 1,000 1,000 Hours per Week Appalachian I Appalachian II Southeast FL Cornbelt I Cornbelt II Northern Plains Southern Plains Mountain I Mountain II Mountain III CA HI US 3 1 Excludes Agricultural Service Workers. 2 Region map on page Excludes AK. August 6 NASS, USDA
7 Northeast I Northeast II Hired Workers: Wage Rates for Type of Worker and All Hired Workers by Region and United States, April 12-18, 1 U.S. Type of Worker and Region 2 Field Livestock Field & Lvstk Combined Wage Rates for All Hired Workers Dollars per Hour Dollars per Hour Dollars per Hour Dollars per Hour Appalachian I Appalachian II Southeast FL Cornbelt I Cornbelt II Northern Plains Southern Plains Mountain I Mountain II Mountain III CA HI US Excludes Agricultural Service Workers. 2 Region map on page Excludes AK. August 7 NASS, USDA
8 U.S. and Region 2 Northeast I Northeast II Hired Workers: Number and Hours Worked by Region and United States, July 6-12, Number of Workers Hired Expected to be Employed 150 Days or More 149 Days or Less Number of Hours Worked 1,000 1,000 1,000 Hours per Week Appalachian I Appalachian II Southeast FL Cornbelt I Cornbelt II Northern Plains Southern Plains Mountain I Mountain II Mountain III CA HI US 3 1 Excludes Agricultural Service Workers. 2 Region map on page Excludes AK. August 8 NASS, USDA
9 Northeast I Northeast II Hired Workers: Wage Rates for Type of Worker and All Hired Workers by Region and United States, July 6-12, U.S. Type of Worker and Region 2 Field Livestock Field & Lvstk Combined Wage Rates for All Hired Workers Dollars per Hour Dollars per Hour Dollars per Hour Dollars per Hour Appalachian I Appalachian II Southeast FL Cornbelt I Cornbelt II Northern Plains Southern Plains Mountain I Mountain II Mountain III CA HI US Excludes Agricultural Service Workers. 2 Region map on page Excludes AK. August 9 NASS, USDA
10 Region 2 Northeast Appalachian Southeast Cornbelt Northern Plains Southern Plains Mountain 48 States Field and Livestock Workers Combined: Wage Rates, by Type of Farm, by Region and 48 States 1 Field Crops Other Crops July 6-12, 2008 Livestock & Poultry All Farms Dollars per Hour Dollars per Hour Dollars per Hour Dollars per Hour ( 3 ) Region 2 Northeast Appalachian Southeast Cornbelt Northern Plains Southern Plains Mountain 48 States Field and Livestock Workers Combined: Wage Rates, by Type of Farm, by Region and 48 States 1 Field Crops Other Crops July 12-18, Livestock & Poultry All Farms Dollars per Hour Dollars per Hour Dollars per Hour Dollars per Hour ( 3 ) ( 3 ) Excludes Agricultural Service Workers. 2 Regions consist of the following States: Northeast: CT, DE, MD, ME, MA, NH, NJ, NY, PA, RI, VT. Appalachian: KY, NC, TN, VA, WV. Southeast: AL, FL, GA, SC. : MI, MN, WI. Cornbelt: IA, IL, IN, MO, OH. : AR, LA, MS. Northern Plains: KS, NE, ND, SD. Southern Plains: OK, TX. Mountain: AZ, CO, ID, MT, NM, NV, UT, WY. : CA, OR, WA. 48 States: All States, excluding AK and HI. 3 Insufficient data August 10 NASS, USDA
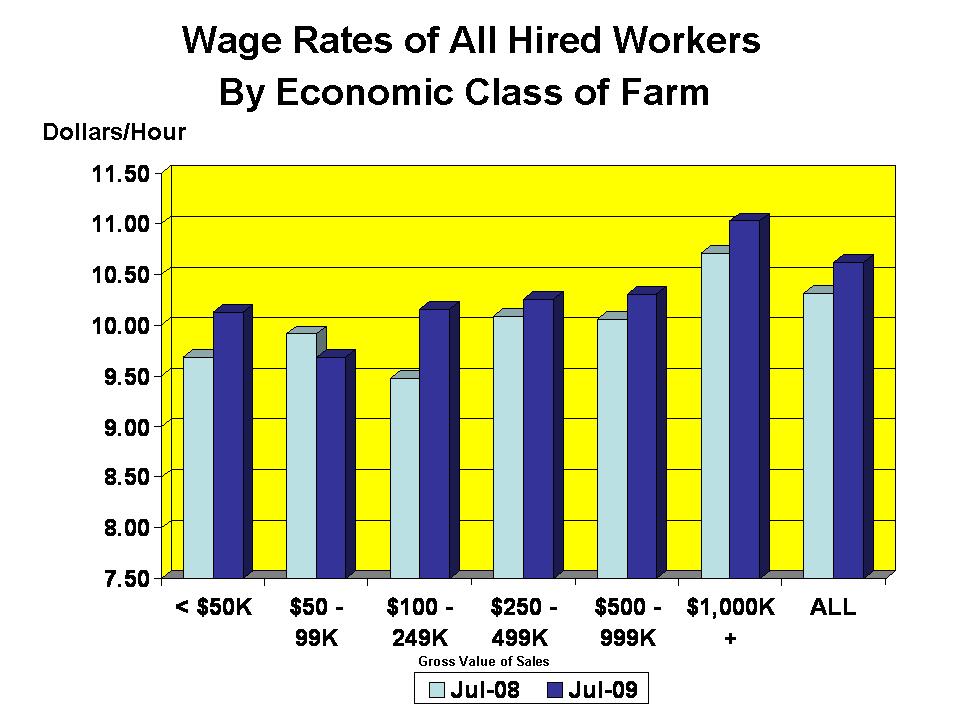
11 All Hired Workers: Wage Rates, by Economic Class of Farm by Region and 48 States 1 July 6-12, 2008 Region 2 Gross Value Sales-$1,000's < ,000+ All Farms N. East Appal. S. East Cornbelt N. Plains S. Plains Mountain 48 States Dollars per Hour Dollars per Hour Dollars per Hour Dollars per Hour Dollars per Hour Dollars per Hour Dollars per Hour ( 3 ) All Hired Workers: Wage Rates, by Economic Class of Farm by Region and 48 States 1 July 12-18, Region 2 Gross Value Sales-$1,000's < ,000+ All Farms N. East Appal. S. East Cornbelt N. Plains S. Plains Mountain 48 States Dollars per Hour Dollars per Hour Dollars per Hour Dollars per Hour Dollars per Hour Dollars per Hour Dollars per Hour ( 3 ) ( 3 ) ( 3 ) Excludes Agricultural Service Workers. 2 Regions consist of the following States: Northeast: CT, DE, MD, ME, MA, NH, NJ, NY, PA, RI, VT. Appalachian: KY, NC, TN, VA, WV. Southeast: AL, FL, GA, SC. : MI, MN, WI. Cornbelt: IA, IL, IN, MO, OH. : AR, LA, MS. Northern Plains: KS, NE, ND, SD. Southern Plains: OK, TX. Mountain: AZ, CO, ID, MT, NM, NV, UT, WY. : CA, OR, WA. 48 States: All States, excluding AK and HI. 3 Insufficient data August NASS, USDA
12 Type of Farm Field Crops Other Crops Livestock, Dairy, & Poultry Field and Livestock Workers: Distribution by Type of Farm, 48 States July 6-12, 2008 Percent of Field and Livestock Workers April 12-18, Percent of Field and Livestock Workers July 12-18, Percent of Field and Livestock Workers Gross Value of Sales Less than $50,000 $50,000-$99,999 $100,000-$249,999 $250,000-$499,999 $500,000-$999,999 $1,000,000 and over Hired Workers: Distribution by Economic Class of Farm, 48 States 1 3 July 6-12, 2008 April 12-18, July 12-18, Percent of Hired Workers Percent of Hired Workers Percent of Hired Workers Category Employed on Farms Hiring 1 Worker 2 Workers 3-6 Workers 7-10 Workers -20 Workers Workers 51 or more Workers 1 48 States, excluding AK and HI. 2 Field and Livestock Workers combined. 3 Excludes Agricultural Service Workers. Hired Workers: Distribution by Category, United States, 1 3 July 6-12, 2008 April 12-18, July 12-18, Percent of Hired Workers Percent of Hired Workers Percent of Hired Workers August 12 NASS, USDA
13 Agricultural Services Agricultural service operations provided 363,000 workers for the Nation's farms and ranches during the week of July 12-18,. Agricultural service workers in California numbered 7,000 this July, up 4 percent from last year. Florida's number of agricultural service workers was 2,000, unchanged from last year. The average wages received by agricultural service workers in California and Florida were $10.35 and $10.65 per hour, respectively. Comparable wages in July 2008 were $10.00 per hour in California and $9.85 per hour in Florida. CA FL State Jul 2008 Agricultural Service Workers: Number, Hours Worked, and Wage Rates, for California, Florida, and United States 1 Number of Workers Working on Farms Apr Jul Jul 2008 Hours Worked 2 Apr Jul 1,000 1,000 1,000 Hours Hours Hours Jul 2008 Dollars per Hour Wage Rates 2 3 Apr Dollars per Hour Jul Dollars per Hour US Data are for Agricultural Services performed on the farm by custom service units such as crew leaders or custom crews. These statistics are not included in the State-Regional tables. 2 United States data not available. 3 Benefits, such as housing and meals, are provided to some workers but the values are not included in the wage rates. August 13 NASS, USDA
14 Regions Region Northeast I Northeast II Appalachian I Appalachian II Southeast Cornbelt I Cornbelt II Northern Plains Southern Plains Mountain I Mountain II Mountain III States CT, ME, MA, NH, NY, RI, VT. DE, MD, NJ, PA. NC, VA. KY, TN, WV. AL, GA, SC. MI, MN, WI. IL, IN, OH. IA, MO. AR, LA, MS. KS, NE, ND, SD. OK, TX. ID, MT, WY. CO, NV, UT. AZ, NM. OR, WA. August 14 NASS, USDA
15 Definitions The following definitions are provided to assist in interpreting statistics published in quarterly reports. To ensure consistency in data collection, the questionnaires and instruction manual used by the interviewers provide more in-depth explanations of these terms. Farm or Ranch: A place that sells, or would normally sell, at least $1,000 worth of agricultural products during the year. Agricultural Work: Work done on a farm or ranch in connection with the production of agricultural products, including nursery and greenhouse products and animal specialties such as fur farms or apiaries. Also included is work done off the farm to handle farm related business, such as trips to buy feed or deliver products to local market. Hired Worker: Anyone, other than an agricultural service worker, who was paid for at least one hour of agricultural work on a farm or ranch. Worker type is determined by what the employee was primarily hired to do, not necessarily what work was done during the survey week. Type of workers include: Field Workers: Employees engaged in planting, tending and harvesting crops including operation of farm machinery on crop farms. Livestock Workers: Employees tending livestock, milking cows or caring for poultry, including operation of farm machinery on livestock or poultry operations. Supervisors: Hired managers, range foremen, crew leaders, etc. Other Workers: Employees engaged in agricultural work not included in the other three categories. Bookkeepers and pilots are examples. Methods of Pay: All wage rates are calculated based on total wages paid and total hours worked during the survey reference week. Wages paid other than hourly (bi-weekly, monthly, etc.) are converted to an hourly basis prior to summarization. Wages paid by piece rate (per quantity of produce picked, etc.) are also converted to an hourly basis. Perquisites: Benefits, such as cash bonuses, housing, or meals, provided to an employee in addition to pay are included in perquisites. Wage rates published in this release do not include the value of these benefits. Term of Employment: The length of time during the year the farm operator expects to employ those workers who were on the payroll during the survey week. August 15 NASS, USDA
16 Definitions - continued Agricultural Service: Any farm-related service performed on a farm or ranch on a contract or fee basis. This primarily includes activities performed by contract workers on fruit, vegetable, or berry operations. It also includes custom work (see below), veterinarian work, artificial insemination, sheep shearing, milk testing, or any other farm-related activity performed on a farm or ranch on a fee per service basis rather than hourly. Contract Labor: Contract workers are paid by a crew leader, contractor, buyer, processor, cooperative, or other person who has an oral or written agreement with a farmer/rancher. Pruning, thinning, weeding or harvesting of fruit, vegetable or berry crops are examples. A machine is not a part of the service activity provided by the contractor. Custom Work: Work performed by machines and labor hired as a unit. Hay baling, combining, corn or cotton picking, spraying, fertilizing, and laser leveling are examples of custom work when the equipment is included in the service activity. Type of Farm (or Ranch): An operation is classified in the farm type which accounts for the largest portion of the total gross value of sales for its agricultural production. The three types of farms broken out in this publication are: Field Crops: A farm producing wheat, rice, corn, soybeans, barley, dry beans, rye, sorghum, cotton, popcorn, tobacco, or other such crops. Other Crops: A farm producing vegetables, melons, berry crops, grapes, tree nuts, citrus fruits, deciduous tree fruits, avocados, dates, figs, olives, nursery, or greenhouse crops. This category also includes farms producing potatoes, sugar crops, hay, peanuts, hops, mint, and maple syrup. Livestock or Poultry: A farm producing cattle, hogs, sheep, goats, milk, chickens, eggs, turkeys, or animal specialties such as furs, fish, honey, etc. Gross Value of Sales: This includes all income during a year from the sale of crops, livestock, dairy, poultry, or other related agricultural products, including the landlord's share and the value of products produced under contract. When commodities are placed under CCC loan, they are considered as sold. August 16 NASS, USDA
17 Reliability of Estimates Survey Procedures: These data were collected by the National Agricultural Statistics Service (NASS) during the last two weeks of July using sampling procedures to ensure every employer of agricultural workers had a chance of being selected. Two samples of farm operators are selected. First, NASS maintains a list of farms that hire farm workers. Farms on this list are classified by size and type. Those expected to employ large numbers of workers are selected with greater frequency than those hiring few or no workers. A second sample consists of segments of land scientifically selected from an area sampling frame. Each June, highly trained interviewers locate each selected land segment and identify every farm operating land within the sample segment's boundaries. The names of farms found in these area segments are matched against the NASS list of farms; those not found on the list are included in the labor survey sample to represent all farms. This methodology is known as multiple frame sampling, with an area sample used to measure the incompleteness of the list. Additionally, a list of agricultural service firms was sampled in California and Florida. The survey reference week was July 12-18,. Reliability: Two types of errors, sampling and non-sampling, are always present in an estimate based on a sample survey. Both types affect the "accuracy" of the estimates. Sampling error occurs because a complete census is not taken. The sampling error measures the variation in estimates from the average of all possible samples. An estimate of 100 with a sampling error of 1 would mean that chances are 19 out of 20 that the estimates from all possible samples averaged together would be between 98 and 102; which is the survey estimate, plus or minus two times the sampling error. The sampling error expressed as a percent of the estimate is called the relative sampling error. The relative sampling error for number of hired workers at the U.S. level is normally less than 5 percent. The relative sampling error for the number of hired workers generally ranged between 8 and 20 percent at the regional level. The U.S. all hired farm worker wage rate had a relative sampling error of 0.8 percent. The relative sampling error was 0.8 percent for the combined field and livestock worker wage rate. Relative sampling errors for the all hired farm worker wage rate generally ranged between 2 and 6 percent at the regional levels. Relative sampling errors for wage rates published by type of farm and economic class of farm generally ranged between 2 and 19 percent at the regional level. Non-sampling errors can occur in a complete census as well as in sample surveys. They are caused by the inability to obtain correct information from each operation sampled, differences in interpreting questions or definitions, and mistakes in editing, coding or processing the data. Special efforts are taken at each step of the survey to minimize non-sampling errors. Revision Policy: Farm labor information is subject to revision the next time the information is published or the year after the original publication date. The basis for revision must be supported by additional data that directly affect the level of the estimate. Worker numbers and wage rates for April and July 2008 were subject to revision with this report. If any revisions were made to previous data, they are reprinted in this report for your information, and they are identified as such. August 17 NASS, USDA
18 Index U.S. Hired Workers on Farms, Wage Rates and Hours Worked...3 Number of Workers and Average Hours Worked by Region and U.S. July...4 April...6 July Wage Rates by Region and U.S. July...5 April...7 July Agricultural Services: Workers, Average Hours Worked, and Wages July...13 April...13 July Other Labor Estimates U.S. Distribution of Workers...12 Wage Rates by Type of Farm, by Region, State, 48 States...10 Wage Rates by Economic Class of Farm, by Region, State, 48 States... Region Map...14 Definitions...15 Reliability of Estimates...17 Revision Policy...17 Page August 18 NASS, USDA
19 ACCESS TO REPORTS!! For your convenience, there are several ways to obtain NASS reports, data products, and services: INTERNET ACCESS All NASS reports are available free of charge. For free access, connect to the Internet and go to the NASS Home Page at: SUBSCRIPTION All NASS reports are available by subscription free of charge direct to your address. Starting with the NASS Home Page at under the right navigation, Receive reports by , click on National or State. Follow the instructions on the screen PRINTED REPORTS OR DATA PRODUCTS CALL OUR TOLL-FREE ORDER DESK: (U.S. and Canada) Other areas, please call FAX: (Visa, MasterCard, check, or money order acceptable for payment.) ASSISTANCE For assistance with general agricultural statistics or further information about NASS or its products or services, contact the Agricultural Statistics Hotline at , 7:30 a.m. to 4:00 p.m. ET, or nass@nass.usda.gov. The U.S. Department of Agriculture (USDA) prohibits discrimination in all its programs and activities on the basis of race, color, national origin, age, disability, and where applicable, sex, marital status, familial status, parental status, religion, sexual orientation, genetic information, political beliefs, reprisal, or because all or a part of an individual s income is derived from any public assistance program. (Not all prohibited bases apply to all programs.) Persons with disabilities who require alternative means for communication of program information (Braille, large print, audiotape, etc.) should contact USDA s TARGET Center at (202) (voice and TDD). To file a complaint of discrimination, write to USDA, Director, Office of Civil Rights, 1400 Independence Avenue, S.W., Washington, D.C , or call (800) (voice) or (202) (TDD). USDA is an equal opportunity provider and employer.
Farm Labor. Hired Workers Up 3 Percent, Wage Rates Up 4 Percent From a Year Ago
 Washington, D.C. Farm Labor Released November 16,, by the National Agricultural Statistics Service (NASS),, U.S. Department of Agriculture. For information on call Mark Aitken at 202-720-6146, office hours
Farm Labor. Hired Workers Unchanged, Wage Rates Up 4 Percent From a Year Ago
 Washington, D.C. Farm Labor Released May 8, 007, by the National Agricultural Statistics Service (NASS),, U.S. Department of Agriculture. For information on call Mark Aitken at 0-70-66, office hours 7:0
Land Values and Cash Rents: 2008 Summary
 University of Nebraska - Lincoln DigitalCommons@University of Nebraska - Lincoln Nebraska Farm Real Estate Reports Agricultural Economics Department August 2008 Land Values and Cash Rents: 2008 Summary
Farms and Land in Farms
 United States Department of Agriculture National Agricultural Statistics Service Farms and Land in Farms February 2003 Sp Sy 3 (03) Up Slightly in 2002 The number of farms in the United States in 2002
Farm Production Expenditures Summary
 United States Department of Agriculture National Agricultural Statistics Service Farm Production Summary Economic Research Service Sp Sy 5 (99) July 1999 Production Up Slightly in 1998 U.S. farm production
Agricultural Land Values
 United States Department of Agriculture National Agricultural Statistics Service August 2001 Sp Sy 3 (01) Average Farm Real Estate Values Continue Upward The U.S. farm real estate value, including all
Farm Computer Usage and Ownership
 Washington, D.C. Farm Computer Usage and Ownership Released July, 0, by the National Agricultural Statistics Service (NASS),, U.S. Department of Agriculture. For information on "" call Mark Aitken at ()
Non-Ambulatory Cattle and Calves
 Washington, D.C. Non-Ambulatory Cattle and Calves Released May 5, 2005, by the National Agricultural Statistics Service (NASS),, U.S. Department of Agriculture. For information on Non-ambulatory Cattle
Milk Production, Disposition, and Income
 United States Department of Agriculture National Agricultural Statistics Service Production, Disposition, and Income 2008 Summary May 2009 Da 1-2 (09) Contents Page Summary...1 Production, Disposition,
Winter Wheat Seedings
 Washington, D.C. Winter Wheat Seedings Released January 12,, by the National Agricultural Statistics Service (NASS),, U.S. Department of Agriculture. For information on Winter Wheat Seedings call Todd
Capacity of Refrigerated Warehouses
 United States Department of Agriculture National Agricultural Statistics Service Co St (0) Capacity of Refrigerated Warehouses 003 Summary January 00 General Refrigerated Warehouse Capacity Up Percent
Winter Wheat Seedings
 Washington, D.C. Winter Wheat Seedings Released January 12, 2007, by the National Agricultural Statistics Service (NASS),, U.S. Department of Agriculture. For information on Winter Wheat Seedings call
Poultry - Production and Value
 United States Department of Agriculture National Agricultural Statistics Service Poultry - Production and Value 005 Summary Pou - (06) a April 006 Contents Page Summary... Broilers... Eggs... Turkeys...
Potatoes Summary. September United States Department of Agriculture. National Agricultural Statistics Service.
 United States Department of Agriculture National Agricultural Statistics Service Potatoes 00 Summary September 00 Pot 6 (0) Contents Page Introduction... Comments... Utilization, U. S., 99-00... 4 Area,
Avg. AR IL IN IA KS KY LA MI MN MS MO NE NC ND OH SD TN WI. 18 Sts. 1 These 18 States planted 95% of last year's soybean acreage.
 Washington, D.C. Crop Progress Released July,, by the National Agricultural Statistics Service (NASS),, U.S. Department of Agriculture. For information on call Julie Schmidt at () -, office hours : a.m.
Potatoes Summary. September United States Department of Agriculture. National Agricultural Statistics Service.
 United States Department of Agriculture National Agricultural Statistics Service Potatoes Summary September 000 Pot (00) a Update Alert The monthly processing table on page was corrected. Changes were
Avg. AR IL IN IA KS KY LA MI MN MS MO NE NC ND OH SD TN WI. 18 Sts Avg. Jun 14, 2008 ID MN MT ND WA. 5 Sts
 Washington, D.C. Crop Progress Released June,, by the National Agricultural Statistics Service (SS),, U.S. Department of Agriculture. For information on call Julie Schmidt at () -, office hours : a.m.
Land Values 2012 Summary
 United States Department of Agriculture National Agricultural Statistics Service Land Values 2012 Summary August 2012 ISSN: 19491867 Contents Agricultural Land Values Highlights... 4 Farm Real Estate,
Cattle. January 1 Cattle Inventory Down 1 Percent. Other class estimates on January 1, 2004 and the change from January 1, 2003, are as follows:
 Washington, D.C. Released January, 0, by the National Agricultural Statistics Service (NASS),, U.S. Department of Agriculture. For information on "" call Steve Anderson at (2) -, office hours : a.m. to
Land Values 2013 Summary
 United States Department of Agriculture National Agricultural Statistics Service Land Values 2013 Summary August 2013 ISSN: 19491867 Contents Agricultural Land Values Highlights... 4 Farm Real Estate,
All Mushroom Sales Virtually Unchanged, Value Down 1 Percent
 Washington, D.C. Released August 6, 005, by the National Agricultural Statistics Service (NASS),, U.S. Department Agriculture. For information on call Debbie Flippin at (0) 70-350, fice hours 7:30 a.m.
Land Values and Cash Rents
 United States Department of Agriculture National Agricultural Statistics Service Land Values and Cash Rents 2009 Summary August 2009 ISSN: 19491867 Contents Agricultural Land Values Highlights... 4 U.
Production per cow in the 23 major States averaged 1,830 pounds for July, 59 pounds above July 2009.
 Milk Production ISSN: 1949-1557 Released August 18, 2010, by the National Agricultural Statistics Service (NASS), Agricultural Statistics Board, United States Department of Agriculture (USDA). July Milk
April Hired Workers Down 4 Percent, Wage Rate Increases 4 Percent From Previous Year
 Farm Labor ISSN: 99-0909 Released May 8, 0, by the National Agricultural Statistics Service (NASS), Agricultural Statistics Board, United States Department of Agriculture (USDA). April Hired Workers Down
Crop Progress. Cotton Bolls Opening Selected States [These 15 States planted 99% of the 2010 cotton acreage]
![Crop Progress. Cotton Bolls Opening Selected States [These 15 States planted 99% of the 2010 cotton acreage]](/thumbs/90/104141847.jpg "Crop Progress. Cotton Bolls Opening Selected States [These 15 States planted 99% of the 2010 cotton acreage]") Crop Progress ISSN: 00 Released September, 0, by the National Agricultural Statistics Service (NASS), Agricultural Statistics Board, United s Department of Agriculture (USDA). Cotton Bolls Opening Selected
Crop Progress ISSN: 00 Released September, 0, by the National Agricultural Statistics Service (NASS), Agricultural Statistics Board, United s Department of Agriculture (USDA). Cotton Bolls Opening Selected
Iowa Farm Outlook. June 2015 Ames, Iowa Econ. Info Regional Hay-Pasture Situation and Outlook. Percent of National All Hay Stocks
 Iowa Farm Outlook 0BDepartment of Economics June 2015 Ames, Iowa Econ. Info. 2062 Regional Hay-Pasture Situation and Outlook The 2014 calendar year provided favorable growing conditions for forage production
WHAT WE KNOW ABOUT THE DEMOGRAPHICS OF U.S. FARM OPERATORS
 Agricultural Outlook Forum 2005 Presented: Friday, February 25, 2005 WHAT WE KNOW ABOUT THE DEMOGRAPHICS OF U.S. FARM OPERATORS Prepared by Rich Allen and Ginger Harris National Agricultural Statistics
April Hired Workers Down Slightly, Wage Rates Increase 2 Percent From Previous Year
 Farm Labor ISSN: -00 Released May, 0, by the National Agricultural Statistics Service (NASS), Agricultural Statistics Board, United States Department of Agriculture (USDA). April Hired Workers Down Slightly,
U.S. Cattle on Feed Down 4 Percent
 Washington, D.C. Cattle on Feed Released June, 8, by the National Agricultural Statistics Service (NASS),, U.S. Department of Agriculture. For information on call Jason Hardegree at (2) 7-, office hours
Honey. United States Honey Production Down 16 Percent
 Honey ISSN: 1-12 Released March 30, 2012, by the National Agricultural Statistics Service (NASS), Agricultural Statistics Board, United States Department of Agriculture (USDA). United States Honey Production
U.S. Cattle on Feed Down 3 Percent
 Washington, D.C. Cattle on Feed Released March 9, 00, by the National Agricultural Statistics Service (NASS),, U.S. Department of Agriculture. For information on call Jason Hardegree at (0) 70-00, office
Meat Animals Production, Disposition, and Income 2011 Summary
 United States Department of Agriculture National Agricultural Statistics Service Meat Animals Production, Disposition, and Income 2011 Summary April 2012 ISSN: 0748-0318 Special Note Sheep: Monthly sheep
Land Values and Cash Rents 2010 Summary
 United States Department of Agriculture National Agricultural Statistics Service Land Values and Cash Rents 2010 Summary August 2010 ISSN: 19491867 Contents Agricultural Land Values Highlights... 4 United
Milk Production, Disposition, and Income 2011 Summary
 United s Department of Agriculture National Agricultural Statistics Service Production, Disposition, and Income 2011 Summary April 2012 ISSN: 19491506 Contents Summary... 4 Cows and Production of and
Winter Wheat Seedings
 Winter Wheat Seedings ISSN: 1949-1980 Released January 12, 2011, by the National Agricultural Statistics Service (NASS), Agricultural Statistics Board, United States Department of Agriculture (USDA). Planted
Honey Final Estimates
 United States Department of Agriculture National Agricultural Statistics Service Honey Final Estimates 200-2012 September 201 Statistical Bulletin Number 3 Contents Honey Price by Color Class United States:
Corn, Soybeans, and Wheat Sold Through Marketing Contracts
 United States Department of Agriculture National Agricultural Statistics Service Corn, Soybeans, and Wheat Sold Through Marketing Contracts 2001 Summary February 2003 Sp Cr (03) Table of Contents Page
Corn Objective Yield Survey Data,
 Washington, D.C. Corn Objective Yield Survey Data, 1992-2006 Released May 18, 2007, by the National Agricultural Statistics Service (NASS),, U.S. Department of Agriculture. For information on call Ty Kalaus
Winter Wheat Seedings
 Winter Wheat Seedings ISSN: 1949-1980 Released January 11, 2013, by the National Agricultural Statistics Service (NASS), Agricultural Statistics Board, United States Department of Agriculture (USDA). Planted
Sheep and Goats Predator Loss
 and Goats Predator Loss Washington, D.C. Released May 5, 0, by the National Agricultural Statistics Service (NASS),, U.S. Department of Agriculture. For information on "" call Steve Anderson at 0-690-336,
Crop Progress. NASS Survey Update!
 Crop Progress ISSN: 00 Released May, 0, by the National Agricultural Statistics Service (NASS), Agricultural Statistics Board, United s Department of Agriculture (USDA). NASS Survey Update! In the first
Wheat Objective Yield Survey Data,
 Washington, D.C. Wheat Objective Yield Survey Data, 1993-2007 Released May 30, 2008, by the National Agricultural Statistics Service (NASS),, U.S. Department of Agriculture. For information on call Todd
Farm Radio Habits Wave 1, Winter Conducted by Millennium Research, Inc.
 Farm Radio Habits Wave 1, Winter 2015 Conducted by Millennium Research, Inc. TAKE A PICTURE OF THE RADIO YOU LISTEN TO THE MOST OFTEN? 2 Radio Is An Important Part Of Farmers And Ranchers Day I started
Soybean Objective Yield Survey Data,
 Washington, D.C. Soybean Objective Yield Survey Data, 1992-2006 Released July 27, 2007, by the National Agricultural Statistics Service (NASS),, U.S. Department of Agriculture. For information on call
Crop Progress. Corn Planted - Selected States [These 18 States planted 92% of the 2016 corn acreage] Corn Emerged - Selected States ISSN:
![Crop Progress. Corn Planted - Selected States [These 18 States planted 92% of the 2016 corn acreage] Corn Emerged - Selected States ISSN:](/thumbs/83/87811397.jpg "Crop Progress. Corn Planted - Selected States [These 18 States planted 92% of the 2016 corn acreage] Corn Emerged - Selected States ISSN:") Crop Progress ISSN: 00 Released May, 0, by the National Agricultural Statistics Service (NASS), Agricultural Statistics Board, United s Department of Agriculture (USDA). Corn Planted Selected s [These
Crop Progress ISSN: 00 Released May, 0, by the National Agricultural Statistics Service (NASS), Agricultural Statistics Board, United s Department of Agriculture (USDA). Corn Planted Selected s [These
Crop Progress. Corn Planted - Selected States [These 18 States planted 92% of the 2017 corn acreage] Corn Emerged - Selected States ISSN:
![Crop Progress. Corn Planted - Selected States [These 18 States planted 92% of the 2017 corn acreage] Corn Emerged - Selected States ISSN:](/thumbs/85/91512831.jpg "Crop Progress. Corn Planted - Selected States [These 18 States planted 92% of the 2017 corn acreage] Corn Emerged - Selected States ISSN:") Crop Progress ISSN: 00 Released April 0, 0, by the National Agricultural Statistics Service (NASS), Agricultural Statistics Board, United s Department of Agriculture (USDA). Corn Planted Selected s [These
Crop Progress ISSN: 00 Released April 0, 0, by the National Agricultural Statistics Service (NASS), Agricultural Statistics Board, United s Department of Agriculture (USDA). Corn Planted Selected s [These
Honey. United States Honey Production Down 1 Percent
 Honey ISSN: 199-192 Released March 18, 2013, by the National Agricultural Statistics Service (NASS), Agricultural Statistics Board, United States Department of Agriculture (USDA). United States Honey Production
The number of milk cows on farms in the 23 major States was 8.73 million head, 57,000 head more than November 2016, but unchanged from October 2017.
 Milk Production ISSN: 949-557 Released December 9, 07, by the National Agricultural Statistics Service (NASS), Agricultural Statistics Board, United States Department of Agriculture (USDA). November Milk
Crop Progress. Corn Planted - Selected States [These 18 States planted 92% of the 2017 corn acreage]
![Crop Progress. Corn Planted - Selected States [These 18 States planted 92% of the 2017 corn acreage]](/thumbs/87/95248897.jpg "Crop Progress. Corn Planted - Selected States [These 18 States planted 92% of the 2017 corn acreage]") Crop Progress ISSN: 00 Released April, 0, by the National Agricultural Statistics Service (NASS), Agricultural Statistics Board, United s Department of Agriculture (USDA). Corn Planted Selected s [These
Crop Progress ISSN: 00 Released April, 0, by the National Agricultural Statistics Service (NASS), Agricultural Statistics Board, United s Department of Agriculture (USDA). Corn Planted Selected s [These
Crop Progress. Special Note
 Crop Progress ISSN: 0 Released November, 0, by the National Agricultural Statistics Service (NASS), Agricultural Statistics Board, United s Department of Agriculture (USDA). Special Note COMING SOON NASS
Production per cow in the 23 major States averaged 1,753 pounds for February, 21 pounds above February 2013.
 Milk Production ISSN: 1949-1557 Released March 19, 2014, by the National Agricultural Statistics Service (NASS), Agricultural Statistics Board, United States Department of Agriculture (USDA). Special Note
Grain Stocks. Corn Stocks Down 7 Percent from September 2017 Soybean Stocks Up 45 Percent All Wheat Stocks Up 5 Percent
 Grain Stocks ISSN: 949-095 Released September 8, 08, by the National Agricultural Statistics Service (NASS), Agricultural Statistics Board, United s Department of Agriculture (USDA). Corn Stocks Down 7
The number of milk cows on farms in the 23 major States was 8.74 million head, 1,000 head more than July 2017, but 8,000 head less than June 2018.
 Milk Production ISSN: 949-557 Released August 0, 08, by the National Agricultural Statistics Service (NASS), Agricultural Statistics Board, United States Department of Agriculture (USDA). July Milk Production
Milk production in the United States during August totaled 18.3 billion pounds, up 1.4 percent from August 2017.
 Milk Production ISSN: 949-557 Released September 9, 08, by the National Agricultural Statistics Service (NASS), Agricultural Statistics Board, United States Department of Agriculture (USDA). August Milk
Crop Progress. Corn Mature Selected States [These 18 States planted 93% of the 2015 corn acreage]
![Crop Progress. Corn Mature Selected States [These 18 States planted 93% of the 2015 corn acreage]](/thumbs/95/123882085.jpg "Crop Progress. Corn Mature Selected States [These 18 States planted 93% of the 2015 corn acreage]") Crop Progress ISSN: 0 Released October,, by the National Agricultural Statistics Service (NASS), Agricultural Statistics Board, United s Department of Agriculture (USDA). Corn Mature Selected s [These
Crop Progress ISSN: 0 Released October,, by the National Agricultural Statistics Service (NASS), Agricultural Statistics Board, United s Department of Agriculture (USDA). Corn Mature Selected s [These
Small Grains Summary. September United States Department of Agriculture. National Agricultural Statistics Service.
 United s Department of Agriculture National Agricultural Statistics Service Small Grains 0 Summary September 0 Cr Pr 2-3 (0) All wheat production totaled 2. billion bushels in 0, up 2 percent from the
Crop Progress. Corn Dented Selected States [These 18 States planted 92% of the 2017 corn acreage] Corn Mature Selected States ISSN:
![Crop Progress. Corn Dented Selected States [These 18 States planted 92% of the 2017 corn acreage] Corn Mature Selected States ISSN:](/thumbs/85/92551331.jpg "Crop Progress. Corn Dented Selected States [These 18 States planted 92% of the 2017 corn acreage] Corn Mature Selected States ISSN:") Crop Progress ISSN: 00 Released September, 0, by the National Agricultural Statistics Service (NASS), Agricultural Statistics Board, United s Department of Agriculture (USDA). Corn Dented Selected s [These
Crop Progress ISSN: 00 Released September, 0, by the National Agricultural Statistics Service (NASS), Agricultural Statistics Board, United s Department of Agriculture (USDA). Corn Dented Selected s [These
Crop Progress. Corn Silking Selected States [These 18 States planted 92% of the 2017 corn acreage]
![Crop Progress. Corn Silking Selected States [These 18 States planted 92% of the 2017 corn acreage]](/thumbs/81/83000292.jpg "Crop Progress. Corn Silking Selected States [These 18 States planted 92% of the 2017 corn acreage]") Crop Progress ISSN: 00 Released July, 0, by the National Agricultural Statistics Service (NASS), Agricultural Statistics Board, United s Department of Agriculture (USDA). Corn Silking Selected s [These
Crop Progress ISSN: 00 Released July, 0, by the National Agricultural Statistics Service (NASS), Agricultural Statistics Board, United s Department of Agriculture (USDA). Corn Silking Selected s [These
Milk Production. January Milk Production up 2.7 Percent
 Milk Production ISSN: 9-557 Released February, 07, by the National Agricultural Statistics Service (NASS), Agricultural Statistics Board, United States Department of Agriculture (USDA). January Milk Production
Crop Progress. Corn Harvested Selected States [These 18 States harvested 94% of the 2017 corn acreage]
![Crop Progress. Corn Harvested Selected States [These 18 States harvested 94% of the 2017 corn acreage]](/thumbs/89/99253316.jpg "Crop Progress. Corn Harvested Selected States [These 18 States harvested 94% of the 2017 corn acreage]") Crop Progress ISSN: 00 Released October, 0, by the National Agricultural Statistics Service (NASS), Agricultural Statistics Board, United s Department of Agriculture (USDA). Corn Harvested Selected s [These
Crop Progress ISSN: 00 Released October, 0, by the National Agricultural Statistics Service (NASS), Agricultural Statistics Board, United s Department of Agriculture (USDA). Corn Harvested Selected s [These
All cows and heifers that have calved, at 39.1 million, were down 2 percent from the 40.0 million on January 1, 2011.
 Cattle ISSN: 1948-90 Released January 27, 2012, by the National Agricultural Statistics Service (NASS), Agricultural Statistics Board, United States Department of Agriculture (USDA). January 1 Cattle Inventory
Cattle on Feed. U.S. Cattle on Feed Up 4 Percent
 Washington, D.C. Cattle on Feed Released December 9, 003, by the National Agricultural Statistics Service (NASS),, U.S. Department of Agriculture. For information on "" call Steve Anderson at (0) 70-40,
Grain Stocks. Corn Stocks Up Slightly from September 2015 Soybean Stocks Up 3 Percent All Wheat Stocks Up 21 Percent
 Grain Stocks ISSN: 949-095 Released September 30, 06, by the National Agricultural Statistics Service (NASS), Agricultural Statistics Board, United s Department of Agriculture (USDA). Corn Stocks Up Slightly
Capacity of Refrigerated Warehouses 2017 Summary
 United States Department of Agriculture National Agricultural Statistics Service Capacity of Refrigerated Warehouses 07 Summary ISSN: 996 January 0 Contents Refrigerated Warehouses Capacity Highlights...
Grain Stocks. Corn Stocks Up 32 Percent from September 2016 Soybean Stocks Up 53 Percent All Wheat Stocks Down 11 Percent
 Grain Stocks ISSN: 949-095 Released September 9, 07, by the National Agricultural Statistics Service (NASS), Agricultural Statistics Board, United s Department of Agriculture (USDA). Corn Stocks Up 3 Percent
Farms, Land in Farms, and Livestock Operations 2011 Summary
 United States Department of Agriculture National Agricultural Statistics Service Farms, Land in Farms, and Livestock Operations 2011 Summary February 2012 ISSN: 1930-7128 Contents 2011 Number of Farms
Cattle on Feed. United States Cattle on Feed Up 5 Percent
 Cattle on Feed ISSN: 948-90 Released March 8, 0, by the National Agricultural Statistics Service (NASS), Agricultural Statistics Board, United s Department of Agriculture (USDA). United s Cattle on Feed
Meat Animals Production, Disposition, and Income 2015 Summary
 United States Department of Agriculture National Agricultural Statistics Service Meat Animals Production, Disposition, and Income 2015 Summary ISSN: 0748-0318 April 2016 Contents Summary... 5 Meat Animals
All cows and heifers that have calved, at 40.0 million, were down 1 percent from the 40.5 million on January 1, 2010.
 Cattle ISSN: 18- Released January 28, 2011, by the National Agricultural Statistics Service (NASS), Agricultural Statistics Board, United States Department of Agriculture (USDA). January 1 Cattle Inventory
Farms and Land in Farms
 United States Department of Agriculture National Agricultural Statistics Service Farms and Land in Farms 2017 Summary February 2018 ISSN: 1995-2004 2 Farms and Land in Farms 2017 Summary (February 2018)
Milk Production, Disposition, and Income 2014 Summary
 United s Department of Agriculture National Agricultural Statistics Service Milk Production, Disposition, and Income 04 Summary ISSN: 949-506 April 05 Contents Summary... 4 Milk Cows and Production of
Facts on Direct-to-Consumer Food Marketing
 United States Department of Agriculture Agricultural Marketing Service May 2009 Facts on Direct-to-Consumer Food Marketing Incorporating Data from the 2007 Census of Agriculture Written by: Adam Diamond
Production per cow in the 23 major States averaged 1,891 pounds for January, 17 pounds above January 2013.
 Milk Production ISSN: 19-1557 Released February 20, 2014, by the National Agricultural Statistics Service (NASS), Agricultural Statistics Board, United States Department of Agriculture (USDA). January
Cattle on Feed. United States Cattle on Feed Up 3 Percent
 Cattle on Feed ISSN: 948-98 Released July,, by the National Agricultural Statistics Service (NASS), Agricultural Statistics Board, United s Department of Agriculture (USDA). United s Cattle on Feed Up
Steers weighing 500 pounds and over, as of January 1, 2018, totaled 16.4 million head, down slightly from January 1, 2017.
 Cattle ISSN: 1948-90 Released January 31, 2018, by the National Agricultural Statistics Service (NASS), Agricultural Statistics Board, United States Department of Agriculture (USDA). January 1 Cattle Inventory
Cattle on Feed. United States Cattle on Feed Up 5 Percent
 Cattle on Feed ISSN: 948-98 Released April,, by the National Agricultural Statistics Service (NASS), Agricultural Statistics Board, United s Department of Agriculture (USDA). United s Cattle on Feed Up
Cattle on Feed. United States Cattle on Feed Up 5 Percent
 Cattle on Feed ISSN: 948-8 Released October,, by the National Agricultural Statistics Service (NASS), Agricultural Statistics Board, United s Department of Agriculture (USDA). United s Cattle on Feed Up
Flour Milling Products
 Flour Milling Products ISSN: 2378-2498 Released November 1, 2018, by the National Agricultural Statistics Service (NASS), Agricultural Statistics Board, United States Department of Agriculture (USDA).
Winter Wheat Seedings
 Winter Wheat Seedings ISSN: 1949-1980 Released January 10, 2014, by the National Agricultural Statistics Service (NASS), Agricultural Statistics Board, United States Department of Agriculture (USDA). Planted
Milk Production. January Milk Production up 1.8 Percent
 Milk Production ISSN: 9-557 Released February, 08, by the National Agricultural Statistics Service (NASS), Agricultural Statistics Board, United States Department of Agriculture (USDA). January Milk Production
Overview of the U.S. Sheep and Goat Industry
 Washington, D.C. Overview of the U.S. Sheep and Goat Industry Released September 28, 2007, by the National Agricultural Statistics Service (NASS),, U.S. Department of Agriculture. For information on Overview
Cattle. January 1 Cattle Inventory Up 3 Percent
 Cattle ISSN: 1948-90 Released January 29, 2016, by the National Agricultural Statistics Service (NASS), Agricultural Statistics Board, United States Department of Agriculture (USDA). January 1 Cattle Inventory
Flour Milling Products
 Flour Milling Products ISSN: 2378-2498 Released August 1, 2018, by the National Agricultural Statistics Service (NASS), Agricultural Statistics Board, United States Department of Agriculture (USDA). Highlights
Puerto Rico - Various
 United States Department of Agriculture National Agricultural Statistics Service Puerto Rico Various Agricultural Statistics 2011 Summary April 2012 ISSN: 21548692 Summary Milk production decreased 1
Cattle on Feed. United States Cattle on Feed Down 6 Percent
 Cattle on Feed ISSN: 8- Released December 2, 202, by the National Agricultural Statistics Service (NASS), Agricultural Statistics Board, United s Department of Agriculture (USDA). United s Cattle on Feed
Cattle on Feed. United States Cattle on Feed Up 5 Percent
 Cattle on Feed ISSN: 98-98 Released January,, by the National Agricultural Statistics Service (NASS), Agricultural Statistics Board, United s Department of Agriculture (USDA). United s Cattle on Feed Up
The Pyrogeographyof Wildfires in the Western U.S.
 The Pyrogeographyof Wildfires in the Western U.S. Dr. Michael Medler 1 2 3 4 The pumps buy you time, but minutes only. From this moment, no matter what we do, Titanic will founder. But this ship can't
Agricultural Virtual Water Trade and Water Footprint of U.S. States
 Agricultural Virtual Water Trade and Water Footprint of U.S. States Stanley Mubako University of Texas at El Paso Acknowledgements: Doctoral dissertation committee at SIUC What is virtual water? Water
United States and Canadian Cattle and Sheep
 ISSN: 1949-1859 United States and Canadian Cattle and Sheep Released February 21, 2012, by the National Agricultural Statistics Service (NASS), Agricultural Statistics Board, United States Department of
Crop Production. Cr Pr 2-2 (10-09)
") Washington, D.C. Crop Production Released ober 9, 2009, by the National Agricultural Statistics Service (NASS),, U.S. Department of Agriculture. For information on call (202) 720-2127, office hours 7:30
Washington, D.C. Crop Production Released ober 9, 2009, by the National Agricultural Statistics Service (NASS),, U.S. Department of Agriculture. For information on call (202) 720-2127, office hours 7:30
Cattle on Feed. U.S. Cattle on Feed Up 3 Percent
 Cattle on Feed ISSN: 948- Released October,, by the National Agricultural Statistics Service (NASS), Agricultural Statistics Board, United s Department of Agriculture (USDA). U.S. Cattle on Feed Up 3 Percent
Cattle on Feed. United States Cattle on Feed Up 5 Percent
 Cattle on Feed ISSN: 948-80 Released September 3,, by the National Agricultural Statistics Service (NASS), Agricultural Statistics Board, United States Department of Agriculture (USDA). United States Cattle
Flour Milling Products
 Flour Milling Products ISSN: 2378-2498 Released May 1, 2018, by the National Agricultural Statistics Service (NASS), Agricultural Statistics Board, United States Department of Agriculture (USDA). Highlights
Flour Milling Products 2017 Summary
 United States Department of Agriculture National Agricultural Statistics Service Flour Milling Products 2017 Summary May 2018 ISSN: 2470-9921 2017 Flour Milling Products As part of the Current Agricultural
Apples had the highest total value of pollination of crops reported in Region 5 during in The price per colony
 Cost of Pollination ISSN: 475-435 Released December, 07, by the National Agricultural Statistics Service (NASS), Agricultural Statistics Board, United States Department of Agriculture (USDA). Cost per
Flour Milling Products
 Flour Milling Products ISSN: 2378-2498 Released February 1, 2018, by the National Agricultural Statistics Service (NASS), Agricultural Statistics Board, United States Department of Agriculture (USDA).
Hop Area Harvested, Yield, Production, Price, and Value States and United States:
 National Hop Report ISSN: Released December 17, 2010, by the National Agricultural Statistics Service (NASS), Agricultural Statistics Board, United States Department of Agriculture (USDA). 2010 Hop Production
Flour Milling Products
 Flour Milling Products ISSN: 2378-2498 Released November 2, 2015, by the National Agricultural Statistics Service (NASS), Agricultural Statistics Board, United States Department of Agriculture (USDA).
Spring Vegetables Up 1 Percent Processed Vegetable Acreage Up 12 Percent Onion Acreage Down 2 Percent
 National Agricultural Statistics Service USDA Washington, D.C. Released April 8, 999, by the National Agricultural Statistics Service (NASS),, U.S. Department of Agriculture. For information on "" call
Fruit Wildlife Damage
 Fruit National Agricultural Statistics Service USDA Washington, D.C. Released May 26, 1999, by the National Agricultural Statistics Service (NASS),, U.S. Department of Agriculture. For information on Fruit