SGX-DBS Vickers Consumer Corporate Day 28 June 2016
|
|
|
- Marsha White
- 6 years ago
- Views:
Transcription

1 SGX-DBS Vickers Consumer Corporate Day 28 June 2016
2 Agenda 1 Overview 2 Business Segments 3 Financial Performance 4 Growth Strategies 1
3 Overview Confidential
4 Leading Pan-Asian Industrialised Agri-Food Company WHAT WE DO We produce quality protein staples, dairy, and packaged food that nourish millions of people WHERE WE ARE We employ over 30,000 people across Singapore, Indonesia, Vietnam, India, Myanmar and China WHY WE DO IT 3 billion people living in our target markets More than 40% of the world s total population A leading pan-asian, industrialised agri-food company dedicated to feeding emerging Asia with essential proteins 3


5 Vertically Integrated Business Model Vertically Integrated Business Across Entire Value Chain HOW WE DO IT UPSTREAM: Animal Feed & Breeding Produce quality animal feed on an industrial scale Use world class genetics supported by advanced farming technology to maximise efficiency in our breeding operations in dairy cattle, poultry, beef cattle, swine and aquaculture MIDSTREAM: Milking & Fattening Operate dairy milking parlours and commercial livestock fattening farms Achieve quality and productivity gains through a combination of superior livestock genetics, quality feed nutrition, and international bio-security standards DOWNSTREAM: Processing & Distribution Produce high quality consumer dairy, meat, and aquaculture products with traceability and food safety assurance across the entire supply chain 4
6 Core Competencies Across All Business Segments INDUSTRIALISED APPROACH TO FARMING AND FOOD PRODUCTION 1 Large Scale 2 Technology and Genetics Ability to manage mega-scale operations: > 10,000 poultry commercial farms > 600 million day-old-chicks ( DOCs ) 6 large scale dairy farms with more than 10,000 cattle per farm 30,000 employees across geographies JVs with and for superior breeding and genetics Advanced feed technology Combined with best farm management practices 3 Bio-security 4 Standardisation / Replication Best in class biosecurity means using stringent operating procedures In-house vaccine production firm PT Vaksindo Replication of best practices and infrastructure design Replication of farm design model in dairy farms, DOC breeding farms, feedmills, etc. We are a market leader across multiple classes of protein foods, with an emphasis on poultry, swine and milk, complemented by growing businesses in beef and aquaculture. 5
7 Our Business Confidential
8 The right business in the right markets A Large and growing shortfall in China Indonesian poultry (raw milk in million tons) E 2014F 2015F 2016F 2017F 2018F Per capita consumption Malaysia 2013 #2 Others 34% Market share Japfa 25% Charoen Pokphand 41% B Domestic consumption Domestic production Similar trend in Indonesia (1) Vietnam swine (dairy products in million tons) Per capita consumption 40.5 Market share Top 4 (inc. Japfa) 10-14% Others 86% F 2015F 2016F 2017F 2018F Domestic consumption Domestic production 2013 China 2013 Attractive growth opportunities for premium upstream dairies and animal protein producers Source: Frost & Sullivan. (1) Domestic production does not include domestically produced dairy products that use imported raw materials. 7
 Frozen consumer food Ambient temperature consumer food Indomilk 12% Sierad Produce 17% 31% Others 46% Canning Foods 9% Heinz ABC 16% Maya")
9 Leading market positions in multiple protein staples Leading market positions Leading downstream consumer brands that are a key driver for future growth Leading Consumer Brands In Indonesia #1 #2 Others #3 15% PT CP Indonesia 24% 38% Others 64% Dairy (6) Frozen consumer food Ambient temperature consumer food Indomilk 12% Sierad Produce 17% 31% Others 46% Canning Foods 9% Heinz ABC 16% Maya Muncar 16% 13% Source: Company, Frost & Sullivan, 2013 (1) In terms of volume except for Frozen consumer food and Ambient temperature food which are in terms of value. (2) In terms of production capacity. (3) Based on number of heads. (4) Largest importer based on number of import permits. (5) Market shares shown for Japfa brands in particular markets within Indonesia. (6) Based on total volume of fresh milk sold in
10 Animal Protein Segment Confidential

11 Poultry breeding operations 10

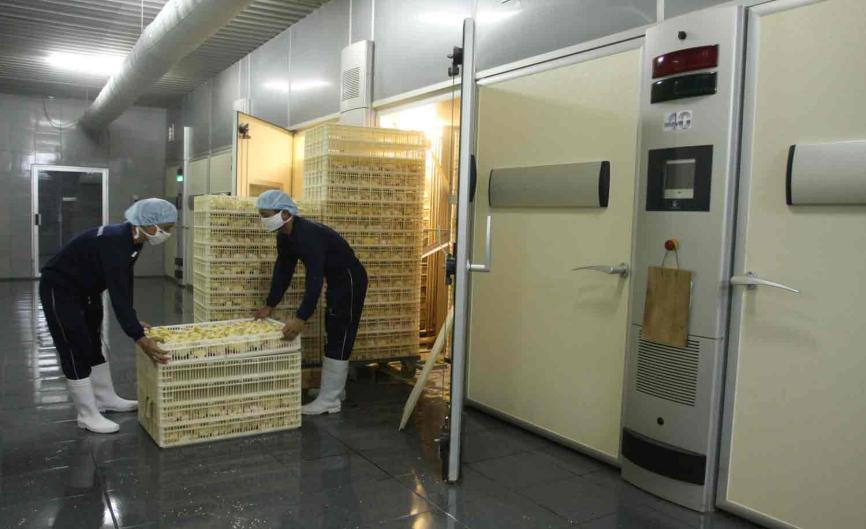

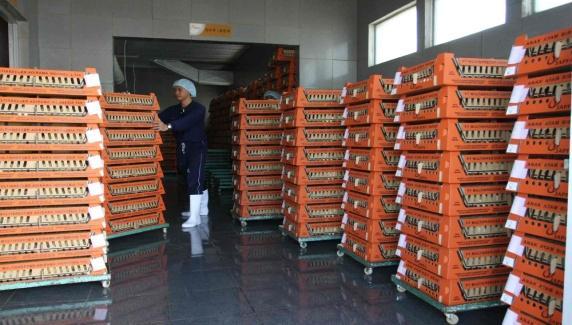
12 Poultry breeding operations 11
13 PT Japfa Comfeed Indonesia Tbk: Pillar of Animal Protein excellence Feed Fattening Economies of scale including geographical reach Ability to pass on raw material cost increases Consistent quality of feed formulation Proven farm management and technical know-how Poultry commercial farming operations mostly through contract farming, and sold as live birds Broilers produced by own farms are mainly used in the Company s own slaughterhouses and further processing Breeding Superior genetics Highly efficient breeding process Best in-class bio-security with in-house animal vaccine The three vertically integrated components are common across all animal proteins 12


14 Replicating Indonesian pillar in new markets and proteins Vietnam Swine breeding and distribution operations in Vietnam Produce premium-quality animal feed Myanmar / India Leading market positions for poultry in Myanmar Developing poultry operations in India Beef One of the largest beef cattle feedlot operators in Indonesia Largest importer of beef cattle into Indonesia Cattle breeding operations in Australia Swine 5 Swine & Poultry Feedmills 1 Great Grandparent Farm, 5 Grandparent Farms, 16 Parent Farms 3 Nursery Farms & over 50 Contract Farms 12 Fattening Farms & over 80 Contract Farms Myanmar 1 Poultry Feedmill 2 Poultry Breeding Farms and 2 Hatcheries Over 120 Company Farms & over 80 Contract Farms Indonesia 4 Cattle Fattening Farms 2 Cattle Breeding Farms 1 Beef processing operation Poultry 5 Swine & Poultry Feedmills 10 Breeding Farms 4 Hatcheries Over 30 Company Farms & over 230 Contract Farms India 6 Poultry Feedmills 1 Breeding Farm 2 Hatcheries Over 500 Contract Farms China 1 Cattle Rearing and Fattening Farm 13
15 Dairy Segment Confidential


16 Dairy Farm in Shandong: Breeding Hutches 15

17 Dairy Farm in Shandong 16

18 Dairy Farm in Shandong: Feeding Barn 17

19 Dairy Farm in Shandong: Rotary Milking Parlor 18

,")
20 Key drivers for profitability Milk yield X Milk price = Profitability Japfa s yield continues to surpass listed China competitors Est. China average = 18.4kg/day Source: Rabobank Yield Comparison Chart, based on data for calendar year 2014 or FY2014/2015 from various listed companies including Austasia (a Japfa Ltd subsidiary), USDA (*) and Rabobank 19

 For")
21 Key milestones Indonesia - Farm Commenced operations at dairy farm in Malang, East Java, Indonesia Indonesia - Downstream Launched our Greenfields brand of milk China Joint Venture Approached by Mengniu to establish and manage a joint venture 10,000-head dairy farm in Inner Mongolia Subsequently sold to joint venture partner China 5 farm Hub in Shandong Produces superior quality raw milk with a per kg price premium of c. 25% to the industry average (1) Best-in-class dairy farm management with average yield of 12.3 tons per cow per year China 5 farm Hub in Chifeng MOUs signed for two sites Construction of first farm commenced in 2014 Target capacity for 120,000 heads of cattle across both hubs Note: (1) For 2013 based on China Dairy Association and Frost & Sullivan estimates. 20
22 Key success factors for our high milk yields Forage Understanding and developing localised forage supply in an Asian context Scientific development of feed formulation for optimal nutrition for cow health and milk output Results in highest quality milk output Farm design Proven Asian 10,000-head dairy farm blue-print Infrastructure and standardised systems Designed to maximise cattle welfare, operational efficiency and milk quality Farms located in targeted areas within optimal environmental parameters Farm management Retention of experienced management over last twenty years Continuous recruitment and training of employees to industry best-practices Key focus on genetic improvements Bio-security Best practices in farm management 21
23 Consumer Food Segment Confidential
24 Scaled consumer food production and distribution platform in Indonesia; replicating in Vietnam Indonesia Vietnam 5 meat processing plants 1 meat processing plant producing ambient temperature sausages 5 poultry slaughterhouses Internal marketing, sales & distribution department that plans new product launches and determines pricing, sales and distribution strategy 1 UHT milk processing plant Production facility strategically located near Ho Chi Minh City, Vietnam s largest urban consumer market Distribution network of 7 regional sales branches, 58 regional sales depots All facilities are Halal compliant and one of our plants has been certified ISO % of chicken ingredients used by PT So Good Food are sourced from our subsidiary farms 23
25 Financial Performance Confidential

26 Japfa s Growth Pillars and Diversification Strategy China Dairy China Dairy China Dairy Animal Protein Other Animal Protein Other Animal Protein Other PT Japfa TBK PT Japfa TBK PT Japfa TBK Size of circles represent Core PATMI w/o Forex PT Japfa Tbk has gone through a rough patch in 4Q2014 and 1H2015 Animal Protein Other has been on a good growth trajectory China Dairy s contribution has slowed in 2015 due to downward pressure on milk prices Dairy Swine Aquaculture Poultry Beef 25
27 Pre-IPO Till Today : Strong Growth Across All Indicators For the period 12 months ended 31 March 2,711.6 Revenue US$ million +4.3% 2,829.1 Operating Profit US$ million % EBITDA US$ million +37.6% PAT US$ million +59.9% M ended 31/3/ M ended 31/3/ M ended 31/3/ M ended 31/3/ M ended 31/3/ M ended 31/3/ M ended 31/3/ M ended 31/3/2016 PATMI US$ million Core PATMI US$ million 86.7 Core PATMI w/o Forex US$ million 98.8 ROE % % % % ppt M ended 31/3/ M ended 31/3/ M ended 31/3/ M ended 31/3/ M ended 31/3/ M ended 31/3/ M ended 31/3/ M ended 31/3/2016 Core PATMI from Profit Attributable to Owners of the Parent, Net of Tax by excluding changes in fair value of biological assets attributable to owners of the parent (net of tax), and excluded extraordinary items (attributable to owners of the parent, net of tax) namely a gain from the buyback of USD bonds in PT Japfa Tbk. Core PATMI w/o Forex (Estimate) is derived from Core PATMI by excluding foreign exchange gains/losses (before tax) attributable to the owners of the parent. As the majority of the foreign exchange gains/losses are unrealised and arises from the translation of USD bonds in PT Japfa Tbk, which has no tax implication, we have not made an estimate of the tax impact on foreign exchange gains/losses. Accordingly this Core PATMI w/o Forex (Estimate) is to be viewed as an indicative number only. 26


28 Pre-IPO Till Today : Developing Three Core Pillars For the period 12 months ended 31 March Revenue US$ million EBITDA US$ million PAT US$ million Core PATMI w/o Forex US$ million PT Japfa Tbk 12M ended 31/3/ M ended 31/3/ % 1, , % % % 35.3 Animal feed business is one of our core stable strengths Poultry business turned around in 2H 2015, after a challenging period Animal Protein Other 12M ended 31/3/ M ended 31/3/ % % -7.9 n.m n.m Successful replication of poultry business in Vietnam and Myanmar Turnaround of swine business in Vietnam Dairy 12M ended 31/3/ M ended 31/3/ % % % % 16.4 Constant improvement in milk volume and yields helped mitigate low milk price environment 27


29 Group Revenue and Earnings Profile FY2015 Revenue Composition FY2014 Revenue Composition FY2015 Operating Profit Composition FY2014 Operating Profit Composition Operational segments shown above excludes central purchasing subsidiary, headquarter costs and elimination adjustments between segments 28
30 Segmental Highlights PT Japfa Tbk Turnaround in poultry business in 2H 2015 Improved poultry market in Indonesia with better selling prices of feed, DOCs and broilers in 2H 2015 Strong PAT despite foreign exchange loss Notwithstanding challenging and volatile conditions in Indonesia, PT Japfa Tbk has since generated positive cash flow and EBITDA Animal Protein Other Overall performance in APO boosted by significant improvement in Vietnam s operations, especially in the swine operations This was offset by weaker performance in India and start-up losses for China s beef operations Animal Protein Other continues to be a key part of the Group s diversification strategy Dairy Low raw milk prices continue to persist in China, as compared to exceptionally high prices in FY2014 Low prices have been mitigated by growth in sales volumes and improvement in milk yields Consumer Food Consumer Food business in Indonesia has been profitable Overall Consumer Food segment impacted by the start-up loss of Consumer Food operations in Vietnam 29

31 Diversification strategy across three pillars Core PATMI Breakdown Core PATMI w/o Forex Breakdown Balance contribution from the Group s three pillars PT Japfa Tbk, Animal Protein Other and Dairy Operational segments shown above excludes central purchasing subsidiary, headquarter costs and elimination adjustments between segments 30


32 PT Japfa Tbk (Poultry): 3-Year Segmental Trends Revenue US$ million 2, ,387.4 Operating Profit Margin Operating Profit US$ million 2, Poultry Feed and DOC Sales Volume PT Japfa Tbk is one of the core pillars of the Group s business Revenue trend was mainly impacted by the weakening of Rupiah and lower volumes Profitability in the past two years was affected by the issues in the poultry industry Nonetheless, our feed business continues to be the stable pillar of our profitability, even during market downturn Our ability to pass on raw material costs increases in our feed selling prices is reflected in our stable feed operating margins, during a period of Rupiah volatility Breeding and commercial farming was operating at a loss in FY2014, but with the improved market environment in 2H2015, breeding operations have reduced their losses while commercial farming has turned around Note: The revenue figures for the poultry operational units shown above include inter-segment sales. 31


33 Animal Protein Other: 3-Year Segmental Trends Revenue US$ million Operating Profit Margin Operating Profit US$ million Feed and Swine Fattening Volume Diversification strategy is coming through With our expertise and track record in the poultry business, we are replicating the same success model in Vietnam, Myanmar and India Profitability of our Animal Protein Other business has been strengthening over the past three years Vietnam s strong growth was in part due to the turnaround of its swine business it incurred a start-up loss in FY2013, broke even in the following year and turned profitable in FY2015 Myanmar contributed consistently in the last two years to our revenue and profitability, and provides growth opportunity in the medium term In the longer term, we see India as another key growth market; our current focus is on growing our feed business Our aim is to grow the Animal Protein Other business to be the next major pillar for the Group Note: Operational units shown above exclude beef operations in China. 32


34 Dairy: 3-Year Segmental Trends Revenue US$ million Operating Profit US$ million Dairy business is poised to be a strong third pillar for the Group Revenue growth for our dairy business has been driven by China Profit generation is similarly driven by China, while our SEA operations are breaking even Operating Profit Margin China Raw Milk Sales Volume and Average Daily Milking In China, our current operations are focused on dairy farming, whereas in SEA, our focus has moved beyond dairy farming to downstream processing and branding In SEA, we have been investing strategically in building the Greenfields brand Profitability in FY2015 was subdued by the low raw milk price environment in China We continue to focus on improving our milk yields and volumes in China, to mitigate fluctuations in raw milk prices 33
35 Growth Strategies Confidential
36 Growth Strategies Focus on Industrialisation and Diversification Leverage our track record in replicating our industrialised and scalable business, to build our three key business pillars poultry in Indonesia, poultry and swine in Indochina, and dairy in China Mitigating Market Challenges Continue to enhance efficiency and profitability of our operations to counter price fluctuations Improve milk yields and productivity to mitigate lower average selling prices of raw milk in China Maximising Returns from Our Assets Long term fundamentals for the Group remain favorable Large-scale business enables us to tap on growth opportunities Strategic investments in selected markets to capture rise in consumer demand 35
37 Appendix Confidential
38 Quarterly Segment Information 1Q Q 2016 ANIMAL PROTEIN DAIRY CONSUMER Others TOTAL TBK AP Other Total FOOD External Revenue (0.0) Inter Segment Sales (11.0) 0.0 TOTAL REVENUE (11.0) OPERATING PROFIT % 7.3% 6.2% 21.5% 0.9% -15.3% 7.7% EBITDA % 8.6% 9.0% 25.9% 4.6% -16.0% 10.7% Depreciation & Amortization (12.0) (1.7) (13.7) (4.7) (1.6) (0.1) (20.1) Net Interest Expense (10.4) (0.7) (11.1) (2.0) (1.6) (0.7) (15.3) Fair Value Gain(Loss) Marketable Securities (0.0) 0.0 (0.8) (0.8) PBT before Forex & BioA Valuation (1.1) Forex Gain(loss) (1.4) Fair Value Gain(Loss) Bio A (4.9) 0.0 (0.0) (1.6) PBT (2.5) Tax (9.7) (0.5) (10.2) (0.5) 0.0 (0.2) (10.9) PAT (2.5) (0.0) 37.1 PAT w/o Bio A (2.5) (0.0) 39.3 % ownership 58.7% 100.0% 61.9% 100.0% 100.0% PATMI (2.5) (0.0) 23.4 Core PATMI (2.5) (0.0) 24.4 Core PATMI w/o Forex (1.1) (0.1) 19.8 Notes: Animal Protein - where PT.Japfa Comfeed Indonesia Tbk (TBK) is shown separately from Animal Protein Other (AP Other). Animal Protein Other (AP Other) refers to the animal protein operations in Vietnam, India, Myanmar and China. Dairy includes the operations in China, Indonesia and Southeast Asia. Consumer Food includes the operations in Indonesia and Vietnam. Others - include corporate office, central purchasing office in Singapore and consolidation adjustments between segments. EBITDA = PBT net of interest income (expense), FV of bio assets and marketable securities, forex gain (loss), depreciation of fixed assets and amortization of intangible assets. Core PATMI from Profit Attributable to Owners of the Parent, Net of Tax by excluding changes in fair value of biological assets attributable to owners of the parent (net of tax), and excluded extraordinary items (attributable to owners of the parent, net of tax) namely a gain from the buyback of USD bonds in PT Japfa Tbk. Core PATMI w/o Forex (Estimate) is derived from Core PATMI by excluding foreign exchange gains/losses (before tax) attributable to the owners of the parent. As the majority of the foreign exchange gains/losses are unrealised and arises from the translation of USD bonds in PT Japfa Tbk, which has no tax implication, we have not made an estimate of the tax impact on foreign exchange gains/losses. Accordingly this Core PATMI w/o Forex (Estimate) is to be viewed as an indicative number only. Dairy ownership of 61.9% refers to AIH. Ownership of AIH2 is 64.5%. 37
39 Quarterly Segment Information 4Q Q 2015 ANIMAL PROTEIN DAIRY CONSUMER Others TOTAL TBK AP Other Total FOOD External Revenue (0.0) Inter Segment Sales (10.2) (0.0) TOTAL REVENUE (10.2) OPERATING PROFIT % 5.0% 9.8% 18.9% 0.5% -26.3% 10.6% EBITDA % 6.0% 12.1% 25.2% 3.0% -26.0% 13.3% Depreciation & Amortization (11.4) (1.6) (13.0) (4.4) (1.2) (0.1) (18.7) Net Interest Expense (11.3) (0.5) (11.8) (1.5) (1.3) (0.6) (15.2) Fair Value Gain(Loss) Marketable Securities (0.0) 0.0 (0.1) (0.1) PBT before Forex & BioA Valuation (1.1) Forex Gain(loss) 10.3 (0.0) 10.3 (2.0) (1.5) (0.0) 6.9 Fair Value Gain(Loss) Bio A (0.0) 13.8 PBT (2.5) Tax (7.0) 0.1 (6.9) (0.8) (6.8) PAT (2.1) PAT w/o Bio A (2.1) % ownership 58.0% 100.0% 61.9% 100.0% 100.0% PATMI (2.1) Core PATMI (2.1) Core PATMI w/o Forex (0.7) Notes: Animal Protein - where PT.Japfa Comfeed Indonesia Tbk (TBK) is shown separately from Animal Protein Other (AP Other). Animal Protein Other (AP Other) refers to the animal protein operations in Vietnam, India, Myanmar and China. Dairy includes the operations in China, Indonesia and Southeast Asia. Consumer Food includes the operations in Indonesia and Vietnam. Others - include corporate office, central purchasing office in Singapore and consolidation adjustments between segments. EBITDA = PBT net of interest income (expense), FV of bio assets and marketable securities, forex gain (loss), depreciation of fixed assets and amortization of intangible assets. Core PATMI from Profit Attributable to Owners of the Parent, Net of Tax by excluding changes in fair value of biological assets attributable to owners of the parent (net of tax), and excluded extraordinary items (attributable to owners of the parent, net of tax) namely a gain from the buyback of USD bonds in PT Japfa Tbk. Core PATMI w/o Forex (Estimate) is derived from Core PATMI by excluding foreign exchange gains/losses (before tax) attributable to the owners of the parent. As the majority of the foreign exchange gains/losses are unrealised and arises from the translation of USD bonds in PT Japfa Tbk, which has no tax implication, we have not made an estimate of the tax impact on foreign exchange gains/losses. Accordingly this Core PATMI w/o Forex (Estimate) is to be viewed as an indicative number only. Dairy ownership of 61.9% refers to AIH. Ownership of AIH2 is 64.5%. 38
40 Quarterly Segment Information 3Q Q 2015 ANIMAL PROTEIN DAIRY CONSUME R Others TOTAL TBK AP Other Total FOOD External Revenue Inter Segment Sales (11.6) 0.0 TOTAL REVENUE (11.6) OPERATING PROFIT % 5.9% 9.6% 11.2% 2.0% -7.7% 9.5% EBITDA % 7.3% 12.7% 17.5% 3.6% -8.5% 12.9% Depreciation & Amortization (11.3) (1.9) (13.2) (3.9) (1.2) (0.1) (18.3) Net Interest Expense (12.6) (0.6) (13.2) (2.2) (1.1) (0.7) (17.2) Fair Value Gain(Loss) Marketable Securities PBT before Forex & BioA Valuation (0.5) Forex Gain(loss) (25.3) (1.1) (26.4) (4.1) 1.8 (0.1) (28.9) Fair Value Gain(Loss) Bio A (12.1) (9.3) PBT (10.9) Tax (6.3) (0.6) (6.9) 0.1 (0.7) (0.2) (7.7) PAT (10.8) PAT w/o Bio A % ownership 57.5% 100.0% 61.9% 100.0% 100.0% PATMI (6.9) Core PATMI Core PATMI w/o Forex (1.3) Notes: Animal Protein - where PT.Japfa Comfeed Indonesia Tbk (TBK) is shown separately from Animal Protein Other (AP Other). Animal Protein Other (AP Other) refers to the animal protein operations in Vietnam, India, Myanmar and China. Dairy includes the operations in China, Indonesia and Southeast Asia. Consumer Food includes the operations in Indonesia and Vietnam. Others - include corporate office, central purchasing office in Singapore and consolidation adjustments between segments. EBITDA = PBT net of interest income (expense), FV of bio assets and marketable securities, forex gain (loss), depreciation of fixed assets and amortization of intangible assets. Core PATMI from Profit Attributable to Owners of the Parent, Net of Tax by excluding changes in fair value of biological assets attributable to owners of the parent (net of tax), and excluded extraordinary items (attributable to owners of the parent, net of tax) namely a gain from the buyback of USD bonds in PT Japfa Tbk. Core PATMI w/o Forex (Estimate) is derived from Core PATMI by excluding foreign exchange gains/losses (before tax) attributable to the owners of the parent. As the majority of the foreign exchange gains/losses are unrealised and arises from the translation of USD bonds in PT Japfa Tbk, which has no tax implication, we have not made an estimate of the tax impact on foreign exchange gains/losses. Accordingly this Core PATMI w/o Forex (Estimate) is to be viewed as an indicative number only. Dairy ownership of 61.9% refers to AIH. Ownership of AIH2 is 64.5%. 39
41 Quarterly Segment Information 2Q Q 2015 ANIMAL PROTEIN DAIRY CONSUMER Others TOTAL TBK AP Other Total FOOD External Revenue (0.0) Inter Segment Sales (12.9) (0.0) TOTAL REVENUE (12.9) OPERATING PROFIT % 9.0% 4.9% 17.7% 4.9% -6.3% 6.3% EBITDA % 10.2% 7.0% 23.8% 7.3% -8.6% 8.9% Depreciation & Amortization (11.4) (1.6) (13.0) (3.9) (1.2) (0.2) (18.2) Net Interest Expense (13.2) (0.8) (14.0) (2.1) (1.3) (0.5) (18.0) Fair Value Gain(Loss) Marketable Securities PBT before Forex & BioA Valuation Forex Gain(loss) (6.8) (0.2) (7.0) (6.0) Fair Value Gain(Loss) Bio A (1.3) (4.1) (5.4) (12.1) (17.5) PBT (3.7) (2.0) Tax (0.8) (0.8) (1.6) 0.7 (0.9) (0.2) (2.0) PAT (4.5) (1.3) PAT w/o Bio A (3.5) % ownership 57.5% 100.0% 61.9% 100.0% 100.0% PATMI (3.2) (0.8) Core PATMI (2.6) Core PATMI w/o Forex Notes: Animal Protein - where PT.Japfa Comfeed Indonesia Tbk (TBK) is shown separately from Animal Protein Other (AP Other). Animal Protein Other (AP Other) refers to the animal protein operations in Vietnam, India, Myanmar and China. Dairy includes the operations in China, Indonesia and Southeast Asia. Consumer Food includes the operations in Indonesia and Vietnam. Others - include corporate office, central purchasing office in Singapore and consolidation adjustments between segments. EBITDA = PBT net of interest income (expense), FV of bio assets and marketable securities, forex gain (loss), depreciation of fixed assets and amortization of intangible assets. Core PATMI from Profit Attributable to Owners of the Parent, Net of Tax by excluding changes in fair value of biological assets attributable to owners of the parent (net of tax), and excluded extraordinary items (attributable to owners of the parent, net of tax) namely a gain from the buyback of USD bonds in PT Japfa Tbk. Core PATMI w/o Forex (Estimate) is derived from Core PATMI by excluding foreign exchange gains/losses (before tax) attributable to the owners of the parent. As the majority of the foreign exchange gains/losses are unrealised and arises from the translation of USD bonds in PT Japfa Tbk, which has no tax implication, we have not made an estimate of the tax impact on foreign exchange gains/losses. Accordingly this Core PATMI w/o Forex (Estimate) is to be viewed as an indicative number only. Dairy ownership of 61.9% refers to AIH. Ownership of AIH2 is 64.5%. 40
42 Quarterly Segment Information 1Q Q 2015 ANIMAL PROTEIN DAIRY CONSUMER Others TOTAL TBK AP Other Total FOOD External Revenue Inter Segment Sales (12.5) 0.0 TOTAL REVENUE (12.5) OPERATING PROFIT % 7.1% 2.9% 22.0% 1.7% -4.9% 4.7% EBITDA % 8.5% 5.3% 27.2% 4.8% -6.5% 7.4% Depreciation & Amortization (11.2) (1.8) (13.0) (3.6) (1.2) (0.2) (18.1) Net Interest Expense (12.0) (0.6) (12.6) (2.4) (1.3) (0.6) (16.9) Fair Value Gain(Loss) Marketable Securities (0.2) (0.2) PBT before Forex & BioA Valuation (2.9) (0.5) (0.2) 15.1 Forex Gain(loss) (13.7) (0.1) (13.8) (0.5) 0.8 (0.4) (13.9) Fair Value Gain(Loss) Bio A PBT (16.4) 13.2 (3.2) (0.6) 8.6 Tax (0.7) (1.4) (2.2) 0.2 (1.4) (0.2) (3.6) PAT (17.1) 11.8 (5.3) 12.2 (1.1) (0.8) 5.0 PAT w/o Bio A (17.3) 7.9 (9.4) 10.0 (1.1) (0.8) (1.3) % ownership 57.5% 100.0% 61.9% 100.0% 100.0% PATMI (10.2) (1.1) (0.8) 7.0 Core PATMI (10.3) 7.6 (2.6) 6.2 (1.1) (0.8) 1.6 Core PATMI w/o Forex (2.4) (1.9) (0.4) 9.5 Notes: Animal Protein - where PT.Japfa Comfeed Indonesia Tbk (TBK) is shown separately from Animal Protein Other (AP Other). Animal Protein Other (AP Other) refers to the animal protein operations in Vietnam, India, Myanmar and China. Dairy includes the operations in China, Indonesia and Southeast Asia. Consumer Food includes the operations in Indonesia and Vietnam. Others - include corporate office, central purchasing office in Singapore and consolidation adjustments between segments. EBITDA = PBT net of interest income (expense), FV of bio assets and marketable securities, forex gain (loss), depreciation of fixed assets and amortization of intangible assets. Core PATMI from Profit Attributable to Owners of the Parent, Net of Tax by excluding changes in fair value of biological assets attributable to owners of the parent (net of tax), and excluded extraordinary items (attributable to owners of the parent, net of tax) namely a gain from the buyback of USD bonds in PT Japfa Tbk. Core PATMI w/o Forex (Estimate) is derived from Core PATMI by excluding foreign exchange gains/losses (before tax) attributable to the owners of the parent. As the majority of the foreign exchange gains/losses are unrealised and arises from the translation of USD bonds in PT Japfa Tbk, which has no tax implication, we have not made an estimate of the tax impact on foreign exchange gains/losses. Accordingly this Core PATMI w/o Forex (Estimate) is to be viewed as an indicative number only. Dairy ownership of 61.9% refers to AIH. Ownership of AIH2 is 64.5%. 41
43 Segment Information FY2015 YTD DEC 2015 ANIMAL PROTEIN DAIRY CONSUMER Others TOTAL TBK AP Other Total FOOD External Revenue 1, , ,787.1 Inter Segment Sales (47.3) 0.0 TOTAL REVENUE 1, , (47.3) 2,787.1 OPERATING PROFIT % 6.7% 6.8% 17.4% 2.3% -10.6% 7.8% EBITDA % 8.0% 9.3% 23.4% 4.7% -11.8% 10.7% Depreciation & Amortization (45.3) (6.9) (52.1) (15.7) (4.8) (0.5) (73.3) Net Interest Expense (49.1) (2.5) (51.6) (8.2) (5.1) (2.4) (67.2) Fair Value Gain(Loss) Marketable Securities (0.0) PBT before Forex & BioA Valuation (1.1) Forex Gain(loss) (35.5) (1.4) (36.9) (6.0) 1.3 (0.5) (42.0) Fair Value Gain(Loss) Bio A (8.2) (5.6) PBT Tax (14.9) (2.7) (17.6) 0.1 (2.6) (0.1) (20.2) PAT (2.4) PAT w/o Bio A (2.4) % ownership 58.0% 100.0% 61.9% 100.0% 100.0% PATMI (2.4) Core PATMI (2.4) Core PATMI w/o Forex (3.7) Notes: Animal Protein - where PT.Japfa Comfeed Indonesia Tbk (TBK) is shown separately from Animal Protein Other (AP Other). Animal Protein Other (AP Other) refers to the animal protein operations in Vietnam, India, Myanmar and China. Dairy includes the operations in China, Indonesia and Southeast Asia. Consumer Food includes the operations in Indonesia and Vietnam. Others - include corporate office, central purchasing office in Singapore and consolidation adjustments between segments. EBITDA = PBT net of interest income (expense), FV of bio assets and marketable securities, forex gain (loss), depreciation of fixed assets and amortization of intangible assets. Core PATMI from Profit Attributable to Owners of the Parent, Net of Tax by excluding changes in fair value of biological assets attributable to owners of the parent (net of tax), and excluded extraordinary items (attributable to owners of the parent, net of tax) namely a gain from the buyback of USD bonds in PT Japfa Tbk. Core PATMI w/o Forex (Estimate) is derived from Core PATMI by excluding foreign exchange gains/losses (before tax) attributable to the owners of the parent. As the majority of the foreign exchange gains/losses are unrealised and arises from the translation of USD bonds in PT Japfa Tbk, which has no tax implication, we have not made an estimate of the tax impact on foreign exchange gains/losses. Accordingly this Core PATMI w/o Forex (Estimate) is to be viewed as an indicative number only. Dairy ownership of 61.9% refers to AIH. Ownership of AIH2 is 64.5%. 42
44 Disclaimer This presentation has been prepared by Japfa Ltd. (the Company ) solely for use at a presentation to potential investors. By attending the meeting where the presentation is made, or by reading the presentation slides, you agree to the following limitations and notifications and represent that you are a person who is permitted under applicable law and regulation to receive information of the kind contained in this presentation. This presentation is strictly confidential to the recipient, may not be reproduced, retransmitted or distributed to the press or any other person, may not be reproduced in any form and may not be published, forwarded or distributed, in whole or in part, for any purpose. This presentation is not directed to, or intended for distribution to or use by, any person or entity that is a citizen or resident or located in any locality, state, country or other jurisdiction where such distribution, transmission, publication, availability or use would be contrary to law or regulation or which would require any registration or licensing within such jurisdiction. This presentation does not constitute, nor form part of, and should not be construed as constituting or forming part of, any advertisement of, any offer or invitation to sell or issue or any solicitation of any offer to purchase or subscribe for, any securities in the Company. The information contained in this presentation is for informational purposes only and does not constitute an offer or invitation to sell or the solicitation of an offer or invitation to purchase for any securities, and should not be construed as such. This presentation should not, nor should anything contained in it, form the basis of, or be relied upon in any connection with any contract or commitment whatsoever, and does not constitute a recommendation regarding the securities of the Company. This presentation is intended only for the attendees of the presentation and may not be retransmitted or distributed by them to any other persons. This presentation contains forward-looking statements that involve risks and uncertainties. Actual future performance, outcomes and results may differ materially from those expressed in forward-looking statements as a result of a number of risks, uncertainties and assumptions. Although the Company believes that such forward-looking statements are based on reasonable assumptions, it can give no assurance that such expectations will be met. You are cautioned not to place undue reliance on these forward looking statements, which are based on current view of the management on future events. The information in this presentation is still preliminary and in draft form and is subject to completion and/or change without notice. Any investment in the Company should be made solely on the basis of information contained in the prospectus to be prepared by the Company in connection with the initial public offering and any supplement thereto. Unless otherwise stated, the Company is the source for all data contained in this presentation. Such data is provided as at the date of this presentation and is subject to change without notice. No reliance may be placed for any purposes whatsoever on the information contained in this presentation, or any other material discussed at the presentation, or on the completeness, accuracy or fairness thereof. The information in this presentation has not been independently verified. No representation, warranty, express or implied, is made as to, and no reliance should be placed on, the fairness, accuracy, completeness or correctness of the information and opinions in this presentation. None of the Company or any of its agents or advisers, or any of their respective affiliates, advisers or representatives, undertake to update or revise any forward-looking statements, whether as a result of new information, future events or otherwise and none of them shall have any liability (in negligence or otherwise) for any loss howsoever arising from any use of this presentation or its contents or otherwise arising in connection with this presentation. This presentation also contains certain statistical data and analyses (the Statistical Information ) which have been prepared in reliance upon information from the Company and/or other sources. Numerous assumptions were used in preparing the Statistical Information, which assumptions may or may not appear herein. As such, no assurance can be given as to the Statistical Information s accuracy, appropriateness or completeness in any particular context, nor as to whether the Statistical Information and/or the assumptions upon which they are based reflect present market conditions or future market performance. This presentation should not be treated as advice relating to legal, taxation, financial, accounting or investment matters. By attending this presentation you (i) acknowledge that you will be solely responsible for your own assessment of the market and the market position of the Company and of the risks and merits of any investment in the securities of the Company, and that you will conduct your own analysis and be solely responsible for forming your own view of the potential future performance of the Company s business, (ii) agree to be bound by the foregoing terms and to keep this presentation and the information contained herein confidential. 43
45 Thank You Confidential
Japfa Ltd Corporate Presentation. DBS Vickers Pulse of Asia Conference, Singapore January 2015
 Japfa Ltd Corporate Presentation DBS Vickers Pulse of Asia Conference, Singapore January 2015 Agenda 1 Overview 2 Business 3 Dairy Segment 4 Animal Protein Segment 5 Consumer Food Segment 6 Growth Strategies
JAPFA LTD. Corporate Presentation 2018
 JAPFA LTD Corporate Presentation 2018 28 March 2018 Agenda 1 Group Overview 2 Our Business Segments 3 Looking Ahead 4 Appendix 1 Group Overview Established in 1975 Feeding Emerging Asia 5 animal protein
JAPFA LTD Corporate Presentation 2018
 JAPFA LTD Corporate Presentation 2018 Agenda 1 Group Overview 2 Our Business Segments 3 Looking Ahead 4 Appendix 1 Group Overview Established in 1975 Feeding Emerging Asia 5 animal protein businesses in
INVESTOR PRESENTATION
 INVESTOR PRESENTATION 1Q FY 2018 2017 Agenda 1 Company Overview 2 Key Investment Highlights 3 KKR s Investment in the Company 4 Financial and Operational Highlights 1 1. Company Overview 2 Company overview
INVESTOR PRESENTATION
 INVESTOR PRESENTATION FY FY 2017 2017 Agenda 1 Company Overview 2 Key Investment Highlights 3 KKR s Investment in the Company 4 Financial and Operational Highlights 1 1. Company Overview 2 Company overview
Japfa Ltd. INVESTOR PRESENTATION Proposed Acquisition of Remaining Interest in AustAsia January 2018
 Japfa Ltd INVESTOR PRESENTATION Proposed Acquisition of Remaining Interest in AustAsia January 2018 IMPORTANT NOTICE: This presentation is for information only and may contain forward-looking statements
Agenda. 1 Company Overview. Key Investment Highlights. KKR s Investment in the Company. Financial and Operational Highlights
 2Q 2017 Agenda 1 Company Overview 2 Key Investment Highlights 3 KKR s Investment in the Company 4 Financial and Operational Highlights 1 1. Company Overview 2 Company overview Core competencies across
Australian Agricultural Company. Financial Results Full Year ended 31 March 2017
 Australian Agricultural Company Financial Results Full Year ended 31 March 2017 FY17 snapshot path of continued growth AACo s strategy is delivering returns Operational performance delivering financial
INVESTOR PRESENTATION
 INVESTOR PRESENTATION SWISS EQUITIES CONFERENCE BAADER HELVEA R. ERNI, CFO BAD RAGAZ 12 JANUARY 2018 Panalpina Biz Model / Strategy Achievements and key figures Operating and financial review Appendix
For personal use only
 ASX Release Apiam Animal Health Limited (ASX: AHX) Investor Presentation Melbourne, 2 July, 2018 Apiam Animal Health Limited today releases the attached Investor Presentation, which provides an update
Strengthening the experience and embracing the shift
 Strengthening the experience and embracing the shift THIS PRESENTATION IS NOT AN OFFER OR SOLICITATION OF AN OFFER TO BUY OR SELL SECURITIES. IT IS SOLELY FOR USE AT A CAPITAL MARKETS EVENT AND IS PROVIDED
Company Presentation. 15 th May Delivery Hero AG. Company Presentation.
 Company Presentation 15 th May 2018 1 Our Clear Vision AMAZING FOOD Create an amazing takeaway experience AMAZING ORDERING AMAZING SERVICE 2 We Are an Online Food Ordering and Delivery Marketplace USER
CHAPTER II BUSINESS ANALYSIS
 8 CHAPTER II BUSINESS ANALYSIS 2.1 Industry Analysis Poultry industry in Indonesia is the most advanced in the livestock sector. It has one of the brightest growth prospects in Indonesia. 60% of production
November 24, Recent acquisitions by Astral Poly Technik Ltd.
 November 24, 2014 Recent acquisitions by Astral Poly Technik Ltd. Disclaimer The information in this presentation has been prepared for use in presentations by Astral Poly Technik Limited (the Company
FY16 AGM Rob Woolley, Chair Laura McBain, CEO 19 October 2016
 FY16 AGM Rob Woolley, Chair Laura McBain, CEO 19 October 2016 SHARE PRICE $ 18 16 14 12 10 8 6 4 2 0 05-Aug-14 30-Aug-14 30-Sep-14 31-Oct-14 30-Nov-14 31-Dec-14 31-Jan-15 28-Feb-15 31-Mar-15 30-Apr-15
ANALYST DAY November 30, 2016
 ANALYST DAY November 30, 2016 Run-down: - Smithfield North Plant tour - Innovation Center tour and product tasting - Supermarket tour - Presentation and Q&A Management: Ken Sullivan (CEO), GLENN Nunziata(CFO),
Dairy Day First NZ Capital Credit Suisse 6 April 2016
 Dairy Day 2016 First NZ Capital Credit Suisse 6 April 2016 Bellamy s is positioned for continued growth Demand has never been a constraint to Bellamy s growth Global infant formula market >US$50bn (2014)
2015 Annual Results. Innovation Integration Growth
 2015 Annual Results Innovation Integration Growth March 2016 Disclaimer This presentation and the accompanying slides (the Presentation ) have been prepared by WH Group Limited ("WH Group " or the "Company")
For personal use only
 23 November 2016 Dear Shareholders, Our Journey from Pastoral Company to a Luxury Brand Business You would notice a lot of change if you first invested in AACo 5 years ago. We are still the leading beef
Full year results Amsterdam, 5 February 2015
 Full year results 2014 Amsterdam, 5 February 2015 Disclaimer The information contained herein shall not constitute or form any part of any offer or invitation to subscribe for, underwrite or otherwise
Company Presentation 4Q and FY 2016 Results. 28 Feb 2017
 Company Presentation 4Q and FY 2016 Results 28 Feb 2017 Presentation Outline 1 Plantation Highlights 2 Financial Highlights 3 Strategies and Expansion 4 Appendix 2 Plantation Highlights 3 Planted Area
For personal use only
 BIGTINCAN HOLDINGS LIMITED FULL YEAR RESULTS PRESENTATION AUGUST 2018 1 2017 BIGTINCAN 2018 BIGTINCAN I SEPTEMBER 11, 2017 FY18 Financial Highlights ARR* $15.4m REVENUE $13.1m LOSS ($6.8m) 41% 42% 15%
Company Presentation 1Q 2015 Results. 30 April 2015
 Company Presentation 1Q 2015 Results 30 April 2015 Presentation Outline 1 Business Overview 2 Plantation Highlights 3 Financial Highlights 4 Strategies and Expansion 5 Appendix Integrated Agribusiness
1. Global and Asia Pacific Animal Feed Additives Market Introduction
 TABLE OF CONTENTS 1. Global and Asia Pacific Animal Feed Additives Market Introduction Asia-Pacific Animal Feed Additives Market 2. Distribution and Supply Chain of Feed Additives 3. Asia-Pacific Animal
RESULTS JANUARY JUNE 2008 ANALYST CONFERENCE CALL
 RESULTS JANUARY JUNE 2008 ANALYST CONFERENCE CALL 14 AUGUST 2008 Hamburger Hafen und Logistik AG DISCLAIMER The facts and information contained herein are as up to date as is reasonably possible and are
FIRST QUARTER RESULTS 2016 INVESTOR PRESENTATION
 FIRST QUARTER RESULTS 2016 INVESTOR PRESENTATION THREE MONTH RESULTS 21 APRIL 2016 Highlights and key figures Operating and financial review Outlook and priorities Appendix FIRST QUARTER RESULTS 21 APRIL
ASTARTA Results for the year 2015
 ASTARTA Results for the year 2015 March 2016 Disclaimer 2 This presentation is being provided to you solely for your information and may not be reproduced or further distributed to any other person or
Financial Results Meeting: FY Ended March 2018 (April 1, 2017 March 31, 2018)
") Financial Results Meeting: FY Ended March 2018 (April 1, 2017 March 31, 2018) May 14, 2018 Contents Summary of Business Results for FY Ended March 2018, and Forecast for FY Ending March 2019 02 Financial
Financial Results Meeting: FY Ended March 2018 (April 1, 2017 March 31, 2018) May 14, 2018 Contents Summary of Business Results for FY Ended March 2018, and Forecast for FY Ending March 2019 02 Financial
HAMBURGER HAFEN UND LOGISTIK AG COMPANY PRESENTATION
 HAMBURGER HAFEN UND LOGISTIK AG COMPANY PRESENTATION CHEUVREUX GERMAN CORPORATE CONFERENCE FRANKFURT, 20 JANUARY 2010 Hamburger Hafen und Logistik AG DISCLAIMER The facts and information contained herein
Recommended acquisition of The BSS Group plc. 5 July 2010
 Recommended acquisition of The BSS Group plc 5 July 2010 Important information This document is being made available only to persons who fall within the exemptions contained in Article 19 and Article 49
Migros Ticaret A.Ş. 1H 2018 Financial Results
 Migros Ticaret A.Ş. 1H 2018 Financial Results Disclaimer Statement Migros Ticaret A.Ş. (the Company ) has prepared this presentation for the sole purpose of providing information about its business, operations
FY18 RESULTS PRESENTATION
 FY18 RESULTS PRESENTATION DISCLAIMER This presentation has been prepared by rhipe Limited ACN 112 452 436 (RHP). Each Recipient of this presentation is deemed to have agreed to accept the qualifications,
Presentation for Deutsche Bank Swiss Equities Conference
 Zurich Airport, 19 th May 2010 Monika Ribar, CEO Presentation for Deutsche Bank Swiss Equities Conference 19 th May 2010 2 Panalpina at a glance Comprehensive global network Among top 5 globally in air
ASTARTA. Extending Value Chain and Increasing Diversification. Initiating Soybean Processing Project
 ASTARTA Extending Value Chain and Increasing Diversification Initiating Soybean Processing Project June 2012 Disclaimer This presentation is being provided to you solely for your information and may not
DOING BUSINESS IN CHINA 27 OCTOBER 2017
 DOING BUSINESS IN CHINA 27 OCTOBER 2017 DISCLAIMER - This presentation is intended to constitute a summary of certain information about Synlait Milk Limited (Synlait). It should be read in conjunction
Acquisition of Performance Fibers
 Acquisition of Performance Fibers 8 December 2014 Indorama Ventures has reached a definitive agreement to acquire one of the world s premier automotive fibers businesses, Performance Fibers Asia, including
STRATEGIC UPDATE 20 DECEMBER 2017
 STRATEGIC UPDATE 20 DECEMBER 2017 DISCLAIMER - This presentation is intended to constitute a summary of certain information about Synlait Milk Limited ( Synlait ). It should be read in conjunction with,
FY2015 Results Presentation CEO & Managing Director - Julian Ogrin CFO - Leanne Wolski
 FY2015 Results Presentation CEO & Managing Director - Julian Ogrin CFO - Leanne Wolski 21 August 2015 Important notice and disclaimer This presentation includes information about the activities of amaysim
4904 (TWSE) Q Investor Update. Disclaimer. Yvonne Li President
 Q Investor Update. Disclaimer. Yvonne Li President") 1 494 (TWSE) 214 1Q Investor Update Yvonne Li President 2 Disclaimer This presentation contains forward-looking statements. These forward-looking statements are subject to risks, uncertainties and assumptions,
1 494 (TWSE) 214 1Q Investor Update Yvonne Li President 2 Disclaimer This presentation contains forward-looking statements. These forward-looking statements are subject to risks, uncertainties and assumptions,
Financial Results Meeting: FY Ended March 2013
 Financial Results Meeting: FY Ended March 2013 (April 1, 2012 - March 31, 2013) May 10, 2013 Kintetsu World Express, Inc. 0 Contents Summary of Business Results for FY ended March 31, 2013, and Forecast
For personal use only MOBILE EMBRACE ASX: MBE. FY 2016 Results. Chris Thorpe, CEO REACH ENGAGE TRANSACT EMBRACE 1
 MOBILE EMBRACE ASX: MBE FY 2016 Results Chris Thorpe, CEO 1 TABLE OF CONTENTS 2016 FY RESULTS 1. PROVEN, PROFITABLE, GROWING: 2016 FY RESULTS 2. WHO WE ARE p 5-13 p 14-23 3. SET UP FOR SUCCESS p 24-28
SQS India BFSI Investors Presentation
 SQS the world s leading specialist in software quality SQS the world s leading specialist in software quality sqs.com Sqs-bfsi.com SQS India BFSI Investors Presentation Dr. Martin Müller Managing Director
Q Trading Update
 Q3 2017 Trading Update Agenda Financial Review Operational Support Strategy Regional Review Digital and Innovation Summary and Outlook Financial Review Q3 Trading Performance Year-on-Year Gross Profit
MMC Corporation Berhad
 MMC Corporation Berhad Financial Results Ended 31 December 2017 () February, 2018 RM million RM million KEY HIGHLIGHTS 4,627 10%YoY 4,160 FY16 FY17 Revenue 673 452 550 Pre-tax profit 33%YoY PATMI 59%YoY
ICL Strategy March 2018
 מטפחים את ההווה. מפתחים את העתיד. CULTIVATING THE PRESENT. DEVELOPING THE FUTURE. ICL Strategy March 2018 1 מטפחים את ההווה. מפתחים את העתיד. CULTIVATING THE PRESENT. DEVELOPING THE FUTURE. ICL Strategy
For personal use only
 Level 9, Marine Board Building 1 Franklin Wharf Hobart, Tasmania 7000 Attention: ASX Company Announcements Platform Lodgement of Market Briefing 20 August 2015 Tassal MD on FY15 results and evolution to
Scaling Our Automotive Vertical
 Completion of Performance Fibers Asia Acquisition Scaling Our Automotive Vertical April 2, 2015 Disclaimer This presentation and certain statements included herein contain forward-looking statements about
Navigating through an uncertain tariff landscape and building an end-to-end digital supply chain of the future
 Supply chain in 2019 and beyond: Navigating through an uncertain tariff landscape and building an end-to-end digital supply chain of the future Marc Compagnon, Group President, Li & Fung ICR Conference
Financial results Q1 FY2018/19. 3 August 2018
 Financial results Q1 FY2018/19 3 August 2018 Disclaimer The following presentation contains forward looking statements by the management of Singapore Post Limited ( SingPost ) relating to financial trends
Reorganisation & Revised Segmental Reporting. November 2016
 Reorganisation & Revised Segmental Reporting November 2016 Disclaimer This document has been prepared by the Company solely for purpose of communicating the change to the Company s Segmental Reporting
Announcement of Strategic Acquisitions. Bangkok Polyester & Cepsa Canada PTA
 Announcement of Strategic Acquisitions Bangkok Polyester & Cepsa Canada PTA March 23, 2015 Disclaimer This presentation and certain statements included herein contain forward-looking statements about the
HAMBURGER HAFEN UND LOGISTIK AG COMPANY PRESENTATION
 HAMBURGER HAFEN UND LOGISTIK AG COMPANY PRESENTATION UNICREDIT GERMAN INVESTMENT CONFERENCE MUNICH, SEPTEMBER 2010 Hamburger Hafen und Logistik AG DISCLAIMER The facts and information contained herein
RUSSIAN LIVESTOCK & POULTRY FARMING SECTOR
 RUSSIAN LIVESTOCK & POULTRY FARMING SECTOR 2013 2 TABLE OF CONTENTS SOME TERMS AND DEFINITIONS... 3 OVERVIEW OF RUSSIAN ANIMAL HUSBANDRY INDUSTRY... 4 LIVESTOCK AND POULTRY POPULATION... 5 TOTAL AND BY
China Mengniu Dairy Company Limited 2013 Annual Results. Stock Code: 2319 March 2014
 China Mengniu Dairy Company Limited 2013 Annual Results Stock Code: 2319 March 2014 Disclaimer The presentation is prepared by China Mengniu Dairy Company Limited (the Company ) and is solely for the purpose
XING AG. Dr. Stefan Gross-Selbeck (CEO) & Ingo Chu (CFO) Hamburg, May 12, 2010
 & Ingo Chu (CFO) Hamburg, May 12, 2010") Q1 Results Presentation XING AG Dr. Stefan Gross-Selbeck (CEO) & Ingo Chu (CFO) Hamburg, May 12, 2010 01 Starting Position Recap from FY 2009 results presentation... 2010: The year of profitable growth...
Q1 Results Presentation XING AG Dr. Stefan Gross-Selbeck (CEO) & Ingo Chu (CFO) Hamburg, May 12, 2010 01 Starting Position Recap from FY 2009 results presentation... 2010: The year of profitable growth...
Dreamscape Networks Limited (DN8)
") A record result across all key metrics Dreamscape Networks Limited (DN8) Dreamscape Networks Limited First half FY17 Results Presentation 23 February 2017 Our Vision Providing simple, innovative and affordable
A record result across all key metrics Dreamscape Networks Limited (DN8) Dreamscape Networks Limited First half FY17 Results Presentation 23 February 2017 Our Vision Providing simple, innovative and affordable
DELIVERING SUSTAINED AND PROFITABLE GROWTH. Karim Michel Sabbagh, President and CEO
 DELIVERING SUSTAINED AND PROFITABLE GROWTH Karim Michel Sabbagh, President and CEO World s Leading Satellite-enabled Solutions Provider Covering 99.99% of the globe and world s population Serving customers
INVESTOR PRESENTATION Keith Allaun Executive Chairman
 INVESTOR PRESENTATION Keith Allaun Executive Chairman P O W E R H O U S E E N E R G Y INTRODUCTION AIM listed PowerHouse Energy Group plc has fully commissioned its new G3-UHt Gasification System (G3 System)
6 MARCH 2017 BUSINESS UPDATE
 6 MARCH 2017 BUSINESS UPDATE 1 Today s presenters Peter Page Chief Executive Rutger Helbing Group Finance Director Michael Lauesgaard Group Business Development Director 2 Devro the outlook Global demand
Integrated Transparency, Ensuring Safety. DaChan Food Asia
 Integrated Transparency, Ensuring Safety DaChan Food Asia What do we sell? What is DFA? What do we sell? What is DFA? Index DFA Overview Opportunities and the Smile Curve Feed Segment Broiler (Raw Meat)
Business Results for the Third Quarter of FY2013/03
 Business Results for the Third Quarter of FY213/3 February 4, 213 (Mon.) Nippon Meat Packers, Inc. Contents Copyright (C) 213 Nippon Meat Packers, Inc. Contents I. Consolidated Business Results for FY213/3
Singamas Container Holdings Limited
 Singamas Container Holdings Limited (incorporated in HK with Limited Liability) Website: www.singamas.com Stock Code: 00716.hk 013 Interim Results Announcement 7 August 013 Disclaimer The information contained
Goldman Sachs Internet Conference Las Vegas, NV. May 21, 2008
 Goldman Sachs Internet Conference Las Vegas, NV May 21, 2008 Disclaimer These presentation materials have been prepared by Gmarket Inc. ( Gmarket or the Company ) and have not been independently verified.
H&M group capital markets day Stockholm 2018 H&M GROUP CAPITAL MARKETS DAY 2018
 H&M group capital markets day Stockholm 2018 Disclaimer THIS PRESENTATION IS NOT AN OFFER OR SOLICITATION OF AN OFFER TO BUY OR SELL SECURITIES. IT IS SOLELY FOR USE AT A CAPITAL MARKETS EVENT AND IS PROVIDED
For personal use only. AGM PRESENTATION November 2018
 AGM PRESENTATION November 2018 Investment Focus Eve s vision is to be a vertically integrated Health, Food and Wellness Investment company. Investing and owning early growth phase companies with the aim
2018 Interim Results Corporate Presentation
 2018 Interim Results Corporate Presentation 31 August 2018 Disclaimer This presentation and the accompanying slides (the Presentation ) which have been prepared by Best Pacific International Holdings Limited
I N T E R I M R E S U LT S. Stock code: 636
 2 0 1 5 I N T E R I M R E S U LT S Stock code: 636 Disclaimer This presentation was prepared by Kerry Logistics Network Limited (the Company ) for reference and general information purposes only. This
Piper Jaffray Clean Technology & Renewables Conference. Samuel Yang, Chief Executive Officer
 Piper Jaffray Clean Technology & Renewables Conference Samuel Yang, Chief Executive Officer February 20, 2008 Disclaimer This presentation does not constitute an offer to sell or issue or the solicitation
PETRONAS Group Financial Results Announcement
 EMBARGO The information contained herein may only be released after 5.30pm on 27 February 2015 PETRONAS Group Financial Results Announcement and Year End FY 2015 PETROLIAM NASIONAL BERHAD (PETRONAS) All
DSN Group 9-Month 2016 Results Update
 DSN Group 9-Month 2016 Results Update DSN Group is a growing, and green, producer of palm oil and wood products sold into global markets. Our plantation operations are among the most productive in the
Presentation Team. Mr. Shi Hongliu Founder, Chairman & Executive Director. Mr. Zhao Yan Executive Director
 Disclaimer This document has been prepared by Hosa International Limited (the Company or Hosa ) and comprises the written materials for a presentation concerning, among other matters, the Company s background
UG HEALTHCARE CORPORATION LIMITED
 (Incorporated in Singapore on 21 August 2014) (Company Registration Number: 201424579Z) NEWS RELEASE FOR IMMEDIATE RELEASE UG HEALTHCARE CORPORATION LIMITED LAUNCHES INITIAL PUBLIC OFFERING Beneficiary
PT Semen Indonesia (Persero) Tbk. And the Prospect of Indonesia Cement Industry
 Tbk. And the Prospect of Indonesia Cement Industry") PT Semen Indonesia (Persero) Tbk. And the Prospect of Indonesia Cement Industry Cement Companies in Indonesia Domestic Capacity 2017 Total 107.4 Mio Ton 2017 SMGR market share 2017 was 40.8% despite of
PT Semen Indonesia (Persero) Tbk. And the Prospect of Indonesia Cement Industry Cement Companies in Indonesia Domestic Capacity 2017 Total 107.4 Mio Ton 2017 SMGR market share 2017 was 40.8% despite of
Corporate Update. April 2018
 Corporate Update April 2018 Disclaimer This presentation has been prepared by Quess Corp Limited ( Company") solely for information purposes without any regard to any specific objectives, financial situations
18,000+ ACTIVE USERS. AGM PRESENTATION November 2017 $600M+ TRANSACTION VALUE
 18,000+ ACTIVE USERS AGM PRESENTATION November 2017 $600M+ TRANSACTION VALUE A Leading Payment Solutions & Technology Partner In Asia-Pacific SOUTH EAST ASIA 2 Our Markets $120B Singapore retail & online
For personal use only 18,000+ ACTIVE USERS $600M+ TRANSACTION VALUE. AGM PRESENTATION November 2017
 18,000+ ACTIVE USERS AGM PRESENTATION November 2017 $600M+ TRANSACTION VALUE A Leading Payment Solutions & Technology Partner In Asia-Pacific SOUTH EAST ASIA 2 Our Markets $120B Singapore retail & online
FY17 MPM Company Highlights and Financial Results. (Ticker: MPMX) April 2018
 April 2018") FY17 MPM Company Highlights and Financial Results (Ticker: MPMX) April 2018 WE ARE SMART MOBILITY OUR VISION To positively impact lives through smart mobility and social integration. OUR MISSION To create
FY17 MPM Company Highlights and Financial Results (Ticker: MPMX) April 2018 WE ARE SMART MOBILITY OUR VISION To positively impact lives through smart mobility and social integration. OUR MISSION To create
DEZ 2016 LEADING CLOUD TRANSFORMATION PARTNER
 DEZ 2016 LEADING CLOUD TRANSFORMATION PARTNER FORWARD LOOKING STATEMENTS & DISCLAIMER This presentation contains forward-looking statements that are subject to risks, uncertainties and assumptions. The
FY16 FULL YEAR FINANCIAL RESULTS
 FY16 FULL YEAR FINANCIAL RESULTS 30 AUGUST 2016 INVESTOR PRESENTATION Ryan d Almeida (CEO) Phil Wiltshire (CFO) FY16 Financial Highlights 1. 2. 3. 4. 5. 6. 7. IPO Prospectus forecasts for pro forma revenue,
Company Presentation 2Q and 1H 2013 Results 14 Aug Company Presentation 4Q and FY 2012 Results. 27 Feb 2013
 Company Presentation 2Q and 1H 2013 Results 14 Aug 2013 Company Presentation 4Q and FY 2012 Results 27 Feb 2013 Presentation Outline 1 Plantation Highlights 2 Financial Highlights Click to edit Master
Sunrise Communications Group AG. Olaf Swantee
 Sunrise Communications Group AG Olaf Swantee Agenda 1 First impressions 2 Q2 16 Summary 4 Conclusion 5 Q&A 2 Strong 1 st impressions - solid base to build on for the future Innovative products via diversified
For personal use only
 A G E N D A / O V E R V I E W CONTENTS SLIDE GROUP PERFORMANCE SUMMARY 3 LINDSAY SOLUTION 4 TRANSPORT INDUSTRY OUTLOOK 6 LINDSAY TRANSPORT HIGHLIGHTS 7 LINDSAY FRESH LOGISTICS 10 RURAL OUTLOOK 12 RURAL
COLGATE PALMOLIVE INDIA LTD.
 COLGATE PALMOLIVE INDIA LTD. Disclaimer This Presentation and its related publication, release, webcast or communication (together the Presentation ) is for general information purposes only. This Presentation
Opera Software: Third quarter 2012
 Opera Software: Third quarter 2012 3Q 2012 Financial highlights Financial metric 3Q12 (MUSD) 3Q11 (MUSD) Revenue Total revenue 56.4 40.1 Profitability Adj. EBITDA*/** 17.0 13.6 EBIT** 13.7 11.0 Revenue
DCH Acquires Li & Fung s Asia Distribution Business
 DCH Acquires Li & Fung s Asia Distribution Business May 3, 2016 1 Table of Contents PAGE 1. Transaction Overview 4 2. Transaction Rationale 9 3. DCH Post Transaction 16 2 Disclaimer Certain statements
Indium facility at the Auby smelter
 Indium facility at the Auby smelter 20 September 2012 Xavier Constant Technology Manager, Auby smelter Important Notice This presentation has been prepared by the management of Nyrstar NV (the "Company").
Kencana Agri Limited. 1Q 2011 Performance Review
 Kencana Agri Limited 1Q 2011 Performance Review 1 Disclaimer This document has not been independently verified and has been prepared for informational purposes only. No representation or warranty express
HIKMA PHARMACEUTICALS PLC. Merrill Lynch Middle East & North Africa (MENA) Conference 13 December r 2005
 Conference 13 December r 2005") HIKMA PHARMACEUTICALS PLC Merrill Lynch Middle East & North Africa (MENA) Conference 13 December r 2005 Important notice This document and its contents are confidential and may not be redistributed or
HIKMA PHARMACEUTICALS PLC Merrill Lynch Middle East & North Africa (MENA) Conference 13 December r 2005 Important notice This document and its contents are confidential and may not be redistributed or
For personal use only. Chair s Address Professor Andrew Vizard Chairman 24 November 2016
 Chair s Address Professor Andrew Vizard Chairman 24 November 2016 Disclaimer DISCLAIMER The information presented to you by Apiam Animal Health Limited ACN 604 961 024 (Company) in this presentation and
Abcam Plc. JP Morgan Healthcare Conference January 2017
 Abcam Plc JP Morgan Healthcare Conference January 2017 2 Disclaimer Important information The information provided in this presentation is for the sole use of those attending the presentation; it shall
Aegis Logistics Limited
 Aegis Logistics Limited Result Presentation Q2 FY16 1 Safe Harbour This presentation and the accompanying slides (the Presentation ), which have been prepared by Aegis Logistics Limited (the Company ),
SEA Venture Discovering the opportunity in a fragmented 1
 SEA Venture Discovering the opportunity in a fragmented market @jungleventures 1 Jungle Ventures Who We Are Singapore-based venture firm investing in consumer internet category leaders in Southeast Asia
Capital Markets Day 2013 Contract Logistics. Detlef Trefzger Chief Executive Officer, Kuehne + Nagel International AG September 18, 2013
 Capital Markets Day 2013 Contract Logistics Detlef Trefzger Chief Executive Officer, Kuehne + Nagel International AG September 18, 2013 Stagnating Revenue and Margins Over the Last Years 5000 4500 4000
Inghams Group Limited
 Inghams Group Limited 1H FY2017 Results Presentation 15 FEBRUARY 2017 Important notice and disclaimer Disclaimer The material in this presentation is general background information about the activities
Financial Summary. Profit attributable to equity holders of the Company % Net profit margin 7.5% 1.3% -6.1%
 2 Disclaimer This document is prepared by Yashili International Holdings Ltd (the Company ) for corporate communications and general reference only. The document does not constitute an offer to sell or
SK Networks H
 SK Networks 2017. 1H 01 Disclaimers This material has been produced by SK Networks Co., Ltd. solely for information purposes. The information contained in this document has not been independently verified.
Macquarie Securities Conference Australia
 Macquarie Securities Conference Australia Greg Hunt Managing director and chief executive officer Wednesday, 3 May 2017 Disclaimer General This presentation has been prepared by Nufarm Limited. The information
Indorama Ventures Augments its Core PET Business
 Indorama Ventures Augments its Core PET Business Acquisition of New State-Of-The-Art PET Resin Plant in January 8, 2015 Disclaimer This presentation and certain statements included herein contain forward-looking
Future Matters US Disclosure
 Disclaimer This presentation has been prepared by Samsung Electronics Co., Ltd. (the "Company"). It does not purport to contain all the information that a prospective investor may require in connection
Software AG announces offer for IDS Scheer
 Software AG announces offer for IDS Scheer Analyst Presentation Karl-Heinz Streibich, CEO Arnd Zinnhardt, CFO July 14, 2009 Forward Looking Statement The information contained in this presentation has