Are Indian Farms Too Small? Mechanization, Agency Costs, and Farm Efficiency. Andrew D. Foster Brown University. Mark R. Rosenzweig Yale University
|
|
|
- Jocelyn Ryan
- 6 years ago
- Views:
Transcription
1 Are Indan Farms Too Small? Mechanzaton, Agency Costs, and Farm Effcency Andrew D. Foster Brown Unversty Mark R. Rosenzweg Yale Unversty June 2011 Abstract New panel data from Inda are used to examne the relatonshp between farm sze and productvty based on a model ncorporatng agency costs favorng famly workers, scaledependent returns to mechanzaton arsng from the fact that a larger contguous land area s better-suted for hgh-capacty machnery, and fallng credt costs wth owned land. The model provdes gudance for mputng the shadow prce of labor n the presence of agency costs. Estmates based on approprately-computed labor shadow prces ndcate that whle small farms have lower unt labor costs, large farms use substantally less labor per acre, are more mechanzed and more effcent.
2 1. Introducton Although the generalzaton has many mportant caveats, across the world the most effcent and productve agrculture s stuated n countres n whch farms are famly-owned, large-scale and mechanzed. However, comparsons of farmng productvty across countres cannot easly dentfy the essental barrers to augmentng farmng productvty, as countres dffer n ther property rghts regmes, fnancal systems, labor markets, agroclmatc condtons and other nsttutonal and envronmental features. A vast lterature has hghlghted, usually one at a tme, varous market mperfectons as constranng agrcultural productvty n poor countres. These nclude, for example, credt market barrers, lack of nsurance, problems of worker effort, and labor market transacton costs. However, many of these market problems are not confned to poor countres. Moral hazard and adverse selecton afflct credt markets n all settngs, and farmers do not have unlmted access to captal anywhere n the world. Nor do famly farms n many developed countres use employment schemes that dffer mportantly from those used n those low -ncome settngs where famly farms also domnate. And most farmers n hgh-ncome countres do not partcpate n formal crop, ncome or weather nsurance markets. It s thus unlkely that labor market problems or lack of nsurance or even credt constrants, can alone account for the large dfferences n the productvty of farms across many developed and developng countres. In contrast to agrculture n most hgh and some mddle-ncome countres, farmng n Inda, whle famly-run, s nether large-scale nor, untl relatvely recently, mechanzed. The 2001 Census of Inda ndcates that farmng n Inda s very small scale - 68% of farms are less than two acres n sze and 95% are less than fve acres n terms of owned holdngs. Mechanzaton can be examned usng data from a new panel survey of almost 5,000 cropproducng farmers n 17 of the major states of Inda coverng the perod through n , whch we descrbe and employ extensvely below. Fgure 1, whch portrays the fracton of farms wth a tractor, a mechanzed plow or a thresher by farm sze over the full span of the panel data, shows that mechanzaton s a relatvely recent development n Inda and now closely related to farm scale. Through the late 1990's less than 10 percent of farms of any sze had mechanzed equpment and there was very lttle dfference n mechanzaton rates between small 1
3 and large farms. 1 In the latest round, however, almost 25% of 20-acre farms are mechanzed, compared wth 10-11% of farms below 10 acres. Are small Indan farms effcent? There s a large pror emprcal lterature usng Indan data from the 1970's and 1980's, when mechanzaton was vrtually absent, that has found both more ntensve use of labor on smaller farms and a negatve relatonshp between output per acre and cultvated area. Ths measure of productvty gnores all nput costs. When pad out costs are accounted for and profts are calculated valung famly labor at prevalng wage rates, however, small Indan farms are found to be less proftable than larger farms (Carter, 1984; Lamb, 2003). It s not clear that ether approach to measurng effcency s correct. Gven that agrcultural labor markets n rural Inda are actve t s not reasonable to assume that the opportunty cost of famly labor s zero. However, f the opportunty cost of famly labor s truly the market wage, t s unclear why the labor-land rato on small farms s so much hgher than on large farms. One hypothess for why small farms are more labor-ntensve and more effcent s based on agency costs, the need for greater supervson of hred workers compared wth famly workers, as formalzed n, for example, Feder (1985) and Eswaran and Kotwal (1986). However, wthout drect measures of the magntude of these costs, almost any allocaton of labor to land as well as any dfferences n use of other nputs such as machnes can be justfed as effcent. A further dffculty wth the emprcal lterature on the relatonshp between scale and farm productvty s that t gves nsuffcent attenton to the endogenety of farm scale and nput use. It s possble that wthn Inda smaller farms are located where land s hgher qualty (Bhalla and Roy, 1988; Benjamn, 1995), where credt markets operate more effectvely, or where agrcultural condtons generally are more favorable to agrculture. Measurement error n farm or plot sze also can bas estmates of per-area effcency and scale (Barrett et al., 2010; Lamb, 2003). Moreover, land holdngs may reflect dfferences n the capablty of farmers. In the absence of a feasble way of expermentally varyng ownershp holdngs or farm scale, emprcal dentfcaton of scale and credt market effects on proftablty and mechanzaton depends upon the ablty to control for multple sources of unobserved farmer-specfc heterogenety. 1 These trends are consstent wth data compled from Indan natonal agrcultural statstcs on the share of power contrbuted by dfferent sources n agrcultural producton by Sngh (2006). He documents that the share of total farm power suppled by tractors ncreased from 7.8% n to 42.5% n
4 In ths paper we address these lmtatons usng new panel data from Inda at the farm and plot level and a theoretcal framework that provdes gudance for an emprcal assessment of the relatonshp between farm sze and productvty wth multple sources of scale economes. In partcular, our model ncorporates three factors that can be responsble for a relatonshp between farm proftablty and farm sze: () the presence of a wedge between the cost of famly and hred labor arsng from dfferences n supervsory costs, whch advantages small-scale producton, () fallng credt costs wth owned land, and () scale-dependent returns to mechanzaton arsng from the fact that a larger contguous land area s better suted to the use of labor-savng hghcapacty machnery. The latter reflects publshed specfcatons of agrcultural machnery ndcatng a substantal postve relatonshp between the sze of machnes and ther ablty to carry out tasks (capacty) and thus save on labor tme. 2 Because large machnes cannot be effcently operated on small plots, mechanzaton creates the potental for postve scale economes, as depcted n Fgure A2, whch provdes photographs of four alternatve harvestng technologes for rce. A key feature of the model s that t provdes an exact formulaton for mputng the shadow prce of labor n the presence of dfferental agency costs for famly and hred labor and thus for estmatng farm profts. We show that the relevant opportunty costs of labor vares accordng to the poston of the farm wth respect to the labor market (whether hrng-n, workng off farm, or nether). Because ths poston vares by stage of producton for a gven farm (a household may, for example, hre n labor at harvest tme, but exclusvely employ famly labor for plowng), the constructon of an approprate measure of profts requres not only nformaton on supervson tme but also data on nput use by agrcultural operaton and on the partcpaton of famly members n the wage labor market. Comprehensve data on nputs by season, typcal of many surveys, s not suffcent to cost out labor approprately. We dentfy the effects of changng farm sze on proftablty and nput use by makng use of the fact that over the nne-year perod between survey rounds almost 20% of households dvded and/or receved nherted land because a parent ded, thus changng ownershp and scale 2 For example, Fgure A1 n the Appendx based on nformaton on harvestng combnes manufactured and used n Inda, from Sngh (2006), shows a strong postve relatonshp between the amount harvested per tme unt and machne weght for both rce and wheat. Part of the ncrease n effcency comes about because the larger harvester covers more rows per unt of tme and thus can only be used on larger areas. 3
5 for farmers wthn the same famly. We explot ths dvson to frst estmate how supervsory costs vary by famly and hred labor. Supervsory cost dfferentals turn out to be large, leadng to almost a doublng n the shadow prce of labor when a household hres workers relatve to when t employs famly workers exclusvely and works off farm. Despte ths large cost dfferental and the fact that large farms are more lkely to be n the hgh-cost employment regme, we fnd that estmated profts per acre, computed based on the theoretcally consstent shadow prces of labor, ncrease when owned land sze ncreases. Profts are also hgher on larger plots wthn the same farm, ndcatng pure scale effects. Mechanzaton s responsble for part of ths advantage. We also fnd that a farmer s sgnfcantly more lkely to use a tractor on hs larger plots and that farmers wth greater owned landholdngs nvest sgnfcantly more resources n mechanzed mplements and employ less labor per acre. Large landowners also appear to have a credt advantage, as ther effcency, unlke for small farmers, s unaffected by pror proft shocks. Fnally, our analyss provdes estmates of land sze effects on per-acre profts across dfferent ponts n the ownershp dstrbuton of land. These estmates enable the computaton of farmers reservaton rental prce: the rental prce per acre of land at whch, on average, farmers wth a gven level of land ownershp would be ndfferent to a margnal expanson of operatonal holdngs. These estmates, whch are n accord wth drect nformaton on rental prces and estmated land values, ndcate that the mplct demand for rentng n land rses sharply wth acreage up untl about 10 acres, after whch t falls. Consstent wth these estmates, we show that farmers wth small landholdngs n Inda do ndeed lease out to farmers wth larger landholdngs. However, the neffcent dstrbuton of land s not overcome by reverse tenancy as only nne percent of farmers lease land. 2. Model A. Labor costs and cultvated area wth multstage producton To emphasze the roles of scale economes arsng from agency costs and the technology of mechanzaton we assume that agrcultural producton s descrbed by a constant returns to scale producton functon g. To smplfy the model wthout loss of generalzablty we assume that producton takes place n two stages. Agrcultural goods are produced usng land, a, an agrcultural nput f, and work e, carred out by labor and/or machnery, appled n each of the two 4
6 stages. Thus total output s (1) ag( f *, e *, e *), 1 2 where the superscrpt * denotes a per-acre quantty. The agrcultural nput and work by stage are assumed to be complementary n (1). 3 Per-acre work n stage s produced usng per-acre machnery, k *, and per-acre manual labor, l *, wth the productvty of these factors dependng on the plot scale a and machne capacty q (2) e* e( aqk,, *, l*). We assume that there s a perfect rental market for machnes 4 and that the cost of a gven machne s ncreasng n ts capacty accordng to c k q ν, where ν <1. 5 Thus, hgher-capacty machnes are more costly but machnery cost does not rse as fast as capacty ncreases. Ths s one source of scale economes. For the moment we take capacty as gven, but optmal capacty choce wll play a key role n the analyss below. Per-acre manual labor s provded by both famly l f * and hred labor l h * and both type of labor must be supervsed to be effectve so that (3) l* mn( l */ s, l *) mn( l */ s, l *), sh h h sf f f where s h and s f denote the amount of supervsory tme needed per unt of manual labor of the respectve type. Thus, for example, l sh *, denotes per-acre supervsory tme for hred workers at stage. Consstent wth the data, as dscussed below, we assume that more supervson s needed for hred than famly workers (s f < s h ) and that supervsory tme can only be provded by famly members. Total household labor l at each stage s dvded between on-farm producton, supervson, the producton of a stage-specfc non-durable household good (e.g., lesure) that s measured n terms of unts of labor l z, and off-farm work l o. Note that nether of these latter labor quanttes are n per-acre terms. Thus the tme-budget constrant s (4) l al * l al * al * l z f o sh sf We assume that there s a market for hred labor and the wage pad per unt of manual labor s w. Labor can be hred out or n by the famly at wage rate w. We now show that w s not the shadow prce of labor for any household, gven agency costs, and that the true shadow prce of 3 For example, an ncrease n fertlzer requres more work n terms of the applcaton of fertlzer and results n greater output per acre and thus more harvest labor per acre. 4 We consder the own-versus buy decson once we ntroduce a credt market below. 5 Gven further structure that s mposed below we requre and
7 labor can dffer for the same household across producton stages accordng to whether the household s buyng or sellng labor n the market. Household utlty s defned over consumpton x and the non-durable household good by stage (5) uxl (,, l ). z1 z2 Consumpton s fnanced from agrcultural producton net of labor, nput and machnery rental costs and from the earnngs from off-farm work wl o n each stage (6) x ag( e*, e *) ap f * ( w( al * l ) ap q k*). 1 2 f h o k Households are assumed to maxmze (5) subject to (1)-(4) and (6) and the addtonal condtons that off-farm labor and hred labor must be non-negatve. Because the dfference n supervsory costs between famly and non-famly members creates a beneft to on-farm employment of famly workers, the non-negatvty constrants may bnd. In partcular, n any stage there are three possble regmes dependng on whether the household s hrng n labor, hrng out t s own labor or nether (autarchc). 6 We show n Appendx A that the utltymaxmzng margnal return to (cost of) labor tme n any stage of producton g e e l s gven by 1 s f (7) geel w, 1 h*( sh sf ) where ulz u( x, lz1, lz2)/ z, ux u( x, lz1, lz2)/ u( x), ge ge ( 1, e2)/ e, el e( a, k*, l*) / l * and * ( ux / ulz) w 1 (8) h. sh sf R Let denote the shadow prce of labor n stage, whch s gven by the rght-hand sde of (7). w Equatons (7) and (8) mply that the shadow prce of labor dffers dependng on whch regme the household s n any stage. In partcular: Regme 1: Off-farm work by famly members. When famly members work off the farm one unt of tme can be transformed nto w unts of consumpton by workng an addtonal day, and thus * u / u 1/ w h 0 and x lz (9) g e (1 s ) w. e l f The shadow prce of (famly) labor when famly members work off the farm s thus (1 + s f )w. 6 The case of smultaneously sellng famly labor off-farm and hrng labor n the same stage s precluded by the condton s f < s h. In that case t would be more proftable to shft famly labor tme from off-farm to on-farm work thereby releasng the hred workers, who requre more supervson and thus are more costly. 6
8 Regme 2: Hred workers are employed on-farm. When hred workers are employed 1 - s h + s f unts of tme can be transformed nto w unts of consumpton by replacng one unt of hred work by one unt of famly work, accountng for dfferences n supervson costs. Thus, u x /u lz = (1 - s h + s f )/w, h * = 1, and 1 s f (10) geel w. 1 s s h f The shadow prce of labor s thus (1 + s f ) w /(1 - s h + s f ) when workers are hred n, whch exceeds the labor shadow prce when only famly labor s used on-farm and famly members are workng off-farm. Regme 3 (autarchy): There s nether off-farm work nor hred workers, h * 0 [0, 1]. Ths regme exsts because of the cost wedge between famly and hred labor. In ths case, the shadow prce of labor les between (1 + s f )w and (1 + s f )w /(1 - s h + s f ), that s, between the shadow prces of the frst two regmes. It s mportant to note that the three labor-cost regmes pertan to a stage of producton. Nothng n the model prevents households from workng off-farm n some stages and hrng-n labor durng other stages, due to varatons n operaton-specfc on-farm labor demand, and ths pattern s ndeed what we see n the data. An mplcaton of ths varaton s that the costs of labor nputs must be evaluated at the level of the stage (operaton). When stages are aggregated at the season or even annual level, as n most data sets, many farms may be observed to be hrng n and hrng out labor. In such cases t s not possble to correctly evaluate labor costs and thus farm profts. 7 Accordngly, we defne profts as revenues mnus the cost of nputs evaluated at the approprate regme- and stage-specfc shadow prces. Profts per acre summed over all stages of producton are then 1 s * * * * * f * * (11) ( a) g( e1, e2 ) pf f ( cq k w ( l )). * f lh 1 h ( s s ) h f In Appendx B we show that the land rental reservaton prce for a household s 7 For example, f two farmers wth the same sze farm both, say, work off-farm n stage 1 and hre labor n stage 2, the farmer wth the more unform labor use (nclusve of both famly and hred work) across stages wll have lower labor costs than the one who uses more labor n stage 2, even f total labor usage for the two farmers s the same and wages do not vary by stage. 7
9 * v ( a) a d *( a) (12), da h * where d *( a) (13) geea. da h* Expressons (12) and (13) ndcate that the value to the farmer of rentng n an addtonal unt of land s the profts on that margnal unt plus a term reflectng the ncrease or decrease n proftablty of the farmer s total landholdngs arsng from how the expanson n acreage affects work per acre. Thus whether there are local ncreasng or decreasng returns to scale depends solely on the sgn of the e a, that s on whether optmal work per acre ncreases or decreases wth acreage n the dfferent stages. We now consder the source of these scale economes. B. Techncal scale economes, cultvated land and mechanzaton Thus far we have specfed work as an arbtrary functon of land, labor and capacty. We now focus on the role of mechanzaton as a source of scale economes. In partcular, we assume that manual labor and machnery servces are mperfect substtutes n producng work and that machnery vares by capacty. These assumptons are emboded n the followng functon: e a q k l l a q qk * * * * (,,, ) ( ( ) (( ( ) ) ) ) 1/ m k (14), where q denotes the capacty of each machne, and k denotes the number of machnes. The advantage of large farms wth respect to hgher-capacty equpment, stemmng from the postve relatonshp between capacty and the physcal sze of farm machnery, s emboded n the expresson φ (a) - q, wth φ a > 0. In determnng how scale affects proftablty and to hghlght the partcular role that landsze plays n ths structure t s helpful to consder frst the stage-specfc cost functon c ( e, a) mn p k q w l * * R * k (15) subject to (14). Solvng (15) frst n terms of q yelds an expresson for optmal machne capacty 1 (16) q ( a). 2 Expresson (16) ndcates that optmal capacty n a gven stage s determned only by area and the elastcty of the prce schedule and, n partcular, s not senstve to the requred total work n that stage. Larger operatons wll use hgher-capacty equpment as long as φ a > 0, but an 8
10 ncrease n the elastcty of the machnery prce wth respect to capacty, say due to techncal change, lowers machnery capacty partcularly for large farmers. 8 The frst-order condtons to the cost mnmzaton problem mply that the rato of supervsory to manual labor s constant gven prces and technologes and that the rato of machnery to labor servces s constant gven area, prces, and technologes. Because of ths proportonalty, we can dstngush between how scale affects the demand for nputs condtonal on the amount of work and on how scale affects total nput demand by ncreasng work. In Appendx C we prove the followng: A. At the margn, profts per acre and non-labor nputs per acre unambguously ncrease wth area for households that hre n or partcpate n the labor market n every stage of producton (employment regmes 1 and 2) because the cost of work per unt area falls and the shadow wage s constant. For households n the autarchc employment regme, per-acre profts and area may rse or fall dependng on how fast the shadow prce of labor rses wth land area. B. Larger operatons may be more proftable or less proftable than smaller operatons on a per-acre bass. Ths s because the scale economes assocated wth mechanzaton, whch reduce labor use, may be offset by the fact that large farms are more lkely to use hred labor than small farms and per-unt labor costs are hgher n the labor-hrng regme than n the hrng out regme that s typcal of small farmers. C. The number of machnes k per unt area wll be ncreasng n area, for δ suffcently close to 1. Ths s because () there wll be an overall expanson of work, () per-unt labor costs may rse () k s ncreasng n total work. D. Whether total expendtures on machnery wll rse for δ < 1 as land sze ncreases depends on whether the prcng of machnery s suffcently elastc to capacty (the magntude of ν). Regardless of whether the number of machnes used per unt area ncreases or decreases, whether a farmer uses a machne of a gven capacty 8 Note that substtutng back nto the (14) yelds a work producton functon that s analogous to the CES producton functon wth the excepton that the share parameter 2 k( 1 ( a) ) 1 (1, where, depends on area. 2 9
11 or greater s rsng n area. E. Larger farms wll use less labor per unt area f larger farms use hred labor n more stages of producton (hgher labor costs) than do small farms and f the demand for work s prce nelastc and/or labor and machnes are suffcently good substtutes n every stage or producton. C. Scale effects, land ownershp and credt market mperfectons In the precedng analyss a was any contguous plot of land used for an agrcultural operaton. We have thus gnored the dstnctons between the ownershp or rental of land, as well as of equpment, and we have also assumed that over the agrcultural cycle farmers can freely borrow aganst harvest revenues at a zero rate of nterest. We now allow for the possblty of credt constrants. In dong so, we assume that farmers own ther plots of land and also own captal equpment. We frst take ownershp of both assets as gven, and then endogenze the ownershp of equpment. To ncorporate captal market consderatons we assume that farmers borrow b* per acre to fnance agrcultural nputs and repay ths debt wth nterest durng the harvest perod. We assume that the nterest rate r on ths debt s dependent on the amount borrowed per acre as well as on total owned land area, wth farmers who own a small amount of land a obtanng workng captal at a hgher nterest rate than larger farmers. Formally, the peracre amount that must be repad n the harvest perod s gven by (17) ( ab, *) (1 rab (, *)) b*, where the nterest rate r s ncreasng n b* and decreasng n owned land. The decrease n nterest rates wth land ownershp mght reflect the use of collateral, a requrement of most bank loans n rural Inda (Munsh and Rosenzweg, 2009). In ths extended model, ownershp of both land and machnery matters. By assumpton owned landholdngs reduce the cost of captal. But, whle we retan the assumpton that there s a perfect rental market for machnery, ownershp (versus rental) of captal assets such as machnery also nfluences producton decsons through ts effect on the amount of debt that must be ncurred to fnance nputs. In short, f one owns a productve asset one does not have to fnance the relevant rental cost. 9 Or equvalently one can rent the machne to 9 In prncple, a smlar argument may be made for famly labor. A farmer wth less area for a gven famly labor may have lower need to fnance hred labor nputs gven area and thus borrow less and face a lower nterest cost per unt area. The lmtaton of ths argument s that famly labor and dependents of those famly workers must be fed throughout the agrcultural 10
12 other farmers and then use the cash to fnance other nputs. Thus lettng o* denote the rental value of owned assets (18) b* c( a) e* p f * o*. f The farmer s maxmzaton problem wth credt market mperfectons, restrctng attenton for smplcty to a sngle stage, can thus be restated as (19) *( a) max g( e*, f*) ( a, b*) (1 r0 ) o* where r 0 s the rate of return on savngs and s assumed to be less than r(a,b*) for all postve levels of borrowng. Proft maxmzaton then mples that d * (20) a bc'( a) e*, da dr where b b * 1 r ( a, b *) 1and c'( a) s the change n total cultvaton costs, b* db* condtonal on work. The latter declned wth area n the absence of credt market constrants wthn employment regmes of constant labor costs, as shown n Appendx D. The exstence of credt market mperfectons, as modeled here, makes more postve the gradent of per-acre profts wth respect to owned area relatve to cultvated area, for gven (or zero) credt costs. Ths s for two reasons. Frst, there s a negatve effect of owned area on nterest rates gven nput use per acre, ρ a < 0. Second, any savngs n cost per unt of work assocated wth scale lower the amount borrowed, thus further lowerng nterest costs and rasng proftablty. In addton to affectng the nput choces of farmers, the presence of credt market mperfectons creates another emprcal problem n measurng true proftablty because of the dffculty of accountng for dfferences n nterest rates and thus the true dscounted costs of nputs across households n nformal credt market settngs. In Appendx D we consder the emprcal queston of whether t s possble to nfer correctly the role of credt market constrants n the relatonshp between owned landholdngs and (true) per-acre proftablty when borrowng costs are gnored n computng farm profts. We thus consder the comparatve statcs assocated wth estmated profts, whch exclude nterest costs. Estmated profts s the most common measure of profts, and the one we use n the emprcal work due to the dffculty of obtanng relable and consstent measures of nterest costs. We show that estmated profts and true profts have a cycle, whch reduces the lqudty benefts of havng a large famly labor per unt of area farmed. 11
13 steeper gradent wth respect to scale f there are credt market mperfectons A drect test of credt market constrants can be obtaned by examnng the returns to owned captal assets usng true or estmated profts. The margnal return to captal n terms of true profts s gven by d * dr( a, b*) (21) b (1 r0) r( a, b*) r0 b* 0, do* db* whle the margnal return to estmated profts s (22) d ˆ * * * ( b 1)( ca ( ) de p df f ). do* do* do* The observed margnal returns to captal assets n the presence of credt constrants evdently dffer dependng on how profts are computed. However, t s easly establshed that when r(a, b*) = r 0, that s when borrowng costs are ndependent of land ownershp and equal to the returns on savngs, the margnal return to captal assets s zero for ether measure of profts. Ths s because varaton n owned machnery at the margn has no effects on the use of producton nputs. Therefore, the fndng that there s a non-zero return, n terms of estmated profts, to owned captal assets would reject the hypothess of perfect captal markets. The fndng, moreover, that the return to captal falls wth owned land sze would provde supportve evdence for the assumpton that credt costs declne wth owned land. Thus far we have taken the amount of owned captal assets as gven. In practce, farmers both own and rent machnery, and the model ncorporatng credt constrants can explan varaton n equpment ownershp even n the presence of a perfect rental market. By the assumpton of an effectve rental market all farmers face the same equpment rental prce. But due to credt market mperfectons farmer wth dfferent landholdngs face dfferent borrowng costs. Gven that the rental-equvalent prce of ownng machnery for one agrcultural season depends on one s own cost of borrowng, ndvduals wth relatvely low borrowng cost wll be more lkely to own machnery and those wth hgher borrowng cost wll rent t. Ths argument suggests that f, as s assumed n (17), fnancal ntermedares lower the cost of borrowng for larger versus smaller landowners, then gven an actve rental market, larger farmers wll be more lkely than small farmers to purchase rather than rent machnery followng the entry of such ntermedares. 3. Data Our emprcal nvestgaton of the relatonshp between farm sze and agrcultural productvty uses four types of data from two hghly-detaled rural surveys that form a panel. The 12
14 man data sets are the Rural Economc Development Survey (REDS ) and the 1999 REDS, both carred out by the Natonal Councl of Appled Economc Research (NCAER). The surveys were admnstered n 17 of the major states of Inda, wth Assam and Jammu and Kasmr the only major states excluded. The two surveys are the ffth and sxth rounds of a panel survey begun n the crop year. The orgnal sample frame was meant to be representatve of the entre rural populaton of Inda at that tme but used a stratfed samplng scheme that oversampled larger farms. 10 By the sxth round, the orgnal samplng weghts no longer enable the creaton of natonally-representatve statstcs from the later-round data. The data can be used, however, to estmate relatonshps among varables that characterze behavor n the populaton. Both the 1999 and rounds nclude a vllage survey that provdes nformaton on market prces and fnancal nsttutons. The survey also ncludes a vllage census, carred out n 2006, of all of the households n each of the orgnal 242 vllages n the panel survey. 11 The lstng data, whch ncluded almost 120,000 households, wll be used n the fnal secton to examne land leasng patterns wthn vllages. The survey of sampled households n the REDS took place over the perod , and ncludes 4,961 crop cultvators who own land. The sample of farmers nclude all farmers who were members of households ntervewed n the 1999 round of the survey plus an addtonal random sample of households. These panel households nclude both household heads who were heads n 1999 and new heads who splt from the 1999 households. There are 2,848 panel households for whom there s nformaton from both the 1999 and survey rounds. Whle both survey rounds collected detaled nformaton on nputs and outputs assocated wth farm producton by operaton and season, the survey s unque among the surveys n the NCAER long-term panel n that the nput and output data were collected at the plot level. There s nput-output nformaton for 10,947 plots, wth about two-thrds of the plots observed at least twce (two seasons or more). The plot/season data enable us to carry out the analyss across 10 The oversamplng of hgh-ncome households s an advantage for ths study, gven our focus on the relatonshps among scale, productvty and mechanzaton, because there s more varaton n own landholdngs at the upper tal where mechanzaton s prevalent. 11 Appendx Fgure A3 provdes the dstrbuton of own landholdngs n the set of sampled vllages n comparson to that from the Census of The fgure shows that landholdng dstrbuton n the sample vllages s skewed to the rght relatve to the natonal fgures. Ths s not due to the oversamplng of hgh-ncome households, but reflects the geographcal samplng. 13
15 plots n a gven season, thus controllng for all characterstcs of the farmer, ncludng the nput and output prces he faces. The survey also ncludes retrospectve nformaton for each household head on nvestments n land and equpment, by type, snce Ths ncludes nformaton on land and equpment that s sold, purchased, destroyed, transferred or nherted. Ths nformaton wll be used to estmate the determnants of farm mechanzaton. Another mportant feature of the data s that t provdes nformaton on the source of changes n landholdngs. The prmary component of land ownershp turnover s nhertance that results from famly dvson - less than 3 percent of farmers bought or sold land over the entre nne-year perod. Dvson most often occurs when a head des and the adult sons then farm ther nherted land. Dvson sometmes occurs pror to the death of a head, whch may result from dsputes among famly members (Foster and Rosenzweg, 2003). Tme varaton n the state varables owned landholdngs and equpment thus prncpally stems from household splts. Our dentfcaton strategy explots ths source of varaton n landholdngs. An mportant assumpton of the model s that the rental of land does not overcome the lmtatons of scale assocated wth owned plots. The data ndcate that only 4.6 percent of cultvated plots, over the three seasons, are rented (4.9 percent of area). Moreover, the data ndcate that n all states of Inda, except West Bengal, 72% of cultvated land s leased from mmedate famly members (parents and sblngs). Ths s not unexpected, gven the presumed effcency of cultvatng contguous land area, the practce of partble nhertance that makes t lkely that owners of adjonng plots are close kn, and the possble moral hazard ssues that mght arse n terms of farm mantenance Supervson costs, the shadow value of labor and the computaton of farm profts A key feature of both the 1999 and surveys s that they provde detaled nformaton on labor use for each of three seasons for each of seven agrcultural operatons (stages), 13 dstngushng types of labor by whether they are hred, famly, permanent, whether supervsng, and by gender and age. In addton, there s nformaton on the labor supply of famly members off-farm. As ndcated n the model, operaton-specfc nformaton on use of hred labor and supply of off-farm labor s crtcal for mputng unt labor costs. The surveys also nclude 12 In West Bengal, 26% of farmers rent from landlords, and only 7% from famly. 13 The operatons are land preparaton (plowng, tllng), transplantng/sowng, weedng, fertlzer applcaton, pestcde applcaton, rrgaton operaton, harvestng. 14
16 nformaton on own use of mplements by type and the rental of mplements, by type. Other nputs nclude pestcdes, fertlzer, and water. We subtract out the total costs of all of these nonlabor nputs, ncludng the mpled rental costs for own equpment, from the value of output usng farm gate prces. The computaton of labor costs requres that we approprately value labor nputs n order to compute profts. The model ndcates that the regme-specfc shadow value of labor for each operaton s gven by 1 s R f (23) w ( a) w * 1 h ( a)( s s ) h f Thus we need to obtan estmates of how supervson tme vares by famly and hred labor usage. To obtan the relevant coeffcents s f and s h we use nformaton on mandays of supervson and gender/age-specfc famly and hred labor from the 1999/ panel data to estmate the supervson functon: (24) S tj = s f L ftj + s h L h tj + μ j + e tj, where S tj =age/gender adjusted mandays of supervson on farm j n year t, L ftj =age/gender adjusted mandays of manual famly labor, L h tj =age/gender adjusted mandays of manual hred labor. 14 As n the model, we assume that supervson of famly and hred labor does not vary by operaton, so we aggregate the three types of labor across operatons and seasons. Estmaton of (24) by OLS would lkely lead to an upward bas n the coeffcent on famly labor, gven that supervson s suppled exclusvely by famly members. For example, n households where famly members prefer less home produced goods (lesure), there may be both more famly labor and more supervson tme suppled. To elmnate ths source of bas, we dfference equaton (24) across the survey round to elmnate any household-level fxed attrbutes, such as preferences for work. However, any tme-specfc shock to famly labor supply (e.g., llness) could also lead to an upward bas n s f relatve to s h.. To elmnate ths source of bas we use nstrumental varables, employng varables that predct changes n the famly labor force and hred labor between the two survey rounds. 14 The adjustments were made usng the raw nformaton on total days worked by women, men and chldren n each operaton aggregated usng the sample medan of operaton/gender/age-specfc productvty weghts provded by sample respondents n the 1999 round of the data. 15
17 There are two reasons for a change n the sze and composton of a farm s labor force - household dvson, land nhertance and demographc change. Wth respect to the frst, we take advantage of the fact that over the nne-year nterval between surveys 19.9% of farms dvded. Ths not only changes the number of household members but also the amount of owned land and thus labor demand. Accordngly, based on the analyss of household dvson n Inda (Foster and Rosenzweg, 2003) we use as nstruments varables that predct household splts and the change n landholdngs. We also use as nstruments varables that predct shfts n the number of adult famly members due to ageng, namely the age/gender composton of the household n The nstruments nclude the number of brothers, head s father's age, whether the head's father co-resded, the number of boys and grls aged<10 and over 5, the number of boys and the number of grls aged>=10 and <15, and household sze n 1999; and total nherted land by Column 1 of Table 1 reports the estmates of (24) usng OLS. These estmates suggest that for each manday of famly manual labor, 0.17 mandays of (famly) supervson tme s appled, larger than the estmate for hred labor. The fxed-effects estmates n column 2, as expected, rase the supervson coeffcent on hred labor relatve to famly labor, but the s f and s h coeffcents are not very dfferent. The FE-IV estmates, however, whch elmnate any bases due to shocks to famly labor supply, suggest that hred labor requres substantally more supervson than does famly labor: the pont estmates ndcate that every manday of hred labor requres.6 mandays of supervson tme. In contrast, an extra manday of famly labor adds only.14 supervson mandays. 15 Ths substantal gap between s f and s h suggests that the expanson of the scale of agrcultural operatons may sgnfcantly rase unt labor costs: the shadow wage formula (23) and the thrd column pont estmates of s f and s h. from Table 1 ndcate that wthn an operaton movng from a regme n whch the household employs only famly labor and supples some labor to the market to hrng any labor, doubles the shadow prce of labor. Accordng to (23), to compute unt labor costs for each farm n each year we need to know not only s f and s h but for each operaton the employment regme of the household (h*). Thus, for each household and operaton we created an ndcator varable for whether the household was 15 Table A1 n the Appendx provdes the frst stage estmates. The dagnostc statstcs ndcate rejecton of the null that the estmates are underdentfed. 16
18 hrng labor, hrng out famly labor or nether (autarchy). 16 To compute the approprate shadow wage for each operaton we used nformaton on operaton-specfc daly market wages avalable at the vllage level n each survey, the estmates of s f and s h. from Table 1, and the operaton specfc h*. These shadow wages were then multpled by the total amount of mandays n each operaton. 17 Total labor costs are the aggregates of the operaton-specfc labor costs. Profts were then computed as output value mnus total labor costs less the costs of all other nputs.. 18 All values from the round were deflated based on state-specfc rural CPI ndces to 1999 values. The doublng of unt labor costs when labor s hred means that how average labor costs are related to land sze wll depend on how the fractons of the total farm labor force employed n each of regmes 1, 2 and 3 vary by landownershp sze. Fgure 2 provdes a lowess-smoothed plot of the relatonshp between these fractons and owned landholdngs n the survey. Fgure 2 shows that the fracton of the labor force employed n the regme n whch household members are not partcpatng n the labor market as ether buyers or sellers of labor s not only small, at less than 10%, but does not vary sgnfcantly across the dstrbuton of landholdngs. As ndcated n the model, the shadow prce of labor for that regme s endogenously-determned, but bounded by w R n regme 1 and w R of regme 2. To smplfy the computaton of profts we set the shadow prce of labor to be the lower-bound fgure so as to make conservatve our estmates of scale economes, but t s clear from the fgure that the choce of ether bound wll not apprecably affect the results. 19 The fracton of the labor force employed n low-prced regme 1, however, monotoncally falls as landholdngs ncrease, from over 27% among the smallest farms to under 7% for farms of 20 acres. More mportantly, the fracton of the on-farm labor force employed 16 We accounted for hrng out to ether the farm or nonfarm casual labor market, ncludng constructon employment and employment n any publc employment scheme. 17 Note that n regme 2, the hgher operaton-specfc shadow prce for that regme apples to both hred and famly labor. 18 Our proft measure corresponds to emprcal profts n the model as t does not nclude nterest costs assocated wth usng credt to pay for nputs. 19 We wll show that our estmates are not senstve to settng the shadow wage to the upper bound n the autarchy regme. Interestngly, the fracton of operatons n the autarchc regme (35-40%) s much hgher than the fracton of the labor force employed under the autarchc regme. Ths dfference arses because the autarchy regme s unlkely to obtan when labor demand s hgh. The harvestng operaton, for example, requres substantal effort and hred workers are commonly employed n ths stage, even on relatvely small farms. 17
19 under regme 2 (any hred n labor), whch has the hghest-prced labor, monotoncally rses wth land sze. In partcular, among farms of 20 acres about 88% of the labor force s employed n the hgh-prced regme, as compared wth only 65% for the smallest farms. Ths means that average unt labor costs are 15% hgher on the largest farms compared wth the smallest farms. Gven the hgher labor costs on larger farms, t would be expected that large farms are less labor-ntensve. Fgure A4 n the appendx, whch provdes a lowess-smoothed plot of total peracre mandays of labor, agan adjusted for gender and age, by sze of owned landholdngs from the survey, confrms ths. The fgure ndcates that the per-acre amount of labor employed on the smallest farms s 5.8 tmes the amount used on 20-acre farms. Despte hgher per-unt labor costs per-acre, total per-acre labor costs on larger farms are thus much lower than those on smaller farms because of the lower-labor ntensty of producton. The emprcal queston s whether the lower labor-ntensty of larger farms reflects merely ther cost dsadvantage as exhbted n Fgure 2 or also part reflects ther ablty to substtute machnes for human labor more effcently. Fgure 3 plots four varants of farm productvty by owned landholdngs from the survey round. The frst two replcate measures commonly used n the lterature: gross output value per acre and per-acre profts net of all but the cost of famly labor (only pad out costs). The second two are our measures of profts, whch take nto account regme- and operaton-specfc agency costs of both hred and famly labor, usng the lower and upper bounds, alternatvely, for labor shadow prces n the autarchy regme. As can be seen, farm productvty measured by per-acre output frst declnes steeply wth farm sze for farms below two acres and then s relatvely constant for farm szes above two acres. Ths would appear to prmarly reflect the uncosted greater ntensty of labor use on the smallest farms. As farms below two acres represent 68% of all farms n Inda, t s not surprsng that many studes usng ths measure of farm effcency conclude that small farms are more productve. However, a farm productvty measure constructed by subtractng pad costs from the value of output, wth thus only famly labor beng valued at zero, falls wth ncreases n land sze only for farms below one acre, representng just 9.8% of all farms n Inda. Above one acre, there s a monotonc rse n ths measure of farm proftablty wth farm sze. When the theoretcallyjustfed costs of famly and hred labor are taken nto account we see that per-acre proftablty rses wth land sze over the whole dstrbuton of farm szes, and more steeply wth land sze 18
20 compared wth the proft measure that excludes famly labor n operatonal costs. Moreover, these measures suggests that profts are negatve for farms below one acre when agency and opportunty costs of labor are taken nto account. Of course, all of these fgures, as noted, are descrptve. To gage whether an ncrease n land sze augments proftablty, across the farm sze dstrbuton, we need to know how an exogenous ncrease n land sze for a gven farmer affect per-acre profts. 5. Owned Landholdngs and Proftablty To estmate the causal effect of total land owned as well as owned machnery on per-acre proftablty we need to account for the possblty that landownershp and machnery are correlated wth unmeasured attrbutes of farmers. We agan use the panel data. Pror studes have exploted panel data to elmnate tme-nvarant fxed farmer and land characterstcs such as rsk averson or ablty. However, ths s not suffcent to dentfy the effect of varaton n a captal asset such as land. The equaton we seek to estmate s (25) π jt = d 0t + d A A jt + d k k jt + μ j + ε jt, where t s survey year, k=value of all farm machnery, μ j =unobservable household fxed effect, and ε jt =an d error. Controllng for owned farm machnery, we expect that the coeffcent d A >0 f there are scale effects that permt more effcacous use of farm machnes and lower credt costs. The coeffcent on owned machnery (d k ) reflects the nterest savngs assocated wth ownershp, whch may be hgher for small farms. Estmaton of (25) by OLS s not lkely to provde a consstent estmate of the effects of ether owned machnery or land sze. For example, farmers who are unobservably (to the econometrcan) proftable may be better able to fnance land purchases and equpment, leadng to a spurous postve relatonshp between landholdngs, captal equpment and per-acre profts. Takng dfferences n (25) across survey years to elmnate the farmer fxed effect, we get (26) Δπ jt = Δd 0 + d A ΔA j + d k Δ k j + Δε jt, where Δ s the ntertemporal dfference operator. However, n (26), even f the errors ε jt are d, nvestments n captal assets such as land or equpment wll be affected by pror proft shocks n a world n whch credt markets are mperfect. Moreover, shocks to profts mght affect the lkelhood of famly dvson. By dfferencng we thus may ntroduce a negatve bas n the land and equpment coeffcents - postve proft shocks n the frst perod make ΔA jt hgh when Δε jt s 19
21 low. That s, even f the contemporaneous cov(ε jt, A jt ) = 0, because assets are measured pror to the proft shock, cov(δε jt, Δaj ) 0. We show below that for most farms (small farms) n Inda there s undernvestment n machnery, relatve to what would be expected n the absence of credt constrants, and that past proft shocks affect current varable nput use. Moreover, f landholdngs and equpment are measured wth error, dfferencng wll augment attenuaton bas n the coeffcents. To obtan consstent estmates of d A and d k we agan employ an nstrumental-varables strategy that explots the dvson of households over the nne-year perod as well as land and equpment nhertance. For all heads of farm households n , we have nformaton on nhertances snce 1999 and for the household heads n the 1999 survey round, we know how much of ther owned land and equpment was nherted before the 1999 survey round. The nstruments we use to predct the change n landholdngs of a farmer between 1999 and are thus the value of owned mechanzed and non-mechanzed assets nherted pror to 1999 and the value of assets and acreage of land nherted between 1999 and We also agan add varables that n our pror study of household dvson n Inda (Foster and Rosenzweg, 2002) contrbuted to predctng household splts and the sze of nhertance. Splts, and the nhertance of land, most often occur at the death of the father. We thus nclude the age of the father n In some cases, sons choose to splt from the famly pror to the death of the father/head. Thus, the father of a farmer n may not have been co-resdent n 1999, the son already havng splt. We thus also nclude a dummy ndcatng the resdent status of the father n In our earler study we found that nequalty among clamants (prncpally sblngs) was a sgnfcant predctor of household dvson for households n whch the father was co-resdent. We thus also nclude a measure of the educatonal nequalty among the clamants to the head s land n 1999 and an ndcator of whether the farmer n had brothers. Appendx Table A2 contans the estmates of the frst-stage equatons predctng the change n landholdngs and the value of farm equpment between 1999 and The Anderson Rubn Wald test of jontly weak nstruments rejects the null at the.005 level of sgnfcance. Indeed, post-1999 nhertance of land s a sgnfcant predctor of the change n landholdngs over the perod along wth the ndcator of whether the father was not co-resdent n 1999, whle nherted assets obtaned pror to 1999 and nequalty n clamants statstcally and sgnfcantly 20
22 affect the change n the stock of equpment. We estmate two varants of (26), omttng captal equpment n order to estmate the uncondtonal relatonshp between landownershp sze and proftablty gross of owned farm equpment and addng the fracton of owned land that s rrgated. We frst report estmates for all three specfcatons usng only vllage and tme fxed effects n columns 1-3 of Table 2, where the reported t-ratos are clustered at the 1999 farm level. Ths estmaton procedure roughly, by vllage area, controls for land qualty heterogenety and prces, but not ndvdual farm heterogenety. These estmates ndcate that larger farms are margnally but statstcally sgnfcantly more proftable per acre, consstent wth Fgure 3. The postve proft-farm sze gradent s robust to the ncluson of the rrgaton and captal equpment varables. The farmer fxed-effects estmates, reported n columns 4-6 of the table, are smlar n magntude to the estmates n whch only vllage fxed effects are ncluded, agan ndcatng a precsely-estmated but small postve effect of owned land on per-acre profts. However, as dscussed, these estmates are based negatvely to the extent that there are credt constrants on captal nvestments. The last three columns of Table 2 report the FE-IV estmates that elmnate the bas n the farmer fxed-effects estmates. These show that an exogenous ncrease n landholdngs gross of changes n captal equpment also sgnfcantly ncreases per-acre profts, but by a larger amount than ndcated by the methods that do not take nto account the full endogenety of land owned. The pont estmate ndcates that a one-acre ncrease n landholdngs at the mean ncreases peracre profts by 9.2%, and ths effect appears to be robust to the ncluson of the rrgaton share. The (average) margnal return on captal assets s small and postve (1.9%), but only margnally statstcally sgnfcant. The Klenberger-Paap and Hansen J dagnostc test statstcs, reported n the table, ndcate that we can reject the null that the second-stage estmates for ether specfcaton are not dentfed. Do the estmates ndcate that there s an optmal farm sze? Or put dfferently, s there a farm sze at whch addtonal ncreases n owned land no longer ncrease profts per acre? Fgure 4 reports the locally-weghted FE-IV land coeffcent d A by land ownershp sze rangng from 0.1 to 20 acres along wth the assocated one standard devaton bands. As can be seen, for all landholdngs below 20 acres ncreases n owned land ncrease profts per acre, but the effects are 21
23 substantally larger for the smaller farms and almost vansh among farms of 20 acres. The effects are qute large for the 83% of farms n Inda below fve acres; ncreasng farm sze by one acre would ncrease per-acre proftablty by around rupees. If credt costs declne wth land sze, as we have assumed, the margnal returns to captal should also declne wth land ownershp sze. Appendx Fgure A5 reports the locally-weghted FE-IV estmates of the margnal return to captal equpment d k, along wth the assocated one standard devaton bands, across the same range of owned landholdngs. Margnal returns evdently do declne as landholdng ncrease - for farm szes below two acres, the return to captal s between.02 and.06, whle for farms of 10 acres, the return vanshes. Whle smaller farms may use an effcent level of machnery gven ther scale and borrowng costs and the prevalng equpment rental rate, the need to fnance these rentals evdently substantally reduces nput use and thus proftablty. Note that because a major component of the return to own captal s the savngs on nterest and we have not accounted for nterest costs n our measure of profts, these returns to captal are underestmated. Ths may be one reason that the estmates ndcate negatve returns to owned captal above 10 acres. Note also that the downward gradent s also underestmated to the extent that nterest costs declne wth owned land. In Appendx Table A3 we report estmates that replace our measured profts by () profts that employ the upper-bound shadow prce of labor n autarchy and () a measure of profts that assumes the shadow prce of famly labor s zero (uncosted famly, but approprately prced hred labor), respectvely. As can be seen, the man fndng that ncreases n landownershp sze sgnfcantly ncreases proftablty per acre s robust to these alternatve measures of farm productvty. Indeed, because computed profts are hgher when the cost of famly labor s not taken nto account, the estmated margnal effect of ncreasng land sze s double that pertanng to profts when labor costs are approprately accounted for, usng ether the theoretcally-justfed upper- or lower-bounds on the labor shadow prce n the autarchy regme. 6. Farm Sze and Equpment Investment and Rental Appendx Fgure A5 suggests that credt costs fall wth landownershp, gven the undernvestment n machnery characterzng small farms. In ths secton we estmate the effects of landholdngs on equpment nvestment and rental. The model suggests that farms ownng more land wll purchase more captal equpment to take advantage of scale economes and because they 22
24 face lower credt costs. For ths analyss we use the retrospectve nformaton from the REDS that provdes a yearly hstory of land and captal equpment acquston from 1999 up to the survey ntervew date. In contrast to the panel data based on nformaton from the 1999 and survey rounds n whch the household unt s defned by the households n 1999, 19% of whom splt, the unt for ths analyss s the household n There are two consequences. Frst, the sample s larger than the panel, because the latest survey round ncludes a new random sample of households. Second, f a farmer splt from a household after 1999 hs owned land and farm assets at the 1999 date s reported as zero f he was not formerly the household head. 25% of the sample farmers n experenced an ncrease n owned landholdngs snce 1999, of whom 79% nherted land due to household dvson. Less than 1.2% of farmers were observed to experence a declne n owned landholdngs. We create a panel data set from the retrospectve hstory by computng any new nvestments made n farm machnery wthn the three-year perod pror to the ntervew data and wthn the three year perod We also compute the stock of equpment and landholdngs n 1999 and three years before the ntervew n the last round. Thus we create two observatons on captal nvestment, landholdngs and equpment stock value for each farmer. 20 We also examne the determnants of equpment rental. Here we must use nformaton on the value of hred equpment servces n 1999 and n from the 1999 and the surveys, so that the sample sze s reduced to the matched panel. Our model ncorporates credt market mperfectons as one of the factors that constran mechanzaton, wth owned landholdngs servng to mtgate credt costs. We thus add to the household panel nformaton on bank proxmty. From the 1999 and vllage-level data we created a dummy varable ndcatng whether a commercal bank was wthn ten klometers of the vllage n whch the farm household was located. 84% of farmers were wthn 10 klometers of a bank n 1999; the correspondng fgure n was also 84%. However, banks were not statonary. 25% of the farmers experenced ether the ext of a bank or a newly-proxmate bank. The equpment purchase and hre equatons we estmate are thus of the form: (27) K kjt = e 0t + e A A jt + e k k jt + e B B jt + μ j + η jt, 20 In prncple the data can be used to examne the determnants of net land sales. However, less than 2% of farmers sold or purchased land over the 9-year nterval. In contrast, 18% of farmers nvested n captal equpment. 23
25 where K=equpment purchase or rental and B=bank proxmty. We expect that e A >0, e k <0, and e B >0; that s, large landowners are more able to fnance equpment purchases and have a hgher demand for equpment rental, gven ther exstng stock of farm machnery, whle pror ownershp of machnery should reduce addtonal equpment purchases or rental. To elmnate the nfluence of unobserved tme-nvarant farm and farmer characterstcs (μ j ), we agan dfference across the two perods and use nstrumental varables to elmnate the bas dscussed n the prevous secton. Because a lttle over half of the observatons n the retrospectve-based panel are from the newlydrawn sample of households n , we cannot use nformaton on famly crcumstances n 1999 as nstruments, whch s only avalable for the panel. We use as nstruments for the change n owned landholdngs, the change n the value of farm equpment and the change n bank presence, the value of farm assets nherted snce 1999, the amount of land nherted snce 1999 and bank proxmty n The estmates of (27) are presented n Table 3; the frst-stage estmates are presented n Appendx Table A4. Agan, the estmates pass the standard dagnostcs tests. Inherted land s a statstcally sgnfcant predctor of the change n owned landholdngs, nherted assets are statstcally sgnfcant predctors of the change n the value of the stock of machnery, and bank presence n 1999 s a statstcally sgnfcant predctor of subsequent bank locaton. The frst column of Table 3 reports fxed-effects estmates of the determnants of machnery nvestment that do not use the nstruments. Whle the sgns of the coeffcents are as expected, the precson of the coeffcent estmates s low for both land and the equpment stock. When nstruments are used, however, as reported n the second column, both the captal equpment and land coeffcents ncrease substantally and become statstcally sgnfcant. In partcular, an ncrease n owned landholdngs ncreases equpment nvestment, gven the exstng stock of equpment, whle for gven landholdngs, those farms that already own equpment nvest less. The effect of bank presence also appears to contrbute postvely to equpment nvestment. The estmates n columns four through sx n Table 3 for equpment rental parallel those for equpment purchases, except that bank presence s negatvely related to rental. Larger farms ownng less equpment rent hgher amounts of power machnery. The postve bank coeffcent n the equpment purchase equaton and the negatve coeffcent n the equpment rental equaton may reflect the fact that banks are less lkely to fnance varable nput costs. Thus, where banks 24
26 are proxmate, the cost of equpment ownershp s low relatve to that of machnery rental. 7. Identfyng Scale Effects The panel-data estmates of the effect of owned landholdngs on proftablty reflect, as noted, not only scale economes assocated wth the use of a hgher-capacty (or any) mechanzed nputs but also lowered credt costs and augmented labor nput costs. In ths secton, we dentfy the effects of scale net of both labor cost effects and credt cost effects, by estmatng how varaton n the sze of plots for a gven farmer n a gven season affects plot-specfc per-acre proftablty and nput use. Over three seasons we have 16,544 observatons on owned cultvated plots for 7,845 farmers n the survey round. By usng farmer/season fxed effects we are holdng constant nput prces nclusve of the shadow prce of labor as well as total owned assets and access to credt. The effects of varaton n plot area thus predomnantly reflect only scale economes assocated wth the more effcent explotaton of mechanzaton on large plots.. Cross-plot, wthn-farmer/season estmates can be based, however, f owned plot szes are chosen by farmers and plots vary by unmeasured characterstcs that affect productvty. Wth respect to plot sze, the data ndcate that a farmer s ownershp holdngs conssts manly of parcels of nherted land. 21 A plot s a contguous area of land that a farmer consders to be the basc unt of farmng. Three-quarters of plots consst of a sngle parcel; the rest are sets of contguous parcels. Plots are thus almost always sets of nherted parcels that are contguous, as n less than 4% of cases s a contguous parcel broken nto more than one plot. The medan dstance between plots s 400 meters. Plot sze s thus prncpally determned by the locaton and confguraton of the farmer s nherted parcels of lands. The data also ndcate that plots dffer n sol qualty. The survey ncludes seven characterstcs of plots. These nclude depth, salnty, percolaton, dranage, color (red, black, grey, yellow, brown, off-whte), type (gravel, sandy, loam, clay, and hard clay) and dstance from the farmer homestead. We are thus able to control for plot characterstcs. To dentfy scale effects from the plot data we estmate the equaton (28) π jt = b 0j + b A A jt + b I I jt + X j a x + u jt, where π jt =profts per acre on plot for farm j, b 0j =farmer/season fxed effect, A jt =plot area 21 96% of owned parcels were acqured, prncpally through nhertance, from an mmedate famly member or grandparent. 25
27 (acres), I jt =whether the plot s rrgated, X j =vector of sol and locaton plot characterstcs, and u jt s an d error. The nterpretaton of the coeffcent on plot area b A s straghtforward - t s the effect of scale on profts. However, as noted by Lamb (2003) and Barrett et al. (2010), measurement error n plot sze bases the own sze coeffcent negatvely. Thus, we wll get a lower-bound estmate of scale. The frst column of Table 4 reports the estmates of equaton (28) wthout the ncluson of the seven plot characterstcs. The second column reports estmates wth the plot characterstcs ncluded. In both specfcatons, the estmates are consstent wth the operaton of scale economes - larger plots, gven the farmer s total ownershp holdngs, capabltes, preferences, and wthn a labor-cost regme, are assocated wth hgher profts per acre, despte the negatve bas nduced by measurement errors, a fndng consstent wth Barrett et al. (2010), who also explot varaton n plot szes to estmate scale effects. 22 The estmates of scale effects obtaned from plot sze varaton for a gven farmer are about 25% lower than the statstcally-preferred FE-IV estmates of land sze effects on profts obtaned from the panel. Because the panel estmates of land sze effects reflect both agency and credt costs, whle the wthn-farmer estmates do not, the set of estmates suggests that the negatve agency cost effects from ncreasng scale are more than offset by the decrease n credt costs. Are the cross-plot proft estmates consstent wth scale effects assocated wth mechanzaton? We further explore ths queston by explotng the spatal varaton n the presence of a tractor rental market and by lookng at how plot sze affects the lkelhood of usng a tractor. Formal tractor rental markets were n place n 36.4% of our survey vllages n 2006, such that there was an establshed rental prce for tractor use. If mechanzaton accounts for the estmated effect of scale, then the presence of a formal tractor rental market should augment the effect of scale on profts. The thrd column of Table 4 reports estmates of equaton (28) wth an nteracton term between plot sze and the presence of a formal tractor rental market. That coeffcent s postve 22 Many nvestgators use output value per acre to measure productvty. Assunção and Brado (2007) employ a smlar cross-plot methodology based on ICRISAT data that ndcates a negatve relatonshp between per-acre output value and plot sze, net of a farmer fxed effect and multple measures of plot characterstcs. However, measurement error bases negatvely the coeffcent. In our data, the relatonshp between own plot sze and output value per acre s postve, small and statstcally nsgnfcant. 26
28 and sgnfcant at the.045 level, one-taled test. In columns four through sx we replace per-acre profts by a dummy varable takng on the value of one f a tractor s used on the plot. By usng a dummy varable, we avod the ambguty, as dscussed n the theory secton, that may arse because the quantty of machnery use may declne wth scale as machne capacty rses. The estmates, wth and wthout plot characterstcs ncluded, ndcate that, consstent wth the noton that too small a scale nhbts effcent use of mechanzaton, a tractor s sgnfcantly more lkely to be used on a larger plot; the effect of plot sze on whether or not a tractor s employed s also hgher n vllages wth an actve tractor rental market, but the effect s not statstcally sgnfcant. Fnally, n columns seven through nne we see that total labor costs per acre mrror the effects of scale on plot-specfc tractor use - larger plots use less labor per acre and the reducton n labor use on larger plots s sgnfcantly stronger where there s a formal tractor rental market. 23 One aspect of cultvaton that s gnored n these estmates s crop choce. It s possble, for example, that hgher value, less-labor ntensve and more easly-mechanzed crops are planted on larger plots. To assess f our results hold up for a sngle crop, we restrcted our analyss to plots cultvated wth rce. Ths restrcton cuts the number of plot/season observatons by 70%. However, as seen n Appendx Table A5, the results are almost dentcal to those obtaned usng all crops - the postve effects of plot sze on proftablty and negatve effects on labor-ntensty are hghly statstcally sgnfcant and the pont estmates are almost dentcal n magntude to those obtaned usng nformaton on all crops. Indeed, the effect of plot scale on tractor use s stronger for rce plots, but the estmate s not as precsely estmated as n the larger sample. 8. Credt market mperfectons, sze, and the effects of proft varablty In the precedng secton our estmates of credt market effects assumed that the amount a farmer borrowed reflected only hs demand for nputs and hs ownershp of equpment, gnorng own savngs as a source of lqud captal. In ths secton we consder the role of landholdngs n determnng proftablty n a dynamc settng n whch profts are stochastc and lqud captal, or cash on hand, affects nput allocatons when credt market mperfectons are n place. In ths settng, f there are credt restrctons a farmer who has partcularly hgh profts n one perod may be able to fnance more nputs and thus accrue greater profts n a subsequent perod. If he has 23 Measurement error n plot sze bases negatvely the effect of plot sze on labor use. In Foster and Rosenzweg (2010) we report FE-IV estmates of landholdngs on per-acre labor costs based on the panel data that ndcate larger landholdngs reduce labor costs per acre sgnfcantly. 27
29 access to large amounts of captal at market rates no such effects should be observed. There are other reasons, however, why there may be a correlaton n profts across tme for a gven farmer. For example, t s well-known that fertlzer use ncreases nutrent levels n the sol that persst over tme. Ths persstence wll nfluence fertlzer use and thus proftablty n a subsequent perod. Because past fertlzer use wll augment past proftablty, one mght observe a negatve correlaton between past profts and current fertlzer use. Inattenton to dynamc nutrent effects mght lead to the false concluson that credt constrants are unmportant even f credt mperfectons were present. Removng farmer and/or plot specfc fxed effects from estmates of a proft equaton may remove fxed aspects of sol qualty that affect profts but wll not control for the effects of lagged nutrent shocks. In Appendx E, we use a smplfed verson of our model to show, n the context of a forward lookng dynamc optmzng model how a shock n perod t affects nput use and profts n perod t+1. To separate out credt effects from dynamc nutrent effects we explot the fact that we have plot-level data on multple plots for each farmer over three consecutve seasons, whch allows us both to control for all unobserved plot characterstcs and to separate the effect of a crop shock on lqudty from the effect of the shock on sol nutrents. We augment the dynamc model n Appendx E by lettng cash on hand depend on the unantcpated devatons n the across-plot average shock so that h * * ( ) t 1 ht t Et t. The key dstncton s between lagged profts and fertlzer use on a gven plot and lagged profts on all other plots. The coeffcent on the lagged profts specfc to a plot wll capture the combned nutrent and (a small fracton of) lqudty effects; the coeffcent on the lagged profts from other plots wll only reflect the lqudty effect. To dentfy the latter, we use a subsample of farmers who cultvate at least two plots over three seasons, and we also control for prevous perod own use of fertlzer on the plot, as lagged fertlzer use wll be correlated wth lagged profts and wll have an effect on current profts due to nutrent carryover. To see how lqudty effects dffer by owned landholdngs, the wthn-plot, cross season estmates, are reported n Table 5 for three categores of farmers - farmers wth total holdngs below four acres, those wth owned land between four and less than 10 acres, and those wth holdngs of at least 10 acres. The estmates are strongly consstent wth the noton that lqudty shocks affect nput use and thus proftablty among smaller farmers. In partcular, condtonng 28
30 on pror-season profts and fertlzer use on a gven plot, a 1000 Rupee decrease n profts per acre on a farmer s other plots n the prevous season leads to a substantal and statstcally sgnfcant 85 Rupee decrease n profts per acre among farmers wth less that four acres of land. Among farmers wth 4-10 acres of land the correspondng fgure s approxmately the same, but less precsely estmated, but among the largest farmers (10+ acres) the estmate s essentally zero. In contrast to the lagged farm-level proft effects, the correspondng coeffcents for pror-perod plot-specfc profts are negatve, as expected, and n contrast, do not declne n absolute value across farm szes, consstent wth the dea that the own proft effect s manly a technologcal effect (n ths case nutrent depleton) that s constant across landholdngs. The Table 5 estmates are based on a more or less arbtrary dvson of farms by sze. Fgure A6 n the Appendx provdes the locally-weghted lowess estmated relatonshp between the lagged profts of other plots on current own plot proftablty across the full dstrbuton of farm szes up to 20 acres based on the same specfcaton as seen n Table 5. As can be seen, the effect of a lqudty shock on proftablty s substantally hgher on small compared wth larger farms. For farms of two acres, a 1000 rupee decrease n profts the prevous season reduces current profts by 105 Rupees but by 85 rupees for farms of 19 acres. 9. The Reservaton Rental Prce, Landholdngs and Rentals In ths secton we use our estmates of the margnal effects of land sze on per-acre proftablty by ownershp holdngs, dsplayed n Fgure 4, and our estmates of average per-acre proftablty by land sze, n Fgure 3, to compute the reservaton rental prce (RRP) by land sze, usng the formula gven by (12). In prncple, any nonzero relatonshp between land sze and the RRP ndcates an neffcent dstrbuton of land, and the specfc shape of the relatonshp s nformatve as to how a redstrbuton of land, by specfc land categores, would affect overall farm effcency. Another use of the estmated RRPs, however, s to assess the external valdty of our framework. We do ths () by comparng our estmates of RRP to rental rates and estmated land values provded n the vllage-level data and () by ascertanng f the relatonshp between our RRP and land sze are n accord wth observed land rental behavor. As seen n (12), the reservaton rental prce for a farmer n the presence of returns to scale has two components: a component reflectng the proftablty of the addtonal unt of land and a second component ndcatng how an addtonal unt of land rases proftablty on the property as 29
31 a whole by ncreasng scale. Fgure 3 ndcates that average profts per acre ncrease sharply for small farms and then level off, whle the margnal scale effect on per-acre profts s hghest for the small farms (Fgure 4) and declnes to zero. On ths bass t s not obvous whether the RRP rses or falls as owned landholdngs ncrease. It s possble that the benefts n terms of scale economes are so large for small farms that they are wllng to pay hgher rents for addtonal land than larger farms even though ther average profts per acre are smaller. Fgure 5 plots the estmates of the RRP by owned landholdngs. There s evdently substantal varaton n the return to land. In partcular, the reservaton rental rate rses from close to zero for the smallest farmers to just under 15,000 Rs per acre at 12 acres and then begns to declne, reachng 8,000 Rs per acre for farms of 20 acres. Amalgamaton of land, for example, to 12 acres, barrng any general-equlbrum effects, would evdently ncrease overall agrcultural effcency by ths metrc. 24 How credble are the estmates of the RRPs? We frst compare our estmated RRP fgures, whch are calculated wthout reference to data on land prces or rental rates, to the range of vllage rental rates and land prces reported n the 2007 vllage-level data of the survey. The estmated average RRPs are qute close to the observed prces. The average reported rental rate per acre of rrgated land s 7,255 Rs and that for reported rental rates of non-rrgated land s 4,787 Rs. Average reported land prces are 221,683 Rs and 101,426 Rs for rrgated and unrrgated land, respectvely. Annualzed at a 5% nterest rates ths yelds mpled rental prces of 11,084 Rs and 5,071 Rs, respectvely. Wth respect to rentng behavor, the shape of the RRP trajectory n Fgure 5 suggests that the gans from rentng n are hgher for large than for small landowners, so we should expect to observe small owners rentng out land to larger farmers. One should not expect that leasng markets wll totally offset dfferences n land rental rates. Leasng, for example, does not 24 General-equlbrum effects from a large scale re-dstrbuton of land may be mportant. For example, because larger farmers use less labor per acre, expandng the sze of ths group wll, ceters parbus, lower the wage. Ths fall n wages would n turn prncpally beneft smaller farmers who use labor more ntensvely. Moreover, the computed RRPs ncorporate a model of utlty- maxmzng behavor but do not ncorporate, for example, a preference per se for holdng land or rsk averson n the context of ncomplete nsurance markets. Thus whle the varaton n the RRP by land sze reflects neffcency n terms of the allocaton of factors of producton, t does not necessarly mply that approprately compensated transfers of land towards large farms would be Pareto-mprovng. 30
32 generally solve credt market ssues for smaller farmers. Moreover, gven that scale economes arse n part from contguous land, as our plot-level fndngs ndcate, the opportuntes for productve trade gven ownershp holdngs appear to be small. Ths s reflected n the fact that less than 10% of farmers lease and most rental contracts are between famly members. 25 However, the 2006 vllage lstng data, whch provdes nformaton on landownershp and rental for all households resdng n the sample vllages, provdes a large enough sample sze (almost 120,000 households) to examne the dstrbuton of ths relatvely rare event across farms stratfed by ownershp sze to assess f Indan farmers seek to explot scale economes. The relatonshp between ownershp holdngs and the probablty of leasng n and leasng out n the 2006 lstng data, net of vllage fxed effects that characterze the relevant supply of exstng land plots, are shown n Fgure 6. The fgure strongly supports the hypothess that leasng goes n the drecton of capturng scale economes that are emboded n the estmated rrp s; that s, reverse tenancy. In partcular, relatve to a household that s 5 acres below the vllage mean a farmer wth 5 acres above the vllage mean has.018 (over 50%) hgher probablty of leasng n and a.014 lower probablty of leasng out. Leasng behavor thus tends to consoldate landholdngs and results n a larger average scale of operaton n Indan agrculture. Ths, accordng to our estmates, ncreases average effcency Concluson It has long been thought that due to the cost advantage of managng and recrutng famly labor, small farms n low-ncome countres are more productve than ther larger counterparts. In the context of Inda, there s a large body of evdence derved from data from the 1970s and 80s ndcatng that small farmers do acheve relatvely hgh output per acre. Whle those studes that have tred to look at the relatve proftablty of small farmers have provded mxed results, none have employed a theoretcally coherent method for measurng or adjustng for the dfferental costs of hred and famly. In addton, most emprcal studes were undertaken before the rse n 25 As we have noted land sales n our panel data are too scarce to characterze patterns by ownershp sze. The data do suggest, however, that land sales too are predomnantly ntrafamly - 95% of the land sales that took place between 1999 and 2007 are from parent to chld. 26 Rawa (2001) concludes from hs revew of studes of land sales and purchases n Inda that n general land sales also transfer land from small to large landholders. In hs own study of two vllages n West Bengal, ths pattern was reversed, but ths was due to the mposton and lowerng of land celngs and tenancy legslaton that requred large landowners to sell ther land. 31
33 mechanzaton n rural Inda that accompaned the economc reforms n the md 1990s. In ths paper, we derved a framework for assessng the effects of farm sze on productvty and measurng proftablty that ncorporates agency costs, credt constrants and scale economes arsng from mechanzaton. Ths framework was appled to unque panel and plot-level data from rural Inda. We found that despte an almost two to one cost dsadvantage per unt of work arsng from supervsory-cost dfferentals for famly and hred work, larger farmers have hgher proftablty per acre and, up to about 10 acres, a greater return to acqurng land than ther smaller counterparts. Our evdence ndcated that ths proft advantage of larger farms arses both from scale-dependent mechanzaton, whch dsplaces labor, and from lower captal costs and better protecton from adverse ncome shocks. Our estmates of the postve relatonshp between reservaton land rental rates and owned landholdngs are consstent wth observed tenancy and sales data from Inda whereby small farmers transfer land to larger farmers n the absence of program nterventons or polcy restrctons. However, both tenancy and land purchases and sales are evdently nsuffcent to equalze the large dspartes n returns to land across the land dstrbuton that we fnd. The low ncdence of both tenancy and land sales n the face of large dfferences n the returns to land nvestments suggests that there are sgnfcant barrers to land amalgamaton n rural Inda. Our fndngs thus suggest that understandng the source of these mpedments mght have large payoffs n terms of mprovng agrcultural effcency n Inda. References Assunção, J.J., and L.H.B. Brado. (2007). Testng Household-Specfc Explanatons for the Inverse Productvty Relatonshp. Amercan Journal of Agrcultural Economcs, 89 (4), Barrett, C.B., M.F. Bellemare and J.Y. Hou (2010). Reconsderng Conventonal Explanatons of the Inverse Productvty Sze Relatonshp. World Development, Vol. 38, No. 1. Benjamn, D. (1995). Can Unobserved Land Qualty Explan the Inverse Productvty Relatonshp? Journal of Development Economcs, 46 (1), Bhalla, S.S., and P. Roy. (1988). Ms-Specfcaton n Farm Productvty Analyss: The Role of Land Qualty. Oxford Economc Papers, 40, Carter, M.R. (1984). Identfcaton of the Inverse Relatonshp between Farm Sze and 32
34 Productvty: An Emprcal Analyss of Peasant Agrcultural Producton. Oxford Economc Papers, 36, Eswaran, M. and A. Kotwal. (1986).Access to Captal and Agraran Producton Organsaton. The Economc Journal 86: Feder, G. (1985). The Relaton between Farm Sze and Farm Productvty: The Role of Famly Labor, Supervson and Credt Constrants. Journal of Development Economcs, 18 (2-3), Foster, A.D. and M.R. Rosenzweg (2002). Household Dvson, Inequalty and Rural Economc. Growth, Revew of Economc Studes. 69(4): Lamb, R.L. (2003). Inverse Productvty: Land Qualty, Labor Markets, and Measurement Error. Journal of Development Economcs, 71 (1), Rawal, Vkas. (2001). Agraran Reform and Land Markets: A Study of Land Transactons n Two Vllages of West Bengal, Economc Development and Cultural Change. 49(3): Rosenzweg, M.R. (1988) Labor Markets n Low-ncome Countres. Handbook of Development Economcs, Volume I, H. Chenery and T.N. Srnvasan, eds.,elsever Scence Publshers B. V., Rosenzweg, M.R. and H.P. Bnswanger. (1993). Wealth, Weather Rsk and the Proftablty of Agrcultural Investment. Economc Journal 103(1): Sngh, G. (2006). Agrcultural Machnery Industry n Inda (Manufacturng, marketng and mechanzaton promoton), n Status of Farm Mechanzaton n Inda; Indan Agrcultural Research Insttute, March. 33
35 0.25 Fgure 1. Proporton o f Farms wth Mechanzed Farmng Equpment, by Owned Landholdngs and Survey Year Fgure 2. Fracton of Agrcultural Labor Employed n Three Labor Regmes, by Landhol dng Sze Regme 1: No hrng, famly sells labor Regme 2: Hrng labor Regme 3: Autarchy, no hrng or sellng
36 Fgure 3. Measures of Per-Acre Productvty, by Owned Landholdng Sze (2007-8) Output value P roft, lower-bo und wag e P roft, upper-bound wage P roft, zero-cost famly labor Fgure 4. Loca lly-weghted FE-IV Estma tes of the Effects of Land Owned on Profts per Acre (and one sd Confdence Bounds), by Landholdng Sze
37 Fgure 5. Estmated Reservaton Rental Rate, by Owned Landholdng Sze Fgure 6. Wthn-Vllage Relatonshp Between the Probablty of Leasng In and Leasng out Land, by Ownershp Holdngs (N=119,349) Lease In Lease Out
38 Table 1. Panel Data Estmates ( ): Effects of the Use of Hred and Famly Labor on Supervson Tme (Adjusted Mandays), by Estmaton Procedure Estmaton procedure: OLS Farmer Fxed-Effects a Farmer Fxed-Effects-IV Hred labor mandays, adjusted for sex/age.0906 (2.62).0977 (3.39).573 (2.81) Famly labor mandays, adjusted for sex/age.170 (2.96).0844 (2.41).138 (2.10) Test statstc, H 0 : supervson costs= χ 2 (1), p-value 0.89 (.345) 0.02 (.812) 3.76 (.0525) Number of observatons 3,280 3,280 3,280 Number of farmers 1,640 1,640 1,640 Klenberger-Paap underdentfcaton test statstc χ 2 (df), p-value Hansen J overdentfcaton test statstc χ 2 (df), p-value (7) 18.6,.0095 (6) 7.41,.285 Absolute value of asymptotc t-ratos n parentheses. a Specfcaton ncludes state dummy varables and whether old person n the household aged 60+. Identfyng varables nclude number of head s brothers, head s father s age, whether the head s father co-resded, the number of boys and the number of grls aged<10 and over 5, the number of boys and the number of grls aged>=10 and <15, and household sze n 1999; and total nherted land by
39 Table 2. Panel Data Estmates ( ): Effects of Own Landholdngs and Own Farm Equpment on Profts per Acre (Supervson Costs-adjusted), by Estmaton Procedure Estmaton procedure: Vllage Fxed-Effects a Farmer Fxed-Effects Farmer Fxed-Effects IV b Owned landholdngs 44.7 (4.47) 46.6 (4.62) 41.7 (4.02) 42.3 (1.53) 54.5 (1.91) 54.6 (1.91) (3.15) (2.79) (2.63) Fracton of owned landholdngs rrgated (3.64) (3.55) ( (3.10) (2.52) (2.25) Value of farm equpment (2.05) (0.16) (1.39) Number of observatons 3,967 3,967 3,967 3,967 3,967 3,967 3,524 3,524 3,524 Number of farmers 2,221 2,221 2,221 2,221 2,221 1,749 1,745 1,654 1,654 Klenberger-Paap underdentfcaton test statstc χ 2 (df), p-value (5) 11.8,.0372 (8) 19.5,.0122 (8) 15.1,.0575 Hansen J overdentfcaton test statstc χ 2 (df), p-value (4) 0.63,.960 (7) 6.76,.455 (7) 10.3,.174 Absolute value of asymptotc t-ratos n parentheses. a Specfcaton ncludes year=2008 dummy; clustered t-ratos at the household level. b Instruments nclude land nherted after 1999, assets nherted after 1999, whether the current head has brothers, the standard devaton of the schoolng of nhertance clamants, the father s age n 1999, whether the father s co-resdent n 1999, owned asset values n 1999, nherted rrgaton assets n
40 Table 3. Retrospectve Panel Data Estmates (2008): Effects of Own Landholdngs and Own Farm Equpment on Investment n Farm Equpment and Equpment Rental, by Estmaton Procedure Dependent varable Equpment Investment Equpment Hre Expendture Estmaton procedure FE-Farmer a FE-Farmer IV b FE-Farmer FE-Farmer IV b Owned landholdngs 23.4 (0.08) (2.13) (1.94) (2.55) Value of owned farm equpment (1.61) (4.49) (4.36) (1.67) Bank wthn 10 Km 3267 (3.05) (2.68) (1.67) (1.66) Number of farmers 2,570 2,570 1,822 1,822 Klenberger-Paap underdentfcaton test statstc χ 2 (df), p-value Hansen J overdentfcaton test statstc χ 2 (df), p-value (6) 17.2,.0085 (5) 4.64,.461 (6) 12.8,.0464 (5) 2.08,.838 Absolute value of asymptotc t-ratos n parentheses. a Specfcaton ncludes year=2008 dummy; clustered t-ratos at the vllage level. b Instruments nclude land nherted after 1999, assets nherted after 1999, whether the current head has brothers, the standard devaton of the schoolng of nhertance clamants, the father s age n 1999, whether the father s co-resdent n 1999, owned asset values n 1999, and the presence of a bank wthn 10 km n
41 Table 4. Wthn-Farmer/Season Plot-Level Estmates (2007-8): Effects of Plot Sze on Plot-Specfc Profts and Labor Costs and Use of Tractor Servces Profts per Acre Total Labor Costs per Acre Any Tractor Servces Used b Plot area (4.55) (4.54) (4.20) (5.49) (5.50) (5.21).303 (2.01).317 (1.93).286 (1.85) Whether plot rrgated (2.93) (2.84) (2.78) (0.17) (0.27) (0.04).962 (2.29) 1.01 (2.25) 1.01 (2.18) Formal equpment rental market n vllage*area (1.73) (2.09) (0.14) Include sol characterstcs? a N Y Y N Y Y N Y Y Number of plot observatons 16,544 16,544 16,544 16,544 16,544 16,544 16,544 16,544 16,544 Number of farmers 7,845 7,845 7,845 7,845 7,845 7,845 7,845 7,845 7,845 Absolute value of asymptotc t-ratos n parentheses clustered at the vllage level. a Sol characterstcs nclude depth, salnty, percolaton and dranage; fve sol colors (red, black, grey, yellow, brown, off-whte); fve sol types (gravel, sandy, loam, clay, and hard clay). b ML condtonal logt estmates. Table 5. Wthn-Plot Estmates Across Three Seasons (2007-8): Effects of Prevous-Perod Farm-Level Proft Shocks on Plot-Level Current Profts per Acre, by Owned Landholdng Sze Farm sze: Owned Landholdngs<4 Owned Landholdngs>=4, <10 Owned Landholdngs>=10 Farm profts per acre, all other plots, prevous season.0848 (2.10).112 (1.45) (0.62) Farm profts per acre, ths plot, prevous season (8.25) (5.01) (3.01) Fertlzer use, ths plot, prevous season (value per acre) 1.14 (2.15).777 (2.11).363 (2.72) Number of plot observatons 5,802 3,060 1,964 Number of farmers 3,595 1,967 1,234 Absolute value of asymptotc t-ratos n parentheses clustered at the farm level. Specfcatons nclude season*vllage dummy varables. 40
42 Not for Publcaton Appendx A. Labor shadow prces by regme and stage The Lagrangan ncorporatng the budget constrant, tme constrant, and non-negatvty constrants on hred and off-farm work s (A1) L uxl (,, l ) ( ag( f, e*, e*) x paf* z1 z2 1 2 f o h k z o f f f h h ( w ( l al *) p aq k *)) ( l l l al * s al * s al *) ( al * l ) h h o o l o * l * lh * c lz Frst order condtons wth respect to,,, and are, respectvely, (A2) 0 w o (A3) ag e a(1 s ) 0 e l f (A4) ( ag e w a) s a a 0 (A5) u 0 and u c (A6). lz e l h h 0 The complementary slackness condtons for the nequalty constrants are (A7) l 0 o o (A8) al * 0 h h Solvng (A1), (A2), and (A3) yelds 1 s f (A9) geel w, 1 h*( sh sf) where (A10) h * /( ) o o h We can now defne three regmes. In regme (1), so applyng (A7), and so f l 0 0 o o
43 h * 0. Thus (A11) g e (1 s ) w e l f lh 0 h 0 h * 1 1 s f w 1 s s ) In regme (2), applyng (A8), and so. Thus g e (A12). e l h f In regme (3), l h l o 0, and applyng (A2)-(A6) h* (1 u / u w)/( s s ) (A13). c lz h f
44 Appendx B The reservaton rental prce The reservaton rental prce (RRP) v s the rental prce per acre of land at whch a farmer wth a gven level of land ownershp and labor endowment would be ndfferent to a margnal expanson of operatonal holdngs. Note that gven the potental returns to scale ths need not be a global maxmum. To calculate ths rate ncorporate a land cost va nto the budget constrant n (A1): (B1) L' uxl (, ) ( ag( f, e*, e*) x va paf* z 1 2 ( w ( l al *) p aq k *)) ( l l l al * s al * s al *) o h k z o f f f h h Dfferentatng wth respect to a yelds ( al * l ) h h o o dl' ( g( f, e1*, e2*) v pf f * ( geea* wlh* pkq k*)) da ( l * s l * s l *) (B2). f f f h h l Settng to zero, solvng for v and substtutng (A2), (A3), (A4) and (A5) yelds h h * f (B3) v g( f, e1*, e2*) pf f * 1 s ( g e * w( l * l *) p q k*) f e a * h f k 1 h ( sh sf) Defne per acre profts as the maxmum, for gven h *, of 1 s f (B4) *( a) g( f, e1*, e2 *) pf f * w( * *) *. * lh lf pkq k 1 h ( s s ) h f Then (B5) * d da gee h* a
45 and (B6) d *( a) v *( a) da h * as frst-order condtons for (B1) also satsfy those assocated wth maxmzaton of (B4) wth respect to machnery, fertlzer, and labor.
46 Appendx C Techncal scale effects on per-acre profts and nputs The soluton to the cost mnmzaton problem n stage as (C1) c ( e, a) c ( a) e * * and the condtonal factor demands as, for example, (C2) l ( e, a) l ( a) e * c * Implct dfferentaton yelds c c c 2 R dl kl k 1 a wa (C3) ((2 ) ) r, da (1 ) w where 1 (1 2. Labor used n the producton of one unt of effort declnes wth area n the off-farm and hred-labor regmes as a result of the sutablty of hgh-capacty machnery on larger-scale plots ( a 0 ). The effect s strengthened n the autarchc regme f the effectve prce of labor s ncreasng n area among farmers n the autarchc regme ( w R a 0 ). Ths latter result wll obtan as long as the ncome effect assocated wth the demand for the home-produced good l z s suffcently large relatve to the substtuton effect, that there s declne n famly labor per acre as acreage expands wthn the autarchc regme. We assume subsequently that ths condton holds. The effect of an ncrease n acreage on number of machnes used per unt of work s not determned. The fact that labor costs rse wth area due to hrng-n results n ncreased machne use but snce the capacty of machnes rses wth acreage the number of machnes may ether rse or fall dependng on the elastcty of substtuton of captal for labor. If labor and machnes are suffcently good substtutes ( close to 1) then the number of machnes wll rse n the off-farm and hred-labor regmes. (C4) dk da c R k c c wa [( ll 2 2(1 )) ll ] r 1 w c a Ths result also holds both n the autarchc regme f the effectve wage s ncreasng n area. The
47 rsng labor costs n ths regme further encourage substtuton towards machnery Overall the cost per unt area s dc (C5) ( R c a R c ca c w l ) (2 ) wl a, da Ths expresson s negatve, except possbly n the autarchc regme. In the autarchc regme the effectve wage rses wth land area leadng to hgher labor costs that may fully or partally offset any benefts from ncreased machne capacty. To actually determne how much work s done and the total use of labor and machnery we now return the per-acre proft-maxmzng equaton (14), whch can now be wrtten (C6) ( a) max g( f, e, e ) p f c ( a) e * * * * * * 1 2 f The envelope condton mples (C7) * d da ce * a whch s postve except possbly when the autarchc regme prevals n one or more stages. Because proftablty per acre may declne wth acreage durng the autarchc stage due to the rse n the effectve wage and because as acreage ncreases a farm wll n general transton from offfarm to autarchy to hred labor, overall proftablty per acre may be lower n larger farms (n regme 2) than smaller farms (n regme 1). Because we assume work s complementary across stages, work per unt area wll ncrease n area de j* e j* (C8) ec c. j a da c where ec j s the elastcty of demand for work n stage j wth respect to the prce n stage and so forth. Fertlzer per unt area ncreases n area df * f * (C9) fc c a da c because fertlzer and work are assumed to be complementary.
48 The number of machnes k per unt area wll be ncreasng n area, for suffcently close to 1 because overall work ncreases and the number of machnes per unt work ncreases. In partcular, (C10) dk c * c * k de e* dk da da da Usng (C10), (C8), (C5) and (C4) t follows that whether total expendtures on machnery wll rse for 1as land sze ncreases depends on whether the prcng of machnery s suffcently elastc to capacty. Regardless, as s evdent from (16) wth a 0, machne capacty (and thus the probablty that a machne of a gven capacty s used n a gven stage), s ncreasng n area. (C11) An analogous expresson holds for labor. dl c * c * l de e* dl da da da The effect of an expanson n area on the amount of manual labor used per acre s also ambguous. Equaton (C3) shows that n regmes (1) and (2) there s a decrease n labor per unt of effort assocated wth machnery but ths s offset by an ncrease n total work (C8) and (C5). Thus f the demand for work s prce nelastc or labor and machnes are suffcently good substtutes an ncrease n area wll result n less work wthn these two regmes. In the autarchc regme there are two addtonal effects: the cost of work may rse wth area (C5) thus leadng to less overall work and the rsng effectve cost of labor wll lead to less labor per unt of effort (C3). Both effects lead to less labor per unt area as acreage ncreases. Thus f the demand for work s prce nelastc or labor and machnes are suffcently good substtutes an ncrease n area wll result n less work overall.
49 Appendx D Testng for perfect captal markets usng measured profts that gnore nterest costs The proft functon n terms of profts that do not nclude nterest costs (estmated profts) s gven by ˆ* ge ( *, f*) cae ( ) * p f* (D1), f where the nputs are determned by programmng problem (19). In ths case we have (D2) d ˆ * de* df * ( b 1)( ca ( ) pf ) c'( ae ) * da da da where ρ b > 1 and the second term n parentheses s postve. Estmated profts also ncrease wth owned landholdngs. Comparng (D2) to (20) ndcates that the gradent n estmated profts, as wth that of true profts, s steeper than would be the case n the absence of credt market effects (C7). In the case n whch there are no techncal scale economes assocated wth machnery or c'( a) 0 0 supervson costs so, (C7) would be zero but (20) would be postve f and 0 (D2) would be postve f so that work and nput use per acre expands n area. 1 ab A drect test of credt market constrants can be obtaned by examnng the returns to owned captal assets usng true or estmated profts. The margnal return to captal n terms of true profts s gven by d * dr( a, b*) b (1 r0) r( a, b*) r0 b* 0 do* db* (D3), a whle the margnal return to estmated profts s d ˆ * * * ( b 1)( ca ( ) de p df f ) do* do* do* (D4). The observed margnal returns to captal assets n the presence of credt constrants evdently 1 These condtons concde n the case n whch the nterest rate s proportonal to borrowng per acre.
50 dffer dependng on how profts are computed. However, t s easly establshed that when rab (, *) r 0, that s when borrowng costs are ndependent of land ownershp and equal to the returns on savngs, the margnal return to captal assets s zero for ether measure of profts. Ths s because varaton n owned machnery at the margn has no effects on the use of producton nputs, de* df * 0 do* do* (D5). Therefore, the fndng that there s a non-zero return, n terms of estmated profts, to owned captal assets would reject the hypothess of perfect captal markets.
51 Appendx E Farm Sze and Proft Dynamcs Addressng proft dynamcs n a forward-lookng model s complcated and thus we llustrate the basc structure usng a smplfed producton functon wth one varable nput, fertlzer, and assume that the producton functon and the cost of borrowng are quadratc n ther respectve arguments. In ths model, farmers adjust ther end-of-season savngs based on unantcpated ncome shocks and subsequently use ths savngs to fnance fertlzer purchases. We assume a statonary problem wth state varables representng sol nutrton n* and cash on hand h*. Fertlzer levels are chosen pror to the realzaton of a shock θ t. We defne the value functon recursvely as follows: vn ( *, h*) max E( g( f* n*) r( f* h*) h * vn ( *, h* )) (E1), t t t t t t t t t 1 t 1 t 1 where β s the dscount factor and h * * ( ) t 1 ht t Et t (E2), where λ denotes the extent to whch unantcpated shocks are saved. For λ = 1 unantcpated shocks are fully saved as n the permanent ncome hypothess and for λ = 0 cash on hand s just a constant. Sol nutrents depend postvely on both the prevous perod s stock of nutrents and fertlzer use and negatvely on the output shock θ t, (E3) n * * * t 1 nt ft t The dea s that more rapdly growng plants, for example, wll deplete the sol of nutrents relatvely quckly. For example, f θ t s ranfall, more nutrents are used f ranfall and sol nutrents are complements. The producton and credt functons are (E4) and g( x) g x g x rx ( ) x rx (E5), where x are the respectve arguments n (E1) and for notatonal smplcty we set the fertlzer prce to one. All of the parameters n (E4) and (E5) are postve; that s we assume that producton s characterzed by dmnshng returns but the cost of credt r ncreases at a hgher rate wth the amount of credt. Estmated profts n ths model (agan, profts that do not account for borrowng costs are):
52 (E6) ˆ * g( f * n*) f * Farmers optmally choose ther level of savngs and use of fertlzer. Gven the sol dynamcs and savngs behavor, the effect of a prevous perod shock on next-perod s profts s thus d 1* g2 g 1r2 vnn (1 )( g1 1) r2 (E7), d g r v g (1 ) r v nn 2 2 where ν nn s the second dervatve from the value functon, wth ν nn < g 2 + r 2 and g 1 < 1 for an nteror maxmum. The two key parameters n (E7) are α and λ, reflectng the nfluence of the dynamc nutrent and savngs functons. If λ = 0 so that lqudty h does not depend on unantcpated ncome shocks the lagged proft shock only nfluences profts n the next perod because of nutrent depleton. A postve shock n perod 0 n that case leads to greater nutrent depleton and therefore reduces proftablty n perod 1. Conversely, f there s no nutrent carryover so that α = 0 there s only a lqudty effect: a postve shock n perod 0 nduces hgher savngs and thus more cash on hand n the next perod so that less credt s needed for fertlzer. The lower cost of borrowng ncreases fertlzer use and thus ncrease proftablty n the current perod. Ths effect vanshes f r 2 = 0, that s, f borrowng costs do not rse as the demand for credt ncreases. nn
53

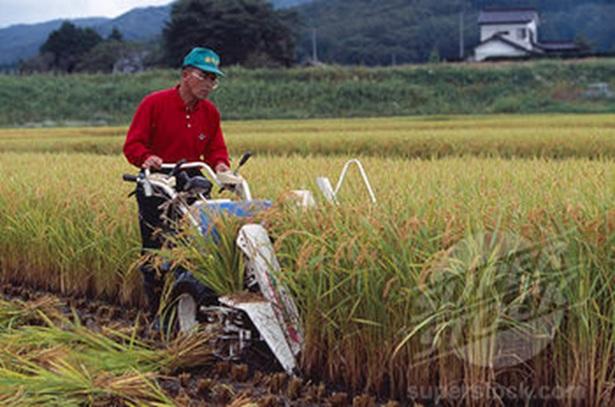
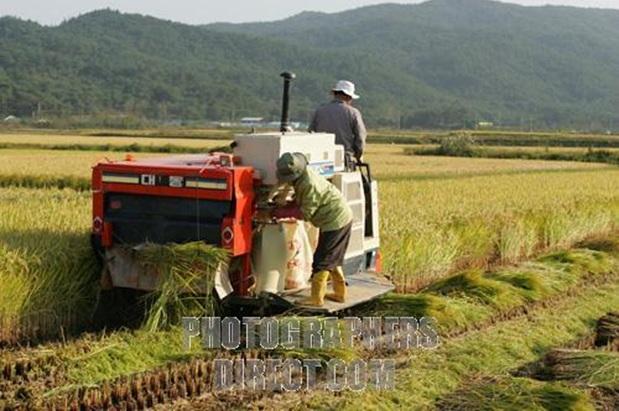
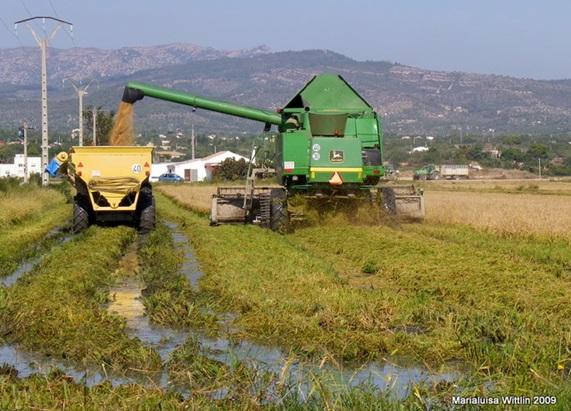
54 Fgure A2: Illustratons of rce harvestng technologes approprate for dfferent operatonal scales
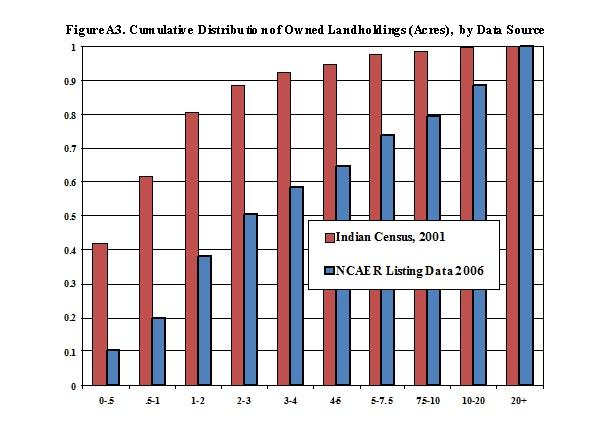
55
Appendix 6.1 The least-cost theorem and pollution control
 Appendx 6.1 The least-cost theorem and polluton control nstruments Ths appendx s structured as follows. In Part 1, we defne the notaton used and set the scene for what follows. Then n Part 2 we derve a
1 Basic concepts for quantitative policy analysis
 1 Basc concepts for quanttatve polcy analyss 1.1. Introducton The purpose of ths Chapter s the ntroducton of basc concepts of quanttatve polcy analyss. They represent the components of the framework adopted
Extended Abstract for WISE 2005: Workshop on Information Systems and Economics
 Extended Abstract for WISE 5: Workshop on Informaton Systems and Economcs How Many Bundles?:An Analyss on Customzed Bundlng of Informaton Goods wth Multple Consumer Types Wendy HUI Ph.D. Canddate Department
WISE 2004 Extended Abstract
 WISE 2004 Extended Abstract Does the Internet Complement Other Marketng Channels? Evdence from a Large Scale Feld Experment Erc Anderson Kellogg School of Management, Northwestern Unversty Erk Brynjolfsson
Biomass Energy Use, Price Changes and Imperfect Labor Market in Rural China: An Agricultural Household Model-Based Analysis.
 Bomass Energy Use, Prce Changes and Imperfect Labor Market n Rural Chna: An Agrcultural Household Model-Based Analyss by Qu Chen Junor Researcher Department of Economc and Technologcal Change Center for
Impacts of supply and demand shifts
 Impacts of supply and demand shfts 1. Impacts of Supply shft S S S S Same sze of shft D D Elastc Demand Inelastc demand 2. Impacts of Demand shft D D S D D S Same sze of shft D Elastc Supply Inelastc demand
International Trade and California Employment: Some Statistical Tests
 Internatonal Trade and Calforna Employment: Some Statstcal Tests Professor Dwght M. Jaffee Fsher Center for Real Estate and Urban Economcs Haas School of Busness Unversty of Calforna Berkeley CA 94720-1900
Volume 30, Issue 4. Who likes circus animals?
 Volume 30, Issue 4 Who lkes crcus anmals? Roberto Zanola Unversty of Eastern Pedmont Abstract Usng a sample based on 268 questonnares submtted to people attendng the Acquatco Bellucc crcus, Italy, ths
Evaluating the statistical power of goodness-of-fit tests for health and medicine survey data
 8 th World IMACS / MODSIM Congress, Carns, Australa 3-7 July 29 http://mssanz.org.au/modsm9 Evaluatng the statstcal power of goodness-of-ft tests for health and medcne survey data Steele, M.,2, N. Smart,
CONSUMER PRICE INDEX METHODOLOGY (Updated February 2018)
") CONSUMER PRCE NDEX METHODOLOGY (Updated February 208). Purpose, nature and use The purpose s to obtan country representatve data for the prces of goods and servces and to compute overall and group ndces
CONSUMER PRCE NDEX METHODOLOGY (Updated February 208). Purpose, nature and use The purpose s to obtan country representatve data for the prces of goods and servces and to compute overall and group ndces
Comparative Advantage, Information and the Allocation of. Workers to Tasks: Evidence from an Agricultural Labor Market. Andrew D. Foster.
 Comparatve Advantage, Informaton and the Allocaton of Workers to asks: Evdence from an Agrcultural Labor Market Andrew D. Foster and Mark R. Rosenzweg Unversty of Pennsylvana February 1996 he research
Do not turn over until you are told to do so by the Invigilator.
 UNIVERSITY OF EAST ANGLIA School of Economcs Man Seres PG Examnaton 016-17 FINANCIAL ECONOMETRICS ECO-7009A Tme allowed: HOURS Answer ALL FOUR questons. Queston 1 carres a weght of 5%; queston carres 0%;
Bulletin of Energy Economics.
 Bulletn of Energy Economcs http://www.tesdo.org/journaldetal.aspx?id=4 Energy Intensty and Technology Sourcng: A Study of Manufacturng Frms n Inda Santosh Kumar Sahu a,, K. Narayanan b a Madras School
Key Words: dairy; profitability; rbst; recombinant bovine Somatotropin.
 AgBoForum Volume 4, Number 2 2001 Pages 115-123 THE ESTIMATED PROFIT IMPACT OF RECOMBINANT BOVINE SOMATOTROPIN ON NEW YORK DAIRY FARMS FOR THE YEARS 1994 THROUGH 1997 Loren W. Tauer 1 Data from New York
GETTING STARTED CASH & EXPENSE PLANNING
 FINANCE TO SCALE Brex has partnered wth Hubspot for Startups to provde a fnancal plannng and expense management resource for your startup. These materals are a framework for fnancal plannng pror to scalng
GREEN PEAS. in the Columbia Basin
 FOR FURTHER NFORMATON CONTACT GRANT- ADAMS AREA EXTENSON SERVCE EPHRATA, WASHrlGTON EM 2949 JUNE 1968 COST: a RETURNS GREEN PEAS n the Columba Basn COOPERATVE EXTENSON SERVCE COLLEGE OF AGRCULTURE WASHNGTON
Labour Demand Elasticities in Manufacturing Sector in Kenya
 Internatonal Journal of Busness and Socal Scence Volume 8 Number 8 August 2017 Labour Demand Elastctes n Manufacturng Sector n Kenya Anthony Wambugu Unversty of Narob School of Economcs P.O.Box 30197-00100
A Two-Echelon Inventory Model for Single-Vender and Multi-Buyer System Through Common Replenishment Epochs
 A Two-Echelon Inventory Model for Sngle-Vender and Mult-Buyer System Through Common Replenshment Epochs Wen-Jen Chang and Chh-Hung Tsa Instructor Assocate Professor Department of Industral Engneerng and
Volume 29, Issue 2. How do firms interpret a job loss? Evidence from the National Longitudinal Survey of Youth
 Volume 29, Issue 2 How do frms nterpret a job loss? Evdence from the Natonal Longtudnal Survey of Youth Stephen M. Kosovch Stephen F. Austn State Unversty Abstract Emprcal studes n the job dsplacement
The Effect of Outsourcing on the Change of Wage Share
 Clemson Unversty TgerPrnts All Theses Theses 12-2017 The Effect of Outsourcng on the Change of Wage Share Tanq L Clemson Unversty Follow ths and addtonal works at: https://tgerprnts.clemson.edu/all_theses
emissions in the Indonesian manufacturing sector Rislima F. Sitompul and Anthony D. Owen
 Mtgaton optons for energy-related CO 2 emssons n the Indonesan manufacturng sector Rslma F. Stompul and Anthony D. Owen School of Economcs, The Unversty of New South Wales, Sydney, Australa Why mtgaton
The Allocation of Time and Goods: Three Essays on American Household Shopping Behavior
 Western Mchgan Unversty ScholarWorks at WMU Dssertatons Graduate College 12-2010 The Allocaton of Tme and Goods: Three Essays on Amercan Household Shoppng Behavor Jng Ca Western Mchgan Unversty Follow
Analyses Based on Combining Similar Information from Multiple Surveys
 Secton on Survey Research Methods JSM 009 Analyses Based on Combnng Smlar Informaton from Multple Surveys Georga Roberts, Davd Bnder Statstcs Canada, Ottawa Ontaro Canada KA 0T6 Statstcs Canada, Ottawa
Lecture 5: Applications of Consumer Theory
 Lecture 5: Applcatons of Consumer Theory Alexander Woltzky MIT 14.121 1 Applcatons of Consumer Theory Consumer theory s very elegant, but also very abstract. Ths lecture: three classc topcs that brng consumer
Problem Set 4 Outline of Answers
 Advanced Internatonal Trade Prof. A. Waldkrch EC 378 Fall 2006 Problem Set 4 Outlne of Answers 1. a) Dscuss the meanng and mportance of the eontef paradox. eontef found that US mport substtutes were more
Selected Economic Aspects of Water Quality Trading
 Selected Economc Aspects of Water Qualty Tradng Rchard N. Bosvert Gregory L. Poe Yukako Sado Cornell Unversty Passac Rver Tradng Project Kckoff Meetng Cook College, Rutgers Unversty, New Brunswck, NJ January
Why do we have inventory? Inventory Decisions. Managing Economies of Scale in the Supply Chain: Cycle Inventory. 1. Understanding Inventory.
 -- Chapter 10 -- Managng Economes of Scale n the Supply Chan: Cycle Inventory Pros: Why do we have nventory? To overcome the tme and space lags between producers and consumers To meet demand/supply uncertanty
Innovation in Portugal:
 Innovaton n Portugal: What can we learn from the CIS III? Innovaton and Productvty Pedro Moras Martns de Fara pedro.fara@dem.st.utl.pt Globelcs Academy 2005 25 May 2005 Introducton The study of the relatonshp
A Group Decision Making Method for Determining the Importance of Customer Needs Based on Customer- Oriented Approach
 Proceedngs of the 010 Internatonal Conference on Industral Engneerng and Operatons Management Dhaka, Bangladesh, January 9 10, 010 A Group Decson Makng Method for Determnng the Importance of Customer Needs
Empirical Evidence of the Distributional Effects of the CAP in the New EU Member States
 No. 58, August 2013 Pavel Caan, d'arts Kancs and Ján Pokrvčák Emprcal Evdence of the Dstrbutonal Effects of the CAP n the New EU Member States ABSTRACT Ths study nvestgates the mpact of the SAPS (Sngle
LIFE CYCLE ENVIRONMENTAL IMPACTS ASSESSMENT FOR RESIDENTIAL BUILDINGS IN CHINA
 Proceedngs: Indoor Ar 2005 LIFE CYCLE ENVIRONMENTAL IMPACTS ASSESSMENT FOR RESIDENTIAL BUILDINGS IN CHINA DJ Gu 1,*, JJ Lu 1, LJ Gu 1 1 Department of Buldng Scence, School of Archtecture, Tsnghua Unversty,
COAL DEMAND AND TRANSPORTATION IN THE OHIO RIVER BASIN:
 COAL DEMAND AND TRANSPORTATION IN THE OHIO RIVER BASIN: ESTIMATION OF A CONTINUOUS/DISCRETE DEMAND SYSTEM WITH NUMEROUS ALTERNATIVES * by Kenneth Tran and Wesley W. Wlson December 2011 Abstract Coal-fred
Department of Food Economics and Consumption Studies, University of Kiel, Germany.
 Annual World Bank Conference on Land and Poverty 2014 NON-FARM WORK, LAND TENANCY CONTRACTS AND INVESTMENT IN SOIL CONSERVATION MEASURES IN RURAL PAKISTAN RAKHSHANDA KOUSAR and AWUDU ABDULAI Department
A Longer Tail?: Estimating The Shape of Amazon s Sales Distribution Curve in Erik Brynjolfsson, Yu (Jeffrey) Hu, Michael D.
 Hu, Michael D.") A Longer Tal?: Estmatng The Shape of Amazon s Sales Dstrbuton Curve n 2008 1. Introducton Erk Brynjolfsson, Yu (Jeffrey) Hu, Mchael D. Smth The term The Long Tal was coned by Wred s Chrs Anderson (Anderson
A Longer Tal?: Estmatng The Shape of Amazon s Sales Dstrbuton Curve n 2008 1. Introducton Erk Brynjolfsson, Yu (Jeffrey) Hu, Mchael D. Smth The term The Long Tal was coned by Wred s Chrs Anderson (Anderson
The Structure and Profitability of Organic Field Corn Production
 The Structure and Proftablty of Organc Feld Corn Producton Wllam D. McBrde* Catherne Greene Lnda Foreman Selected Paper prepared for presentaton at the Agrcultural and Appled Economcs Assocaton s 2013
Access to Microfinance: Does it Matter for Profit Efficiency Among Small Scale Rice Farmers in Bangladesh?
 Access to Mcrofnance: Does t Matter for Proft Effcency Among Small Scale Rce Farmers n Bangladesh? John Sumelus Department of Economcs and Management, Faculty of Agrculture and Forestry P.O. Box 7, FIN-14
An Empirical Study about the Marketization Degree of Labor Market from the Perspective of Wage Determination Mechanism
 An Emprcal Study about the Marketzaton Degree of Labor Market from the Perspectve of Wage Determnaton Mechansm Qushuo He Shenzhen Insttute of Informaton Technology, Shenzhen 51809, Chna heqs@szt.com.cn
Do Farm Programs Explain Mean and Variance of Technical Efficiency? Stochastic Frontier Analysis
 Do Farm Programs Explan Mean and Varance of Techncal Effcency? Stochastc Fronter Analyss Rahul Ranjan Master Student Dept. of Agrbusness and Appled Economcs NDSU, Fargo, ND 58108-6050 E-mal: rahul.ranjan@ndsu.edu
Experiments with Protocols for Service Negotiation
 PROCEEDINGS OF THE WORKSHOP ON APPLICATIONS OF SOFTWARE AGENTS ISBN 978-86-7031-188-6, pp. 25-31, 2011 Experments wth Protocols for Servce Negotaton Costn Bădcă and Mhnea Scafeş Unversty of Craova, Software
A NONPARAMETRIC APPROACH TO SHORT-RUN PRODUCTION ANALYSIS IN A DYNAMIC CONTEXT. Elvira Silva *
 A NONPARAMETRIC APPROACH TO SHORT-RUN PRODUCTION ANALYSIS IN A DYNAMIC CONTEXT By Elvra Slva * ABSTRACT A nonparametrc approach to short-run producton analyss from a cost and proft perspectves s developed
Effect of Off-farm Income on Smallholder Commercialization: Panel Evidence from Rural Households in Ethiopia
 Effect of Off-farm Income on Smallholder Commercalzaton: Panel Evdence from Rural Households n Ethopa Tesfaye Berhanu Woldeyohanes 1, Thomas Heckele 1 and Yves Surry 2 1 Insttute for Food and Resource
TESTING HOUSEHOLD-SPECIFIC EXPLANATIONS FOR
 TESTING HOUSEHOLD-SPECIFIC EXPLANATIONS FOR THE INVERSE PRODUCTIVITY RELATIONSHIP JULIANO J. ASSUNÇÃO AND LUIS H. B. BRAIDO The nverse relatonshp between land productvty and farm sze s an old and puzzlng
Gender differentials in agricultural productivity: evidence from Nepalese household data
 MPRA Munch Personal RePEc Archve Gender dfferentals n agrcultural productvty: evdence from Nepalese household data Srdhar Thapa CIFREM, Faculty of Economcs, Unversty of Trento December 2008 Onlne at http://mpra.ub.un-muenchen.de/13722/
Effect of crop choice on split fertilizer application. Mira Nurmakhanova
 Effect of crop choce on splt fertlzer applcaton Mra Nurmakhanova Department of Economcs Iowa State Unversty Ames, Iowa (515) 294-5051 mra@astate.edu Selected Paper prepared for presentaton at the Amercan
MEASURING TECHNICAL EFFICIENCY OF ONION (Allium cepa L.) FARMS IN BANGLADESH M. A. BAREE 1. Abstract
 FARMS IN BANGLADESH M. A. BAREE 1. Abstract") ISSN 0258-7122 Bangladesh J. Agrl. Res. 37(1): 171-178, March 2012 MEASURING TECHNICAL EFFICIENCY OF ONION (Allum cepa L.) FARMS IN BANGLADESH M. A. BAREE 1 Abstract An attempt was made to determne the
ISSN 0258-7122 Bangladesh J. Agrl. Res. 37(1): 171-178, March 2012 MEASURING TECHNICAL EFFICIENCY OF ONION (Allum cepa L.) FARMS IN BANGLADESH M. A. BAREE 1 Abstract An attempt was made to determne the
Does irrigation have an impact on food security and poverty?
 WORKING PAPER 04 June 014 SUMMARY APRIL 010 Does rrgaton have an mpact on food securty and poverty? Evdence from Bwanje Valley Irrgaton Scheme n Malaw Rudolf Nkhata TABLE OF CONTENTS Abstract... 1 1. Introducton...
To manage leave, meeting institutional requirements and treating individual staff members fairly and consistently.
 Corporate Polces & Procedures People and Development - Document CPP216 Leave Management Frst Produced: Current Verson: Past Revsons: Revew Cycle: Apples From: 09/09/09 07/02/17 09/09/09, 26/10/12 3 years
The Impact of Agricultural Extension on Farmer Nutrient Management Behavior in Chinese Rice Production: A Household-Level Analysis
 Sustanablty 214, 6, 6644-6665; do:1.339/su616644 Artcle OPEN ACCESS sustanablty ISSN 271-15 www.mdp.com/journal/sustanablty The Impact of Agrcultural Extenson on Farmer Nutrent Management Behavor n Chnese
The efficiency of dairy farms in Austria: Do natural conditions matter?
 The effcency of dary farms n Austra: Do natural condtons matter? K. M. ORTNER, L. KIRNER and J. HAMBRUSCH Introducton Dary farmng s a partcularly mportant enterprse wthn the Austran agrcultural sector.
Econometric Methods for Estimating ENERGY STAR Impacts in the Commercial Building Sector
 Econometrc Methods for Estmatng ENERGY STAR Impacts n the Commercal Buldng Sector Marvn J. Horowtz, Demand Research Angela Coyle, U.S. Envronmental Protecton Agency ABSTRACT The early stages of developng
The Role of Price Floor in a Differentiated Product Retail Market
 Economc Analyss & Polcy, Vol. 40 No. 3, DECEMBER 2010 The Role of Prce Floor n a Dfferentated Product Retal Market Barna Bakó 1 Faculty of Economcs, Corvnus Unversty of Budapest Fovám tér 8, Budapest,
The Substitutability of Labor of Selected Ethnic Groups in the US Labor Market
 DISCUSSION PAPER SERIES IZA DP No. 1945 The Substtutablty of Labor of Selected Ethnc Groups n the US Labor Market Martn Kahanec January 2006 Forschungsnsttut zur Zukunft der Arbet Insttute for the Study
Rural Policies and Poverty in Tanzania: an Agricultural Household Model-Based Assessment
 Caher de recherche/workng Paper 12-29 Rural Polces and Poverty n Tanzana: an Agrcultural Household Model-Based Assessment Luca Tbert MarcoTbert Août/August 2012 Verson révsée/revsed : Novembre/November
Development and production of an Aggregated SPPI. Final Technical Implementation Report
 Development and producton of an Aggregated SPP Fnal Techncal mplementaton Report Marcus Frdén, Ulf Johansson, Thomas Olsson Servces Producer Prce ndces, Prce Statstcs Unt, Statstcs Sweden 2010 ntroducton
NBER WORKING PAPER SERIES UNMASKING THE POLLUTION HAVEN EFFECT. Arik Levinson M. Scott Taylor. Working Paper
 NBER WORKING PAPER SERIES UNMASKING THE POLLUTION HAVEN EFFECT Ark Levnson M. Scott Taylor Workng Paper 10629 http://www.nber.org/papers/w10629 NATIONAL BUREAU OF ECONOMIC RESEARCH 1050 Massachusetts Avenue
INTERNATIONAL JOURNAL OF APPLIED ENGINEERING RESEARCH, DINDIGUL Volume 1, No 4, 2011
 Copyrght 00 All rghts reserved Integrated Publshng Assocaton Econometrc modelng and senstvty analyss of costs of nputs for sunflower producton n Iran S. H. Mousav Avval, S. Rafee, A. Jafar, A. Mohammad
An Evaluation of Alternative Cash, Share, and Flexible Leasing Arrangements for South. Carolina Grain Farms * Todd D. Davis **
 An Evaluaton of Alternatve Cash, Share, and Flexble Leasng Arrangements for South Carolna Gran Farms * Todd D. Davs ** Abstract A smulaton model ncorporatng stochastc yelds, prces, and government payments
The Spatial Equilibrium Monopoly Models of the Steamcoal Market
 Advances n Management & Appled Economcs, vol.2, no.3, 2012, 125-132 ISSN: 1792-7544 (prnt verson), 1792-7552 (onlne) Scenpress Ltd, 2012 The Spatal Equlbrum Monopoly Models of the Steamcoal Maret Hu Wen
MULTIPLE FACILITY LOCATION ANALYSIS PROBLEM WITH WEIGHTED EUCLIDEAN DISTANCE. Dileep R. Sule and Anuj A. Davalbhakta Louisiana Tech University
 MULTIPLE FACILITY LOCATION ANALYSIS PROBLEM WITH WEIGHTED EUCLIDEAN DISTANCE Dleep R. Sule and Anuj A. Davalbhakta Lousana Tech Unversty ABSTRACT Ths paper presents a new graphcal technque for cluster
Policy Options for Improving Market Participation and Sales of Smallholder Livestock Producers: A case study of Ethiopia
 Polcy Optons for Improvng Market Partcpaton and Sales of Smallholder Lvestock Producers: A case study of Ethopa Smeon Ehu 1, Samuel Benn 2 and Zelekawork Paulos 3 Abstract Market access plays an essental
Economic Efficiency of Smallholder Sweet Potato Producers in Delta State, Nigeria: a Case Study of Ughelli South Local Government Area
 Research Journal of Agrculture and Bologcal Scences, 7(): 163-168, 011 ISSN 1816-1561 Ths s a refereed journal and all artcles are professonally screened and revewed 163 ORIGINAL ARTICLES Economc Effcency
EFFICIENCY ANALYSIS OF BORO RICE PRODUCTION IN NORTH-CENTRAL REGION OF BANGLADESH ABSTRACT
 Nargs and Lee The Journal of Anmal & Plant Scences, 23(2): 2013, Page: J. Anm. 527-533 Plant Sc. 23(2):2013 ISSN: 1018-7081 EFFICIENCY ANALYSIS OF BORO RICE PRODUCTION IN NORTH-CENTRAL REGION OF BANGLADESH
Relative income and the WTP for public goods
 CERE Workng Paper, 2014:6 Relatve ncome and the WTP for publc goods - A case study of forest conservaton n Sweden Thomas Broberg Centre for Envronmental and Resource Economcs, Umeå Unversty, Sweden The
TRANSPORTATION DEMANDS IN THE COLUMBIA-SNAKE RIVER BASIN
 The Navgaton Economc Technologes Program March 1, 2006 navgaton economcs technologes TRANSPORTATION DEMANDS IN THE COLUMBIA-SNAKE RIVER BASIN US Army Corps of Engneers IWR Report 06-NETS-R-03 March 1,
Competitive Assessment of an Oligopolistic Market Open to International Trade with Incomplete Data. Marc Ivaldi Toulouse School of Economics
 Compettve Assessment of an Olgopolstc Market Open to Internatonal Trade wth Incomplete Data Marc Ivald Toulouse School of Economcs Chantal Latgé-Roucolle Ecole Natonale de l Avaton Cvle, Toulouse Marsh
MAXIMUM LIKELIHOOD ESTIMATES OF STOCHASTIC COST FRONTIER FUNCTION: AN APPLICATION TO THE MAIZE FARMING AND HYPOTHESIS TESTING
 Volume 4, No., December 07 Journal of Global Research n Mathematcal Archves UGC Approved Journal RESEARCH PAPER Avalable onlne at http://www.jgrma.nfo MAXIMUM LIKELIHOOD ESTIMATES OF STOCHASTIC COST FRONTIER
Testing for separability in household models with heterogeneous behavior: A mixture model approach
 Testng for separablty n household models wth heterogeneous behavor: A mxture model approach by Renos Vaks 1, Elsabeth Sadoulet 2, Alan de Janvry 2, and Carlo Cafero 3 August 2004 Abstract Knowng whether
Supplier selection and evaluation using multicriteria decision analysis
 Suppler selecton and evaluaton usng multcrtera decson analyss Stratos Kartsonaks 1, Evangelos Grgorouds 2, Mchals Neofytou 3 1 School of Producton Engneerng and Management, Techncal Unversty of Crete,
Identifying Factors that Affect the Downtime of a Production Process
 Identfyng Factors that Affect the Downtme of a Producton Process W. Nallaperuma 1 *, U. Ekanayake 1, Ruwan Punch-Manage 2 1 Department of Physcal scences, Rajarata Unversty, Sr Lanka 2 Department of Statstcs
NON-WORK AT WORK, UNEMPLOYMENT AND LABOR PRODUCTIVITY
 Frst Verson: February 205 Ths Verson: October 206 NON-WORK AT WORK, UNEMPLOYMENT AND LABOR PRODUCTIVITY Mchael C. Burda, Kate R. Genadek and Danel S. Hamermesh* Abstract: We use the Amercan Tme Use Survey
Returns to fertilizer use: does it pay enough? Some new evidence from Sub Saharan Africa
 TSE 669 July 2016 Returns to fertlzer use: does t pay enough? Some new evdence from Sub Saharan Afrca Estelle Koussoubé and Célne Nauges Returns to fertlzer use: does t pay enough? Some new evdence from
ANALYSIS OF FACTORS AFFECTING TECHNICAL INEFFICIENCY OF SMALLHOLDER FARMERS IN NIGERIA: STOCHASTIC FRONTIER APPROACH
 Internatonal Journal of Economcs, Commerce and Research (IJECR) ISSN 2250-0006 Vol. 3, Issue 1, Mar 2013, 21-28 TJPRC Pvt. Ltd. ANALYSIS OF FACTORS AFFECTING TECHNICAL INEFFICIENCY OF SMALLHOLDER FARMERS
The monopoly market. Telecommunications in Portugal. Managerial Economics MBACatólica
 Fernando Branco 2006-2007 Fall uarter Sesson 5 Part I The monopoly market A sngle company supples an output, over whch t has relevant market power: The relevant market; Dmenson of the company. Market power:
Analysis of the adoption of irrigation technologies under uncertain water availability. María Jesús Escribano 1 Javier Calatrava-Leyva 2
 Analyss of the adopton of rrgaton technologes under uncertan water avalablty María Jesús Escrbano 1 Javer Calatrava-Leyva 2 1 Departamento de Economía y Socología Agrara, IFAPA, Grana (Span). E-mal: maraj.escrbano.ext@juntadeanluca.es
Economic Efficiency and Factors Explaining Differences. Between Minnesota Farm Households
 Economc Effcency and Factors Explanng Dfferences Between Mnnesota Farm Households Kent Olson and Lnh Vu Professor and Graduate Student Appled Economcs, Unversty of Mnnesota kdolson@umn.edu vuxx0090@umn.edu
International Trade and California s Economy: Summary of the Data
 Internatonal Trade and Calforna s Economy: Summary of the Data by Professor Dwght M. Jaffee Fsher Center for Real Estate and Urban Economcs Haas School of Busness Unversty of Calforna Berkeley CA 94720-1900
A DUOPOLY MODEL OF FIXED COST CHOICE. Charles E. Hegji*
 004 DUOPOY MODE O IXED OST HOIE harles E Hegj* INTRODUTION omparson of frms n ournot and Stackelberg eulbrum s a subject that has receved much attenton unversally mposed assumpton n most dscussons of the
Economic incentives and the quality of domestic waste: counterproductive effects through waste leakage 1
 Economc ncentves and the qualty of domestc waste: counterproductve effects through waste leakage 1 H. Bartelngs 2, R. B. Dellnk and E.C. van Ierland, Envronmental Economcs and Natural Resources Group,
Optimal Issuing Policies for Substitutable Fresh Agricultural Products under Equal Ordering Policy
 06 Internatonal Academc Conference on Human Socety and Culture (HSC 06) ISBN: 978--60595-38-6 Optmal Issung Polces for Substtutable Fresh Agrcultural Products under Eual Orderng Polcy Qao- TENG,a, and
Demand for U.S. Lamb and Mutton by Country of Origin: A Two-Stage Differential Approach
 Demand for U.S. Lamb and Mutton by Country of Orgn: A Two-Stage Dfferental Approach Kethly G. Jones*, Wllam F. Hahn* and Chrstopher G. Davs* The authors are economsts wth the Anmal Products Branch, Markets
Development trajectory of energy consumption and carbon emissions in developing countries
 Ar Polluton XIV 667 Development trajectory of energy consumpton and carbon emssons n developng countres A. Dela Cruz Generosa & T. Fujta Graduate School of Economcs, Kyushu Unversty, Japan Abstract Ths
INITIAL CAPITAL CONSTRAINTS HINDER ENTREPRENEURIAL VENTURE PERFORMANCE: AN EMPIRICAL ANALYSIS
 INITIAL CAPITAL CONSTRAINTS HINDER ENTREPRENEURIAL VENTURE PERFORMANCE: AN EMPIRICAL ANALYSIS MIRJAM VAN PRAAG CESIFO WORKING PAPER NO. 887 CATEGORY 4: LABOUR MARKETS MARCH 2003 PRESENTED AT CESIFO CONFERENCE
Matching and Sorting in a Global Economy
 Matchng and Sortng n a Global Economy Gene M. Grossman Prnceton Unversty Elhanan Helpman Harvard Unversty and CIFAR Phlpp Krcher Unversty of Ednburgh September 203 Abstract We develop a neoclasscal trade
Reallocation, Firm Turnover, and Efficiency: Selection on Productivity or Profitability?
 Very prelmnary and ncomplete Please do not cte wthout permsson Reallocaton, Frm Turnover, and Effcency: Selecton on Productvty or Proftablty? Luca Foster Bureau of the Census Luca.S.Foster@census.gov John
The Effects of Rural Infrastructure Development on Agricultural. Production Technical Efficiency: Evidence from the Data of Second
 The Effects of Rural Infrastructure Development on Agrcultural Producton Techncal Effcency: Evdence from the Data of Second Natonal Agrcultural Census of Chna Zongzhang L 1, 2 and Xaomn Lu 1 1. School
Consumption capability analysis for Micro-blog users based on data mining
 Consumpton capablty analyss for Mcro-blog users based on data mnng ABSTRACT Yue Sun Bejng Unversty of Posts and Telecommuncaton Bejng, Chna Emal: sunmoon5723@gmal.com Data mnng s an effectve method of
Market Dynamics and Productivity in Japanese Retail Industry in the late 1990s
 Market Dynamcs and Productvty n Japanese Retal Industry n the late 1990s Toshyuk Matsuura, Research Insttute of Economy, Trade and Industry Kazuyuk Motohash, Unversty of Tokyo & Research Insttute of Economy,
Social Science Research 31 (2002)
") Socal Scence Research 31 (2002) 511 538 Socal Scence RESEARCH www.academcpress.com Racal dfferences n the effects of job contacts: Conflctng evdence from cross-sectonal and longtudnal data Ted Mouw Department
Socal Scence Research 31 (2002) 511 538 Socal Scence RESEARCH www.academcpress.com Racal dfferences n the effects of job contacts: Conflctng evdence from cross-sectonal and longtudnal data Ted Mouw Department
The Labor Market Impacts of. Adult Education and Training in Canada
 The Labor Market Impacts of Adult Educaton and Tranng n Canada Shek-wa Hu Department of Economcs Unversty of Western Ontaro shu@uwo.ca Jeffrey Smth Department of Economcs Unversty of Maryland smth@econ.umd.edu
Stay Out of My Forum! Evaluating Firm Involvement in Online Ratings Communities Neveen Awad and Hila Etzion
 Stay Out of My Forum! Evaluatng Frm Involvement n Onlne Ratngs Communtes Neveen Awad and Hla Etzon. INTRODUCTION A growng number of onlne retalers are enablng and encouragng consumers to post revews of
A SIMULATION STUDY OF QUALITY INDEX IN MACHINE-COMPONF~T GROUPING
 A SMULATON STUDY OF QUALTY NDEX N MACHNE-COMPONF~T GROUPNG By Hamd Sefoddn Assocate Professor ndustral and Manufacturng Engneerng Department Unversty of Wsconsn-Mlwaukee Manocher Djassem Assstant Professor
Munich Personal RePEc Archive
 MPRA Munch Personal RePEc Archve The Impact of Access to Credt on the Adopton of hybrd maze n Malaw: An Emprcal test of an Agrcultural Household Model under credt market falure Frankln Smtowe and Manfred
Technical Efficiency of Maize Farmers in Ogbomoso Agricultural Zone of Oyo State
 Internatonal Journal of Agrcultural Economcs & Rural Development - 1 (): 008 Techncal Effcency of Maze Farmers n Ogbomoso Agrcultural Zone of Oyo State Adedapo, K. D Department of Agrcultural Economcs
Do Remittances Alter Labor Market Participation? A Study of Albania
 MPRA Munch Personal RePEc Archve Do Remttances Alter Labor Market Partcpaton? A Study of Albana Ermra Hoxha Kalaj Unversty of Trento 2009 Onlne at http://mpra.ub.un-muenchen.de/48271/ MPRA Paper No. 48271,
IMPACT OF INSTITUTIONAL CREDIT ON PRODUCTION EFFICIENCY OF FARMING SECTOR A Case Study of District Faisalabad
 149 Pakstan Economc and Socal Revew Volume 49, No. 2 (Wnter 2011), pp. 149-162 IMPACT OF INSTITUTIONAL CREDIT ON PRODUCTION EFFICIENCY OF FARMING SECTOR A Case Study of Dstrct Fasalabad SAIMA AYAZ and
Varunraj Valsaraj, Kara Kockelman, Jennifer Duthie, and Brenda Zhou University of Texas at Austin. Original Version: September 2007.
 FORECASTING EMPLOYMENT & POPULATION IN TEXAS: An Investgaton on TELUM Requrements Assumptons and Results ncludng a Study of Zone Sze Effects for the Austn and Waco Regons Varunraj Valsaraj Kara Kockelman
Perception Biases and Land Use Decisions
 Percepton Bases and Land Use Decsons Hongl Feng a Tong Wang b Davd A. Hennessy c a Assocate Professor, Dept. of Agrcultural, Food & Resource Economcs, Mchgan State Unversty Contact: hennes65@msu.edu b
Discussion Papers No. 258, August 1999 Statistics Norway, Research Department
 Dscusson Papers No. 258, August 1999 Statstcs Norway, Research Department Lars Lndholt Beyond yoto: 2 permt prces and the markets for fossl fuels Abstract: Ths paper analyses the markets for fossl fuels
Field Burning of Crop Residues
 SMED Report No 62 2004 Feld Burnng of Crop Resdues Heléne Wkström, Rolf Adolfsson, Statstcs Sweden 2004-06-30 Commssoned by the Swedsh Envronmental Protecton Agency Publshed at: www.smed.se Publsher: Swedsh
Documento de Trabajo No. 01/00 Marzo Wage Differentials Between the Formal and the Informal Sector in Urban Bolivia.
 Documento de Trabajo No. 01/00 Marzo 2000 Wage Dfferentals Between the Formal and the Informal Sector n Urban Bolva por Trne Monsted Wage Dfferentals Between the Formal and the Informal Sector n Urban