Nitrate Load Reduction Strategies for the Raccoon and Des Moines Rivers. Keith Schilling, Calvin Wolter Iowa DNR Geological and Water Survey
|
|
|
- Cameron Dalton
- 6 years ago
- Views:
Transcription
1 Nitrate Load Reduction Strategies for the Raccoon and Des Moines Rivers Keith Schilling, Calvin Wolter Iowa DNR Geological and Water Survey
2 Outline of Presentation Background of nitrate impairments Nitrate reductions required by TMDL SWAT modeling scheme Nitrate reduction strategies evaluated for: i) Raccoon River and ii) Des Moines River Concluding remarks Acknowledgements: Phil Gassman and Manoj Jha, CARD, Iowa State; Allen Bonini, Watershed Improvement Section, Iowa DNR


 of 1 mg/l. Drinking water or Gulf of Mexico hypoxia.")
3 Raccoon and DSM rivers as a drinking water source Des Moines Water Works is a public water supply serving Des Moines metropolitan area of 4, people DMWW source water includes surface water collected directly from the Raccoon and Des Moines Rivers Water sources are designated as Class C as a raw water source of potable water supply so drinking water standards are applicable The applicable water quality standard for nitrate for Class C designated use is the USEPA maximum contaminant level (MCL) of 1 mg/l. Drinking water or Gulf of Mexico hypoxia.still nitrate

4 Impaired segments
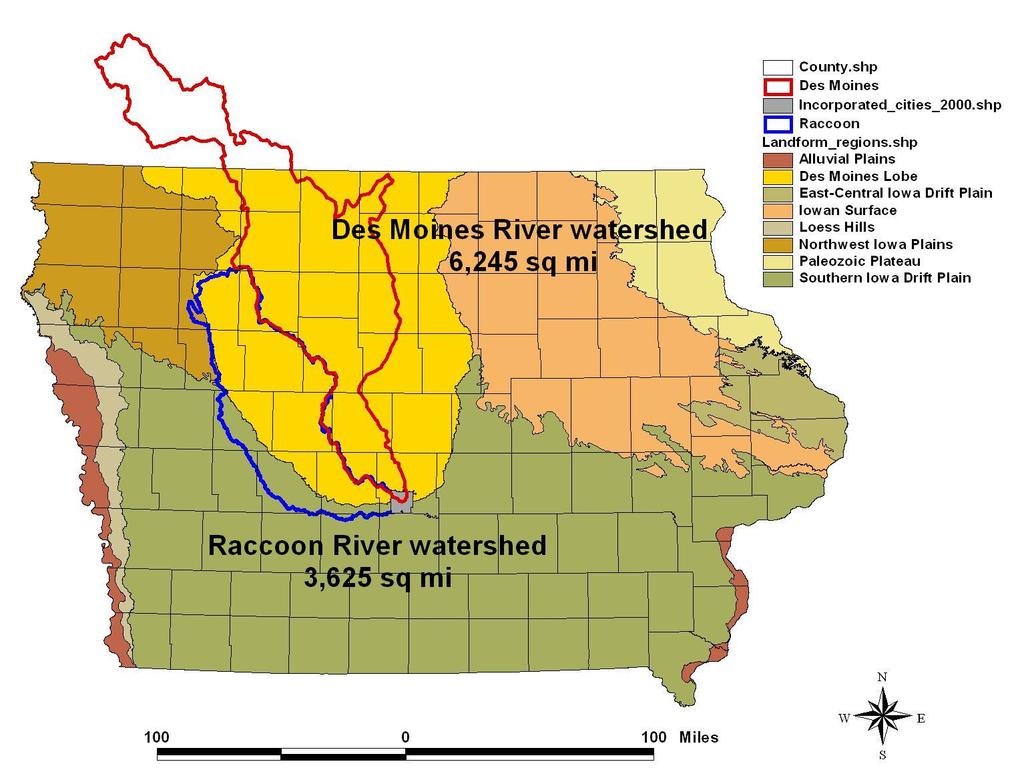
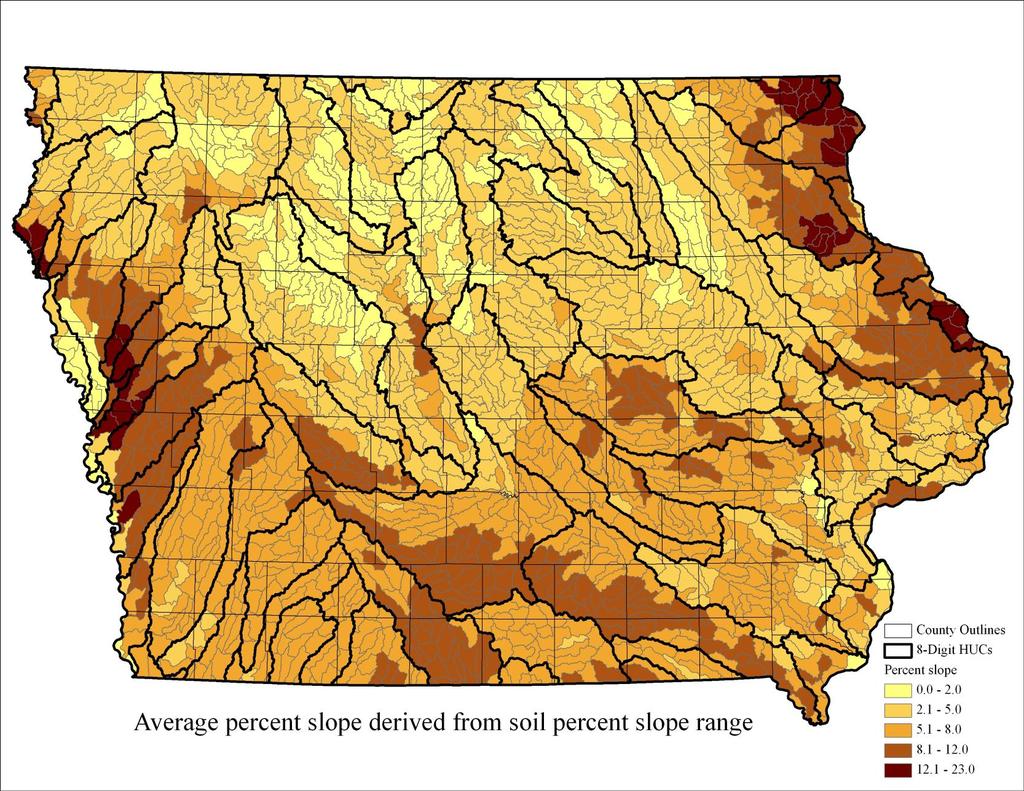
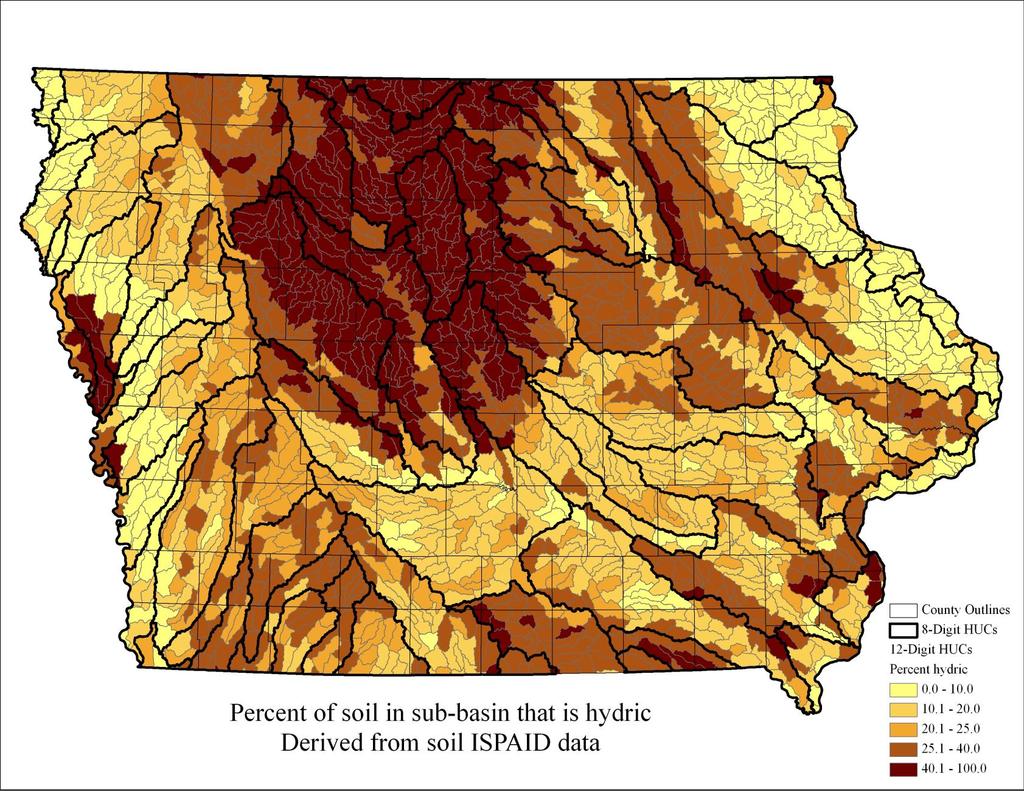
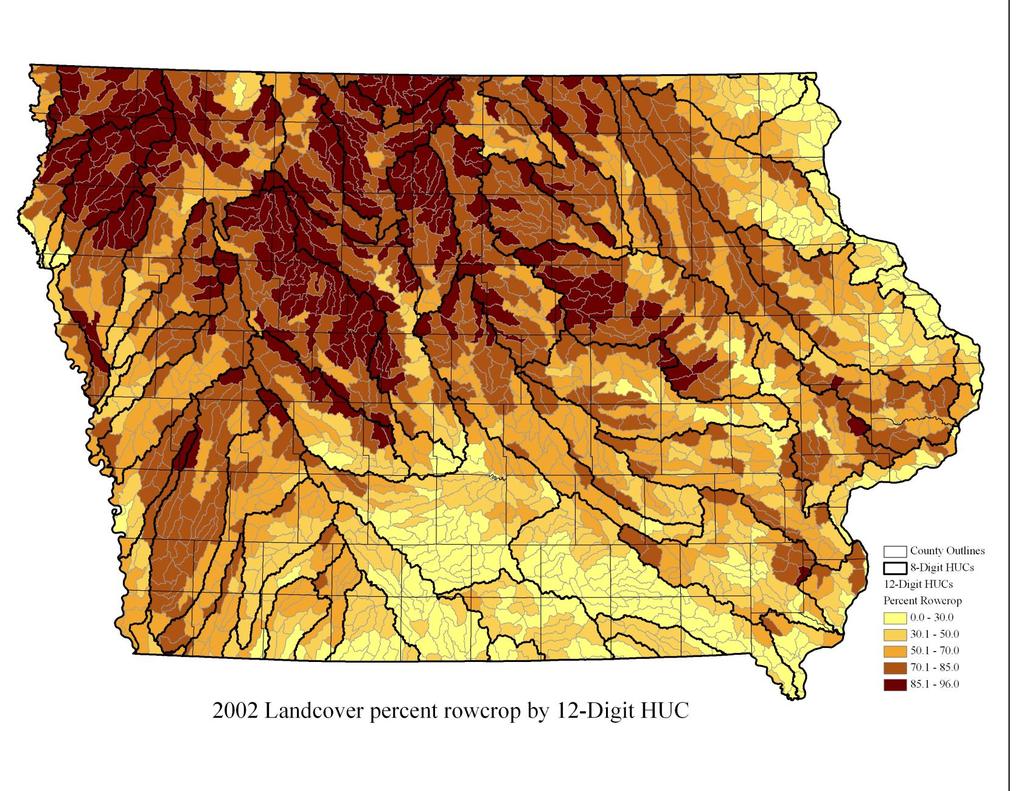
5 Watershed Characteristics
6 Nitrate impairment Raccoon River Flow Max. 4Load Maximum % of Days Mean Max. Mean Mean Point Range Flow 1 in Exceedance Reduction Needing Reduction Nitrate mg/l NPS Source Range Factor 1 Needed Reduction Needed Load Contrib. Contrib. (cfs) 3 (%) 2 (%) 2 (Mg) 1mg/l (%) 3 (%) Measured 97.8 N load Concentrations 1.8 > 1 mg/l 1.4 = 24% Daily N load (Mg/day) Discharge (cfs) Nitrate Concentration (mg/l) 1- (all data) Multiplication factor to assess degree of nitrate load exceedance (i.e., existing load in 1-9 range exceeds TMDL by factor of 1.93). 2 Reductions determined for only those days with an exceedance. 3 5 Nitrate source contributions determined for only those days with an exceedance Flow percentile
7 Nitrate impairment Des Moines River Flow Range (%) Daily N load (Mg/day) 1 Minimum Flow 15 in Range (cfs) 1 Discharge (cfs) % 77.6% 98.8% 1.2% % 57.8% 97.9% 2.1% % 27.6% 96.2% 3.8% % 18.5% 94.% 6.% % 5.7% 91.1% 8.9% Concentrations 115 > 1 mg/l 29.2% = 16.4% 4.6% 86.3% 13.7% %.9% 83.9% 16.1% All data % 19.3% 97.1% 2.9% 2 Nitrate Concentration (mg/l) Maximum Flow in Range (cfs) Maximum Mean NPS Mean Point Reduction Measured % of Days N load Load Source Load Needed Target Needing load with Contribution MOS (9.5 mg/l) Contribution (%) Reduction (%) (%) Flow percentile Calander Year
8 SWAT Modeling System Input Description Source of Data Physically based and continuous watershed scale hydrology 3-m and digital water elevation quality model 22 Developed 15-m landcover to predict grid impacts of land management practices on watershed hydrology and water quality 12-digit Hydrologic Unit Code boundaries HRUs represent percentages of subwatersheds with common soil, land use and management characteristics Daily Subbasins climate established at HUC12 level phtml Soil survey Animal feeding operations Census data
9 112 subbasins 364 HRUs 173 subbasins 2516 HRUs


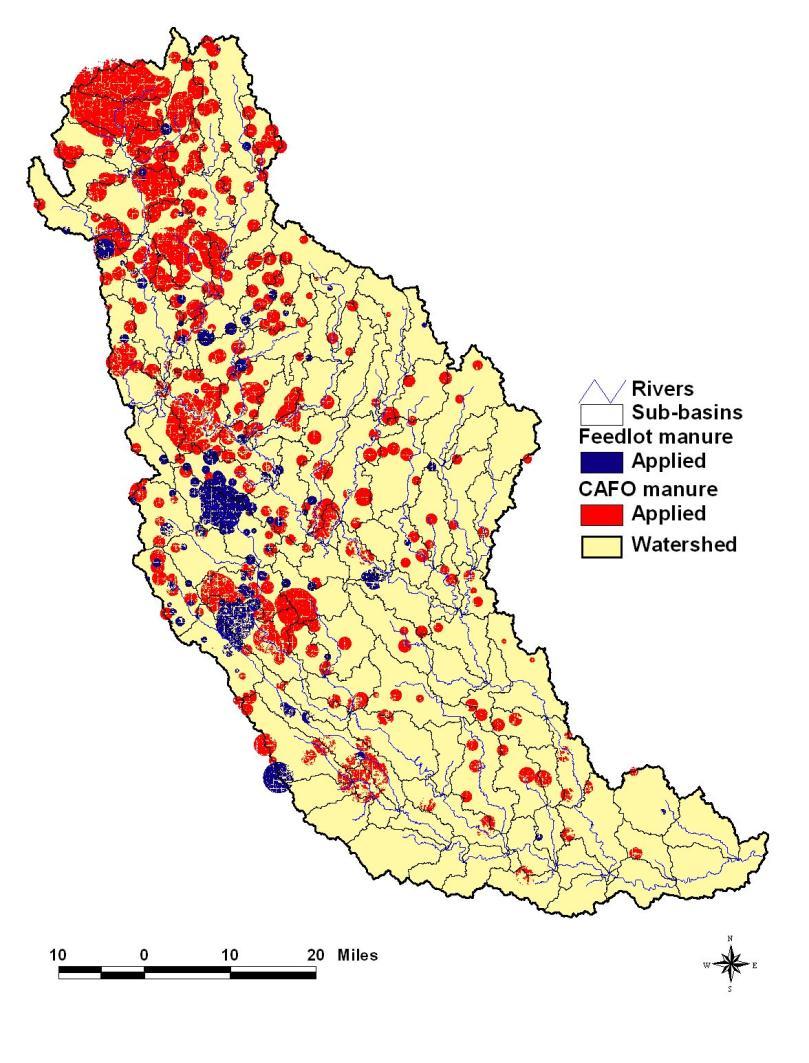
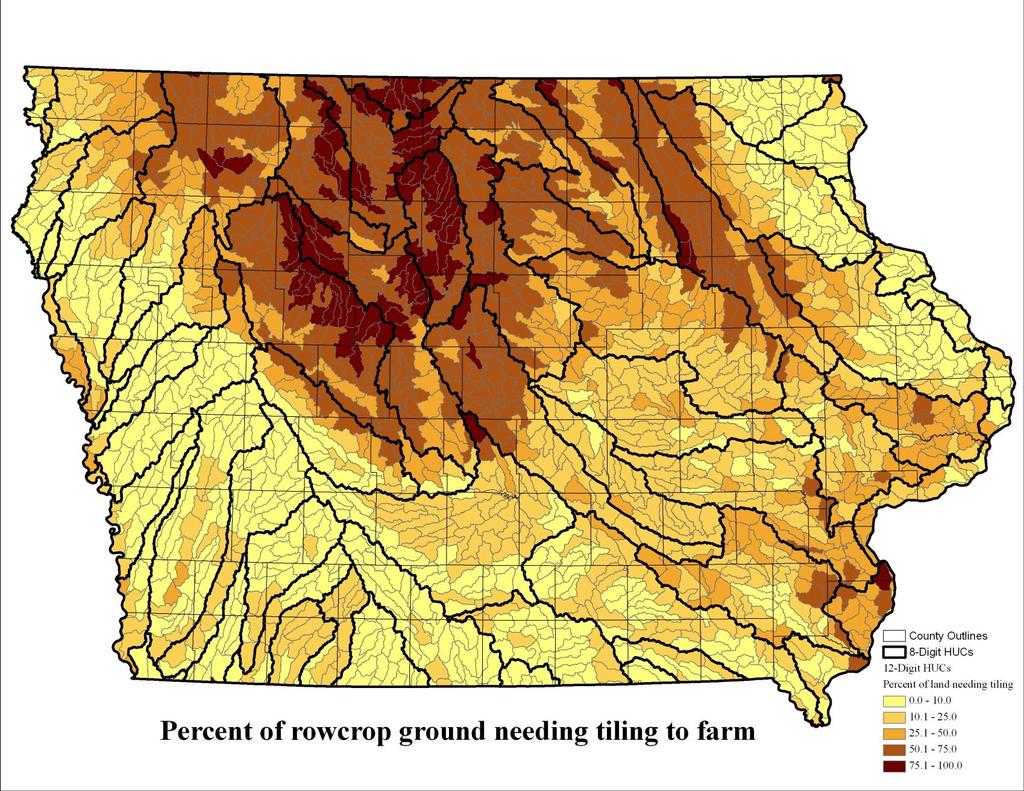
10 Tile Manure Drainage Sources
11 Model Calibration - Flow Annual Streamflow (in) Raccoon River Measured Simulated Annual Discharge (mm) Des Moines River Measured Simulated Monthly Streamflow (in) Measured Simulated Monthly Discharge (mm) Measured Simulated Year Month and Year Calibration statistics r 2 =.84, E =.83 (month) r 2 =.8, E =.79
12 Model Calibration Nitrate Annual NO 3 -N Load (kg/ha) Monthly NO3-N Load (kg/ha) Measured Simulated Monthly Nitrate Load (Mg) Nitrate Load (Mg) Year Measured Simulated Measured Simulated Month and Year Calibration statistics r 2 =.53, E =.48 (month) r 2 =.77, E =.74

13 Nonpoint Nitrate Loading Patterns Des Moines River nitrate loads: 8 subbasins > 2 kg/ha Max = 28.6 kg/ha Average = 17.5 kg/ha Raccoon River nitrate loads: 11 HUC12 subbasins >3 kg/ha Average = 25.1 kg/ha
14 Nitrate Load Reduction Strategies for the Raccoon River Reduce the rate of ammonia fertilizer application in the watershed to 15 kg/ha, 1 kg/ha and 5 kg/ha Remove all cattle from the streams. Remove all human waste from the watershed. Land use change. 1. Convert all row crop lands located on slopes greater than B slopes to CRP grassland. 2. Convert all row crop lands located on floodplain alluvial soils to CRP.
15 Reduction in Nitrate Loads from Baseline Condition (%) Nitrate Load Reductions from baseline condition Annual Annual Percent 1 Nitrate Nitrate 16 Change Scenario Load Load from (Mg) (tons) Baseline Baseline 2 condition 17,43 19,173 14% Reduce fertilizer from 17 to 15 kg/ha (152 to ,436 18,8-5.7% lbs/ac) 3 12 Reduce fertilizer from 17 to 1 kg/ha (152 to 89 14,118 15,53-19.% lbs/ac) Reduction (%) = -.24x Reduce 4fertilizer from 17 to 5 kg/ha (152 to 45 12,218 13, % lbs/ac) r 2 = No cattle 5 in streams 17,325 19,58 -.6% No human waste 15,722 17, % kg/ha Annual Nitrate Load (Mg) lbs/ac Fertilizer Application Rate
16 Targeted land use change Two options: 1. Convert crop ground on HEL to CRP 2. Convert crop ground on floodplains to CRP Two scales: 1. Entire Raccoon River basin 2. South Raccoon River basin Scenario Annual Nitrate Load (Mg) Annual Nitrate Load (tons) Percent Change from Baseline Baseline condition 17,43 19,173 % Convert crop ground on C slopes or greater to CRP 15,878 17, % Convert crop ground on alluvial soils to CRP 16,837 18, % Land use change % N reduction Land area Ratio HEL to CRP Floodplain to CRP
17 South Raccoon Land Use Change Baseline Convert Row Crop on HEL to CRP Convert Row Crop on Alluvial Soils to CRP Watershed area (km 2 ) Row Crop ground (km 2 ) % of watershed in Row Crop 63.% 4.3% 55.5% Row Crop ground converted (km 2 ) % of Row Crop converted 36.1% 11.9% % of watershed converted 22.7% 7.5% NO3 load (kg) 2,954, 2,13, 2,489, NO3 loss (kg/watershed ha) NO3 loss (kg/rc ha) NO3 load reduction (kg) 851, 465 % NO3 load reduction 28.8% 15.7% Converting alluvial soils from row crop to CRP results in nearly 1.7 times more nitrate load reduction than converting row crop on HEL to CRP
18 Beyond the TMDL, more Raccoon River scenarios Additional scenarios evaluated by Jha, Wolter, Schilling and Gassman, TMDL analysis with SWAT modeling for the Raccoon River watershed, Iowa, 28 SWAT model calibrated and scenarios evaluated at Van Meter gage Global land use and management changes assessed 16 scenarios evaluated within five general categories, including converting CRP to continuous corn (ethanol scenario)
19 Scenario 1 (convert grasslands to continuous corn) 2 (convert croplands to grasslands) Description Average annual nitrate load (Metric Tons) Percent change from baseline - Baseline condition 23,51 - CRP to continuous corn 24, all grasslands (CRP, hay and pasture) to continuous corn 26, percent of row crops to CRP 18, percent of row crops to CRP 13, percent of row crops to CRP 8, all of row crops to CRP 3, (decrease nitrogen fertilizer N fertilizer application rate 1 kg/ha 15, application) N fertilizer application rate 5 kg/ha 12, N fertilizer application rate 15 kg/ha 2, (remove point sources) cattle from the streams 23, human waste (septic and WWTPs) 21, pastured cattle (no grazing) 23, (remove livestock) Cattle from feedlots 22, CAFOs 18, all livestock 17,
20 Nitrate Load Reduction Strategies for the Des Moines River Three global-scale nitrate load reduction scenarios were evaluated: 1. Reduce the rate of ammonia fertilizer application in the watershed to 1 kg/ha and 5 kg/ha (89 and 45 lbs/ac, respectively). 2. Remove all manure generated from permitted or registered CAFOs and feedlots. 3. Remove all human waste from the watershed.
21 Global-scale changes Baseline Condition (17 kg/ha, manure, humans) 1 kg/ha Ammonia Fertilizer 5 kg/ha Ammonia Fertilizer No manure No human waste Total kg NO 3 -N Load 28,95, 21,66, 17,95, 26,85, 27,55, Reduction (kg NO 3 -N) 7,29, 11,, 2,1, 1,4, Percent Reduction (%) 25.2% 38.% 7.3% 4.8% Ammonia in Fert kg/ha Ammonia N reduction Percent Reduction (%) 37.96% 65.8% 7.81% NO 3 in Fert (kg/ha) Organic N in Fert (kg/ha) Total N in Fert (kg/ha) Reduced N in Fert (%) 29.5% 5.6% 12.1% Reduction Ratio 85.3% 75.1% 59.8%
22 Nitrate Load Reduction Strategies for the Des Moines River Four strategies for targeting load reductions in the basin: 1. Target major nitrate load reductions in all subbasins with annual average losses greater than 15 kg/ha (55 subbasins out of 173). 2. Target major nitrate load reductions in all subbasins of the Boone River watershed. 3. Target major nitrate load reductions in subbasins located closest to the DMWW intake at 2nd Avenue. 4. Target major nitrate load reductions in subbasins located furthest away from the DMWW intake at 2nd Avenue (Minnesota subbasins).

23 Minnesota basins 55 basins > 15 kg/ha Boone River basin Lower DSM basins
24 Nitrate Reductions from Targeting Baseline (17 kg/ha, manure, humans) Top 55 subbasins reduced to 5kg/ha Boone River watershed reduced to 5 kg/ha Minnesota subbasins reduced to 5 kg/ha Lower DSM subbasins reduced to 5 kg/ha Total NO 3 -N Load (kg) 28,95, 24,88, 27,37, 27,2, 27,39, Reduction (kg NO 3 -N) 4,7, 1,58, 1,75, 1,56, Percent Reduction (%) 14.6% 5.46% 6.4% 5.39% Ammonia in Fert kg/ha Ammonia N reduction Percent Reduction (%) 2.76% 9.54% 9.81% 7.29% NO 3 in Fert (kg/ha) Organic N in Fert (kg/ha) Total N in Fert (kg/ha) Reduction in Fert. N (%) 16.14% 7.42% 7.63% 5.67% Reduction ratio based on N applications 87.12% 73.56% 79.27% 95.1% Area of watershed affected (ac) 4,3,35 1,22,258 58,27 611, ,811 Percentage of DSM River watershed 3.28% 14.4% 15.18% 13.74% Reduction ratio based on land area 46.43% 37.92% 39.79% 39.23%
25 Concluding remarks 1. TMDL calls for nitrate reduction of 48% in Raccoon River and 34% in Des Moines River can this be achieved? 2. SWAT model useful for evaluating global load reduction scenarios and variations on targeting 3. In both Raccoon and DSM basins, nitrate is primarily a nonpoint source issue (point sources <1% with generous assumptions) 4. Raccoon River basin, modeling suggests major land use change or major fertilizer reductions needed to achieve reductions 5. Are floodplains targets of conservation opportunity? 6. Future land cover change to more corn will increase nitrate loads and make TMDL compliance more difficult 7. In the DSM River basin, model results suggest global scale reductions in fertilizer application (everyone pitching in) achieved greater nitrate load reduction than targeting. (Reducing to 1 kg/ha by everyone was better than 55 subbasins reducing to 5 kg/ha) 8. If targeting is preferred, reducing fertilizer applications was most efficient near the watershed outlet
Cost-effective Allocation of Conservation Practices using Genetic Algorithm with SWAT
 Cost-effective Allocation of Conservation Practices using Genetic Algorithm with SWAT Manoj Jha Sergey Rabotyagov Philip W. Gassman Hongli Feng Todd Campbell Iowa State University, Ames, Iowa, USA Raccoon
Philip W. Gassman, CARD, Iowa State University, Ames, IA, USA
 Implications of Different Nutrient Load Estimation Techniques for Testing SWAT: An Example Assessment for the Boone River Watershed in North Central Iowa Philip W. Gassman, CARD, Iowa State University,
Evaluation of Alternative Cropping and Nutrient Management Systems with Soil and Water Assessment Tool for the Raccoon River Watershed Master Plan
 American Journal of Environmental Sciences Original Research Paper Evaluation of Alternative Cropping and Nutrient Management Systems with Soil and Water Assessment Tool for the Raccoon River Watershed
Assessment of Scenarios for the Boone River Watershed in North Central Iowa
 Assessment of Scenarios for the Boone River Watershed in North Central Iowa Philip W. Gassman, Adriana Valcu, Catherine L. Kling & Yiannis Panagopoulos CARD, Iowa State University, Ames, IA, USA Cibin
Local Water Quality and Watersheds. Raccoon River & Des Moines River Watersheds. Hypoxia in the Gulf of Mexico: Implications and Strategies for Iowa
 Local Water Quality and Watersheds Raccoon River & Des Moines River Watersheds Hypoxia in the Gulf of Mexico: Implications and Strategies for Iowa October 16, 2008 Ames, Iowa Chris Jones and Roger Wolf
Linking Biophysical and Economic Models for Environmental Policy Analysis
 Linking Biophysical and Economic Models for Environmental Policy Analysis Catherine L. Kling Iowa State University March, 2011 Michigan State University This talk draws heavily from the work of Sergey
MODELING PHOSPHORUS LOADING TO THE CANNONSVILLE RESERVOIR USING SWAT
 MODELING PHOSPHORUS LOADING TO THE CANNONSVILLE RESERVOIR USING SWAT Bryan Tolson 1 & Christine Shoemaker 2 1. PhD Student, 2. Professor School of Civil & Environmental Engineering Cornell University PWT
Strategies for nitrate reduction: The Cedar River Case Study
 2010 Integrated Crop Management Conference - Iowa State University 195 Strategies for nitrate : The Cedar River Case Study Matthew J. Helmers, associate professor, Agricultural and Biosystems Engineering,
Rapid National Model Assessments to Support US Conservation Policy Planning Mike White
 Rapid National Model Assessments to Support US Conservation Policy Planning Mike White USDA-ARS Grassland, Soil and Water Research Laboratory, Temple, TX 1 Topics Current National Assessments Future National
Modeling the Impacts of Agricultural Conservation Strategies on Water Quality in the Des Moines Watershed
 Modeling the Impacts of Agricultural Conservation Strategies on Water Quality in the Des Moines Watershed Presenter: Jeff Arnold, Supervisory Research Engineer, USDA-ARS C. Santhi, M. White, M. Di Luzio
Multi-Objective Optimization Tool for the Selection and Placement of BMPs for Pesticide (Atrazine) Control
 Control") Multi-Objective Optimization Tool for the Selection and Placement of BMPs for Pesticide (Atrazine) Control Chetan, M., Chaubey, I. Purdue University, IN Arabi, M. Colorado State University, CO ASABE AIM
Multi-Objective Optimization Tool for the Selection and Placement of BMPs for Pesticide (Atrazine) Control Chetan, M., Chaubey, I. Purdue University, IN Arabi, M. Colorado State University, CO ASABE AIM
Walnut Creek Watershed Management Authority. Project Kick Off March 18, 2015
 Walnut Creek Watershed Management Authority Project Kick Off March 18, 2015 Agenda Schedule & Meeting Purpose Meeting Purpose TMDL Raccoon River TMDL Impaired by Nitrate and E.coli Includes Walnut Creek
Development of a tool to estimate Best Management Practices (BMP) efficiency using SWAT
 efficiency using SWAT") 5 th International SWAT Conference Development of a tool to estimate Best Management Practices (BMP) efficiency using SWAT Maringanti C., I. Chaubey, B. Engel Purdue University, West Lafayette, IN M. Arabi
5 th International SWAT Conference Development of a tool to estimate Best Management Practices (BMP) efficiency using SWAT Maringanti C., I. Chaubey, B. Engel Purdue University, West Lafayette, IN M. Arabi
Environmental Concerns in Midwest Agricultural Landscapes. Roberta Parry US EPA Office of Water June 25, 2014
 Environmental Concerns in Midwest Agricultural Landscapes Roberta Parry US EPA Office of Water June 25, 2014 Water Quality Nutrients Local Regional Key Concerns Agricultural Drainage Human Health Wildlife
SWAT Modeling of Critical Source Area for Runoff and Phosphorus Losses. Lake Champlain Basin, VT
 SWAT Modeling of Critical Source Area for Runoff and Phosphorus Losses Lake Champlain Basin, VT Lula Ghebremichael Mary Watzin Tamie Veith 2009 5th International SWAT Conference August 5-7, Boulder, Colorado.
Watershed Modeling of Haw River Basin using SWAT for Hydrology, Water Quality and Climate Change Study
 Watershed Modeling of Haw River Basin using SWAT for Hydrology, Water Quality and Climate Change Study Somsubhra Chattopadhyay, Graduate Student Manoj K. Jha, Assistant Professor Civil Engineering Department
Modeling Sediment and Nutrient Loads Input to Chesapeake Bay and Effects of Agricultural Conservation Practices on Water Quality
 Modeling Sediment and Nutrient Loads Input to Chesapeake Bay and Effects of Agricultural Conservation Practices on Water Quality C. Santhi and CEAP National Assessment Team Texas A&M University System,
Memorandum. wq-ws4-13g. Cindy Potz (Yellow Medicine River Watershed District) and Mike Weckwerth (MPCA) Date: March 11, 2015
 and Mike Weckwerth (MPCA) Date: March 11, 2015") 413 Wacouta Street Suite 435 Saint Paul, MN 55101 Memorandum To: Cindy Potz (Yellow Medicine River Watershed District) and Mike Weckwerth (MPCA) Date: March 11, 2015 From: Andrea Plevan Subject: Watershed
413 Wacouta Street Suite 435 Saint Paul, MN 55101 Memorandum To: Cindy Potz (Yellow Medicine River Watershed District) and Mike Weckwerth (MPCA) Date: March 11, 2015 From: Andrea Plevan Subject: Watershed
Little River Watershed Conservation Practice Assessment with SWAT. D.D. Bosch, J. Cho, G. Vellidis, R. Lowrance, T. Strickland
 Little River Watershed Conservation Practice Assessment with SWAT D.D. Bosch, J. Cho, G. Vellidis, R. Lowrance, T. Strickland Outline Background Impacts of riparian forest buffer (RFB) Allocating Best
TMDL Data Requirements for Agricultural Watersheds
 This is not a peer-reviewed article. Pp. 408-415 in Total Maximum Daily Load (TMDL) Environmental Regulations: Proceedings of the March 11-13, 2002 Conference, (Fort Worth, Texas, USA) Publication Date
Impacts of Climate Change on Nitrogen Load and its Control in the Upper Huai River Basin, China
 Impacts of Climate Change on Nitrogen Load and its Control in the Upper Huai River Basin, China Xiaoying Yang xiaoying@fudan.edu.cn Department of Environmental Science & Engineering, Fudan University,
Headwaters Cedar Creek Watershed Plan
 Headwaters Cedar Creek Watershed Plan A roadmap for sustained agricultural productivity and improved water quality in the Headwaters Cedar Creek Watershed Prepared by: December Headwaters Cedar Creek Watershed
Hydrologic and Water Quality of Climate Change in the Ohio-Tennessee River Basin
 Hydrologic and Water Quality of Climate Change in the Ohio-Tennessee River Basin Yiannis Panagopoulos, Philip W. Gassman, Todd Campbell, Adriana Valcu & Catherine L. Kling Center for Agricultural and Rural
Nitrogen (N) affects in-state and downstream waters in three primary ways:
 affects in-state and downstream waters in three primary ways:") G. Conclusions Concerns with nitrogen in waters Nitrogen (N) affects in-state and downstream waters in three primary ways: 1. Aquatic life toxicity - Aquatic life have been found to be adversely affected
G. Conclusions Concerns with nitrogen in waters Nitrogen (N) affects in-state and downstream waters in three primary ways: 1. Aquatic life toxicity - Aquatic life have been found to be adversely affected
Assessing Regional Water Impacts of Biofuel Production Scenarios
 Assessing Regional Water Impacts of Biofuel Production Scenarios May Wu, Yonas Demissie, Eugene Yan Argonne National Laboratory GWPC Annual Forum Water and Energy Sustainability Sept. 26-29, 2010 Pittsburgh,
Water Quality Impacts of Agricultural BMPs in a Suburban Watershed in New Jersey
 Water Quality Impacts of Agricultural BMPs in a Suburban Watershed in New Jersey Zeyuan Qiu Lizhong Wang Department of Chemistry and Environmental Science New Jersey Institute of Technology Newark, NJ
Understanding Agriculture And Clean Water
 1 IOWA CHAPTER Understanding Agriculture And Clean Water Clean Water Act Established in 1972, the Clean Water Act (CWA) created the basic structure for regulating discharges of pollutants into water bodies
Presented by: Andrew Craig DNR Nonpoint Source Planning Coordinator Nov 2016 National NPS Conference Boston, MA
 Presented by: Andrew Craig DNR Nonpoint Source Planning Coordinator Nov 2016 National NPS Conference Boston, MA Nonpoint source pollution continues to be the leading source of water quality impairments
Illinois Nutrient Loss Reduction Strategy: What is it? How does it impact me?
 Illinois Nutrient Loss Reduction Strategy: What is it? How does it impact me? Lauren Lurkins Director of Natural and Environmental Resources Illinois Farm Bureau WHY IS THE STRATEGY NEEDED? Gulf Hypoxia
Ag Drainage Design Protocols and Current Technology
 Department of Agricultural and Biosystems Engineering Ag Drainage Design Protocols and Current Technology Matthew Helmers Dean s Professor, College of Ag. & Life Sciences Associate Professor, Dept. of
WDNR - Using Snap-Plus to Quantify Phosphorus Trading Credits ( )
") WDNR - Using Snap-Plus to Quantify Phosphorus Trading Credits (10-23-) Purpose The purpose of this document is to provide technical assistance for using the P Trade report in SnapPlus to quantify Phosphorus
WDNR - Using Snap-Plus to Quantify Phosphorus Trading Credits (10-23-) Purpose The purpose of this document is to provide technical assistance for using the P Trade report in SnapPlus to quantify Phosphorus
Pat Conrad, Joe Pallardy, Kristine Maurer Water Quality Monitoring Summary Report
 technical memo Project Name 2017 Water Quality Monitoring Date 4/9/2018 To / Contact info From / Contact info Regarding Kayla Bergman: Squaw Creek WMA Pat Conrad, Joe Pallardy, Kristine Maurer 2017 Water
Joint Research Centre (JRC)
") Joint Research Centre (JRC) Marco Pastori and Faycal Bouraoui IES - Institute for Environment and Sustainability Ispra - Italy http://ies.jrc.ec.europa.eu/ http://www.jrc.ec.europa.eu/ CONTENT Introduction
Joint Research Centre (JRC) Marco Pastori and Faycal Bouraoui IES - Institute for Environment and Sustainability Ispra - Italy http://ies.jrc.ec.europa.eu/ http://www.jrc.ec.europa.eu/ CONTENT Introduction
Swan Lake Branch Watershed Plan
 Swan Lake Branch Watershed Plan A roadmap for sustained agriculutral production, improved water quality and upstream-downstream partnerships FEBRUARY 20, 2018 Authored by: Iowa Soybean Association Environmental
Iowa Walnut Creek Section 319 National Monitoring Program Project
 Iowa Walnut Creek Section 319 National Monitoring Program Project Figure 17: Walnut Creek (Section 319) Project Location 12 Figure 18: Water Quality Monitoring Stations for Walnut Creek (Iowa) 12 PROJECT
Evaluating the Reduction Effect of Nonpoint Source Pollution Loads from Upland Crop Areas by Rice Straw Covering Using SWAT
 SESSION J2 : Water Resources Applications - I New Delhi, India 2012 International SWAT Conference Evaluating the Reduction Effect of Nonpoint Source Pollution Loads from Upland Crop Areas by Rice Straw
Development of Sediment and Nutrient Export Coefficients for US Ecoregions.
 Development of Sediment and Nutrient Export Coefficients for US Ecoregions. Mike White USDA/ARS Temple Texas 1 What are Export Coefficients? History Predates models Date to 1970 s Eutrophication linked
Modeling the Middle and Lower Cape Fear River using the Soil and Water Assessment Tool Sam Sarkar Civil Engineer
 Modeling the Middle and Lower Cape Fear River using the Soil and Water Assessment Tool Sam Sarkar Civil Engineer Outline Problem statement and project objectives Watershed model development Model calibration
Nia R. Hurst, 1 John R. White and 2 Joseph Baustian
 1 Nia R. Hurst, 1 John R. White and 2 Joseph Baustian 1 Department of Oceanography and Coastal Sciences, Louisiana State University 2 The Nature Conservancy Nitrogen Fertilization Application of fertilizer
A Presentation of the 2012 Drainage Research Forum. November 20, 2012 Farmamerica, Waseca MN
 A Presentation of the 2012 Drainage Research Forum November 20, 2012 Farmamerica, Waseca MN 1 Evaluating water quality and quantity outcomes of switching from row crops to perennial biomass crops in a
Sector Load Growth Demonstration Technical Memorandum
 Sector Load Growth Demonstration Technical Memorandum VERSION 1.0 Point Source Load Sectors: MS4s, Construction, CAFOs, Municipal and Industrial WWTP, CSOs and Air Deposition and Emissions Subject to Federal
IIHR s Continuous Monitoring Network and Water Quality Information System. Chris Jones University of Iowa-IIHR
 IIHR s Continuous Monitoring Network and Water Quality Information System Chris Jones University of Iowa-IIHR Unit of the College of Engineering Director: Larry Weber 90 Graduate Students from 16 countries
Evaluating the Least Cost Selection of Agricultural Management Practices in the Fort Cobb Watershed
 Evaluating the Least Cost Selection of Agricultural Management Practices in the Fort Cobb Watershed Solmaz Rasoulzadeh*, Arthur Stoecker Daniel E. Storm *PhD student, Biosystems and Agricultural Engineering
What Does the Illinois Nutrient Loss Reduction Strategy Mean for Water Quality in Illinois?
 What Does the Illinois Nutrient Loss Reduction Strategy Mean for Water Quality in Illinois? Mark B. David University of Illinois at Urbana-Champaign ISTC, December 3, 2015 11-08-12 Illinois NLRS USEPA
2015 May ARKANSAS WATER RESOURCES CENTER PUBLICATION MSC373 FUNDED BY ARKANSAS NATURAL RESOURCES COMMISSION PROJECT
 FUNDED BY ARKANSAS NATURAL RESOURCES COMMISSION PROJECT 11-600 CONSTITUENT LOAD ESTIMATION IN THE LOWER OUACHITA SMACKOVER WATERSHED 2015 May Constituent Load Estimation in the Lower Ouachita Smackover
Assessment of large-scale bioenergy cropping scenarios for the Upper Mississippi and Ohio-Tennessee River Basins
 SWAT Bioenergy Applications for the U.S. Corn Belt region: Assessment of large-scale bioenergy cropping scenarios for the Upper Mississippi and Ohio-Tennessee River Basins Dr. Yiannis Panagopoulos, Researcher
An Environmental Accounting System to Track Nonpoint Source Phosphorus Pollution in the Lake Champlain Basin. Year 2 Project Work Plan
 An Environmental Accounting System to Track Nonpoint Source Phosphorus Pollution in the Lake Champlain Basin Mary Watzin and Lula Ghebremichael University of Vermont, Rubenstein School of Environment and
Statewide Results (Final Target)
") Statewide Results (Final Target) Nutrient Trading in Maryland 2017 National Watershed and Stormwater Conference April 4, 2016 Jason Keppler Watershed Implementation Program Nitrogen Sector 2009 2025 Allocation
Statewide Results (Final Target) Nutrient Trading in Maryland 2017 National Watershed and Stormwater Conference April 4, 2016 Jason Keppler Watershed Implementation Program Nitrogen Sector 2009 2025 Allocation
Overview of Nitrogen Management and Groundwater: Considerations for manure irrigation
 Overview of Nitrogen Management and Groundwater: Considerations for manure irrigation Kevin Masarik Center for Watershed Science and Education Through the University of Wisconsin-Extension, all Wisconsin
Modeling Sediment and Nutrient Loads Input to Great Lakes and Effects of Agricultural Conservation Practices on Water Quality
 Modeling Sediment and Nutrient Loads Input to Great Lakes and Effects of Agricultural Conservation Practices on Water Quality C. Santhi and CEAP National Assessment Team Texas A&M University System, Temple,
New Practices for Nutrient Reduction: STRIPs and Saturated Buffers. Matthew Helmers and Tom Isenhart Iowa State University
 New Practices for Nutrient Reduction: STRIPs and Saturated Buffers Matthew Helmers and Tom Isenhart Iowa State University Situation Increasing concern for local and regional waters Substantial demand for
Lake of the Pines. Watershed TMDL. Depressed DO conditions in 3,700 acres of upper reservoir; declining
 Lake O O the Pines Watershed TMDL Presented at: 15 th National NPS Monitoring Workshop August 27, 2007 Vernon D. Rowe, P.E. Pilgrim s Pride Corporation Corporate Environmental Manager Lake of the Pines
Long Prairie River Watershed Restoration and Protection Strategies (WRAPS) Report Summary
 Report Summary") Long Prairie River Watershed Restoration and Protection Strategies (WRAPS) Report Summary Minnesota has adopted a watershed approach to address the state s 80 major watersheds (denoted by 8-digit hydrologic
Long Prairie River Watershed Restoration and Protection Strategies (WRAPS) Report Summary Minnesota has adopted a watershed approach to address the state s 80 major watersheds (denoted by 8-digit hydrologic
Protocol for Calibration of River Basins using SWAT
 Improving Life through Science and Technology. Protocol for Calibration of River Basins using SWAT N.Kannan Co authors: M. White, C. Santhi, X. Wang, J.G. Arnold, and M. Di Luzio The Context Insufficient
Historical Water Quality Data Analysis, Pearson Creek, Springfield, Missouri
 The Ozarks Environmental and Water Resources Institute (OEWRI) Missouri State University (MSU) Historical Water Quality Data Analysis, Pearson Creek, Springfield, Missouri Prepared by: Marc R. Owen, M.S.,
HYPOXIA ACTION PLAN: WHAT CAN MIDWEST AGRICULTURE DO? Dennis McKenna Illinois Department of Agriculture
 HYPOXIA ACTION PLAN: WHAT CAN MIDWEST AGRICULTURE DO? Dennis McKenna Illinois Department of Agriculture The hypoxic zone is an area in the northern Gulf of Mexico where dissolved oxygen concentrations
Mapping Groundwater Recharge Rates Under Multiple Future Climate Scenarios in Southwest Michigan
 http://mi.water.usgs.gov/reports/images/cover_med01_4227.jpg Mapping Groundwater Recharge Rates Under Multiple Future Climate Scenarios in Southwest Michigan Glenn O Neil Institute of Water Research Michigan
Florida s Nitrate + Nitrite Criterion for Springs A Methodology for Predicting What it Would Take to Achieve it at an Impaired Spring
 Florida s Nitrate + Nitrite Criterion for Springs A Methodology for Predicting What it Would Take to Achieve it at an Impaired Spring Gregg Jones P.G. Water Resources Technical Director Brandon N. Ashby
Application of improved SWAT model for bioenergy production scenarios in Indiana Watersheds
 Application of improved SWAT model for bioenergy production scenarios in Indiana Watersheds Dr. Indrajeet Chaubey Co-authors: Drs. Cibin Raj, Jane Frankenberger, Jeffrey Volenec, Slyvie Brouder, Philip
Continuous records for the Chariton River indicate that 2004 was an average water year, with total flow approximately equal to the average annual
 2004 Rathbun Report Iowa State University Limnology Laboratory John A. Downing, Ph.D. George Antoniou, Assistant Scientist For Rathbun Land and Water Alliance August 31, 2005 A. Tributaries Personnel of
Water Quality Performance of Wetlands Receiving NPS Loads
 Water Quality Performance of Wetlands Receiving NPS Loads Nitrate Removal Efficiency and Load Reductions Using Targeted Wetland Restorations in the Upper Mississippi River Basin William G. Crumpton, Iowa
Comprehensive Watershed Modeling for 12- digit HUC Priority Watersheds Phase II
 Comprehensive Watershed Modeling for 12- digit HUC Priority Watersheds Phase II PRESENTED BY: NARESH PAI PI: Dharmendra Saraswat Collaborator: Mike Daniels OBJECTIVE Project Objective Prioritize 12-digit
Integrating Agricultural Land Management into a Watershed Response Model
 Integrating Agricultural Land Management into a Watershed Response Model Adam Freihoefer, Tom Beneke, & Aaron Ruesch Wisconsin Department of Natural Resources NCASI Northern Region Meeting May 6, 2014
Wabash River Watershed Water Quality Trading Feasibility Study. Final Report
 Wabash River Watershed Water Quality Trading Feasibility Study Final Report September 2011 Prepared for U.S. Environmental Protection Agency Targeted Watershed Grant WS-00E71501-0 Prepared by Conservation
Using Cover Crops to Reduce Leaching. Losses of Nitrate
 Using Cover Crops to Reduce Leaching USDA-ARS National Laboratory for Agriculture and the Environment Ames, Iowa Tom Kaspar, Ben Knutson, Keith Kohler, Kent Heikens, Dan Jaynes, Tim Parkin, Tom Moorman,
Bob Broz University of Missouri Extension
 Bob Broz University of Missouri Extension brozr@missouri.edu 573-882-0085 What is the purpose on the nutrient reduction committee? Reduce nutrient loading into the Mississippi River and into the Gulf of
WELCOME TO THE JUNE EDITION OF THE 2015 M&R SEMINAR SERIES
 WELCOME TO THE JUNE EDITION OF THE 2015 M&R SEMINAR SERIES PLEASE SILENCE CELL PHONES OR SMART PHONES QUESTION AND ANSWER SESSION WILL FOLLOW PRESENTATION PLEASE FILL EVALUATION FORM SEMINAR SLIDES WILL
The University of Minnesota Water Resources Center: My Vision, My Experience
 The University of Minnesota Water Resources Center: My Vision, My Experience Mark B. David University of Illinois at Urbana-Champaign November 20, 2014 What I will cover vision for a water resources center
Modeling the Effects of Agricultural Conservation Practices on Water Quality in the Pacific Northwest Basin
 Modeling the Effects of Agricultural Conservation Practices on Water Quality in the Pacific Northwest Basin Presenter: R. Srinivasan, Professor, Texas A&M C. Santhi and CEAP National Assessment Team Texas
Metal Fate and Transport Simulation Using SWAT in the Tri-State Mining District
 Metal Fate and Transport Simulation Using SWAT in the Tri-State Mining District Mehran Niazi, PhD Joseph Schubauer-Berigan, PhD Presenter: Douglas Grosse USEPA Office of Research & Development, National
Wisconsin Wastewater Operators Association. Protecting Our Water Resources: The Future Bill Hafs - NEW Water 10/2014
 Wisconsin Wastewater Operators Association Protecting Our Water Resources: The Future Bill Hafs - NEW Water 10/2014 The Fox River Contributes 1/3 of All Nutrients to Lake Michigan APRIL 15, 2011 Photo
MEETING MINUTES. MPO Staff Present: Teva Dawson, Senior Transportation Planner
 MEETING MINUTES Walnut Creek Watershed Management Authority *************************** 8:00 10:00 a.m., Wednesday, March 18, 2015 West Des Moines City Hall Training Room *************************** WMA
Monitoring agricultural subwatersheds containing conservation practices in the Black Hawk Lake watershed
 Agricultural and Biosystems Engineering Monitoring agricultural subwatersheds containing conservation practices in the Black Hawk Lake watershed Leigh Ann Long, M.S. Research Associate lalong@iastate.edu
Evaluation of Conservation Policies for Reducing Nitrogen Loads. to the Mississippi River and Gulf of Mexico. Katsuya Tanaka 1. and.
 Evaluation of Conservation Policies for Reducing Nitrogen Loads to the Mississippi River and Gulf of Mexico by Katsuya Tanaka 1 and JunJie Wu 2 1 Graduate School for International Development and Cooperation,
Agriculture & Water Quality Shifting Perceptions & Shifting Policies
 Agriculture & Water Quality Shifting Perceptions & Shifting Policies Associate Martha Noble Senior Policy National Sustainable Agriculture Coalition Founded 1988 National coalition of 84 grassroots family
Regional Watershed Planning. Calumet Summit 2010: A Call to Connect Calumet Conference Center April 27, 2010
 Regional Watershed Planning Calumet Summit 2010: A Call to Connect Calumet Conference Center April 27, 2010 Basins The Calumet Region Watershed Communities Land Cover- 2006 Impervious Cover 303d Listed
Gathering Data to Assess Your Watershed
 Gathering Data to Assess Your Watershed Nikki Dictson Texas Water Resources Institute Presentation Goals: What data do you need? Where do you find the data? How do you get info from TCEQ and other agencies?
Pennsylvania Pequea and Mill Creek Watershed Section 319 National Monitoring Program Project
 Pennsylvania Pequea and Mill Creek Watershed Section 319 National Monitoring Program Project Figure 36: Pequea and Mill Creek (Pennsylvania) Watershed Project Location 231 T-1 C-1 T1-3 T-4 C1-2 T2-3 T-2
Monitoring site - Indian Creek
 Indian Creek Watershed Management Plan GIS and EPA Bacteria Indicator Tool (BIT) February 17, 2009 2009 Indiana GIS Conference Bloomington Monroe County Convention Center Stacey Jarboe, Stantec t Consulting
Understanding Water-Human interaction through an Intelligent Digital Watershed: Initial development and Implementation
 Understanding Water-Human interaction through an Intelligent Digital Watershed: Initial development and Implementation Presented by: Sudipta K. Mishra The Group: Sudipta K. Mishra, Umashanker Rapolu, Deng
Model SWAT as an integrated management tool in water catchment Švihov
 Model SWAT as an integrated management tool in water catchment Švihov Ing. Jan Gregar Email: gregarj@fzp.czu.cz Faculty of Environmental Sciences Czech University of Life Sciences, Prague Content Project
Nitrate-nitrogen patterns in the Raccoon River Basin related to agricultural practices
 doi:1.2489/jswc.64.3.19 Nitrate-nitrogen patterns in the Raccoon River Basin related to agricultural practices J.L. Hatfield, L.D. McMullen, and C.S. Jones Abstract: Nitrate-N concentrations in the Raccoon
Land use and land cover change in mountainous watersheds: Consequences for ecosystem services of water yield and water quality
 Bayreuth Center of Ecology and Environmental Research Sebastian Arnhold Land use and land cover change in mountainous watersheds: Consequences for ecosystem services of water yield and water quality Background
Planting and Harvesting Crops
 Planting and Harvesting Crops Chesapeake Bay Program Agricultural Workgroup s Building a Better Bay Model Workshop 05/22/2013 Gary Shenk Chesapeake Bay Program s Integrated Analysis Coordinator Photos
Green County: Groundwater 101
 Green County: Groundwater 101 Kevin Masarik Center for Watershed Science and Education Through the University of Wisconsin-Extension, all Wisconsin people can access University resources and engage in
The Impact of Nonpoint Source Contamination on the Surficial Aquifer of the Delmarva Peninsula
 The Impact of Nonpoint Source Contamination on the Surficial Aquifer of the Delmarva Peninsula Judith M. Denver National Water-Quality Assessment Program (NAWQA) September 28,2010 U.S. Department of the
Appendix X: Non-Point Source Pollution
 Appendix X: Non-Point Source Pollution Sources Nonpoint source of pollution, unlike pollution from industrial and sewage treatment plants, comes from many different sources. Nonpoint source pollution is
Owasco Lake Watershed Management Plan: Incorporation of the EPA Nine Key Elements. Community Meeting August 13, 2018
 Owasco Lake Watershed Management Plan: Incorporation of the EPA Nine Key Elements Community Meeting August 13, 2018 Acknowledgments FUNDING This watershed planning effort is funded through a Title 11 Environmental
A Nutrient Mass Balance of the Watershed Research and Education Center: Where, When and How Much?
 A Nutrient Mass Balance of the Watershed Research and Education Center: Where, When and How Much? BRIAN E. HAGGARD, JOHN T. METRAILER, DIRK PHILIPP, J. VAUGHN SKINNER, J. THAD SCOTT, AND ANDREW N. SHARPLEY
Raccoon River Watershed Water Quality Master Plan
 Raccoon River Watershed Water Quality Master Plan November 2011 A tool to inform and guide watershed residents and stakeholders as they seek to cooperatively improve water quality in Iowa s Raccoon River
Effects of Nutrient Management Practices on Water Quality: Nitrogen Issues and Concerns. Kevin Masarik Center for Watershed Science and Education
 Effects of Nutrient Management Practices on Water Quality: Nitrogen Issues and Concerns Kevin Masarik Center for Watershed Science and Education Number of wells installed Background 70% of WI population
Appendix 12. Pollutant Load Estimates and Reductions
 Appendix 12. Pollutant Load Estimates and Reductions A pollutant loading is a quantifiable amount of pollution that is being delivered to a water body. Pollutant load reductions can be calculated based
On August 2, 2014, the residents of
 doi:10.2489/jswc.73.2.29a FEATURE Right practice, right place: A conservation planning toolbox for meeting water quality goals in the Corn Belt Eileen L. McLellan, Keith E. Schilling, Calvin F. Wolter,
History of Model Development at Temple, Texas. J. R. Williams and J. G. Arnold
 History of Model Development at Temple, Texas J. R. Williams and J. G. Arnold INTRODUCTION Then Model development at Temple A long history (1937-present) Many scientists participating in: Data collection
Columbia, Missouri. Contents
 Supplemental Material to Accompany: Long-term Agro-ecosystem Research in the Central Mississippi River Basin, USA - SWAT Simulation of Flow and Water Quality in the Goodwater Creek Experimental Watershed
WATERSHED MANAGEMENT IN MINNESOTA. GOVERNANCE, PLANNING, AND FUNDING June 19, 2018 Cedar Rapids, Iowa
 WATERSHED MANAGEMENT IN MINNESOTA GOVERNANCE, PLANNING, AND FUNDING June 19, 2018 Cedar Rapids, Iowa GOVERNANCE - WD 1955 Watershed Act (MN Statute 103D) Local petition to form VOLUNTARY watershed district
Prairie Creek Watershed Plan
 Prairie Creek Watershed Plan A roadmap to sustain and enhance water resources, agricultural productivity, soils and habitat in the Prairie Creek Watershed Prepared by: December 207 2 Funding to support
Cover Crops For Midwest Farming Systems. Jeremy Singer Research Agronomist
 Cover Crops For Midwest Farming Systems Jeremy Singer Research Agronomist Outline Discuss cover crop effects on water quality. Review current crop demographics. Discuss options for managing agricultural
Impairment Issues in the Ichetucknee Springs Basin Potential Research Questions and Hypotheses
 Impairment Issues in the Ichetucknee Springs Basin Potential Research Questions and Hypotheses Brian G. Katz U.S. Geological Survey Ichetucknee Springs Research Meeting February 10, 2011 Sources of hydrologic
IIHR s Continuous Monitoring Network and Water Quality Information System. Chris Jones University of Iowa-IIHR
 IIHR s Continuous Monitoring Network and Water Quality Information System Chris Jones University of Iowa-IIHR Unit of the College of Engineering Director: Larry Weber 90 Graduate Students from 16 countries