International Competitiveness of Typical Dairy Farms
|
|
|
- Ada Holt
- 6 years ago
- Views:
Transcription
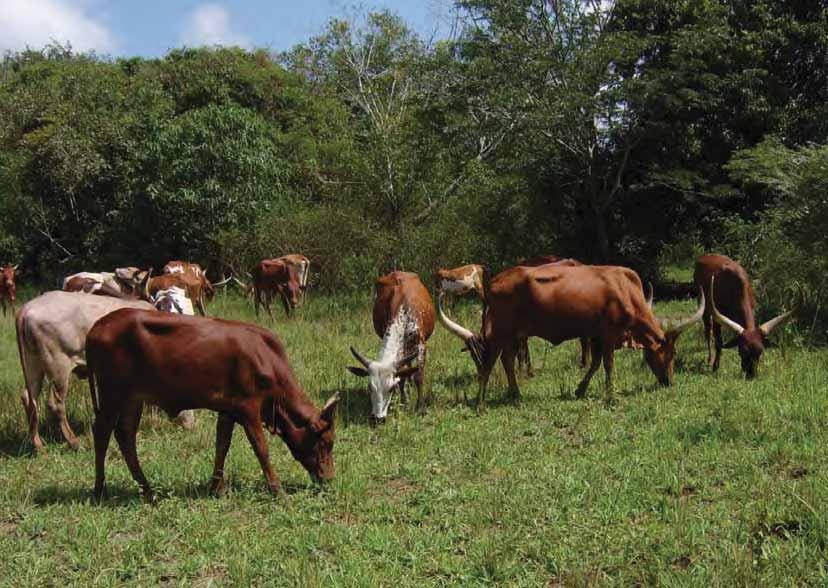
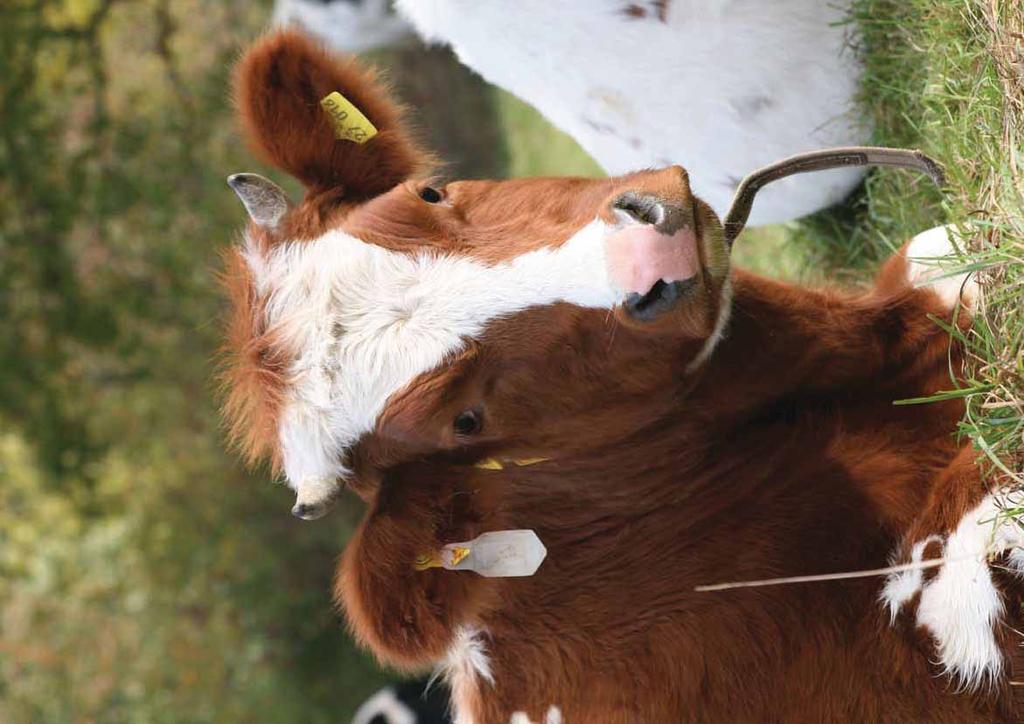
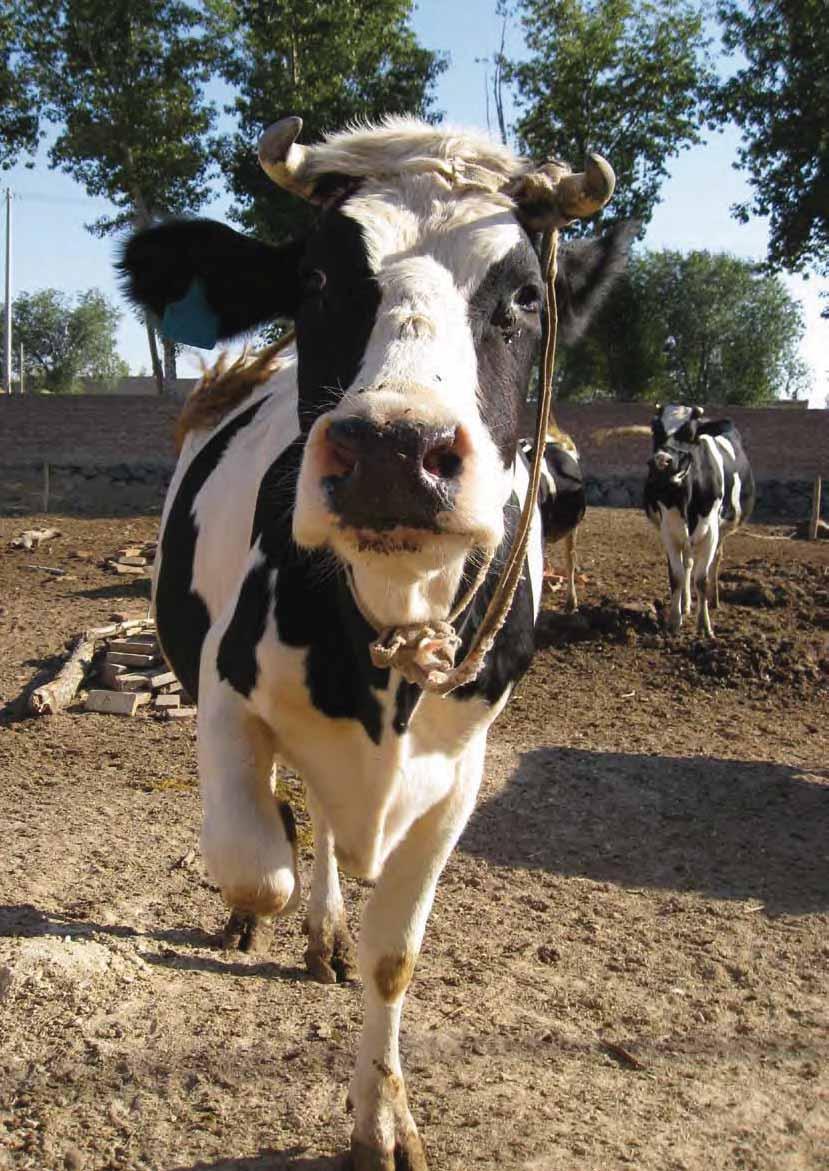
1 Chapter 4 International Competitiveness of Typical Dairy Farms 4.1 Summary Overview of selected dairy farm types Overview of the whole farm Farm income, profits and returns to labour Asset structure and returns on investments Producer milk prices and non-milk returns Costs of milk production only; milk prices Total milk production costs and returns to the dairy enterprise Cost component: labour Cost component: land Cost component: capital (excluding land and quota) 114 Pictures on this and previous double page: Housing (Pictures by: Katja Seifert, Otto Garcia and Torsten Hemme)

2 4.1 Summary Introduction This chapter compares the international competitiveness of typical dairy farming systems in selected countries, with special focus on the cost of milk production and main determinants thereof. It also seeks to determine whether small-scale dairy farms in developing countries are in a position to compete with large-scale dairy farming systems in industrialized countries. Farm types and data Thirty dairy farm types from 13 countries have been compared using the standard IFCN methodology. Farms representative of various dairy farming systems were selected in Bangladesh, Cameroon, China, India, Morocco, Pakistan, Peru, Thailand, Uganda and Viet Nam and subjected to detailed analysis. For the industrialized countries, similar analyses were conducted for farms in Germany, New Zealand and the USA. In general, the first farm type represents the current average farm, while the second represents either a larger farm type or a different, but relevant, dairy production system. A detailed description of the farms appears in Annex 5. While production data usually refer to the calendar year 25, data for the farms in Africa and China were obtained in 26 when they entered the IFCN data collection system. For the farms in India (Orissa and Karnataka), Thailand and Viet Nam, the data were obtained in 24. In order to make use of available information, 25 exchange rates were applied to all financial farm data. Comparison of dairy returns Dairy farm returns derive from milk and/or non-milk items (sales of cattle and manure, government payments, etc.). Milk returns account for 55 to 95 percent of the returns of all farm types analysed, and range from US$12 to US$36/1 kg of ECM. These returns are mainly determined by three categories of farmgate milk prices, which were: Less than US$2/1 kg: Observed in Pakistan and Uganda. US$2-3/1 kg: Although most farms receive prices in this range, those in India, New Zealand Viet Nam are at the lower end of the range whereas prices in Bangladesh and Thailand are at the higher end. More than US$3/1 kg: Farmers in Cameroon, Germany, Morocco and the USA all obtained similar milk prices of about US$36/1 kg of ECM. Non-milk items account for US$2 to 38/1 kg ECM of the returns of the dairy farm types analysed. The main determinants of non-milk returns were the cattle/beef price levels; culling rates and, related to that, strategies for selling calves and surplus heifers; yields per lactation; the level of government payments coupled to milk production; and use of manure on the farm. Based on these factors, non-milk returns were very low for the farms in India and very high in Germany and Morocco. Comparison of the cost of milk production Lowest milk production costs (less than US$12/1 kg) were observed for both farm types in Uganda and for the larger farm type in Cameroon. Production costs on all farm types in China, New Zealand, Peru, Thailand and the USA were slightly higher (US$22 to 3/1 kg), but were highest in Germany (over US$35/1 kg). Given major differences in agricultural wage rates between developed and developing countries, it might be assumed that developing country farms have a labour cost advantage. It is, however, interesting to note that this was found not to be the case when comparing labour costs per litre of milk, mainly because as a general rule regions with higher salaries also have a significantly higher level of labour productivity. Expressed in terms of per litre of milk, the labour costs of a nine-cow dairy farm in Punjab, India, are similar to those of a 35-cow farm in the USA. The key cost advantage of smallholder dairy farming is the use of low-cost feed and the overall low-tech approach to milk production. Cows fed on crop residues, such as straw, are lower-cost producers of milk than high-yielding, grain-fed dairy cows. Economies of scale In general, comparison of farm types within and across countries and regions supports the hypothesis that economies of scale exist in milk production. It was observed that in Thailand and Uganda lower milk production costs were incurred only by the smaller farm types, mainly because of their significantly higher non-milk returns per 1 kg of milk. 94 IFCN 28

3 4.1 Summary Cost comparison between developed and developing countries To obtain a clearer understanding of their comparative position in terms of international and local competitiveness, a simple average of key indicators of competitiveness was calculated for farmers in both developing and developed countries. Although the method is very crude and there are very large variations within each group, the comparison is most informative. Average milk production costs in the three developed countries covered by this study (Germany, New Zealand and the USA) stand at US$31.4/1 kg, or 56 percent above the average production cost of US$2.2/1 kg calculated for the ten developing countries (Bangladesh, Cameroon, China, India, Morocco, Pakistan, Peru, Thailand, Uganda and Viet Nam). The average price of milk in the three aforementioned developed countries (US$31.2/1 kg) is only 3 percent higher than that of the developing countries (US$24./1 kg). Thus, the overall profitability of milk production appears to be higher in developing countries than in the developed ones, which may be one of the reasons why developing countries are increasing their shares in global dairy production. US-$/1 kg milk (ECM) Cost ranges of typical farms analysed India Pakistan Bangladesh Thailand Returns to labour Vietnam China If dairy farming is to be sustainable, it is essential that it should be able to compete for labour on the local labour market. The indicator return to labour quantifies the valueadded per hour of labour put into dairy farming. If this return is higher than the average local wage rate, then the farming system can afford to pay competitive wages and should be sustainable from the labour standpoint. The average return to labour observed in the developing countries covered by this study is US$.45/hour, which is 45 percent higher than the average local wage of US$.31/hour. In the three developed countries, the average return to labour is US$16.3/hour, which is still 22 percent above the average estimated wage of US$13.3/hour. These figures indicate that dairy farming can compete on the local labour market in both groups of countries. However, despite these favourable returns to labour from dairy farming, the figures also show that milk production can quickly lose its competitive advantage if local wages rise faster than labour productivity. Uganda Cost range Cameroon Morocco Peru Germany USA max min New Zealand Impact of increasing feed prices on competitiveness Given the rapid increases in feed prices over the recent past, it is important to consider how this affects the small-scale dairy farmers in developing countries in terms of competitiveness. In general, as these smallholder dairy systems normally use much less compound feed per kilogram of milk produced than dairy farms in the EU and the USA, rising feed prices increase the cost of milk production in the latter countries much faster than in the low-yield systems predominating in the developing countries. As a result, small scale dairy farming becomes even more competitive as feed prices increase. IFCN 28 95
4 4.2 Overview of selected dairy farm types Introduction Typical farms were selected in accordance with the following rationale: the first (small) farm type of each country was chosen to represent the dairy herd size closest to the statistical average. Other farm types were selected as representing larger farms in order to assess economies of scale in the different countries, or as representing different dairy production systems. Management levels on the typical farms selected were average-to-slightly-above-average in relation to other farms in the same country. Herd sizes and milk yields Herd sizes on typical farms included in the study range from one buffalo/cow in Pakistan to 1 42 cows in New Zealand. Milk yields, similar to herd sizes, are extremely variable and range from 395 kg/cow in Uganda to 1 5 kg/cow on the larger farm type in the USA. These simple figures clearly demonstrate the enormous diversity that exists among milk production systems around the world. Overview of farm characteristics The table below provides a succinct overview of the types of dairy farm included in the analysis. Further details on each farm are provided in Annex 5. Country Farm 1 Farm land (ha) Dairy herd size 2 Milking Annual milk yield (kg) 3 India (Orissa) IN-2OR 2. 2 buffaloes Hand buffaloes Hand 1 3 India (Punjab). 1 buffalo Hand buffaloes, 6 crossbreed cows Hand 2 9 India (Karnataka) IN2-KA.8 2 crossbreed cows Hand crossbreed cows Hand 3 3 Pakistan. 1 buffalo Hand buffaloes, 2 crossbreed cows Hand 2 4 Bangladesh.4 2 cows Hand cows Hand 1 3 Thailand Holstein cows Machine Holstein cows Machine 4 35 Viet Nam.5 2 Holstein cows Hand Holstein cows Hand 4 China 4. 3 Holstein cows Machine Holstein cows Machine 4 4 Uganda local dairy cows Hand local dairy cows Hand 4 Cameroon peri-urban area 3 1 crossbreed cows Hand 1 15 rural area local dairy cows Hand 5 Morocco 2. 4 Holstein cows Hand Holstein cows Hand 2 2 Peru dairy cows Hand dairy cows Hand 4 5 Germany DE dual-purpose cows Pipeline machine 6 8 DE Holstein cows Herringbone Parlour 7 9 USA (Wisconsin) US Holstein cows Side-by-side parlour 8 7 US Holstein cows Side-by-side Parlour 1 5 New Zealand Holstein/Jersey Parlour 4 3 crossbreed cows ,42 Holstein/ Jersey crossbreed cows Rotary Example IN-2OR = Indian 2-cow farm in Orissa (see Annex 5) 2 Average number of dairy cows (dry and lactating) per annum. 3 Milk yield per cow and year (ECM). 4 Both farms are located in a dairy garden, where an investor has set up the infrastructure and provided a central milking facility. 5 On both farm types, the cows are kept outside all year round and are milked in milking parlours or on rotary milking systems. 96 IFCN 28
5 4.2 Overview of selected dairy farm types Size of typical farms No. of cows / farm 1 Size of typical farm , Milk yield 1, kg milk (ECM)/ cow / year Farm types IFCN 28 97

6 4.3 Overview of the whole farm Returns structure of the whole farm Most of the farm types included in the assessment were specialized dairy farms obtaining more than 6 percent of their returns from dairy activities. Non-specialized dairy farms (with less than 6 percent of their returns from dairying) were observed in Bangladesh (Sirajgani), India (Orissa and Punjab), Pakistan (Layyah) and Uganda (Kayunga), mainly because dairying is a supplementary occupation in mixed farming systems. Many dairy farms also have crop enterprises that produce mainly cash crops. Other typical non-dairy activities include sheep- or goat-raising (,,, ): poultry production (, PK,,, ); pig-raising (UG); fish-farming (); contract labour/custom work (, ); and forestry (). Off-farm activities are very common on small farms in Bangladesh, India, Morocco, Pakistan, Thailand, Viet Nam and Uganda. The farm obtained additional income from renting out houses. Capital structure of the whole farm The chart shows the share of liabilities on total assets, which range from percent to 65 percent. These liabilities can be grouped into four share categories: Very high more than 5 percent:. Medium 3 to 5 percent: and New Zealand farm types. Low to 3 percent: Half of the farms fall into in this range. No liabilities: While individual farms with no liabilities were found in all developing countries (except China), all farms in industrialized countries have some liabilities. These differences can be explained by the following: Production systems require different capital inputs. Growth under a quota regime calls for large investments in quota. Farm history: Farmers who have recently invested in setting up or expanding a farm need credit. Land ownership: Farmers who historically own land or have expanded their farms by renting more land have chances of investing only in livestock, machinery and buildings without taking on high debts. In New Zealand, where farms grow by means of land purchases, debt levels are relatively high and restrict growth. Access to capital markets: Liabilities are low in Asia and Africa because it is difficult to obtain capital for farming activities. Profit margins Profit margins range from -36 percent to +7 percent. As a general rule, margins are high (more than 25 percent) on small family farms because they are run without hired labour and have limited liabilities. Explanation of variables Farm codes: Example = German 3-cow farm in the south (for details see Annex 5). Returns: All cash receipts plus value of products consumed by household plus change in inventory (e.g. livestock). Dairy returns: Milk sales, cull cows, heifers, calves, direct payments, and also marketable milk consumed on-farm. Cash crops: Sales of surplus crops such as grain, soybean, etc. (plus related crop payments). Other returns: Beef fattening, forestry, poultry, etc. Liabilities: Total year-end liabilities (leasing and operating loans not included). Equity: Total assets (book value of machinery, buildings, market values of livestock, land and quota) liabilities. Farm income: Total returns minus costs from the profit and loss (P&L) account (cash costs + depreciation + balance of input inventory). Profit margin (share of farm income on total returns): Farm income divided by farm returns. This figure provides an idea of how vulnerable a farm may be to changes in farm costs or returns. If the margin is small, the farm has no risk buffer. 98 IFCN 28
7 4.3 Overview of the whole farm Return structure of the whole farm 1 % Dairy Cash crops Other activities 8 % 6 % 4 % 2 % % Capital structure of the whole farm 1 % Equity Liabilities 8 % 6 % 4 % 2 % % Profit margin of the whole farm (share of farm income on total returns) 7 % 6 % * = profit margin negative 5 % 4 % 3 % 2 % 1 % % * * Farm types IFCN 28 99

8 4.4 Farm income, profits and returns to labour Farm income The farm income indicator describes a farm s income based on the profit and loss (P&L) account. On family farms, this income provides the basis for covering family livelihoods and asset or capital growth. Salaries are deducted for farms that have hired labour. Farm income ranges from US$3/1 kg of milk to US$38/1 kg of milk. Smaller farms tend to have higher farm incomes per 1 kg of milk because of the higher proportion of family labour, which is not deducted. In Cameroon and Viet Nam, however, larger farms with hired labour generate higher farm incomes than the smaller farms, mainly because the former obtain higher output prices (Viet Nam) or have low wage costs for hired labour (several larger farms in Cameroon share a herdsman). Entrepreneur profit The entrepreneur profit indicator shows whether farms cover their full economic costs. If the indicator is positive, all costs shown in the P&L account can be covered and family-owned production factors (labour, land, capital and quota) can be paid at market price (opportunity cost). In this case, farming systems are financially sustainable. Entrepreneur profits range from -US$15/1 kg of milk to +US$34/1 kg of milk; some 73 percent of the farms make a positive entrepreneur profit. Negative profits (losses) are found on the smaller farm types in Morocco, New Zealand, Pakistan and Peru, and on both farm types in China and Germany. In nearly all countries except Thailand and Uganda, the larger farm types earn greater profits per 1 kg of milk than the smaller ones. As mentioned earlier, the main reasons why the smaller farm types in Thailand and Uganda make higher profits predominantly relate to their higher non-milk returns due to high prices for cattle (and beef). Returns to labour The returns to labour indicator shows the value created (per hour) by a farm labourer and indicates the potential wage that can be paid. A comparison of returns to labour with the wage rate in the region concerned shows whether a farm can compete on the local labour market and cover its full economic costs. Farms unable to compete with wage levels in their regions may stay in business until a generation change takes place or as long as farmers are satisfied with the wages they obtain for their work. For reasons of simplification, three general levels can be defined: Less than US$1/hour: All farm types in the developing countries, except the larger farm types in Cameroon and Peru, have returns to labour of less than US$1./hour to put back into the dairy farm enterprise. This group represents 73 percent of the farms analysed here. Between US$1 to 1/hour: Farms,, and. More than US$1/hour: The larger farm types in Germany and New Zealand and both farm types in the USA. Competitiveness on the labour market Farms are competitive on the local labour market if their returns to labour input exceed wage levels in their regions. In Asia, the large farm types and both small and large farm types in Thailand and Viet Nam have competitive returns to labour but neither of the Chinese farms can compete on the local labour market, mainly due to the relatively high wage levels in the region. Diversity of local wage levels is large in Africa, as are returns to labour. Returns to labour in dairy farming are locally competitive only in Cameroon due to the grazing practices that keep labour costs low and because of the relatively high amount of beef/livestock sales that make a huge impact on dairy profitability. In Peru, the larger periurban farm type generates competitive returns to labour in relation to the local wage rate. Explanation of variables Farm codes: Example = German 3-cow farm in the south (details see Annex 5). Returns of the dairy enterprise: All dairy enterprise returns (as described in Annex 8). Farm income: Returns minus costs in dairy enterprise s P&L account. In the industrialized countries, the larger farm types generate higher returns to labour than the smaller ones and are thus more competitive on the local labour market. The most profitable farms were found in the USA, followed by the large farm type in New Zealand. Both farm types in Germany would need to undergo major restructuring if they are to generate locally competitive returns to labour. The overall difference between the highest- and lowest-performing dairy farms in terms of returns to labour input, is in the order of US$32.6/ hour ( with US$33/hour and with US$.4/ hour). Entrepreneur s profit: Total returns minus full economic costs (costs from P&L account + opportunity costs) of dairy enterprise. Returns to labour: Entrepreneur s profit plus labour costs divided by total labour input. Average farm wages: This figure represents the gross salary + social fees (insurance, taxes, etc.) that the employer is obliged to cover. Calculation: Total labour costs (wages paid plus opportunity costs) divided by the total hours worked. For this calculation, an estimate has been made of the number of hours worked by family members and employees. 1 IFCN 28
9 4.4 Farm income, profits and returns to labour Returns and profits US$ / 1 kg milk (ECM) 7 Returns of the dairy enterprise Farm income Entrepreneur's profit Return to labour US$ / hour Return to labour 2. Average wages on the farm Farm types IFCN 28 11
10 4.5 Asset structure and returns on investments Capital assets/investment per 1 kg milk An analysis of asset structure and returns on investment provides indications of where best to invest profitably in dairy farming. This variable details the level of investments per 1 kg of milk required by the respective farm type. The return on investment is shown in order to rank the farming systems based on how efficiently they use their capital to generate profit. With regard to assets, the capital input per 1 kg of milk ranges from US$2 to US$37 for the farm types assessed and may be grouped as follows: More than US$2: Germany (), India ( and ), Morocco () and Peru. The main investment factors are land prices, livestock value, machinery and quota owned. Between US$1 and 2: Some Asian farmers who own land and have cross- or purebred dairy animals and small dairy herds fall into this group. Purebred dairy cows and quota bring assets up to this level in and, respectively. Less than US$1: About half the farms fall into this category, mainly because they own little or no land. Most Asian farms allocate little, if any, land to dairying itself but rely heavily on agricultural residues and purchased inputs. In Viet Nam, farmers are not allowed to own land; in China, farmers rent barn facilities, purchase all farm inputs and practise fully-confined dairying. For grazing, most African farmers depend on public land for which they pay a small fee. In the USA, large herd sizes and heavy purchases of feedstuff (leading to less land requirements) greatly reduce the farmers asset base per 1 kg milk. Other assets: For most farms these consist of circulating capital, the share of which is too small to appear on the graph. In New Zealand, other assets are shares in a dairy cooperative and account for percent of farm assets. Within-country/between-farm differences in asset composition Peru: The larger farm is located near an urban centre, which increases both land prices and pressure to invest in productivity improvements. India: Differences in assets are determined by the production systems themselves (with or without land). (The situation in Pakistan is similar.) China: The two Chinese farms have very little or no machinery and building assets, as they are part of a cooperative and pay for the use of the machinery and buildings. Cameroon: The smaller farm has dairy cows, cultivates fodder crops on its own land and provides housing for the animals. The larger farm owns local beef cattle that graze on public land and are occasionally milked. Morocco: The smaller farm type is a typical example of small landholders diversifying into dairying; on the bigger dairy farm, a large landholder and crop farmer engage in dairying as a way of adding value to crop outputs. Germany: Differences in assets are determined by the production systems themselves: the small farm participates in and benefits from direct payments from environmental protection initiatives; the larger farm is run along purely commercial lines. Asset composition Quota: High quota shares were found on the German farms. Land: Land values (sometimes reaching as much as 9 percent) dominate asset composition in Oceania and Western Europe, and in dairy production systems in Bangladesh, India, Pakistan, Peru and Thailand operating on own land. Livestock: Livestock values form the major asset in farms operating with little or no owned land, such as, and farms in China, Uganda, and Viet Nam. Returns on investments Returns on investments (ROIs) range between -18 and +4 percent. Most farms fall into the -3 to +5 percent range. High ROIs (more than 1 percent) were found in Cameroon (CM- 35), India (), Viet Nam () and the USA (). It is important to note that in eight of the 13 countries, that is China, Germany, Morocco, New Zealand, Pakistan, Peru, Thailand and Uganda, neither of the two farm types evaluated had ROIs above 5 percent. Inflation rates in all countries range between 1 percent and 9 percent (source: International Monetary Fund (IMF)). The highest rates, 7 to 9 percent, were observed in Bangladesh, Pakistan and Uganda. Explanation of variables Farm codes: Example = German 3-cow farm in the south (details see Annex 5). Calculation of farm assets: Land, livestock, cooperative shares and quota at market price, machinery and buildings by book values. ROI: (Entrepreneur s profit + estimated interest (on non-land, non-quota assets) + interest on quota + opportunity cost of land (by land rents)/all farm assets minus inflation rate for the year 25. Changes in asset values (land, livestock, etc.) have not (yet) been included. Inflation rate: IMF World Economic Outlook 24/ 25/ 26, gross domestic product deflator for developed countries, CPI (consumer Price Index) for the other countries. for IFCN 28
11 4.5 Asset structure and returns on investments Asset structure of the dairy enterprise US$ / 1 kg milk (ECM) 4 Land Buildings Machinery Livestock Quota Other Return on investment 3 % 4 % ROI - Return on investment (real) Inflation rate 25 % 2 % 15 % 1 % 5 % % -5 % -1 % -15 % -18 % Farm types IFCN 28 13
12 4.6 Producer milk prices and non-milk returns Milk prices overview Milk prices per 1 kg of ECM range from US$12 to US$36 and may be grouped into the following categories: Less than US$2/1 kg: Observed in Pakistan and Uganda for farms far from urban centres and in areas with poor infrastructure. The lowest price was observed in Ugandan farms at US$12/1 kg of ECM Between US$2 to 3/1 kg: The majority of the farms studied receive milk prices that fall into this category. Farmers in India, New Zealand and Viet Nam are at the lower end of the scale, whereas farmers in Bangladesh and Thailand obtain prices at the higher end. In Peru, one farm is located in a peri-urban area and the other in a rural area, which explains the very significant price differences within the country. More than US$3/1 kg: Farmers in Cameroon, Germany, Morocco and the USA all obtain milk prices of around US$35/1 kg of ECM. A dual milk price structure appears to exist at the global level, with most farms obtaining prices around the world market level. (The world market price for milk can be calculated by taking the average world market price for butter and SMP, multiplying it by technical coefficients and subtracting processing costs. In 26, this price stood at around US$26.5/1 kg.) The Moroccan and Cameroonian farms analysed receive prices above those of the world market, similar to those received by their German and US American counterparts. In Morocco, the key driver is the tariff protection, which is similar to that in the EU. Cameroon appears to represent as a special supply/demand situation with regard to fresh milk. Milk prices explanations/details Bangladesh/Thailand: These countries are large net importers of milk, and have restricted imports of dairy products by means of tariffs (Bangladesh, 35 percent) and import quotas (Thailand). Pakistan: Both farms are located in rural areas in the southern part of Punjab, which is a new dairy region far away from large consumer markets. China (north): These farms are part of a cooperative. Milk prices are dictated by the investor who set up the farm infrastructure. Africa: Milk prices in Cameroon and Morocco are the highest, while those in Uganda are the lowest. Peru: The larger farm received higher prices because it is part of a government-sponsored school milk programme. New Zealand: The prices received by farmers were a combination of advance payments for the 24/25 season and deferred payments from the previous one. Non-milk returns In addition to the income received from milk sales, dairy farms also obtain revenue by means of direct payments, sales of livestock, and sales of manure as fertilizer and household fuel for domestic use (South Asia). These non-milk returns range from US$1.6 to US$35/1 kg of ECM and contribute from 6 to 51 percent of total farm returns. High shares were observed in China (), Morocco (both farm types) and Uganda (), mainly as a result of high prices for beef and heifers (China and Morocco) and very low milk yields (Uganda). Direct farm support Among the farms studied, direct payments are found only in Germany and the USA, where the level of support is US$6.5 to 11. and US$.7/1 kg of ECM, respectively. No direct support payments are received by farmers in Africa, Asia, Latin America and Oceania. Germany: Farms in southern Germany were found to receive higher direct payments. These farms are located in less favourable areas and receive payments for extensive use of grassland or for farming in hilly areas. USA: Dairy farmers cultivating feed grains or soybean receive various subsidies in the form of fixed and deficiency payments. For maize, these payments represented about 4 percent of the market price in 25. Support for investments in dairy farming In many countries, the government and/or non-governmental institutions provide support to the dairy sector by means of investment aid or subsidized interest rates. Although many specific support programmes for dairy development have been set up in both the industrialized and developing countries, there also appears to be a large number of not-soevident programmes in most countries studied. Thus, direct payments constitute only a small part of measures in support of dairy farming. Explanation of variables Farm codes: Example = German 3-cow farm in the south (details see Annex 5). Milk prices: Average milk prices adjusted to ECM, excluding value-added tax (VAT). Cattle returns: Returns from sales of cull cows, calves and surplus heifers +/- livestock inventory changes. Direct payments: All government payments including coupled and decoupled payments. VAT balance: Farms that do not balance the VAT with the tax department have either a positive or a negative balance depending on if the VAT on farm returns is more or less than that on farm costs respectively. 14 IFCN 28
13 4.6 Producer milk prices and non-milk returns Milk prices US$ / 1 kg milk (ECM) Non-milk returns US$ / 1 kg milk (ECM) 25 Cattle returns Direct payments + VAT balance 35 Other returns (manure, surplus feed) Farm types IFCN 28 15

14 4.7 Costs of milk production only; milk prices Costs of milk production only, 25 overview The variable cost of milk production only includes all costs incurred by the dairy enterprise. However, the non-milk returns (e.g. returns from the sale of calves, heifers and cull cows) have been deducted from these to allow for a fair comparison of milk production costs across different milk production systems. Three categories of milk production costs, expressed in United States dollars per 1 kg of ECM, were identified with regard to the countries and farm types analysed: Less than US$15/1 kg: The larger farm types in Cameroon, Pakistan and Uganda. Between US$15 and 3/1 kg: Farms in Bangladesh, New Zealand and the USA, most farms in India, the smaller farm type in Pakistan, and the larger ones in China and Peru. More than US$3/1 kg: Farms in Germany, Morocco and the small farm types in China and Peru. Costs of milk production only, 25 explanations/details Cameroon: The costs incurred by the small farm type (with Holstein Friesian cows) are comparatively higher owing to expensive feed and low productivity. The large farm type, on the other hand, is a cow-calf operation where some of the cows are milked. A large part of the milk is retained on-farm for feeding calves. Peru: Costs are relatively higher than those in the Asian countries owing to (relatively) higher wage levels. India (Orissa): Farm shows the highest degree of complexity of all farm types analysed (very low milk yield, high share of non-cash transactions, wide range of outputs from the dairy enterprise). It was very difficult to estimate the opportunity costs of family labour for this farm, and they may have been overestimated due to the method used (the method has subsequently been modified to ensure more accurate analysis of labour inputs in subsistence farming). In almost all countries (with the exception of Thailand and Uganda), the cost of milk production only was lower in the larger farm types compared to their smaller national counterpart, suggesting that further structural changes in the dairy sector will take place in all regions in future. Most cost-competitive milk producers by region Based on the price in United States dollars per 1 kg of milk, the lowest-cost producing dairy farming systems in the various regions were: Africa (Cameroon, Morocco, Uganda) 3-cow herd in Uganda* Southeast Asia (China, Thailand, Viet Nam) 4-cow herd in Viet Nam South Asia (Bangladesh, India, Pakistan) 1-cow herd in Pakistan US$1 US$13 US$14 Oceania (New Zealand) 1 42-cow herd US$21 Latin America (Peru) 15-cow herd North America (USA) 35-cow herd Western Europe (Germany) 8-cow herd US$23 US$26 US$38 It should be noted that for the last four regions, the table is based on two typical farms from one country only. Explanation of variables Farm codes: Example = German 3-cow farm in the south (details see Annex 5). Other costs - non-milk returns: Costs from the P&L account minus non-milk returns (cattle returns and direct payments, excluding VAT). Opportunity costs: Costs for using own production factors within the enterprise (own land and capital, family labour). Quota costs: Quota rents paid plus opportunity cost of quota owned (3 percent interest on quota value). Milk price: Average milk prices adjusted to ECM, excluding VAT. * Although imputed costs of milk production were lower on, milk is a by-product of cattle-raising for beef production, and thus this farm is not considered to be the most competitive. 16 IFCN 28
15 4.7 Costs of milk production only; milk prices Costs of milk production only US$ / 1 kg milk (ECM) 5 Costs from P&L account - non-milk returns Opportunity costs (excl. quota) Quota costs (rent and opportunity costs) Milk price Farm types Method Returns & Costs US$ / 1 kg milk (ECM) Non-milk returns Returns = Milk price Quota costs* Opportunity costs Costs from P&L account Opportunity Quota costs* Opportunity costs costs Costs from P&L account - Non-milk returns Entrepreneur's profit In order to estimate the cost of milk production in a way that allows direct comparison with the milk price, the nonmilk returns (cattle returns and direct payments) have been subtracted from the total costs of the dairy enterprise. The figure shows the details of the calculation. Returns of the dairy enterprise Costs of the dairy enterprise Costs of milk production only * Rent and opportunity costs for quota. IFCN 28 17
16 4.8 Total milk production costs and returns to the dairy enterprise Introduction The previous section provided a simplified picture of the cost of milk production only, whereas this section considers the total costs of the dairy enterprise per 1 kg of milk and relates them to three different return items: milk returns; returns from sales of cull cows, calves and heifers; and other dairy enterprise returns, e.g. from sales of manure and direct payments. To provide an overview of farm dependence on the various return items, the graph on the next page shows the following: (i) milk price only; (ii) milk price plus returns from sales of cull cows, etc., plus other returns; and (iii) the previous two, plus direct payments received. This overview facilitates an understanding of how different farm types might be affected by variations in milk and non-milk returns. Vulnerability to reductions in cattle and beef prices Some farms would be badly affected by a sharp drop in cattle and beef prices: Moroccan farms that receive US$21 to 35/1 kg ECM (Energy Corrected Milk) from cattle sales. Cameroonian farms that obtain US$11 to 13/1 kg ECM from cattle sales. Farms in China, Peru and Viet Nam that receive about US$11/1 kg ECM. India, which receives US$11/1 kg ECM. However, this farm does not really depend on beef prices in the strict sense, as most of its non-milk returns are derived from sales of lactating buffaloes. It would appear, therefore, that this farm type is highly dependent on prices for live animals. Vulnerability to reductions in direct payments German dairy farm incomes would decrease by 4 to 5 percent if farmers did not receive direct payments. This is because instead of incomes of US$18 or US$12 per 1 kg of ECM, farmers would obtain only US$1 or US$6 per 1 kg of ECM. Resilience to reductions in non-milk returns Some farms would be affected only slightly by a sharp drop in non-milk returns, namely, the farms in New Zealand and in the Indian state of Karnataka, because beef and cattle prices are low and farmers do not receive any direct payments. Furthermore, profit margins are sufficiently high on the majority of the smaller family farm types analysed in this chapter to ensure that there would be no losses in the P&L account in the event of a large reduction in non-milk returns. Comparison of milk production cost calculations The calculations of production costs for 1 kg ECM given in this section and in Section 4.8 differ, especially for farms with high non-milk returns. The method employed in Section 4.7, referred to as cost of milk production only, shows whether the milk price received by the farmer covers the net cost (i.e. the full economic costs minus the non-milk returns) of producing it. The method used in this section provides information on the full economic costs of the dairy enterprise. As set out in the following table, the cost difference between German and USA dairy farms based on the latter method is US$18/1 kg ECM compared with US$12/1 kg ECM using the first method. The conclusion reached with both methods is the same: at a full economic cost of US$5/1 kg of milk, production on the farm in Germany costs US$18 more per 1 kg of milk than in the USA and, after allowing for non-milk returns (US$12 in Germany and US$8 in the USA), costs only US$8 more. Cost of milk Non-milk Full cost production only returns of the dairy enterprise (US$ per 1 kg of milk) Farm: Farm: Difference Explanation of variables Farm codes: Example: = German 3-cow farm in the south (details see Annex 5). Cash costs: Purchased feed, fertilizer, seed, fuel, maintenance, land rents, interest on liabilities, wages paid, veterinary services plus medicine, water, insurance, accounting, etc. (excluding VAT). Depreciation: Annual decrease of the purchase price of buildings, machinery based on lifespan (excluding VAT). Opportunity costs: Costs for using own production factors (land owned, family labour input, equity including quota). Milk price: Average milk prices adjusted to ECM, excluding VAT. These would be the returns in the event all direct payments and all beef returns were nil. Milk price plus non-milk returns without direct payments: Milk price + cull cow, calves, heifer returns + changes in livestock inventory + other returns, such as sales of manure. These would be the returns in the event no direct payments were made. Milk price plus all non-milk returns, including direct payments: This represents the current return structure of the farms. 18 IFCN 28
17 4.8 Total milk production costs and returns to the dairy enterprise Total costs and returns of the dairy enterprise US$ / 1 kg milk (ECM) 7 Level 1: Milk price Level 2: Level 1 + cull cow, calves, heifer + other returns Level 3: Level 2 + direct payments Cash costs Depreciation Opportunity costs Farm types Method Returns & Costs US$ / 1 kg milk (ECM) Direct payments Cattle- & other returns Opportunity costs Depreciation Level 3 Level 2 Level 1 Entrepreneur's profit Farm income This graph compares the total costs with different return levels of the dairy enterprise. Milk price Other costs Cash costs Return Level 1 = Milk price Return Level 2 = Milk price + cattle + other returns Return Level 3 = Total returns incl. direct payments Returns of the dairy enterprise Costs of the dairy enterprise IFCN 28 19

18 4.9 Cost component: labour Labour costs/1 kg milk Labour is one of the main costs incurred in dairy farming. To obtain a better picture of the structure of labour costs, the opportunity costs and wages are shown separately in the graph. Total labour costs range from US$2 to US$25/1 kg of milk. Different levels can be discerned: High (more than US$1/1 kg milk): The farms in China, Germany, and the smaller farm types in Bangladesh, Orissa (India), Morocco and Pakistan Intermediate (US$5 to 1/1 kg milk): Both farm types in Uganda, Cameroon and USA; the small farm types in Punjab (India) and Viet Nam; and the larger farm types in Bangladesh, China and Morocco. Low (less than US$5/1 kg milk): Both (small and large) farm types in Karnataka (India), New Zealand and Thailand, and the large farms in Orissa and Punjab (India), Pakistan and Viet Nam. Labour cost differences may be explained by differences in wages and/or differences in labour productivity. For example, labour costs per 1 kg of milk on the large New Zealand farm type (, US$4/1 kg) amount to 3 percent of those on the small German dairy farm type (, US$13/1 kg). The New Zealand farm pays only 6 percent of the German wages (US$1.81/hour vs. US$18.19/hour) and produces 2.3 times the amount of milk per hour of farm labour (321 kg/ hour vs. 14kg/hour). Regional wages for farm labour Milk production is labour-intensive and farm wages, which vary considerably across countries/regions, are important determinants of international competitiveness. Highest wages were observed in the industrialized nations, ranging from a low of US$1/hour to a high of US$18/hour for farms in New Zealand and Germany, respectively. In Latin America, wages orbit around US$1/hour, while on the African and Asian farms, wages vary from US$.5/hour to US$.6/hour. In general, three wage levels for farm labour can be defined: Labour productivity Apart from wage levels, labour productivity also determines the level of a farm s competitiveness and may be influenced by the farmer and the production system adopted. In line with regional wages for farm labour, three labour productivity levels, expressed in kilograms of milk per hour worked, were observed: High (more than 5 kg/hour): Found on all farms in industrialized countries (Germany, New Zealand and the USA). On these farms, labour is used very efficiently thanks to labour-saving mechanization and economies of scale. However, even within dairy farms in industrialized countries, large differences in labour productivity exist, ranging from 7 kg/hour on the larger German farm type to as much as 321 kg/hour on the large New Zealand farm. With year-round grazing, labour efficiency in New Zealand is determined by economies of scale, investments in labour-saving devices and a system whereby the cows mainly graze on their own and distribute their effluent on the grazing land. Low (1 to 5 kg/hour): This small group consists of both farms in Thailand and the smaller farm type in Germany. Variations within the group are determined mainly by milk yields, wage levels and management approach. Very low (less than 1 kg/hour): Key factors explaining low labour productivity in Africa, Asia (except for Thailand) and Peru are very low wages and limited access to capital, which result in labour-intensive and capital-extensive production systems with low investments in labour productivity-enhancing equipment. High (more than US$1/hour): Farms in all industrialized countries reviewed. Low (between US$.5 and 1.5/hour): Observed in China, Morocco and Peru. Very low (less than US$.5/hour): Found on all remaining farms in Africa, South Asia and Southeast Asia. Explanation of variables Farm codes: Example = German 3-cow farm in the south (details see Annex 5). Labour input: It is very difficult to estimate the number of hours worked and the cost, especially on family farms. For hired labour, the hours worked are estimated, whereas with regard to family labour the number of hours are based on the time a skilled worker would need to run a farm along the same lines as a family farm. Labour costs: Paid wages and opportunity costs for own labour. Average wage on the farm: The gross salary + social fees (insurance, taxes, etc.) the employer is obliged to cover. Calculation: Total labour costs (wages paid plus opportunity costs) divided by the total hours worked. For this calculation, an estimate was made of the number of hours worked by the employees and family members. Remark: A wide range of wages are paid within regions. Labour productivity: Kilograms of ECM produced per hour of labour input on the farm. 11 IFCN 28
19 4.9 Cost component: labour Labour costs US$ / 1 kg milk (ECM) 3 Wages paid Calc. costs for family labour Average wages on the farm US$ / hour Labour productivity kg milk (ECM) / hour Farm types IFCN
, land quality and the amount of land used for dairy production.")
20 4.1 Cost component: land Land costs/1 kg milk Land costs contribute between 2 percent and 3 percent of the total costs of dairy farms that rent or own land, and range from US$.5 to US$8.1/1 kg of milk. In many instances land costs are extremely variable within countries, owing to differences in land rental values (e.g. significantly higher in peri-urban than rural areas), land quality and the amount of land used for dairy production. High land costs (more than US$5/1 kg of milk): High land costs were observed in Morocco (), New Zealand (), Peru () and Viet Nam (). Intermediate land costs (US$2-5/1 kg of milk): The majority of farms had land costs falling into this range and representative cases were found in Bangladesh, Cameroon, Germany, India (Karnataka, Orissa, Punjab), Morocco, New Zealand, Peru, Uganda, and the USA. Low land costs (less than US$2/1 kg of milk): Low land costs were estimated for some farm types in Bangladesh, Cameroon, India (Karnataka, Orissa, Punjab), Pakistan, Thailand, the USA and Viet Nam. Land rental prices In the countries reviewed, land rents range from US$9 to US$745 per hectare: More than US$3/ha: All farms in Morocco, New Zealand and Viet Nam; and large farms in Germany and India (Punjab). US$1 to 3/ha: All farms in Bangladesh, India (Orissa and Karnataka), Pakistan, Peru and the USA; and the small farm type in Germany. Less than US$1/ha: All farm types in Cameroon and Thailand. The level of land rental prices in Viet Nam can be explained by high population density in the areas where they were located (in the vicinity of Hanoi) and the large demand for urban/periurban land. Land rents are affected by various factors. As a general rule, the following factors have a bearing on land rents: Soil quality/crop yield and crop prices. Livestock density in the area. Competition for land. Environmental regulations, i.e. maximum stocking rates. Acreage payments and other payment schemes. Urbanization and competition from non-agricultural interests. Quantity of land available on rental markets. Social relations between land owners and tenant farmers. Land productivity Land productivity ranges from 1 to 154 kg of milk/ha. These differences are mainly a result of the various types of milk production system adopted, which differ from country to country and even within countries. For instance, farms in India ( and ), Thailand () and Viet Nam () have a very high milk output per area of farmland, which is mainly determined by large purchases of feed and fodder, and intensive use of concentrates. Explanation of variables Farm codes: Example = German 3-cow farm in the south (details see Annex 5). Land costs: Land rents and opportunity costs for own land (calculated rent) of the dairy enterprise. Level of land rents/ha: Land rents + calculated land rents for own land divided by the total land of the farm. Land productivity: Kilograms of ECM produced per ha of land in one year. 112 IFCN 28
21 4.1 Cost component: land Land costs US$ / 1 kg milk (ECM) 6 Land rents paid Land rents calculated for land owned Level of land rents US$ / ha Land productivity 1, kg milk (ECM)/ ha Farm types IFCN

22 4.11 Cost component: capital (excluding land and quota) Capital costs/1 kg milk It is often difficult to estimate capital costs incurred in dairy farming because any cost comparison is challenged by differences in depreciation schemes, land valuation, levels of inflation, capital structure and interest rates. A method that yields sufficiently accurate results for most cases is to calculate interest on liabilities at 6 percent and for own capital at 3 percent. For some countries, among them China, this method slightly overestimates capital costs; for others, including India and Pakistan, the method produces slight underestimates. Capital costs contribute approximately 3 to 29 percent of the total costs of the dairy farms studied, and thereby explain more or less as much as land costs on total cost differences. Capital costs range from US$.8 to US$5.7/1 kg of milk, but for most farms they are in the order of US$1 to 2/1 kg of milk. High capital costs (more than US$3/1 kg) were observed for all Moroccan, New Zealand and Ugandan dairy farm types and for the small farm types in Cameroon, Germany and India. Low capital costs (less than US$1/1 kg of milk) were observed for the larger farm types in China and in Pakistan. The considerable capital costs in New Zealand can be explained by high land prices and cost of shares in the cooperatives. The smaller dairy farm in Germany () has high capital costs due to large investments in buildings and machinery (two and four times, respectively, that of for each 1 kg of ECM produced). The main determinant of the high capital costs in Uganda and Morocco is low capital productivity. Capital input/cow Capital costs per 1 kg of milk are a cost component of dairy production but do not provide information on the capital intensity of a dairy farm because, to a large extent, they are determined by the level of farm liabilities. The indicator capital input/cow, which only takes account of the capital embedded in the dairy herd, buildings and machinery and cooperative shares, gives a better sense of the capitalintensity of a dairy farm. The different levels observed on the farms under study were as follows: High (more than US$2 5/cow): All farms in Germany, Morocco, New Zealand and the USA. Intermediate (US$1 to 2 5/cow): All farm types in Thailand and Viet Nam; the large farm type in Peru and the small one in Cameroon. Low (less than US$1 US$/cow): All farm types in Bangladesh, China, India, Pakistan and Uganda; the large farm type in Cameroon and the small one in Peru. Explanation of variables Farm codes: Example = German 3-cow farm in the south (details see Annex 5). Capital costs: Interest on liabilities (6 percent) and opportunity costs for own capital (3 percent). This is an estimate of the real interest rate for the international capital market. To justify using the real interest rate (instead of the nominal one), see Isermeyer, Liabilities: Figures from the dairy enterprise s balance sheet. In New Zealand, liabilities exceed the sum of non-land and non-quota assets. In this case, the surplus is not deducted because it is already covered by the other calculations. Example: land costs are calculated on the basis of the rental price and not as interest on the land value. Capital input per cow: Total capital input, except land and quota/number of cows. Values for buildings, machinery, livestock and other operating capital (estimated as 1 percent of variable costs of a crop and dairy enterprise). Land is not included, as land cost is calculated on the basis of the rental price. Quota values are not included here. Capital productivity: Kilograms of ECM produced divided by capital input (except land and quota). 114 IFCN 28
23 4.11 Cost component: capital (excluding land and quota) Capital costs US$ / 1 kg milk (ECM) , US$ / cow 6 Capital input per cow (land and quota value not included) Capital productivity per asset (land and quota value not included) kg milk (ECM) / 1, US$ 6, 5, 4, 3, 2, 1, Farm types IFCN

24 Uganda Cameroon
25 Germany
26 China
Glossary of terms used in agri benchmark
 Whole farm Assumptions Harvest years / agricultural years They usually comprise two calendar years, e.g. July 2000 - June 2001. TIPI-CAL year The model calculates on a calendar year basis (January December).
Lowland cattle and sheep farms, under 100 hectares
 GROSS OUTPUT, VARIABLE COSTS AND FARM GROSS MARGIN, 2003/2004 Output Milk 0 0 Milk quota leasing, milk levy and compensation 0 0 Cattle 280 415 Herd depreciation -1 8 Cattle subsidies 135 211 Sheep 127
SDA cattle and sheep farms, 120 hectares and over
 GROSS OUTPUT, VARIABLE COSTS AND FARM GROSS MARGIN, 2003/2004 Output Milk 0 0 Milk quota leasing, milk levy and compensation 0 0 Cattle 138 160 Herd depreciation -12-16 Cattle subsidies 92 101 Sheep 131
EU milk margin index estimate up to 2018
 EU Agricultural and Farm Economics Briefs No 17 December 2018 EU milk margin index estimate up to 2018 An overview of estimates of of production and gross margin indexes of milk production in the EU Contents
Evidence Report GB dairy herd performance 2014 /15 December 2015
 Evidence Report GB dairy herd performance 2014 /15 December 2015 Contents Executive summary Key findings stemming from year end 2014/15 data 3 Introduction Background 4 The aim of the report 4 The data
1. Under 60k SO Farm Business Income ( per farm)
") 1. Under 60k SO Farm Business Income ( per farm) Number of farms in sample 21 21 Average business size (SO) 32,754 33,481 OUTPUTS 2016/17 2015/16 Other cattle 15,275 16,588 Sheep 10,263 10,669 Main crops
1. Under 60k SO Farm Business Income ( per farm) Number of farms in sample 21 21 Average business size (SO) 32,754 33,481 OUTPUTS 2016/17 2015/16 Other cattle 15,275 16,588 Sheep 10,263 10,669 Main crops
EU Milk Margin Estimate up to 2016
 EU Agricultural and Farm Economics Briefs No 16 December 217 EU Milk Margin Estimate up to 216 An overview of estimates of of production and gross margins of milk production in the EU Contents Need for
Changing global dairy markets: Comparison of dairying worldwide & farm economics
 Changing global dairy markets: Comparison of dairying worldwide & farm economics Bjørn Gunnar Hansen, member of the IFCN Dairy Research Network TINE SA, cooperative dairy company Agenda 1. The IFCN network
Accounting for Agriculture
 International Journal of Recent Research and Review, Vol. II, June 2012 Accounting for Agriculture R. S. Sharma Department of ABST, Assistant Professor, University of Rajasthan, Jaipur, India Email: sharmarss1959@gmail.com
EU Milk Margin Estimate up to 2015
 Ref. Ares(2016)5774609-05/10/2016 EU Agricultural and Farm Economics Briefs No 13 September 2016 EU Milk Margin Estimate up to 2015 An overview of estimates of of production and gross margins of milk production
Information based on FADN data 2013
 Ref. Ares(2016)4773682-25/08/2016 EU Agricultural and Farm Economics Briefs No 12 August 2016 FARM ECONOMY OVERVIEW: BEEF SECTOR Information based on FADN data 2013 This brief provides an overview of production
The Global Dairy World 2016/17
 The Global Dairy World 2016/17 Price cycle 2013 2016 has ended and a new one will start IFCN - The Dairy Research Network Schauenburgerstr.116 24118 Kiel Germany info@ifcndairy.org October 2017 The Global
Agriculture & Business Management Notes...
 Agriculture & Business Management Notes... SPA Standardized Performance Analysis For Cow/Calf Producers -- A Worksheet Approach -- Cow/calf producers have been challenged to be lower cost producers, to
Major Cost Items on Wisconsin Organic, Grazing, and Confinement (Average of All Sizes) Dairy Farms
 Dairy Farms") Major Cost Items on Wisconsin Organic, Grazing, and Confinement (Average of All Sizes) Dairy Farms By Tom Kriegl 1 February 19, 2008 Cost management should receive regular attention on any farm. Focusing
Major Cost Items on Wisconsin Organic, Grazing, and Confinement (Average of All Sizes) Dairy Farms By Tom Kriegl 1 February 19, 2008 Cost management should receive regular attention on any farm. Focusing
2009 Michigan Dairy Farm Business Analysis Summary. Eric Wittenberg And Christopher Wolf. Staff Paper December, 2010
 2009 Michigan Dairy Farm Business Analysis Summary Eric Wittenberg And Christopher Wolf Staff Paper 2010-04 December, 2010 Department of Agricultural, Food, and Resource Economics MICHIGAN STATE UNIVERSITY
An Economic Comparison of Organic and Conventional Dairy Production, and Estimations on the Cost of Transitioning to Organic Production
 An Economic Comparison of Organic and Conventional Dairy Production, and Estimations on the Cost of Transitioning to Organic Production Produced by: the Northeast Organic Farming Association of Vermont
EU Milk Margin Estimate up to 2013
 Farm Economics Brief No 5 April 2014 EU Milk Margin Estimate up to 2013 An overview of estimates of of production and gross margins of milk production in the EU Contents Need for monitoring milk margin
Status and trends in milk production world wide
 Milk production is a very important element of the whole dairy chain. In this part of the value chain the major share of a) the costs, b) resources used, c) emissions created and d) the political challenges
Chapter 3. Milk Production and Dairy Sector Profiles
 Chapter 3 Milk Production and Dairy Sector Profiles 3.1 Summary 34 3.2 India 38 3.3 Pakistan 42 3.4 Bangladesh 46 3.5 Thailand 5 3.6 Viet Nam 54 3.7 China 58 3.8 Uganda 62 3.9 Cameroon 66 3.1 Morocco 7
Organic versus conventional farming, which performs better financially?
 Farm Economics Brief No 4 November 2013 Organic versus conventional farming, which performs better financially? An overview of organic field crop and milk production in selected Member States Contents
2015 Michigan Cash Grain Farm Business Analysis Summary. Eric Wittenberg And Christopher A. Wolf. Staff Paper November, 2016
 2015 Michigan Cash Grain Farm Business Analysis Summary Eric Wittenberg And Christopher A. Wolf Staff Paper 2016-02 November, 2016 Department of Agricultural, Food, and Resource Economics MICHIGAN STATE
2006 Iowa Farm Costs. and Returns File C1-10. Ag Decision Maker. Definition of Terms Used
 2006 Iowa Farm Costs Ag Decision Maker and Returns File C1-10 The farm record data utilized in this report were obtained from the Iowa Farm Business Associations. The average of all farms in each table
Determining the costs and revenues for dairy cattle
 Determining the costs and revenues for dairy cattle Regional Training Course on Agricultural Cost of Production Statistics 21 25 November 2016, Daejeon, Republic of Korea 1 Definitions Production costs
2004 Michigan Dairy Farm Business Analysis Summary. Eric Wittenberg Christopher Wolf. Staff Paper September 2005
 Staff Paper 2004 Michigan Dairy Farm Business Analysis Summary Eric Wittenberg Christopher Wolf Staff Paper 2005-10 September 2005 Department of Agricultural Economics MICHIGAN STATE UNIVERSITY East Lansing,
2008 Michigan Cash Grain Farm Business Analysis Summary. Eric Wittenberg And Stephen Harsh. Staff Paper November, 2009
 2008 Michigan Cash Grain Farm Business Analysis Summary Eric Wittenberg And Stephen Harsh Staff Paper 2009-11 November, 2009 Department of Agricultural, Food, and Resource Economics MICHIGAN STATE UNIVERSITY
Teagasc National Farm Survey 2016 Results
 Teagasc National Farm Survey 2016 Results Emma Dillon, Brian Moran and Trevor Donnellan Agricultural Economics and Farm Surveys Department, Rural Economy Development Programme, Teagasc, Athenry, Co Galway,
2014 Michigan Dairy Farm Business Analysis Summary. Eric Wittenberg And Christopher Wolf. Staff Paper December, 2015
 2014 Michigan Dairy Farm Business Analysis Summary Eric Wittenberg And Christopher Wolf Staff Paper 2015-08 December, 2015 Department of Agricultural, Food, and Resource Economics MICHIGAN STATE UNIVERSITY
Will the BRICs Decade continue? Prospects for trade and growth June 2011 Halle (Saale), Germany
, Germany") Will the BRICs Decade continue? Prospects for trade and growth 23-24 June 2011 Halle (Saale), Germany Status and development in the dairy sector in the BRIC. Dr. Mikhail Ramanovich*, Dr. Asaah Ndambi**,
Will the BRICs Decade continue? Prospects for trade and growth 23-24 June 2011 Halle (Saale), Germany Status and development in the dairy sector in the BRIC. Dr. Mikhail Ramanovich*, Dr. Asaah Ndambi**,
2007 Michigan Dairy Grazing Farm Business Analysis Summary. Eric Wittenberg And Christopher Wolf. Staff Paper December, 2008
 2007 Michigan Dairy Grazing Farm Business Analysis Summary Eric Wittenberg And Christopher Wolf Staff Paper 2008-5 December, 2008 Department of Agricultural, Food, and Resource Economics MICHIGAN STATE
Financial Survey 2015 Southland Dairy
 Financial Survey 2015 Southland Dairy This report summarises the results of a financial survey of dairy farms across Southland, carried out by AgFirst through June 2015. A description of the model farm
2014 Michigan Cash Grain Farm Business Analysis Summary. Eric Wittenberg And Christopher A. Wolf. Staff Paper December, 2015
 2014 Michigan Cash Grain Farm Business Analysis Summary Eric Wittenberg And Christopher A. Wolf Staff Paper 2015-07 December, 2015 Department of Agricultural, Food, and Resource Economics MICHIGAN STATE
2006 Michigan Dairy Grazing Farm Business Analysis Summary. Eric Wittenberg And Christopher Wolf. Staff Paper November, 2007
 2006 Michigan Dairy Grazing Farm Business Analysis Summary Eric Wittenberg And Christopher Wolf Staff Paper 2007-09 November, 2007 Department of Agricultural Economics MICHIGAN STATE UNIVERSITY East Lansing,
2011 Michigan Cash Grain Farm Business Analysis Summary. Eric Wittenberg And Christopher A. Wolf. Staff Paper October, 2012
 2011 Michigan Cash Grain Farm Business Analysis Summary Eric Wittenberg And Christopher A. Wolf Staff Paper 2012-09 October, 2012 Department of Agricultural, Food, and Resource Economics MICHIGAN STATE
Economics 330 Fall 2005 Exam 1. Strategic Planning and Budgeting
 Economics 330 Fall 2005 Exam 1 K E Y Strategic Planning and Budgeting Circle the letter of the best answer. You may put a square around the letter of your second choice. If your second choice is right,
Australian Beef Financial performance of beef farms, to
 Australian Beef Financial performance of beef farms, 2014 15 to 2016 17 Jeremy van Dijk, James Frilay and Dale Ashton Research by the Australian Bureau of Agricultural and Resource Economics and Sciences
EU farm economics summary 2013
 EU Agricultural and Farm Economics Briefs No 14 Oct 2016 EU farm economics summary 2013 Contents 1. Income developments 2. Role of direct payments 3. Financial farm structure 4. Croatia in focus This brief
2015 Michigan Dairy Farm Business Analysis Summary. Eric Wittenberg And Christopher Wolf. Staff Paper November, 2016
 2015 Michigan Dairy Farm Business Analysis Summary Eric Wittenberg And Christopher Wolf Staff Paper 2016-01 November, 2016 Department of Agricultural, Food, and Resource Economics MICHIGAN STATE UNIVERSITY
2007 Michigan Dairy Farm Business Analysis Summary. Eric Wittenberg And Christopher Wolf. Staff Paper December, 2008
 2007 Michigan Dairy Farm Business Analysis Summary Eric Wittenberg And Christopher Wolf Staff Paper 2008-04 December, 2008 Department of Agricultural, Food, and Resource Economics MICHIGAN STATE UNIVERSITY
Managing For Today s Cattle Market And Beyond: A Comparative Analysis Of ND - Demo Cow Herd To North Dakota Database
 Managing For Today s Cattle Market And Beyond: A Comparative Analysis Of ND - Demo - 160 Cow Herd To North Dakota Database By Harlan Hughes Extension Livestock Economist Dept of Agricultural Economics
MILK PRODUCTION COSTS in 1998 on Selected WISCONSIN DAIRY FARMS
 MILK PRODUCTION COSTS in 1998 on Selected WISCONSIN DAIRY FARMS by Gary Frank and Jenny Vanderlin 1 July 23, 1999 Introduction Total cost of production per hundredweight equivalent of milk ($14.90) was
Economic, Productive & Financial Performance Of Alberta Cow/Calf Operations
 Benchmarks for Cattlemen Economics & Competitiveness Economic, Productive & Financial Performance Of Cow/Calf Operations Southern Fescue land, Mixed land & Moist Mixed land Production Year - 2002 Jan.
Appendix I Whole Farm Analysis Procedures and Measures
 Appendix I Whole Farm Analysis Procedures and Measures The whole-farm reports (except for the balance sheets) include the same number of farms, which were all of the farms whose records were judged to
Livestock and livelihoods spotlight ETHIOPIA
 Livestock and livelihoods spotlight ETHIOPIA Cattle sector Financial support provided by the United States Agency for International Development (USAID) Cattle and livelihoods spotlight Ethiopia Introduction
IFCN Long-term Dairy Outlook
 IFCN Long-term Dairy Outlook The IFCN Vision of the dairy world in 2025 IFCN - The Dairy Research Network Schauenburgerstr.116 24118 Kiel Germany September 2016 IFCN Long-term Dairy Outlook The IFCN Vision
2007 Michigan Cash Grain Farm Business Analysis Summary. Eric Wittenberg And Stephen Harsh. Staff Paper December, 2008
 2007 Michigan Cash Grain Farm Business Analysis Summary Eric Wittenberg And Stephen Harsh Staff Paper 2008-07 December, 2008 Department of Agricultural, Food, and Resource Economics MICHIGAN STATE UNIVERSITY
Economic, Productive & Financial Performance Of Alberta Cow/Calf Operations
 Benchmarks for Cattlemen Economics & Competitiveness Economic, Productive & Financial Performance Of Cow/Calf Operations Comparing:, Profitability & Production Management Groupings Production Year - 1998
Managing For Today s Cattle Market And Beyond A Comparative Analysis Of Demo Herd 1997 Herd To McKenzie County Database
 Managing For Today s Cattle Market And Beyond A Comparative Analysis Of Demo Herd 1997 Herd To McKenzie County Database By Harlan Hughes Extension Livestock Economist Dept of Agricultural Economics North
MILK PRODUCTION COSTS and SELECTED FINANCIAL BENCHMARKS FROM 978 WISCONSIN DAIRY FARMS
 1996 1 MILK PRODUCTION COSTS and SELECTED FINANCIAL BENCHMARKS FROM 978 WISCONSIN DAIRY FARMS by Gary Frank and Jenny Vanderlin 2 August 27, 1997 Introduction In this study of 1996 records, 978 dairy farms
MILK PRODUCTION COSTS in 2000 on Selected WISCONSIN DAIRY FARMS
 MILK PRODUCTION COSTS in 2000 on Selected WISCONSIN DAIRY FARMS By Gary Frank 1 July 27, 2001 Introduction In 2000, the U.S. Average Milk Price ($12.33) was less than the study farms' total economic cost
2011 STATE FFA FARM BUSINESS MANAGEMENT TEST PART 2. Financial Statements (FINPACK Balance Sheets found in the resource information)
") 2011 STATE FFA FARM BUSINESS MANAGEMENT TEST PART 2 Financial Statements (FINPACK Balance Sheets found in the resource information) Please use the Market Value when making the calculations for the Zimmerman
2011 STATE FFA FARM BUSINESS MANAGEMENT TEST PART 2 Financial Statements (FINPACK Balance Sheets found in the resource information) Please use the Market Value when making the calculations for the Zimmerman
Cow-Calf Enterprise Standardized Performance Analysis
 Cow-Calf Enterprise Standardized Performance Analysis Overview Cattlemen are challenged to reduce production costs, be more competitive, and increase market share and profits. The first step to lowering
Farm Credit Canada Annual Report
 16 17 2016-17 Annual Report Annual Report 2016-17 19 Agriculture industry overview FCC advances the business of agriculture by lending money to all agriculture sectors, including primary producers, agribusinesses
A Review Of Milk Production In Pakistan With Particular Emphasis On Small-Scale Producers
 Pro-Poor Livestock Policy Initiative International Farm Comparison Network IFCN A Review Of Milk Production In Pakistan With Particular Emphasis On Small-Scale Producers Otto Garcia, Khalid Mahmood and
MILK PRODUCTION COSTS in 2001 on Selected WISCONSIN DAIRY FARMS
 MILK PRODUCTION COSTS in 2001 on Selected WISCONSIN DAIRY FARMS By Gary Frank and Jenny Vanderlin 1 July 22, 2002 Introduction The good news is that higher milk prices in 2001 caused an increased of almost
Multi-Year Economic, Productive & Financial Performance Of Alberta Cow/Calf Operations
 Benchmarks for Alberta Cattlemen Economics & Competitiveness Multi-Year Economic, Productive & Financial Performance Of Alberta Cow/Calf Operations (2012-2016) 24-Oct-17 Overview This AgriProfit$ Cost
Farm Economics brief
 Farm Economics brief N 2 EU production costs overview July 211 Contents The effect of the economic crisis on costs and margins Operating costs in the EU groups Highly contrasted costs among the Member
MILK PRODUCTION COSTS in 2008 On Selected WISONSIN DAIRY FARMS
 MILK PRODUCTION COSTS in 2008 On Selected WISONSIN DAIRY FARMS By Ken Bolton and Jenny Vanderlin 1 October 2009 Introduction The Basic Cost of Production increased in 2008 by $0.35/cwt equivalent (CWT
~il~~:~~ii~!. ~...~: {(.~i. !!.~I~ji!': i~i( l:;i;!i:i;i;i:::-: :: C: ..::::)~::m~:l::::t:m:;::;;%::;:!;:;:;:j;.:;:;::::;::j::j:j\:;..
~::m~:l::::t:m:;::;;%::;:!;:;:;:j;.:;:;::::;::j::j:j\:;..") May 1983 A.E. Ext. 83-10 ~il~~:~~ii~!. ~...~:..::::)~::m~:l::::t:m:;::;;::;:!;:;:;:j;.:;:;::::;::j::j:j\:;.. ;/::@H::;j'::;{:: ::::;:;:;:;:::;:::::::::::::;: ::::::;:::::;:;:::;:::::;::::: ~ ~::: ~: ~:
May 1983 A.E. Ext. 83-10 ~il~~:~~ii~!. ~...~:..::::)~::m~:l::::t:m:;::;;::;:!;:;:;:j;.:;:;::::;::j::j:j\:;.. ;/::@H::;j'::;{:: ::::;:;:;:;:::;:::::::::::::;: ::::::;:::::;:;:::;:::::;::::: ~ ~::: ~: ~:
THE FARM BUSINESS SURVEY IN WALES
 Institute of Biological, Environmental and Rural Sciences THE FARM BUSINESS SURVEY IN WALES Wales Farm Income Booklet 2013/14 Results Sponsored by CONTENTS Foreword Overview Introduction Definition of
Chapter 7. Dairy -- Farm Management Wayne A. Knoblauch, Professor George J. Conneman, Professor Emeritus Cathryn Dymond, Extension Support Specialist
 Chapter 7. Dairy -- Farm Management Wayne A. Knoblauch, Professor George J. Conneman, Professor Emeritus Cathryn Dymond, Extension Support Specialist Herd Size Comparisons The 171 New York dairy farms
MILK PRODUCTION COSTS in 2009 on Selected WISONSIN DAIRY FARMS
 MILK PRODUCTION COSTS in 2009 on Selected WISONSIN DAIRY FARMS By Ken Bolton and Jenny Vanderlin 1 Introduction January 2011 The good news is that Wisconsin dairy farmers lowered their basic cost of production
ECONOMICS OF SHRIMP FARMING
 ECONOMICS OF SHRIMP FARMING 6 Contents 6.1 Cost of Production 6.2 Revenue 6.3 Profit Shrimp culture is an export oriented agri-business, which gained momentum in the country over a period of last thirty
Small-scale. dairy farming manual. Vol. 6
 Small-scale dairy farming manual - Vol. 6 Small-scale dairy farming manual Vol. 6 Regional Dairy Development and Training Team for Asia and Pacific Chiangmai, Thailand Regional Office for Asia and the
Wisconsin Agricultural Economics Outlook Forum
 Wisconsin Agricultural Economics Outlook Forum January 21, 2015 Executive Summary Status of the Wisconsin Farm Economy This document was prepared by the Renk Agribusiness Institute in January, 2015. Wisconsin
Producer Price and Milk Cost of Production Order, amendment
 THE MILK PRICES REVIEW ACT (C.C.S.M. c. M130) Producer Price and Milk Cost of Production Order, amendment Regulation 190/2006 Registered September 13, 2006 Manitoba Regulation 77/94 amended 1 The Producer
THE DISTRIBUTION OF FARM PERFORMANCE: DRAFT TERMS OF REFERENCE
 THE DISTRIBUTION OF FARM PERFORMANCE: DRAFT TERMS OF REFERENCE 1. Background It has been suggested that OECD work under the 2011-12 PWB adopt an innovation system approach. The scoping paper of the project
An assessment of the post 2015 CAP reforms: winners and losers in Scottish farming
 An assessment of the post 2015 CAP reforms: winners and losers in Scottish farming Shailesh Shrestha*, Bouda Vosough Ahmadi, Steven G. Thomson and Andrew P. Barnes Land Economy, Environment and Society
Benchmarking Your Herd s Economic Facts
 Managing for Today s Cattle Market and Beyond March 2002 Benchmarking s Economic Facts By Harlan Hughes, North Dakota State University Dwight Aakre, North Dakota State University Introduction Benchmarking
IFCN. Dairy Case Study: Bangladesh vs. the EU. International Farm Comparison Network. Authors:
 IFCN International Farm Comparison Network Dairy Case Study: Bangladesh vs. the EU Authors: Dr. Torsten Hemme Chairman of the IFCN EU & global dairy expert torsten.hemme@ifcndairy.org Uddin Mohammad PhD
Absolute emissions 1 (million tonnes CO 2 -eq) Average emission intensity (kg CO 2 -eq/kg product) Milk 2 Meat 2 Milk Meat Milk 2 Meat 2
 Average emission intensity (kg CO 2 -eq/kg product) Milk 2 Meat 2 Milk Meat Milk 2 Meat 2") 4. Results 4. Cattle This study estimates that in 25, total emissions from cattle production amount to 4 623 million tonnes C 2 -eq. These emissions include emissions associated with the production of
4. Results 4. Cattle This study estimates that in 25, total emissions from cattle production amount to 4 623 million tonnes C 2 -eq. These emissions include emissions associated with the production of
Replacement Heifers Costs and Return Calculation Decision Aids
 Replacement Heifers Costs and Return Calculation Decision Aids The purpose of these replacement heifer cost decision aids is to calculate total production costs and return on investment (ROI) to evaluate
Determining Your Unit Costs of Producing A Hundred Weight of Calf
 Managing for Today s Cattle Market and Beyond Determining Your Unit Costs of Producing A Hundred Weight of Calf By Harlan Hughes North Dakota State University Unit Costs of Production Astute beef cow producers
FARM BUSINESS MANAGEMENT
 FARM BUSINESS MANAGEMENT 2009 Annual Report Central and West Central Minnesota April, 2010 A Management Education Program Minnesota State Colleges and Universities Ridgewater College VISIT OUR WEBSITE
Definition of Terms and Explanatory Notes
 CONTENTS Foreword Overview Introduction Definition of Terms and Explanatory Notes Whole Farm Data Hill cattle and sheep Hill sheep Upland cattle and sheep Lowland cattle and sheep Hill and upland dairy
John Deere. Committed to Those Linked to the Land. Market Fundamentals. Deere & Company August/September 2014
 John Deere Committed to Those Linked to the Land Market Fundamentals Deere & Company August/September 2014 Safe Harbor Statement & Disclosures This presentation includes forward-looking comments subject
Economic Review. South African Agriculture. of the DEPARTMENT OF AGRICULTURE, FORESTRY AND FISHERIES
 Economic Review of the South African Agriculture 2018 DEPARTMENT OF AGRICULTURE, FORESTRY AND FISHERIES Compiled by the Directorate: Statistics and Economic Analysis, Private Bag X246, PRETORIA 0001 Published
The data for this report were collected by Iowa Farm Business Association consultants and compiled by Iowa State University Extension and Outreach.
 2016 Cash Iowa Rental Farm Rates Costs for Iowa Ag Decision Maker Returns 2015 Survey File C1-10 The farm record data utilized in this report were obtained from the Iowa Farm Business Association. The
MML Lecture. Globalization and Smallholder Farmers
 24th Annual Ralph Melville Memorial Lecture delivered at the Annual General Meeting held at the Royal Over-Seas League on 13th December 2006. Globalization and Smallholder Farmers MML Lecture Dr M. Joachim
Wheat Enterprises: 1999 Costs and Returns
 Wheat Enterprises: 1999 Costs and Returns KENTUCKY FARM BUSINESS MANAGEMENT PROGRAM Agricultural Economics Extension No. 2001-07 July 2001 By: DAVID L. HEISTERBERG AND RICHARD L. TRIMBLE University of
SDG & Productivity and Income of small-scale food producers to monitor Target 2.3 of the 2030 Agenda
 SDG 2.3.1 & 2.3.2 Productivity and Income of small-scale food producers to monitor Target 2.3 of the 2030 Agenda Training Workshop on Agriculture, Nutrition, and Land Holding and Use to Support the Sustainable
COST AND RETURNS ESTIMATES
 CHAPTER - VII COST AND RETURNS ESTIMATES 208 COST AND RETURNS ESTIMATES Introduction: Estimate of farm (Agriculture) based on the cost of production of different crops are basic to formulate measures for
DAIRY AND DAIRY PRODUCTS
 3. COMMODITY SNAPSHOTS Market situation DAIRY AND DAIRY PRODUCTS International dairy prices started to increase in the last half of 2016, with butter and whole milk powder (WMP) accounting for most of
A Study into Dairy Profitability MSC Business Services during
 A Study into Dairy Profitability MSC Business Services during 2006-2009 July 2010 Authors: Michael Evanish, Manager Wayne Brubaker, Consultant Lee Wenger, Consultant Page 1 of 43 Page 2 of 43 Index Part
2012 STATE FFA FARM BUSINESS MANAGEMENT TEST PART 2. Financial Statements (FINPACK Balance Sheets found in the resource information)
") 2012 STATE FFA FARM BUSINESS MANAGEMENT TEST PART 2 Financial Statements (FINPACK Balance Sheets found in the resource information) Please use the Market Value when making the calculations for the Zimmerman
2012 STATE FFA FARM BUSINESS MANAGEMENT TEST PART 2 Financial Statements (FINPACK Balance Sheets found in the resource information) Please use the Market Value when making the calculations for the Zimmerman
Economics of transitioning to Once A Day milking
 Economics of transitioning to Once A Day milking George Ramsbottom 1, Brian Hilliard 2 and Brendan Horan 3 1 Teagasc, Oak Park, Carlow; 2 Teagasc, Shandon, Dungarvan, Co. Waterford; 3 Teagasc Moorepark,
THE BENEFITS OF FINANCIAL BENCHMARKING TO FARMERS IN THE UNITED STATES
 THE BENEFITS OF FINANCIAL BENCHMARKING TO FARMERS IN THE UNITED STATES Robert Craven, Dale Nordquist and Kevin Klair Center for Farm Financial Management, University of Minnesota Abstract Benchmarking
Israel. Agriculture. Account
 NIS billion Israel 35 1: AGRICULTURE ACCOUNT 2015 30 Agriculture Livestock 25 and livestock products 20 12.3 Depreciation 2.3 15 Excl. compensation 10 Crops for 17.2 employee jobs(1) 5 17.4 0 Account Agricultural
e Profit Monitor Notes on Drystock Input Sheets Version 1.0
 e Profit Monitor Notes on Drystock Input Sheets Version 1.0 Farm Details Year End Date Enter the year end date for the year in question e.g. 31/12/2003 for the year 2003 Registered for VAT Enter Yes or
IS THE FARM PROSPERING AND WHY? A METHOD TO SPOT GOOD OR WEAK PERFORMANCE AND TO DO BENCHMARKING. Bert-Owe Nelson SLA Analysgruppen, Angelholm, Sweden
 IS THE FARM PROSPERING AND WHY? A METHOD TO SPOT GOOD OR WEAK PERFORMANCE AND TO DO BENCHMARKING. Bert-Owe Nelson SLA Analysgruppen, Angelholm, Sweden bert-owe.nelson@sla-arbetsgivarna.org Abstract: In
Reshaping Agricultural Production: Geography, Farm Structure, and Finances
 Reshaping Agricultural Production: Geography, Farm Structure, and Finances James M. MacDonald USDA Economic Research Service Kansas City Federal Reserve Bank Farming, Finance, and the Global Marketplace
PROJECTING CASH FLOWS ON DAIRY FARMS
 January 2002 E.B. 2002-04 PROJECTING CASH FLOWS ON DAIRY FARMS By Eddy L. LaDue Agricultural Finance and Management at Cornell Cornell Program on Agricultural and Small Business Finance Department of Applied
Report on Minnesota Farm Finances. April, 2010
 2009 Report on Minnesota Farm Finances April, 2010 Acknowledgements: Contributing Minnesota producers Minnesota State Colleges and Universities Farm Business Management Education Program Southwestern Minnesota
Economics Challenge Online State Qualification Practice Test. 1. An increase in aggregate demand would tend to result from
 1. An increase in aggregate demand would tend to result from A. an increase in tax rates. B. a decrease in consumer spending. C. a decrease in net export spending. D. an increase in business investment.
BULGARIA: ESTIMATES OF SUPPORT TO AGRICULTURE. Tel : (33-1) Fax : (33-1) DEFINITION AND SOURCES
 Fax : (33-1) DEFINITION AND SOURCES") BULGARIA: ESTIMATES OF SUPPORT TO AGRICULTURE Contact person: Catherine Moreddu Email: catherine.moreddu@oecd.org Tel : (33-1) 45 24 95 57 Fax : (33-1) 44 30 61 01 DEFINITION AND SOURCES Country Total
BULGARIA: ESTIMATES OF SUPPORT TO AGRICULTURE Contact person: Catherine Moreddu Email: catherine.moreddu@oecd.org Tel : (33-1) 45 24 95 57 Fax : (33-1) 44 30 61 01 DEFINITION AND SOURCES Country Total
John Deere. Committed to Those Linked to the Land. Market Fundamentals. Deere & Company June/July 2014
 John Deere Committed to Those Linked to the Land Market Fundamentals Deere & Company June/July 2014 Safe Harbor Statement & Disclosures This presentation includes forward-looking comments subject to important
THE PROFITABILITY OF SEASONAL MOUNTAIN DAIRY FARMING IN NORWAY
 THE PROFITABILITY OF SEASONAL MOUNTAIN DAIRY FARMING IN NORWAY Leif Jarle Asheim 1, Tor Lunnan 2, and Hanne Sickel 2 1. Norwegian Agricultural Economics Research Institute, P. O. Box 8024, Dep., 0030 Oslo,
agriculture, forestry & fisheries Department: Agriculture, Forestry and Fisheries REPUBLIC OF SOUTH AFRICA
 2014 agriculture, forestry & fisheries Department: Agriculture, Forestry and Fisheries REPUBLIC OF SOUTH AFRICA Economic Review of the South African Agriculture 2014 DEPARTMENT OF AGRICULTURE, FORESTRY
John Deere. Committed to Those Linked to the Land. Market Fundamentals. Deere & Company September 2013
 John Deere Committed to Those Linked to the Land Market Fundamentals Deere & Company September 2013 Safe Harbor Statement & Disclosures This presentation includes forward-looking comments subject to important
Breaking Barriers for Beginning Farmers and Ranchers (NIFA-USDA # )
") Breaking Barriers for Beginning Farmers and Ranchers (NIFA-USDA #2010-49400-21729) Introduction to Basic Farm Activities and Terminology Jose A., Ph.D. Assistant Professor of Agribusiness Department of
Breaking Barriers for Beginning Farmers and Ranchers (NIFA-USDA #2010-49400-21729) Introduction to Basic Farm Activities and Terminology Jose A., Ph.D. Assistant Professor of Agribusiness Department of
Characteristics and Production Costs of U.S. Cow-Calf Operations
 United States Department of Agriculture Electronic Report from the Economic Research Service www.ers.usda.gov Statistical Bulletin Number 974-3 November 2001 Characteristics and Production Costs of U.S.