National Dairy Development Board. Dairying In. Punjab. A Statistical Profile 2014
|
|
|
- Nathaniel Farmer
- 6 years ago
- Views:
Transcription


1 Dairying In National Dairy Development Board Punjab A Statistical Profile 2014

2 PUNJAB Formation of districts: Census 1991 to 2011
3 Foreword In this compilation of the statistical profile of the dairy sector in various States, the main landmarks or highlights are: Trends in human demographics, animal population and production; Inputs for enhancement of productivity such as breeding, health and nutrition; and Government expenditure, along with supporting resources. This review includes statistical tables on selected parameters for each State taken as a whole, along with timeseries data for districts wherever available. Since spatial presentation of data can yield insights not immediately comprehensible from tables, thematic maps for selected parameters (with data both at a point of time as well as changes over a period of time) have also been included. The objective of this publication is to provide a detailed presentation of various parameters, underlying factors, and their inter-linkages so as to enable effective planning and implementation of development interventions. We also hope that a wide range of readers, students, researchers, veterinarians, planners, scientists, administrators, policy makers and academics, as well as other development practitioners and professionals in government and non-governmental organisations, will find this publication useful for their studies and projects. Although a wealth of information is available on many aspects of dairying from different sources, it is not only scattered but also there are inconsistencies on the same aspect in data maintained by different agencies. While limited data could mean being less informed, extensive information could mean an overload and defeat the very purpose of organising it. This review, therefore aims at balancing the most comprehensive information with the most relevant. We sincerely thank government and non-government agencies for providing information. While extreme care has been taken in juxtaposing data, some errors cannot be ruled out. This publication Dairying in Punjab A Statistical Profile 2014 is amongst a series of similar publications for different states being brought out by National Dairy Development Board (NDDB). Dilip Rath Managing Director, NDDB October 2014 Anand, Gujarat
4 Index I. GENERAL STATISTICS I.1. Punjab at a Glance I.1.1: General Statistics: Punjab State vs. India...2 I.1.2: Formation of Districts in Punjab...4 I.2. Social Statistics: Human Population I.2.1: Human Population by Residence and Sex I.2.2: Human Population by Residence and Sex I.2.3: District-wise SC and ST Population 2001 and I.2.4: Rural Households, Electricity and Tap Water Supply & I.3. State Economy I.3.1: Net State Domestic Product (NSDP) and Per Capita Income I.3.2: Value of Output: Agriculture and Livestock I.3.3: Budget Provision of different schemes run by Animal Husbandry Department, Punjab I.3.4: Rashtriya Krishi Vikas Yojana (Animal Husbandry Department) II. II.1. II.2. II.3. II.4. II.5. III. III.1. III.2. IV. IV.1. IV.2. LIVESTOCK CENSUS Animal Population II.1.1: Summary of Livestock Census (1992 to 2012) - Punjab II.1.2: District-wise Total Bovine Population II.1.3: District-wise Female Population II.1.4: District-wise Breedable Population II.1.5: District-wise In-milk Population II.1.6: District-wise Milch Population II.1.7: District-wise Male Population Sex Ratio in Dairy Animals II.2.1: District-wise Male-Female Ratio Wet-Dry Ratio of Dairy Animals II.3.1: District-wise Wet-Dry Ratio Livestock Density II.4.1: District-wise Density of Total Livestock and Bovine II.4.2: District-wise Density of Poultry and Small Ruminants Breed-wise Population II.5.1: District and Breed-wise Indigenous Cattle Population II.5.2: District-wise Male, Female and Milch Animals of Indigenous Breeds II.5.3: District-wise Exotic and Crossbred Cattle Population II.5.4: District-wise Male, Female and Milch Animals of Jersey and Holstein Friesian Crossbreds II.5.5: District-wise Male, Female and Milch Animals of Exotic and Other Crossbreds II.5.6: District and Breed-wise Buffalo Population II.5.7: District-wise Male, Female and Milch Animals of Murrah and Nili Ravi Breeds CATTLE AND BUFFALO BREEDS Distribution of Native Breeds of Punjab III.1.1: Distribution of Cattle Breeds of Punjab III.1.2: Distribution of Buffalo Breeds of Punjab Performance of Breeds III.2.1: Performance of Cattle and Buffalo Breeds MILK PRODUCTION Integrated Sample Survey (ISS) Figures: Animal Population IV.1.1: Year-wise In-milk Bovine Population, Milk Yield and Milk Production IV.1.2: Year and District-wise In-milk Bovine Population IV.1.3: Year and District-wise In-milk Indigenous Cattle Population IV.1.4: Year and District-wise In-milk Crossbred Cattle Population IV.1.5: Year and District-wise In-milk Buffalo Population ISS Figures: Milk Yield IV.2.1: Year and District-wise Bovine Milk Yield IV.2.2: Year and District-wise Indigenous Cattle Milk Yield IV.2.3: Year and District-wise Crossbred Cattle Milk Yield IV.2.4: Year and District-wise Buffalo Milk Yield... 63
5 IV.3. IV.4. IV.5. ISS Figures: Milk Production IV.3.1: Year and District-wise Bovine Milk Production IV.3.2: Year and District-wise Indigenous Cattle Milk Production IV.3.3: Year and District-wise Crossbred Cattle Milk Production IV.3.4: Year and District-wise Buffalo Milk Production IV.3.5: Year and District-wise Milk Production Density ISS Figures: Milk Availability IV.4.1: Year and District-wise Per Capita Milk Availability ISS Figures: Milk Utilisation IV.5.1: Milk Utilisation Pattern in Households ( to ) V. Veterinary Infrastructure And Service Delivery System V.1. Veterinary Infrastructure V.1.1: Year and District-wise Veterinary Institutes V.1.2: District-wise AI Centres Government Agencies V.1.3: Milk Union-wise AI Centres Cooperatives V.2. Service Delivery System - AIs V.2.1: District-wise AI Performed by Government Agencies Cattle V.2.2: District-wise AI Performed by Government Agencies Buffaloes V.2.3: District-wise AI Performed by Government Agencies Bovine V.2.4: Milk Union-wise AI Performed by Cooperatives Cattle V.2.5: Milk Union-wise AI Performed by Cooperatives Buffaloes V.2.6: Milk Union-wise AI Performed by Cooperatives Bovine V.3. Service Delivery System - Animal Health V.3.1: District-wise Vaccination Performed for Foot-and-Mouth Disease V.3.2: District-wise Vaccination Preformed for Haemorrhagic Septicaemia V.3.3: District-wise Vaccination Preformed for Black Quarter V.3.4: District-wise Bovine Vaccination V.3.5: District-wise Bovine Treated V.3.6: District-wise Bovine Castration VI: VI.1. VI.2. VI.3. VII: VII.1. VII.2. VII.3. VII.4. VII.5. VII.6. FEED RESOURCES Feed Resources - Fodder VI.1.1: Area under Fodder Crops and Gross Sown Area Feed Resources - Availability vs. Requirement VI.2.1: District-wise Dry Matter (DM) Availability, Requirement and Balance VI.2.2: District-wise Crude Protein (CP) Availability, Requirement and Balance VI.2.3: District-wise Total Digestive Nutrient (TDN) Availability, Requirement and Balance VI.2.4: Availability, Requirement and Surplus/Deficit of Feed Nutrients Feed Resources - Consumption VI.3.1: Feed and Fodder Consumption AGRICULTURE Agro-Climatic Zones VII.1.1: Details of Agro-climatic Zones Land Use Pattern VII.2.1: District-wise Land Use Pattern Area and Production VII.3.1: District-wise Area and Production of Cereals and Pulses VII.3.2: District-wise Area and Production of Food Grains and Oilseeds VII.3.3: District-wise Area and Production of Sugarcane and Cotton Land Holding VII.4.1: Operational Holdings in Punjab VII.4.2: Net Irrigated Area under Different Sources of Irrigation Rainfall VII.5.1: District- wise Average Annual Rainfall Ground Water Status VII.6.1: Distribution of Blocks According to Ground Water Status GLOSSARY

6 Part I : General Statistics This section contains relevant data on the overview of the state including structural trends in the state s economy, district-wise data on socio economic parameters and indicators for development infrastructure. Punjab has been a pioneer in agrarian economy. The state has made noteworthy progress in consolidation of land holding, land reclamation for agriculture, development of irrigation, usage of high yielding seed varieties, chemical fertilizers, insecticides and mechanical inputs. As per Census 2011, Punjab s human population was 27.7 million and more than half of the population resided in six districts viz. Ludhiana, Amritsar, Gurdaspur, Jalandhar, Firozpur, Patiala and the balance resided in the remaining districts. About 37 per cent of state s population resided in urban areas which was higher than national average of 32 per cent. Similarly, the per capita SDP in the state is higher than the GDP of the country. The share of agriculture and allied activities in the net state domestic product has declined from 34 per cent in to 22 per cent in at constant (real) price. However, contribution of agriculture in state SDP is one of the highest in India. The share of livestock in NSDP has also declined but not as steep as the share of agriculture sector. Milk is the main product of livestock sector accounting for nearly 80 per cent of the total value of output of livestock. The state of Punjab reported sex ratio of 893 females per 1,000 males as against national average of 940 females. The state s sex ratio in urban area is lower than that of rural area.
7 Part I : General Statistics I.1. Punjab at a Glance TABLE I.1.1: General Statistics: Punjab State vs. India Particulars Unit Year Punjab India State Geography & Rural Infrastructure Geographical Area 000 sq. km ,287.3 Districts nos Sub-Districts 77 5,924 Inhabited Villages Households million Rural Households ,796 1,37, ,358 1,68,565 Rural Households with Electricity 2001 % Rural Households with Tap water supply 2001 % Human Population Population million ,210.1 Urban (As % of total) % Rural (As % of total) Density of Population per sq. km Scheduled Castes (As % of total) % Scheduled Tribes (As % of total) Sex Ratio Ratio Literacy Rate (excluding population of 0 to 6 age group) Male % Female Urban Rural Per Capita Income (at current prices) ` ,783 69,585 Livestock Population million Bovine Indigenous Cattle Crossbred Cattle Buffaloes Small Ruminants Poultry Population
8 Part I : General Statistics I.1. Punjab at a Glance TABLE I.1.1: General Statistics: Punjab State vs. India Particulars Unit Year Punjab India Livestock Population million Bovine Indigenous Cattle Crossbred Cattle Buffaloes Small Ruminants Poultry Population Number of Cattle Breeds nos 2 30 Number of Buffalo Breeds 2 12 Livestock Production Milk Production - Total 000 MT ,724 1,32,431 Crossbred Cattle 2,782 32,384 Indigenous Cattle ,421 Buffaloes 6,575 67,675 Goats 63 4,950 Per Capita Milk Availability (estimated) gms/day Egg Production million 3,792 69,730 Estimated Meat Production 000 MT 212 5,948 Marine & Inland Fish Production 99 9,062 Wool Production 000 Kg ,055 Veterinary Infrastructure Veterinary Institutes nos ,852 57,724 Semen Stations AI Centers (Govt) ,824 77,765 Veterinary Services AI Done (Govt) ,213 41,165 Vaccination Done H.S. Vaccination ,257 B.Q. Vaccination FMD Vaccination ,446 Total Bovine 19,703 Treatment 5,369 Castration 16 Agricultural Resources Forest Cover % Pasture and Grazing Land 000 ha 4 10,301 As % of total reporting area % Area Under Fodder Crops 000 ha 540 7,769 As % of Gross Cropped Area %
9 Part I : General Statistics I.1. Punjab at a Glance TABLE I.1.1: General Statistics: Punjab State vs. India Particulars Unit Year Punjab India Cropping Intensity % Irrigation Intensity % Production of Major Crops Cereals 000 MT ,490 2,38,792 Pulses 14 18,342 Oilseeds 69 30,941 Sugarcane 5,919 3,41,199 Fodder Production/Availability MMT Ground Water Status (2009 vs 2004) Safe % of Blocks 2009 & (2004) 17 (18) 73 (71) Semi Critical 1 (3) 9 (10) Critical 2 (4) 3 (4) Over Exploited 80 (75) 14 (15) Salinity Affected 1(1) Sources: Census 2001 & 2011, Office of the Registrar General and Census Commissioner, Govt. of India, New Delhi. 18 th Livestock Census, Department of Animal Husbandry, Dairying and Fisheries, Ministry of Agriculture, Govt. of India. Minutes of the Meeting of Technical Committee on Direction for improvement of Animal Husbandry Statistics held during 4 th to 5 th July,2013, Department of Animal Husbandry, Dairying and Fisheries, Ministry of Agriculture, Govt. of India. Dynamic Ground Water Resources of India as on 31 st March, 2009, Central Ground Water Board, Ministry of Water Resources, Govt. of India. Directorate of Economics and Statistics, Ministry of Agriculture, Govt. of India. Ministry of Agriculture, Govt. of Punjab. Ministry of Statistics and Programme Implementation, Govt. of India. Basic Animal Husbandry and Fisheries Statistics, 2013, DAHD, Ministry of Agriculture, Govt. of India. Table I.1.2: Formation of Districts in Punjab New Districts Year of Formation Carved out of Barnala November, 2006 Sangrur Faridkot August, 1972 Bathinda Mansa April, 1992 Bathinda Moga November, 1995 Faridkot SAS Nagar (Mohali) April, 2006 Rupnagar (Ropar) & Patiala SBS Nagar (Nawanshahr) November, 1995 Hoshiarpur & Jalandhar Tarn Taran 2006 Amritsar Muktsar 1995 Firozpur Fatehgarh Sahib April, 1992 Patiala, Ludhiana, Rupnagar (Ropar) Pathankot 2013 Gurdaspur Fazilka 2013 Firozpur 4
10 Part I : General Statistics I.2. Social Statistics: Human Population Table I.2.1: Human Population by Residence and Sex 2001 Districts Rural ( 000) Urban ( 000) Total ( 000) Male Female Total Male Female Total Male Female Total PUNJAB 8,517 7,580 16,096 4,468 3,794 8,263 12,985 11,374 24,359 Amritsar , ,223 1,651 1,445 3,096 Bathinda ,183 Faridkot Fatehgarh Sahib Firozpur , ,746 Gurdaspur , , ,104 Hoshiarpur , ,481 Jalandhar , , ,963 Kapurthala Ludhiana , ,694 1,663 1,370 3,033 Mansa Moga Patiala , ,845 Rupnagar (Ropar) ,116 Sangrur , , ,000 SBS Nagar (Nawanshahr) Muktsar Source: Census 2001, Office of the Registrar General and Census Commissioner, Govt. of India, New Delhi. Barnala, SAS Nagar (Mohali), Fazilka, Pathankot & Tarn Taran were not formed in

11 Part I : General Statistics 6
12 Part I : General Statistics I.2. Social Statistics: Human Population Table I.2.2: Human Population by Residence and Sex 2011 Districts Rural ( 000) Urban ( 000) Total ( 000) Male Female Total Male Female Total Male Female Total PUNJAB 9,093 8,251 17,344 5,546 4,853 10,399 14,639 13,104 27,743 Amritsar , ,335 1,318 1,172 2,491 Barnala Bathinda ,389 Faridkot Fatehgarh Sahib Firozpur , , ,029 Gurdaspur , ,213 1,086 2,298 Hoshiarpur , ,587 Jalandhar , ,161 1,145 1,048 2,194 Kapurthala Ludhiana ,429 1, ,070 1,868 1,631 3,499 Mansa Moga Patiala , , ,896 Rupnagar (Ropar) Sangrur , ,655 SAS Nagar (Mohali) SBS Nagar (Nawanshahr) Muktsar Tarn Taran ,120 Source: Census 2011, Office of the Registrar General and Census Commissioner, Govt. of India, New Delhi. 7

13 Part I : General Statistics % Decadal Growth Rate of Population % Sex Ratio Population Density
14 Part I : General Statistics I.2. Social Statistics: Human Population Table I.2.3: District-wise SC and ST Population 2001 and 2011 Districts SC Population ( 000) ST Population ( 000) PUNJAB 7,029 8, Amritsar Barnala Bathinda Faridkot Fatehgarh Sahib Firozpur Gurdaspur Hoshiarpur Jalandhar Kapurthala Ludhiana Mansa Moga Patiala Rupnagar (Ropar) Sangrur SAS Nagar (Mohali) SBS Nagar (Nawanshahr) Muktsar Tarn Taran SC: Scheduled Caste, ST: Scheduled Tribe Source: Census 2001 and 2011, Office of the Registrar General and Census Commissioner, Govt. of India, New Delhi. 9
15 Part I : General Statistics Urbanisation (%) Literacy (%) Scheduled Caste Population (%)
16 Part I : General Statistics I.2. Social Statistics: Human Population Table I.2.4: Rural Households, Electricity and Tap Water Supply and 2011 Districts Rural Households ( 000) Rural Households with Electricity ( 000) Rural Households with Tap Water (inclusive treated & untreated) ( 000) PUNJAB 2,798 3,359 2,482 3, ,158 Amritsar Barnala Bathinda Faridkot Fatehgarh Sahib Firozpur Gurdaspur Hoshiarpur Jalandhar Kapurthala Ludhiana Mansa Moga Patiala Rupnagar (Ropar) Sangrur SAS Nagar (Mohali) SBS Nagar (Nawanshahr) Muktsar Tarn Taran Source: Census 2001 and 2011, Office of the Registrar General and Census Commissioner, Govt. of India, New Delhi. 11
17 Part I : General Statistics Rural Households Households with Electricity Households with Tap Water
18 Part I : General Statistics I.3. State Economy Table I.3.1: Net State Domestic Product (NSDP) and Per Capita Income At Current Prices (` crores) Sector State Domestic Product 86,108 95,902 1,13,013 1,35,706 1,54,827 1,76,187 2,02,020 2,32,524 2,64, Agriculture 28,368 31,041 35,594 43,128 49,514 54,028 59,392 65,690 72, Forestry & Logging 1,178 1,158 1,439 1,812 2,696 4,013 4,200 5,598 7, Fishing Agriculture & Allied* (1+2+3) 29,788 32,491 37,351 45,237 52,536 58,455 64,026 71,773 80,017 As % of NSDP Sub-total of Primary 29,806 32,510 37,371 45,260 52,579 58,478 64,047 71,801 80,047 As % of NSDP Sub-total of Secondary 19,789 22,966 28,914 36,475 39,223 45,897 51,384 58,031 65,363 As % of NSDP Services 36,513 40,426 46,727 53,971 63,025 71,812 86,589 1,02,692 1,19,128 As % of NSDP Per Capita Income (`) 33,103 36,199 41,883 49,380 55,315 61,805 69,580 78,633 88,783 Sector At Prices (` crores) State Domestic Product 86,108 90,330 1,00,072 1,08,738 1,14,766 1,22,097 1,29,983 1,37,103 1,44, Agriculture 28,368 28,513 29,282 30,355 30,907 30,506 30,847 31,101 31, Forestry & Logging 1,178 1,217 1,250 1,280 1,330 1,375 1,416 1,466 1, Fishing Agriculture & Allied* (1+2+3) 29,788 29,996 30,798 31,875 32,500 32,170 32,554 32,860 32,986 As % of NSDP Sub-total of Primary 29,806 30,014 30,816 31,898 32,524 32,193 32,579 32,886 33,013 As % of NSDP Sub-total of Secondary 19,789 21,649 27,283 31,822 32,987 36,353 38,699 39,975 41,416 As % of NSDP Services 36,513 38,666 41,972 45,019 49,255 53,552 58,706 64,242 69,809 As % of NSDP Per Capita Income (`) 33,103 34,096 37,087 39,567 41,003 42,831 44,769 46,364 48,409 * Includes Livestock, Forestry & Fisheries. Source: Ministry of Statistics and Programme Implementation, Govt. of India. 13

19 Part I : General Statistics 14
20 Part I : General Statistics I.3. State Economy TABLE I.3.2: Value of Output: Agriculture and Livestock Item Value of Output at Current Prices (` billion) Agriculture & Allied* Agriculture Livestock Share of Value of Output to Agriculture and Allied* (%) Agriculture Livestock Value of Output at Constant Prices (` billion) ( ) Agriculture & Allied* Agriculture Livestock Share of Value of Output to Agriculture and Allied* (%) Agriculture Livestock Value of Livestock Output at Current Prices (` billion) Milk Meat Egg Dung Others^ Share of Livestock Output at Current Prices (%) Milk Meat Egg Dung Others^ Value of Livestock Output at Constant Prices (` billion) ( ) Milk Meat Egg Dung Others^ Share of Livestock Output at Constant Prices (%) Milk Meat Egg Dung Others^ * Includes Livestock, Forestry & Fisheries. ^Includes Wool and Hair, Silkworm Cocoons & Honey, Increment in Stock. Source: Ministry of Statistics and Programme Implementation, Govt. of India. 15
21 Part I : General Statistics I.3. State Economy TABLE I.3.3: Budget Provision of different schemes run by Animal Husbandry Department, Punjab Schemes Budget Provision (` in lakh) Direction & Administration 14,495 16,508 19,615 26,008 Veterinary Education Training 2,500 2,500 4,685 5,075 Veterinary Education & Animal Health 2,266 1,802 3,014 3,317 Cattle and Buffalo Development Poultry Development Piggery Development Sheep & Wool Development Other Livestock Development Feed & Fodder Development Investigation and Statistics Special Component Plan 148 1, Total 19,439 21,068 29,639 35,270 Source: Annual Administrative Report, Animal Husbandry Department, Punjab. TABLE I.3.4: Rashtriya Krishi Vikas Yojana (Animal Husbandry Department) Amount Release / Expenditure Budget Provision (` in lakh) Amount Released , , , , Expenditure Incurred , , , , Source: Annual Administrative Report, Animal Husbandry Department, Punjab. 16

22 Part II : Livestock Census This section contains district wise data on the population of indigenous cattle, crossbred cattle and buffaloes. The 19 th Livestock Census shows an overall increase of 10.9 per cent in the total Bovine population in Punjab as compared to the previous census of While crossbred cattle and buffaloes have shown 37 and 2 per cent increase in population, indigenous cattle has declined by 27 per cent. The number of milch animals (Cattle & Buffaloes) has increased by 8 per cent from 3.6 million to 3.9 million. The number of in-milk Bovine have increased by 7.7 per cent from 2.67 million to 2.88 million. At the time of publication of this document, district-wise figures of 19 th Livestock Census 2012 were unavailable for the state of Punjab. The contents would be revised and uploaded on NDDB s Knowledge Portal in due course of time.
23 Part II : Livestock Census II.1. Animal Population TABLE II.1.1: Summary of Livestock Census (1992 to 2012) - Punjab Population Total Bovine 80,72,608 88,08,537 80,33,078 68,38,491 75,87,438 Total Cattle 23,08,596 26,37,861 20,38,543 17,76,937 24,27,714 Total Exotic/Crossbred Cattle 15,03,306 18,28,125 15,30,517 12,78,447 20,64,629 Female 11,31,906 14,30,458 12,56,780 10,76,692 18,23,801 under 1 year 2,31,460 2,31,744 2,04,022 1,75,150 3,20,642 1 to 2.5 years 2,11,920 2,29,864 2,60,012 1,79,902 3,21,571 Over 2.5 years 6,88,526 9,68,850 7,92,746 7,21,640 11,81,588 In-milk 4,07,606 6,31,135 5,66,755 5,12,612 8,58,453 Dry 1,86,120 2,35,211 1,73,861 1,70,459 2,75,645 Milch 5,93,726 8,66,346 7,40,616 6,83,071 11,34,098 Not Calved Even Once 87,900 94,367 41,108 30,977 38,334 Others 6,900 8,137 11,022 7,592 9,156 Males 3,71,400 3,97,667 2,73,737 2,01,755 2,40,828 Total Indigenous Cattle 8,05,290 8,09,736 5,08,026 4,98,490 3,63,085 Female 6,60,690 4,83,065 2,19,042 2,72,002 1,69,519 under 1 year 1,07,480 81,526 35,753 47,125 26,650 1 to 3 years 99,960 72,606 40,718 43,544 27,676 Over 3 years 4,53,250 3,28,933 1,42,571 1,81,333 1,15,193 In-milk 2,61,420 1,97,287 86,283 1,14,831 60,415 Dry 1,23,480 90,145 37,542 51,661 42,371 Milch 3,84,900 2,87,432 1,23,825 1,66,492 1,02,786 Not Calved Even Once 64,250 37,507 11,825 11,346 8,229 Others 4,100 3,994 6,921 3,495 4,178 Males 1,44,600 3,26,671 2,88,984 2,26,488 1,93,566 Total Buffaloes 57,64,012 61,70,676 59,94,535 50,61,554 51,59,724 Female 52,86,112 54,17,470 53,97,709 45,44,616 46,26,023 under 1 year 9,15,900 8,59,147 9,31,852 7,93,687 8,69,824 1 to 3 years 7,74,889 8,06,208 11,84,229 8,02,713 9,51,670 Over 3 years 35,95,323 37,52,115 32,81,628 29,48,216 28,04,529 In-milk 22,73,360 24,57,373 23,95,901 20,45,446 19,60,013 Dry 8,93,380 9,40,559 7,10,492 7,33,911 7,29,193 Milch 31,66,740 33,97,932 31,06,393 27,79,357 26,89,206 Not Calved Even Once 4,01,583 3,28,649 1,72,462 1,33,827 97,728 Others 27,000 25,534 2,773 35,032 17,595 Males 4,77,900 7,53,206 5,96,826 5,16,938 5,33,701 Source: 15 th, 16 th, 17 th, 18 th and 19 th Livestock Census, Department of Animal Husbandry, Dairying and Fisheries, Ministry of Agriculture, Govt. of India. 18
24 Part II : Livestock Census II.1. Animal Population Table II.1.2: District-wise Total Bovine Population Districts Indigenous Cattle ( 000) Crossbred Cattle ( 000) Buffalo ( 000) PUNJAB ,503 1,828 1,531 1,278 5,764 6,171 5,995 5,062 Amritsar Barnala Bathinda Faridkot Fatehgarh Sahib Firozpur Gurdaspur Hoshiarpur Jalandhar * Kapurthala Ludhiana Mansa Moga Patiala Rupnagar (Ropar) Sangrur SAS Nagar (Mohali) SBS Nagar (Nawanshahr) Muktsar Tarn Taran Source: 15 th, 16 th, 17 th and 18 th Livestock Census, Department of Animal Husbandry, Dairying and Fisheries, Ministry of Agriculture, Govt. of India. * Negligible. 19
25 Part II : Livestock Census II.1. Animal Population TABLE II.1.3: District-wise Female Population Districts Indigenous Cattle ( 000) Crossbred Cattle ( 000) Buffalo ( 000) PUNJAB ,132 1,430 1,257 1,077 5,286 5,417 5,398 4,545 Amritsar Barnala Bathinda Faridkot Fatehgarh Sahib Firozpur Gurdaspur Hoshiarpur Jalandhar * Kapurthala Ludhiana Mansa Moga Patiala Rupnagar (Ropar) Sangrur SAS Nagar (Mohali) SBS Nagar (Nawanshahr) Muktsar Tarn Taran Source: 15 th, 16 th, 17 th and 18 th Livestock Census, Department of Animal Husbandry, Dairying and Fisheries, Ministry of Agriculture, Govt. of India. * Negligible. 20
26 Part II : Livestock Census II.1. Animal Population TABLE II.1.4: District-wise Breedable Population Districts Indigenous Cattle ( 000) Crossbred Cattle ( 000) Buffalo ( 000) PUNJAB , ,983 4,155 3,874 3,350 Amritsar Barnala Bathinda Faridkot Fatehgarh Sahib Firozpur Gurdaspur Hoshiarpur Jalandhar * Kapurthala Ludhiana Mansa Moga Patiala Rupnagar (Ropar) Sangrur SAS Nagar (Mohali) SBS Nagar (Nawanshahr) Muktsar Tarn Taran Source: 15 th, 16 th, 17 th and 18 th Livestock Census, Department of Animal Husbandry, Dairying and Fisheries, Ministry of Agriculture, Govt. of India. * Negligible. 21

27 Part II : Livestock Census 22
28 Part II : Livestock Census II.1. Animal Population TABLE II.1.5: District-wise In-milk Population Districts Indigenous Cattle ( 000) Crossbred Cattle ( 000) Buffalo ( 000) PUNJAB ,273 2,457 2,396 2,045 Amritsar Barnala Bathinda Faridkot Fatehgarh Sahib Firozpur Gurdaspur Hoshiarpur Jalandhar * Kapurthala Ludhiana Mansa Moga Patiala Rupnagar (Ropar) Sangrur SAS Nagar (Mohali) SBS Nagar (Nawanshahr) Muktsar Tarn Taran Source: 15 th, 16 th, 17 th and 18 th Livestock Census, Department of Animal Husbandry, Dairying and Fisheries, Ministry of Agriculture, Govt. of India. * Negligible. 23
29 Part II : Livestock Census II.1. Animal Population TABLE II.1.6: District-wise Milch Population Districts Indigenous Cattle ( 000) Crossbred Cattle ( 000) Buffalo( 000) PUNJAB ,167 3,398 3,106 2,779 Amritsar Barnala Bathinda Faridkot Fatehgarh Sahib Firozpur Gurdaspur Hoshiarpur Jalandhar * Kapurthala Ludhiana Mansa Moga Patiala Rupnagar (Ropar) Sangrur SAS Nagar (Mohali) SBS Nagar (Nawanshahr) Muktsar Tarn Taran Source: 15 th, 16 th, 17 th and 18 th Livestock Census, Department of Animal Husbandry, Dairying and Fisheries, Ministry of Agriculture, Govt. of India. * Negligible. 24
30 Part II : Livestock Census II.1. Animal Population TABLE II.1.7: District-wise Male Population Districts Indigenous Cattle ( 000) Crossbred Cattle ( 000) Buffalo ( 000) PUNJAB Amritsar Barnala Bathinda Faridkot Fatehgarh Sahib Firozpur Gurdaspur Hoshiarpur Jalandhar * Kapurthala Ludhiana Mansa Moga Patiala Rupnagar (Ropar) Sangrur SAS Nagar (Mohali) SBS Nagar (Nawanshahr) Muktsar Tarn Taran Source: 15 th, 16 th, 17 th and 18 th Livestock Census, Department of Animal Husbandry, Dairying and Fisheries, Ministry of Agriculture, Govt. of India. * Negligible. 25
31 Part II : Livestock Census II.2. Sex Ratio in Dairy Animals TABLE II.2.1: District-wise Male-Female Ratio Districts Indigenous Cattle (%) Crossbred Cattle (%) Buffalo (%) PUNJAB Amritsar Barnala Bathinda Faridkot Fatehgarh Sahib Firozpur Gurdaspur Hoshiarpur Jalandhar Kapurthala Ludhiana Mansa Moga Patiala Rupnagar (Ropar) Sangrur SAS Nagar (Mohali) SBS Nagar (Nawanshahr) Muktsar Tarn Taran Source: Estimated from 15 th, 16 th, 17 th and 18 th Livestock Census, Department of Animal Husbandry, Dairying and Fisheries, Ministry of Agriculture, Govt. of India. 26
32 Part II : Livestock Census II.3. Wet-Dry Ratio of Dairy Animals TABLE II.3.1: District-wise Wet-Dry Ratio Districts Indigenous Cattle (%) Crossbred Cattle (%) Buffalo (%) PUNJAB Amritsar Barnala Bathinda Faridkot Fatehgarh Sahib Firozpur Gurdaspur Hoshiarpur Jalandhar Kapurthala Ludhiana Mansa Moga Patiala Rupnagar (Ropar) Sangrur SAS Nagar (Mohali) SBS Nagar (Nawanshahr) Muktsar Tarn Taran Source: Estimated from 15 th, 16 th, 17 th and 18 th Livestock Census, Department of Animal Husbandry, Dairying and Fisheries, Ministry of Agriculture, Govt. of India. 27

33 Part II : Livestock Census 28
34 Part II : Livestock Census II.4. Livestock Density TABLE II.4.1: District-wise Density of Total Livestock and Bovine Districts Livestock (No. per sq km) Bovine (No. per sq km) PUNJAB Amritsar Barnala Bathinda Faridkot Fatehgarh Sahib Firozpur Gurdaspur Hoshiarpur Jalandhar Kapurthala Ludhiana Mansa Moga Patiala Rupnagar (Ropar) Sangrur SAS Nagar (Mohali) SBS Nagar (Nawanshahr) Muktsar Tarn Taran Source: Estimated from 15 th, 16 th, 17 th and 18 th Livestock Census, Department of Animal Husbandry, Dairying and Fisheries, Ministry of Agriculture, Govt. of India. 29
35 Part II : Livestock Census II.4. Livestock Density TABLE II.4.2: District-wise Density of Poultry and Small Ruminants Districts Poultry (No. per Sq km) Small Ruminants (No. Per Sq km) PUNJAB Amritsar Barnala 73 8 Bathinda Faridkot Fatehgarh Sahib Firozpur Gurdaspur , Hoshiarpur Jalandhar Kapurthala Ludhiana Mansa Moga Patiala Rupnagar (Ropar) Sangrur SAS Nagar (Mohali) 12 SBS Nagar (Nawanshahr) Muktsar Tarn Taran Source: Estimated from 15 th, 16 th, 17 th and 18 th Livestock Census, Department of Animal Husbandry, Dairying and Fisheries, Ministry of Agriculture, Govt. of India. 30
36 Part II : Livestock Census II.5. Breed-wise Population TABLE II.5.1: District and Breed-wise Indigenous Cattle Population 2007 Districts Indigenous Cattle ( 000) Sahiwal Hariana Non-descript and Other Graded Total indigenous Cattle PUNJAB Amritsar Barnala Bathinda Faridkot Fatehgarh Sahib Firozpur Gurdaspur Hoshiarpur Jalandhar 0 0 0* 0* Kapurthala Ludhiana Mansa Moga Patiala Rupnagar (Ropar) Sangrur SAS Nagar (Mohali) SBS Nagar (Nawanshahr) Muktsar Tarn Taran Source: 18 th Livestock Census, Department of Animal Husbandry, Dairying and Fisheries, Ministry of Agriculture, Govt. of India. * Negligible. 31
37 Part II : Livestock Census II.5. Breed-wise Population TABLE II.5.2: District-wise Male, Female and Milch Animals of Indigenous Breeds 2007 Districts Sahiwal ( 000) Hariana ( 000) Male Female Milch Male Female Milch PUNJAB Amritsar Barnala 0* Bathinda Faridkot Fatehgarh Sahib 0* Firozpur Gurdaspur Hoshiarpur Jalandhar * 0 0 Kapurthala 0* * 0* Ludhiana Mansa Moga Patiala Rupnagar (Ropar) Sangrur SAS Nagar (Mohali) SBS Nagar (Nawanshahr) 0* 0* 0* Muktsar Tarn Taran Source: 18 th Livestock Census, Department of Animal Husbandry, Govt. of Punjab ( Accessed on 9 th January, * Negligible. 32
38 Part II : Livestock Census II.5. Breed-wise Population TABLE II.5.3: District-wise Exotic and Crossbred Cattle Population 2007 Districts Jersey exotic and crossbred Exotic and Crossbred Cattle ( 000) Holstein Friesian exotic and crossbred Other exotic and crossbred Total exotic and crossbred cattle PUNJAB ,278.4 Amritsar Barnala 0* Bathinda Faridkot Fatehgarh Sahib Firozpur Gurdaspur Hoshiarpur Jalandhar Kapurthala Ludhiana Mansa Moga Patiala Rupnagar (Ropar) Sangrur SAS Nagar (Mohali) SBS Nagar (Nawanshahr) Muktsar Tarn Taran Source: 18 th Livestock Census, Department of Animal Husbandry, Dairying and Fisheries, Ministry of Agriculture, Govt. of India. 33

39 Part II : Livestock Census 34
40 Part II : Livestock Census II.5. Breed-wise Population TABLE II.5.4: District-wise Male, Female and Milch Animals of Jersey and Holstein Friesian Crossbreds 2007 Districts Jersey Crossbred ( 000) Holstein Friesian Crossbred ( 000) Male Female Milch Male Female Milch PUNJAB Amritsar Barnala 0* Bathinda Faridkot Fatehgarh Sahib Firozpur Gurdaspur Hoshiarpur Jalandhar Kapurthala Ludhiana Mansa Moga Patiala Rupnagar (Ropar) Sangrur SAS Nagar (Mohali) SBS Nagar (Nawanshahr) Muktsar Tarn Taran Source: 18 th Livestock Census, Department of Animal Husbandry, Govt. of Punjab ( Accessed on 9 th January,
41 Part II : Livestock Census II.5. Breed-wise Population TABLE II.5.5: District-wise Male, Female and Milch Animals of Exotic and Other Crossbreds 2007 Districts Exotic ( 000) Others Crossbred ( 000) Male Female Milch Male Female Milch PUNJAB Amritsar Barnala 0* Bathinda Faridkot 0* Fatehgarh Sahib Firozpur Gurdaspur Hoshiarpur Jalandhar 0* 0* 0* Kapurthala 0* Ludhiana 0* Mansa Moga Patiala Rupnagar (Ropar) 0* Sangrur SAS Nagar (Mohali) 0* SBS Nagar (Nawanshahr) Muktsar 0 0* 0* Tarn Taran Source: 18 th Livestock Census, Department of Animal Husbandry, Govt. of Punjab ( Accessed on 9 th January, *Negligible. 36
42 Part II : Livestock Census II.5. Breed-wise Population TABLE II.5.6: District and Breed-wise Buffalo Population 2007 Districts Buffalo Breed Population ( 000) Murrah Nili Ravi Graded Buffalo Non-descript Total Buffalo PUNJAB , ,061.1 Amritsar Barnala * Bathinda Faridkot Fatehgarh Sahib Firozpur Gurdaspur Hoshiarpur Jalandhar Kapurthala Ludhiana Mansa Moga Patiala Rupnagar (Ropar) Sangrur SAS Nagar (Mohali) SBS Nagar (Nawanshahr) Muktsar Tarn Taran Source: 18 th Livestock Census, Department of Animal Husbandry, Dairying and Fisheries, Ministry of Agriculture, Govt. of India. 37
43 Part II : Livestock Census II.5. Breed-wise Population TABLE II.5.7: District-wise Male, Female and Milch Animals of Murrah and Nili Ravi Breeds 2007 Districts Murrah ( 000) Nili Ravi ( 000) Male Female Milch Male Female Milch PUNJAB Amritsar Barnala Bathinda Faridkot Fatehgarh Sahib Firozpur Gurdaspur Hoshiarpur Jalandhar Kapurthala Ludhiana Mansa Moga Patiala Rupnagar (Ropar) Sangrur SAS Nagar (Mohali) SBS Nagar (Nawanshahr) Muktsar Tarn Taran Source: 18 th Livestock Census, Department of Animal Husbandry, Govt. of Punjab ( Accessed on 9 th January,

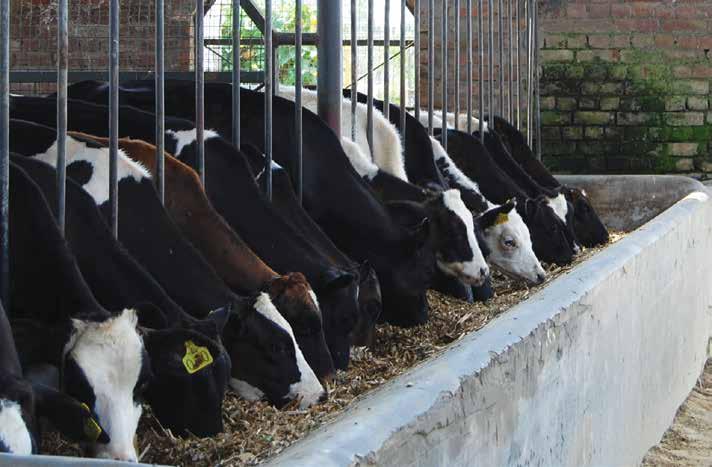
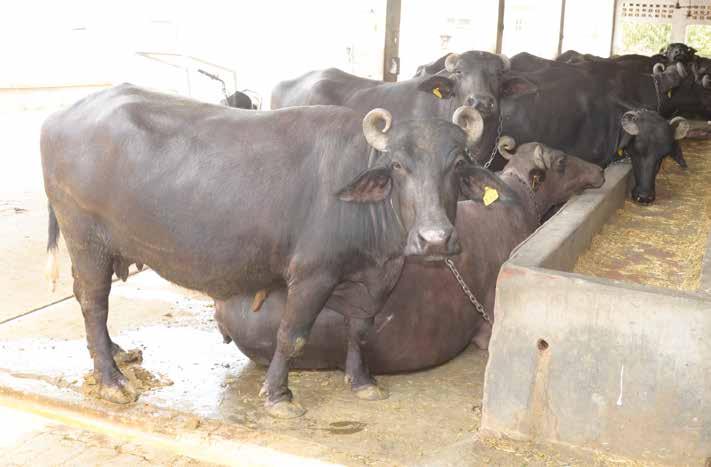
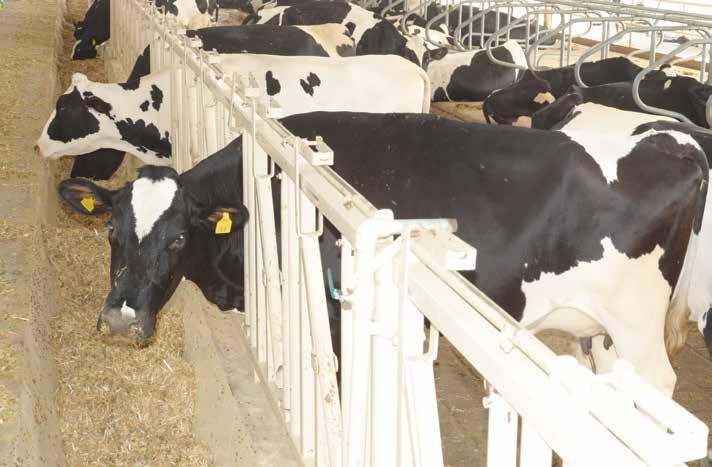
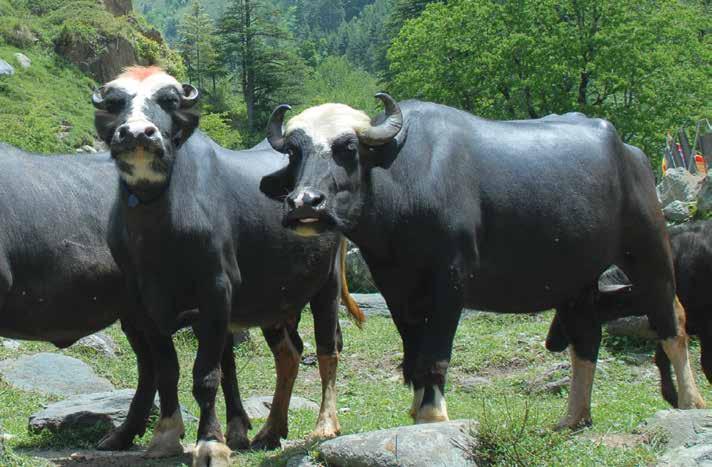
44 Part III : Cattle and buffalo Breeds This section provides a brief profile of important descript breeds that are native of Punjab. Out of the recognised cattle breeds in India, two breeds Sahiwal and Hariana have their native tracts and have significant presence in Punjab. While both are popular for their milk production, Sahiwal is considered as one of the best milch cattle breed in the country. Sahiwal breed is concentrated in western Punjab viz. Firozpur, Gurdaspur, Ludhiana and Muktsar; whereas Hariana cattle breed is available in Sangrur, Bathinda, Mansa and Ludhiana region. There are large numbers of farmers who maintain exotic and crossbred animals in commercial dairy farms. Out of the 12 recognised buffalo breeds in India, two breeds Murrah and Nili Ravi have their native tracts in Punjab. They are distributed across the state and are known for high productivity in the country

45 Part III : Cattle and buffalo Breeds III.1. Distribution of Native Breeds of Punjab TABLE III.1.1: Distribution of Cattle Breeds of Punjab Breed Breeding Tract Utility Distribution Sahiwal Sahiwal district of Pakistan Milch Mainly found in Firozpur, Muktsar, Ludhiana, Bathinda, Gurdaspur, Amritsar, Sangrur and Moga districts. Scattered distribution in rest of the districts. Hariana Rohtak, Hisar, Jind and Dual Mainly found in Sangrur, Bathinda, Mansa, Ludhiana, Barnala and Gurgaon districts of Haryana Muktsar. Scattered Distribution across other districts. Source: AE Nivsarkar et al., (2000), Animal Genetic Resources of India, Cattle and Buffalo, ICAR publication. 40


46 Part III : Cattle and buffalo Breeds Distribution of Indigenous Cattle Breeds Sahiwal Hariana 41


47 Part III : Cattle and buffalo Breeds Distribution of Crossbred Cattle Breeds HF Crossbred Jersey Crossbred 42

48 Part III : Cattle and buffalo Breeds III.1. Distribution of Native Breeds of Punjab TABLE III.1.2: Distribution of Buffalo Breeds of Punjab Breeds Breeding Tract Utility Distribution Murrah Southern part of Haryana-Rohtak, Jind, Hisar and Gurgaon districts Milch Across all districts of Punjab. Nili Ravi All along sutlej river on Indo-Pak border Milch Largely found in Firozpur, Gurdaspur, Sangrur, Hoshiarpur, Amritsar, Jalandhar, Patiala, Tarn Taran, Rupnagar, Ludhiana; scattered distribution in all other districts. Source: AE Nivsarkar et al., (2000), Animal Genetic Resources of India, Cattle and Buffalo, ICAR publication. 43

49 Part III : Cattle and buffalo Breeds Distribution of Buffalo Breeds Nili Ravi Murrah 44
50 Part III : Cattle and buffalo Breeds III.2. Performance of Breeds Parameters TABLE III.2.1: Performance of Cattle and Buffalo Breeds Cattle Hariana Sahiwal Jersey Crossbred HF Crossbred Breed population ( 000) Colour White/Light Grey Reddish dun/ Pale red, brown with white spots Body Weight (kg) Female: 325 Male: 499 Average Daily milk yield (kg) Female: 298 Male: 540 Light grey to brown Black and White Lactation Production (kg) 693-1,754 (Average: 996) Lactation length (days) (Average: 272) Age at First Calving (days) 1,067-1,809 (Average: 1,566) Calving Interval (days) (Average: 482) 1,600-2,750 (Average: 2,325) (Average: 318) 940-1,520 (Average: 1,183) (Average: 450) 1,722-3,476 3,926-4, ,260 1,320-1,680 Fat (%) Parameters Buffalo Nili Ravi Breed population ( 000) Murrah Colour Body Weight (kg) Black brown with white marking on forehead, face, muzzle, legs and tails Female: 454 Male: 567 Jet Black Female: 516 Male: 567 Average Daily milk yield (kg) Lactation Production (kg) 1,586-1,929 (Average: 1,850) 1,003-2,057 (Average: 1,751) Lactation length (days) (Average: 294) (Average: 299) Age at First Calving (days) 1,216-1,617 (Average: 1,359) 1,214-1,647 (Average: 1,319) Calving Interval (days) (Average: 487) (Average: 453) Fat (%) Source: AE Nivsarkar et al., (2000), Animal Genetic Resources of India, Cattle and Buffalo, ICAR publication. Annual Administrative Report , Department of Animal Husbandry, Govt. of Punjab. Note: Jerssy and HF Crossbred population inclues exotic animal population. 45


51 Part III : Cattle and buffalo Breeds 46

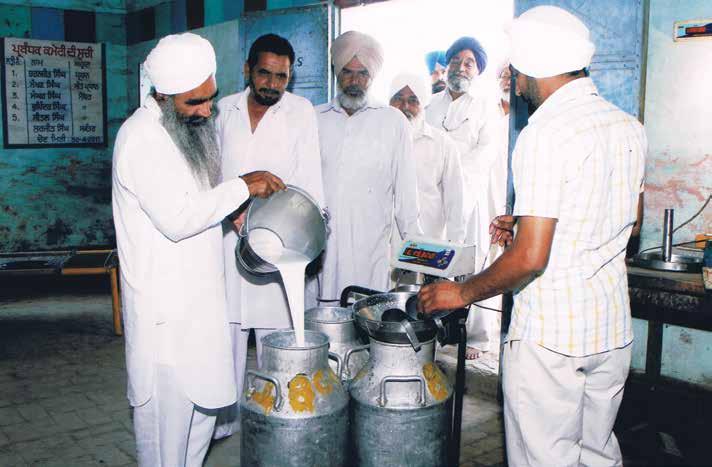
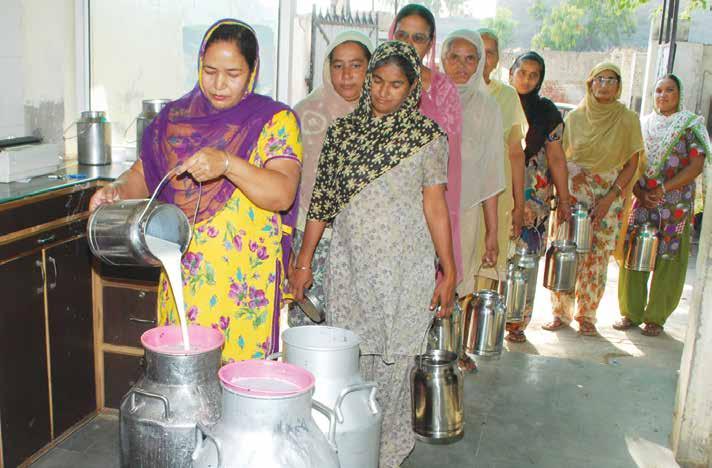
52 Part IV : Milk Production This section contains district wise information on milk production, in-milk animals and productivity. The chapter also includes information on milk production density, per capita availability and milk utilisation pattern. Milk production in Punjab has doubled during the last two decades from around 5.3 million tonnes in to 9.7 million tonnes in which is around 7.3 per cent of the country s milk production. Production increased at an annual average rate of 3 per cent during this period. The share of buffaloes, crossbred cattle and indigenous cattle to total milk production was 73, 23 and 4 per cent respectively in , which changed to 68, 29 and 3 per cent respectively in Bovine productivity is the highest in Punjab. It has increased at annual rate of 2.2 per cent during the last two decades. Milk yield of crossbred cattle was about 11.0 kg/day, buffalo 8.6 kg/day and indigenous cattle 6.5 kg/day in The per capita availability of milk in the state was highest in the country. Within the state, per capita milk availability was highest in Tarn Taran district, followed by Fatehgarh Sahib, Sangrur and Moga districts. Punjab dairy farmers sell about 55 per cent of milk produced while rest is kept for home consumption and conversion into dairy products.
53 Part IV : Milk Production IV.1. Integrated Sample Survey (ISS) Figures: Animal Population Table IV.1.1: Year-wise In-milk Bovine Population, Milk Yield and Milk Production Year In-milk Bovine ( 000) Milk Yield (kg) Bovine Milk Production ( 000 MT) , , , , , , , , , , , , , , , , , , , , , , , , , , , , , , , , , , , , , , , , , , , ,666 Source: Integrated Sample Survey Reports ( to ), Animal Husbandry Department, Govt. of Punjab. 48
54 Part IV : Milk Production IV.1. ISS Figures: Animal Population TABLE IV.1.2: Year and District-wise In-milk Bovine Population Districts In-milk Bovine Population ( 000) PUNJAB 2,783 3,004 3,283 3,177 2,886 2,883 2,834 2,852 2,905 Amritsar Barnala Bathinda Faridkot Fatehgarh Sahib Firozpur Gurdaspur Hoshiarpur Jalandhar Kapurthala Ludhiana Mansa Moga Patiala Rupnagar (Ropar) Sangrur SAS Nagar (Mohali) SBS Nagar (Nawanshahr) Muktsar Tarn Taran Source: Integrated Sample Survey Reports ( to ), Animal Husbandry Department, Govt. of Punjab. 49

55 Part IV : Milk Production 50
56 Part IV : Milk Production IV.1. ISS Figures: Animal Population TABLE IV.1.3: Year and District-wise In-milk Indigenous Cattle Population Districts In-milk Indigenous Cattle Population ( 000) PUNJAB Amritsar Barnala Bathinda Faridkot Fatehgarh Sahib Firozpur Gurdaspur Hoshiarpur Jalandhar Kapurthala Ludhiana Mansa Moga Patiala Rupnagar (Ropar) Sangrur SAS Nagar (Mohali) SBS Nagar (Nawanshahr) Muktsar Tarn Taran Source: Integrated Sample Survey Reports ( to ), Animal Husbandry Department, Govt. of Punjab. 51
57 Part IV : Milk Production District-wise In-Milk Indigenous Cattle Population
58 Part IV : Milk Production IV.1. ISS Figures: Animal Population TABLE IV.1.4: Year and District-wise In-milk Crossbred Cattle Population Districts In-milk Crossbred Cattle Population ( 000) PUNJAB Amritsar Barnala Bathinda Faridkot Fatehgarh Sahib Firozpur Gurdaspur Hoshiarpur Jalandhar Kapurthala Ludhiana Mansa Moga Patiala Rupnagar (Ropar) Sangrur SAS Nagar (Mohali) SBS Nagar (Nawanshahr) Muktsar Tarn Taran Source: Integrated Sample Survey Reports ( to ), Animal Husbandry Department, Govt. of Punjab. 53
59 Part IV : Milk Production District-wise In-Milk Crossbred Cattle Population
60 Part IV : Milk Production IV.1. ISS Figures: Animal Population TABLE IV.1.5: Year and District-wise In-milk Buffalo Population Districts In-milk Buffalo Population ( 000) Punjab 2,091 2,193 2,522 2,381 2,041 2,036 2,011 2,028 2,084 Amritsar Barnala Bathinda Faridkot Fatehgarh Sahib Firozpur Gurdaspur Hoshiarpur Jalandhar Kapurthala Ludhiana Mansa Moga Patiala Rupnagar (Ropar) Sangrur SAS Nagar (Mohali) SBS Nagar (Nawanshahr) Muktsar Tarn Taran SOURCE: Integrated Sample Survey Reports ( to ), Animal Husbandry Department, Govt. of Punjab. 55
61 Part IV : Milk Production District-wise In-Milk Buffalo Population
62 Part IV : Milk Production IV.2. ISS Figures: Milk Yield TABLE IV.2.1: Year and District-wise Bovine Milk Yield Districts Bovine Milk Yield (kg/day) PUNJAB Amritsar Barnala Bathinda Faridkot Fatehgarh Sahib Firozpur Gurdaspur Hoshiarpur Jalandhar Kapurthala Ludhiana Mansa Moga Patiala Rupnagar (Ropar) Sangrur SAS Nagar (Mohali) SBS Nagar (Nawanshahr) Muktsar Tarn Taran Source: Integrated Sample Survey Reports ( to ), Animal Husbandry Department, Govt. of Punjab. 57

63 Part IV : Milk Production 58
64 Part IV : Milk Production IV.2. ISS Figures: Milk Yield TABLE IV. 2.2: Year and District-wise Indigenous Cattle Milk Yield Districts Indigenous cattle Milk Yield (kg/day) PUNJAB Amritsar Barnala Bathinda Faridkot Fatehgarh Sahib Firozpur Gurdaspur Hoshiarpur Jalandhar Kapurthala Ludhiana Mansa Moga Patiala Rupnagar (Ropar) Sangrur SAS Nagar (Mohali) SBS Nagar (Nawanshahr) Muktsar Tarn Taran SOURCE: Integrated Sample Survey Reports ( to ), Animal Husbandry Department, Govt. of Punjab. 59
65 Part IV : Milk Production District-wise Indigenous Cattle Milk Yield
66 Part IV : Milk Production IV.2. ISS: Milk Yield TABLE IV.2.3: Year and District-wise Crossbred Cattle Milk Yield Districts Crossbred Cattle Milk Yield (kg/day) PUNJAB Amritsar Barnala Bathinda Faridkot Fatehgarh Sahib Firozpur Gurdaspur Hoshiarpur Jalandhar Kapurthala Ludhiana Mansa Moga Patiala Rupnagar (Ropar) Sangrur SAS Nagar (Mohali) SBS Nagar (Nawanshahr) Muktsar Tarn Taran SOURCE: Integrated Sample Survey Reports ( to ), Animal Husbandry Department, Govt. of Punjab. 61
67 Part IV : Milk Production District-wise Crossbred Cattle Milk Yield
68 Part IV : Milk Production IV.2. ISS Figures: Milk Yield TABLE IV.2.4: Year and District-wise Buffalo Milk Yield Districts Buffalo Milk Yield (kg/day) PUNJAB Amritsar Barnala Bathinda Faridkot Fatehgarh Sahib Firozpur Gurdaspur Hoshiarpur Jalandhar Kapurthala Ludhiana Mansa Moga Patiala Rupnagar (Ropar) Sangrur SAS Nagar (Mohali) SBS Nagar (Nawanshahr) Muktsar Tarn Taran SOURCE: Integrated Sample Survey Reports ( to ), Animal Husbandry Department, Govt. of Punjab. 63

69 Part IV : Milk Production District-wise Buffalo Milk Yield
70 Part IV : Milk Production Punjab s Milk Production (MMT) (Change due to no. of in-milk animals & average yield) Bovine Buffalo Milk production in base year Increase in total production due to change in numbers of in milk animals. Increase in total milk production due to change in average yield (kg/in-milk animal per day). Total milk production. 65
71 Part IV : Milk Production Punjab s Milk Production (MMT) (Change due to no. of in-milk animals & average yield) Crossbred Cattle Indigenous Cattle Milk production in base year Increase in total production due to change in numbers of in milk animals. Increase in total milk production due to change in average yield (kg/in-milk animal per day). Total milk production. 66
72 Part IV : Milk Production IV.3. ISS Figures: Milk Production TABLE IV.3.1: Year and District-wise Bovine Milk Production Districts Bovine Milk Production ( 000 MT) PUNJAB 5,926 7,104 8,323 9,255 9,349 9,371 9,357 9,491 9,666 Amritsar , Barnala Bathinda Faridkot Fatehgarh Sahib Firozpur Gurdaspur Hoshiarpur Jalandhar Kapurthala Ludhiana ,083 1,202 1,205 1, ,050 Mansa Moga Patiala Rupnagar (Ropar) Sangrur SAS Nagar (Mohali) SBS Nagar (Nawanshahr) Muktsar Tarn Taran SOURCE: Integrated Sample Survey Reports ( to ), Animal Husbandry Department, Govt. of Punjab. 67

73 Part IV : Milk Production 68
74 Part IV : Milk Production IV.3. ISS Figures: Milk Production TABLE IV.3.2: Year and District-wise Indigenous Cattle Milk Production Districts Indigenous Cattle Milk Production ( 000 MT) PUNJAB Amritsar Barnala Bathinda Faridkot Fatehgarh Sahib Firozpur Gurdaspur Hoshiarpur Jalandhar Kapurthala Ludhiana Mansa Moga Patiala Rupnagar (Ropar) Sangrur SAS Nagar (Mohali) SBS Nagar (Nawanshahr) Muktsar Tarn Taran SOURCE: Integrated Sample Survey Reports ( to ), Animal Husbandry Department, Govt. of Punjab. 69
75 Part IV : Milk Production District-wise Indigeneous Cattle Milk Production
76 Part IV : Milk Production IV.3. ISS Figures: Milk Production TABLE IV.3.3: Year and District-wise Crossbred Cattle Milk Production Districts Crossbred Cattle Milk Production ( 000 MT) PUNJAB 1,388 1,829 2,084 2,262 2,756 2,758 2,735 2,741 2,784 Amritsar Barnala Bathinda Faridkot Fatehgarh Sahib Firozpur Gurdaspur Hoshiarpur Jalandhar Kapurthala Ludhiana Mansa Moga Patiala Rupnagar (Ropar) Sangrur SAS Nagar (Mohali) SBS Nagar (Nawanshahr) Muktsar Tarn Taran SOURCE: Integrated Sample Survey Reports ( to ), Animal Husbandry Department, Govt. of Punjab. 71
77 Part IV : Milk Production District-wise Crossbred Cattle Milk Production
78 Part IV : Milk Production IV.3. ISS Figures: Milk Production TABLE IV.3.4: Year and District-wise Buffalo Milk Production Districts Buffalo Milk Production ( 000 MT) Punjab 4,294 5,034 6,122 6,820 6,332 6,340 6,297 6,417 6,578 Amritsar Barnala Bathinda Faridkot Fatehgarh Sahib Firozpur Gurdaspur Hoshiarpur Jalandhar Kapurthala Ludhiana Mansa Moga Patiala Rupnagar (Ropar) Sangrur SAS Nagar (Mohali) SBS Nagar (Nawanshahr) Muktsar Tarn Taran SOURCE: Integrated Sample Survey Reports ( to ), Animal Husbandry Department, Govt. of Punjab. 73
79 Part IV : Milk Production District-wise Buffalo Milk Production
80 Part IV : Milk Production IV.3. ISS Figures: Milk Production TABLE IV.3.5: Year and District-wise Milk Production Density Districts Milk Production Density (Kg/Day/Sq Km) PUNJAB Amritsar Barnala Bathinda Faridkot Fatehgarh Sahib Firozpur Gurdaspur Hoshiarpur Jalandhar Kapurthala Ludhiana Mansa Moga Patiala Rupnagar (Ropar) Sangrur SAS Nagar (Mohali) SBS Nagar (Nawanshahr) Muktsar Tarn Taran Source: Estimated from Integrated Sample Survey Reports ( to ), Animal Husbandry Department, Govt. of Punjab. 75
81 Part IV : Milk Production District-wise Milk Population Density
82 Part IV : Milk Production IV.4. ISS Figures: Milk Availability TABLE IV.4.1: Year and District-wise Per Capita Milk Availability Districts Per Capita Availability of Milk (grams/day) PUNJAB Amritsar , Barnala 1, , ,269 1,190 Bathinda 771 1, , Faridkot ,001 1,086 1,156 1,093 1,117 1,068 1,074 Fatehgarh Sahib 1,227 1,387 1,485 1,340 1,293 1,358 1,339 1,233 1,296 Firozpur , ,092 1, ,021 1,054 Gurdaspur Hoshiarpur Jalandhar Kapurthala ,237 1,057 1,269 1,253 1,192 1,029 1,101 Ludhiana Mansa 1, ,221 1,082 1,015 1,091 1,108 1,206 1,175 Moga , ,004 1,194 1,208 Patiala 805 1, Rupnagar (Ropar) Sangrur 967 1,069 1,094 1,297 1,221 1,197 1,193 1,301 1,268 SAS Nagar (Mohali) SBS Nagar (Nawanshahr) 1,181 1,296 1,174 1,210 1,246 1,227 1,083 1,155 Muktsar , Tarn Taran 1,499 1,339 1,258 1,334 1,341 1,339 SOURCE: Estimated from Integrated Sample Survey Reports ( to ), Animal Husbandry Department, Govt. of Punjab. 77
83 Part IV : Milk Production District-wise Per Capita Milk Availability

84 Part IV : Milk Production IV.5. ISS Figures: Milk Utilisation TABLE IV.5.1: Milk Utilisation Pattern in Households ( to ) In Percent Items Cow Buffalo Overall Cow Buffalo Overall Cow Buffalo Overall Cow Buffalo Overall Cow Buffalo Overall Milk Sold as Fluid Milk Consumed as Fluid Milk Kept for Conversion SOURCE: Integrated Sample Survey Reports ( to ), Animal Husbandry Department, Govt. of Punjab. 79

85 Part IV : Milk Production 80

86 Part V : Veterinary Infrastructure And Service Delivery System This section covers information on district-wise veterinary infrastructure for Animal Health and Artificial Insemination (AI) services. Punjab has extensive veterinary infrastructure for animal health care. The government managed network includes 2,852 veterinary hospitals, polyclinics and dispensaries as well as 3,824 AI centres. During , about 2.3 million cattle and 1.8 million buffaloes were covered under AI services. In addition, the dairy cooperatives also provide veterinary care and have 1,071 AI centres to support dairying and have carried out 0.73 million AIs in In addition to this, there are many private service providers for AI service. A Progressive Dairy Farmers Association has been established. With technical support from Guru Angad Development Veterinary and Animal Sciences University, Ludhiana, it publishes quarterly technical magazine Dairy Sandesh, technical books, arranges seminars and exhibitions to disseminate dairy related knowledge to farmers. It also imports semen of high genetic potential cattle bulls from USA for use of dairy farmers. Surveillance and monitoring of livestock diseases has been one of the major activities of animal health care delivery system in Punjab. To this end, vaccinations were done against Foot-and-Mouth Disease, Haemorrhagic Septicaemia and Black Quarter. In , 5.37 million animals were treated and 16 thousand bovine were castrated.
87 Part V : Veterinary Infrastructure And Service Delivery System V.1. Veterinary Infrastructure TABLE V.1.1: Year and District-wise Veterinary Institutes Districts Number of Veterinary Institutes PUNJAB 1,914 2,729 2,840 2,852 2,852 2,852 2,852 2,852 2,852 Amritsar Barnala Bathinda Faridkot Fatehgarh Sahib Firozpur Gurdaspur Hoshiarpur Jalandhar Kapurthala Ludhiana Mansa Moga Patiala Rupnagar (Ropar) Sangrur SAS Nagar (Mohali) SBS Nagar (Nawanshahr) Muktsar Tarn Taran NOTE: Veterinary institutes include veterinary hospitals and dispensaries. Source: Annual Administrative Reports ( to ), Animal Husbandry Department, Punjab. 82
88 Part V : Veterinary Infrastructure And Service Delivery System V.1. Veterinary Infrastructure TABLE V.1.2: District-wise AI Centres Government Agencies Districts Number of AI Centres PUNJAB 1,776 2,129 2,107 2,331 2,752 2,752 2,752 2,852 3,824 Amritsar Barnala Bathinda Faridkot Fatehgarh Sahib Firozpur Gurdaspur Hoshiarpur Jalandhar Kapurthala Ludhiana Mansa Moga Patiala Rupnagar (Ropar) Sangrur SAS Nagar (Mohali) SBS Nagar (Nawanshahr) Muktsar Tarn Taran Source: Annual Administrative Reports ( to ), Animal Husbandry Department, Punjab. NOTE: AI centers for not available. 83

89 Part V : Veterinary Infrastructure And Service Delivery System V.1. Veterinary Infrastructure Table V.1.3: Milk Union-wise AI Centres Cooperatives Unions Number of AI Centres PUNJAB , ,017 Amritsar Bathinda Faridkot Firozpur Gurdaspur Hoshiarpur Jalandhar Ludhiana Patiala Rupnagar (Ropar) Sangrur Source: NDDB 84
90 Part V : Veterinary Infrastructure And Service Delivery System V.2. Service Delivery System - AIs TABLE V.2.1: District-wise AI Performed by Government Agencies Cattle Districts Number of AI Performed ( 000) PUNJAB 1, , , , , , , , ,343.7 Amritsar Barnala Bathinda Faridkot Fatehgarh Sahib Firozpur Gurdaspur Hoshiarpur Jalandhar Kapurthala Ludhiana Mansa Moga Patiala Rupnagar (Ropar) Sangrur SAS Nagar (Mohali) SBS Nagar (Nawanshahr) Muktsar Tarn Taran Source: Annual Administrative Reports ( to ), Animal Husbandry Department, Punjab. 85
91 Part V : Veterinary Infrastructure And Service Delivery System V.2. Service Delivery System - AIs TABLE V.2.2: District-wise AI Performed by Government Agencies Buffaloes Districts Number of AI Performed ( 000) PUNJAB , , , , , , ,870.0 Amritsar Barnala Bathinda Faridkot Fatehgarh Sahib Firozpur Gurdaspur Hoshiarpur Jalandhar Kapurthala Ludhiana Mansa Moga Patiala Rupnagar (Ropar) Sangrur SAS Nagar (Mohali) SBS Nagar (Nawanshahr) Muktsar Tarn Taran Source: Annual Administrative Reports ( to ), Animal Husbandry Department, Punjab. 86
92 Part V : Veterinary Infrastructure And Service Delivery System V.2. Service Delivery System - AIs TABLE V.2.3: District-wise AI Performed by Government Agencies Bovine Districts Number of AI Performed ( 000) PUNJAB 1, , , , , , , , ,213.7 Amritsar Barnala Bathinda Faridkot Fatehgarh Sahib Firozpur Gurdaspur Hoshiarpur Jalandhar Kapurthala Ludhiana Mansa Moga Patiala Rupnagar (Ropar) Sangrur SAS Nagar (Mohali) SBS Nagar (Nawanshahr) Muktsar Tarn Taran Source: Annual Administrative Reports ( to ), Animal Husbandry Department, Punjab. 87
93 Part V : Veterinary Infrastructure And Service Delivery System AI Performed by Government Agencies (Cattle) AI Performed by Government Agencies (Buffalo) AI Performed by Government Agencies (Bovine)
94 Part V : Veterinary Infrastructure And Service Delivery System V.2. Service Delivery System - AIs 89 Unions TABLE V.2.4: Milk Union-wise AI Performed by Cooperatives Cattle Number of AI Performed ( 000) PUNJAB Amritsar Bathinda Faridkot Firozpur Gurdaspur Hoshiarpur Jalandhar Ludhiana Patiala Rupnagar (Ropar) Sangrur Source: NDDB. Unions TABLE V.2.5: Milk Union-wise AI Performed by Cooperatives Buffaloes Number of AI Performed ( 000) PUNJAB Amritsar Bathinda Faridkot Firozpur Gurdaspur Hoshiarpur Jalandhar Ludhiana Patiala Rupnagar (Ropar) Sangrur Source: NDDB. Unions TABLE V.2.6: Milk Union-wise AI Performed by Cooperatives Bovine Number of AI Performed ( 000) PUNJAB Amritsar Bathinda Faridkot Firozpur Gurdaspur Hoshiarpur Jalandhar Ludhiana Patiala Rupnagar (Ropar) Sangrur Source: NDDB.
95 Part V : Veterinary Infrastructure And Service Delivery System V.3. Service Delivery System - Animal Health TABLE V.3.1: District-wise Vaccination Performed for Foot-and-Mouth Disease Districts Foot-and-Mouth Disease Vaccination ( 000) PUNJAB 1,816 3,065 4,049 8,171 7,674 7,463 12,574 6,986 13,446 Amritsar Barnala Bathinda Faridkot Fatehgarh Sahib Firozpur , , ,254 Gurdaspur Hoshiarpur Jalandhar Kapurthala Ludhiana ,260 Mansa Moga Patiala Rupnagar (Ropar) Sangrur , ,106 SAS Nagar (Mohali) SBS Nagar (Nawanshahr) Muktsar Tarn Taran Source: Annual Administrative Reports ( to ), Animal Husbandry Department, Punjab. 90
96 Part V : Veterinary Infrastructure And Service Delivery System V.3. Service Delivery System - Animal Health TABLE V.3.2: District-wise Vaccination Preformed for Haemorrhagic Septicaemia Districts Haemorrhagic Septicaemia Vaccination ( 000) PUNJAB 5,810 9,686 7,154 6,600 5,856 6,015 6,061 6,038 6,257 Amritsar 509 1, Barnala Bathinda Faridkot Fatehgarh Sahib Firozpur Gurdaspur Hoshiarpur Jalandhar Kapurthala Ludhiana Mansa Moga Patiala Rupnagar (Ropar) Sangrur SAS Nagar (Mohali) SBS Nagar (Nawanshahr) Muktsar Tarn Taran Source: Annual Administrative Reports ( to ), Animal Husbandry Department, Punjab. 91
97 Part V : Veterinary Infrastructure And Service Delivery System V.3. Service Delivery System - Animal Health TABLE V.3.3: District-wise Vaccination Preformed for Black Quarter Districts Black Quarter Vaccination ( 000) PUNJAB Amritsar Barnala Bathinda Faridkot Fatehgarh Sahib Firozpur Gurdaspur Hoshiarpur Jalandhar Kapurthala Ludhiana Mansa Moga Patiala Rupnagar (Ropar) Sangrur SAS Nagar (Mohali) SBS Nagar (Nawanshahr) Muktsar Tarn Taran Source: Annual Administrative Reports ( to ), Animal Husbandry Department, Punjab. Note: Data for and not published/reported. 92
98 Part V : Veterinary Infrastructure And Service Delivery System V.3. Service Delivery System - Animal Health TABLE V.3.4: District-wise Bovine Vaccination Districts Bovine Vaccination ( 000) PUNJAB 7,747 13,048 11,332 14,844 13,590 13,544 18,698 13,024 19,703 Amritsar 766 1,344 1,040 1, , ,274 Barnala Bathinda , ,080 Faridkot Fatehgarh Sahib Firozpur 606 1,223 1,107 2,231 1,129 1,208 1,881 1,192 1,852 Gurdaspur , , ,272 Hoshiarpur , , ,061 Jalandhar Kapurthala Ludhiana 591 1, ,215 1,024 1,420 1,248 1,846 Mansa Moga , Patiala 849 1, , , ,317 Rupnagar (Ropar) Sangrur 827 1,133 1,579 1,436 1,115 1,089 1,675 1,043 1,604 SAS Nagar (Mohali) SBS Nagar (Nawanshahr) Muktsar , Tarn Taran 1, ,056 Source: Annual Administrative Reports ( to ), Animal Husbandry Department, Punjab. NOTE: Bovine vaccination includes vaccination for FMD, HS and BQ. 93
99 Part V : Veterinary Infrastructure And Service Delivery System Vaccinations Performed for Foot and Mouth Disease Vaccinations Performed for Haemorrhagic Septicaemia Bovine Vaccinations Performed
100 Part V : Veterinary Infrastructure And Service Delivery System V.3. Service Delivery System - Animal Health TABLE V.3.5: District-wise Bovine Treated Districts Bovine Treated ( 000) PUNJAB 2,206 2,954 4,292 4,186 4,256 4,056 4,072 4,921 5,369 Amritsar Barnala Bathinda Faridkot Fatehgarh Sahib Firozpur Gurdaspur Hoshiarpur Jalandhar Kapurthala Ludhiana Mansa Moga Patiala Rupnagar SAS Nagar (Mohali) Sangrur SBS Nagar (Nawanshahr) Muktsar Tarn Taran Source: Annual Administrative Reports ( to ), Animal Husbandry Department, Punjab. 95
101 Part V : Veterinary Infrastructure And Service Delivery System V.3. Service Delivery System - Animal Health Table V.3.6: District-wise Bovine Castration Districts Bovine Castration (in number) PUNJAB 17,867 9,009 27,590 19,391 17,225 32,130 14,570 20,530 16,111 Amritsar 1, , Barnala 2,120 1,982 2,070 1,783 1,958 1,854 Bathinda 1, ,760 1, , ,087 1,038 Faridkot 2, ,037 1, Fatehgarh Sahib , Firozpur , Gurdaspur ,605 2,218 2,053 1,943 1,487 1,662 1,149 Hoshiarpur 1, ,302 3,445 2,419 2,036 2,087 1,982 2,019 Jalandhar , ,547 1,597 Kapurthala 177-1, ,294 1,213 Ludhiana 1, ,214 2, Mansa Moga 311 1, ,000 1, ,207 Patiala 1, , , Ropar 1, , Sangrur 5,162 2,315 3,518 2,773 2,309 17,175 2,335 2,316 2,154 SAS Nagar (Mohali) SBS Nagar (Nawanshahr) , Muktsar 337 1,657 1, Tarn Taran Source: Annual Administrative Reports ( to ), Animal Husbandry Department, Punjab. 96

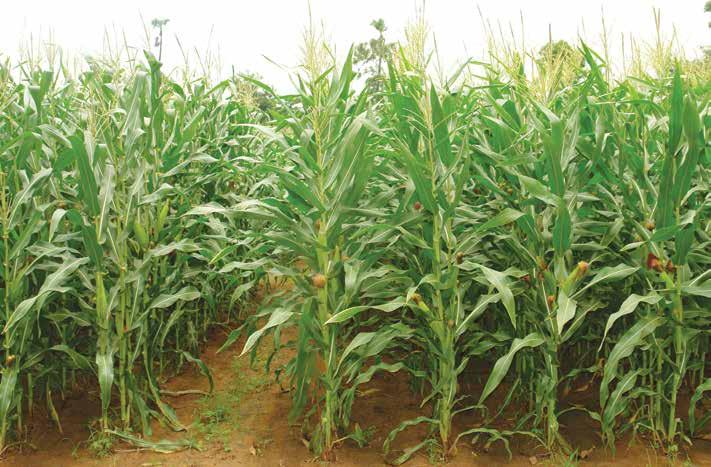
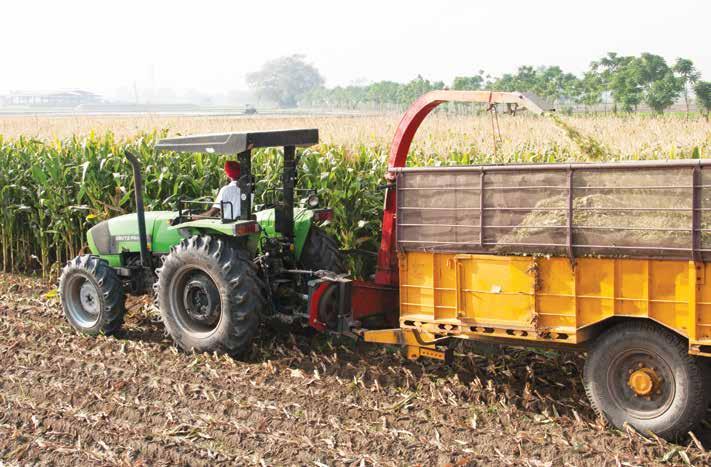
102 Part VI : Feed Resources The state of Punjab is well endowed with availability of feed and fodder resources. While the country is reported to have deficit in dry matter, crude protein and total digestive nutrients, the same has been improving over the years in Punjab. The estimated surplus of these feed resources in the state was about 10, 4.7 and 28.5 million tonnes respectively in In Punjab, area under fodder crops has declined from 671 thousand hectare in to 548 thousand hectare in , a fall of 2.04 per cent per annum. Despite this decline, there has been an increase in total nutrients and fodder availability, which could be because of use of quality fodder seed and improved agronomic practices. The state has 2 cooperative cattle feed plants with a combined daily capacity of 300 thousand tonnes, produces 84 thousand tonnes of compound feed. There are five private cattle feed plants with a daily capacity of 215 thousand tonnes. There are many farmers who prepare their own feed according to their requirement


103 Part VI : Feed Resources 98
104 Part VI : Feed Resources VI.1. Feed Resources - Fodder Table VI.1.1: Area under Fodder Crops and Gross Sown Area Area Under Fodder Crops ( 000 ha) Gross Sown Area ( 000 ha) Districts PUNJAB ,941 7,907 7,870 7,912 7,875 7,883 Amritsar Barnala Bathinda Faridkot Fatehgarh Sahib Firozpur Gurdaspur Hoshiarpur Jalandhar Kapurthala Ludhiana Mansa Moga Patiala Rupnagar (Ropar) Sangrur SAS Nagar (Mohali) SBS Nagar (Nawanshahr) Muktsar Tarn Taran Source: Directorate of Economics and Statistics, Department of Agriculture and Cooperation, Ministry of Agriculture, Govt. of India. 99


105 Part VI : Feed Resources 100
106 Part VI : Feed Resources VI.2. Feed Resources - Availability vs. Requirement Table VI.2.1: District-wise Dry Matter (DM) Availability, Requirement and Balance Districts Available/ Required/ Balance Dry Matter Availability, Requirement and Balance ( 000 MT) Amritsar Available 1, , , , , , ,663.4 Required 4, , , , , , Balance -3, Barnala Available Required Balance Bathinda Available , , , , , ,153.0 Required 1, , , , , , ,221.0 Balance Faridkot Available 3, , , , , ,217.5 Required Balance 2, Fatehgarh Sahib Available 1, , Required Balance Firozpur Available 1, , , , , , ,601.7 Required 2, , , , , , ,172.7 Balance -1, , , , , , ,429.0 Gurdaspur Available 1, , , , , , ,148.8 Required 2, , , , , , ,511.0 Balance Hoshiarpur Available , , , , , ,847.8 Required 1, , , , , , ,142.6 Balance Jalandhar Available 2, , , , , , ,834.7 Required 2, , , , , , Balance Kapurthala Available , , , , , ,223.4 Required Balance
107 Part VI : Feed Resources Districts Available/ Required/ Balance Dry Matter Availability, Requirement and Balance ( 000 MT) Ludhiana Available 1, , , , , , ,024.3 Required 3, , , , , , ,537.3 Balance -2, Mansa Available , , , , , ,504.2 Required 1, , Balance Moga Available , , , , , ,014.4 Required 1, , , , , , ,225.2 Balance , , Patiala Available 3, , , , , , ,523.6 Required 2, , , , , , ,331.2 Balance 1, , , , ,192.5 Rupnagar (Ropar) Available Required 1, Balance Sangrur Available 3, , , , , ,289.6 Required 3, , , , , ,614.9 SAS Nagar (Mohali) SBS Nagar (Nawanshahr) Balance , , , , ,674.7 Available Required Balance Available Required Balance Muktsar Available 2, , , , , , ,811.8 Required , Balance 2, , , ,071.6 Tarn Taran Available , ,058.6 Required 1, , , , ,418.2 Balance Source: Feedbase 2012, National Institute of Animal Nutrition and Physiology, Bangalore. 102
108 Part VI : Feed Resources VI.2. Feed Resources - Availability vs. Requirement Districts Table VI.2.2: District-wise Crude Protein (CP) Availability, Requirement and Balance Available/ Required/ Balance Crude Protein Availability, Requirement and Balance ( 000 MT) Amritsar Available Required Balance Barnala Available Required Balance Bathinda Available Required Balance Faridkot Available Required Balance Fatehgarh Sahib Available Required Balance Firozpur Available Required Balance Gurdaspur Available Required Balance Hoshiarpur Available Required Balance Jalandhar Available Required Balance Kapurthala Available Required Balance
109 Part VI : Feed Resources Districts Available/ Required/ Balance Crude Protein Availability, Requirement and Balance ( 000 MT) Ludhiana Available Required Balance Mansa Available Required Balance Moga Available Required Balance Patiala Available Required Balance Rupnagar (Ropar) Available Required Balance Sangrur Available SAS Nagar (Mohali) SBS Nagar (Nawanshahr) Required Balance Available Required Balance Available Required Balance Muktsar Available Required Balance Tarn Taran Available Required Balance Source: Feedbase 2012, National Institute of Animal Nutrition and Physiology, Bangalore. 104
110 Part VI : Feed Resources VI.2. Feed Resources - Availability vs. Requirement Districts Table VI.2.3: District-wise Total Digestive Nutrient (TDN) Availability, Requirement and Balance Available/ Required/ Balance Total Digestive Nutrient Availability, Requirement and Balance ( 000 MT) Amritsar Available 1, , , , , , ,226.8 Required 2, , , Balance -1, , , , , , ,665.9 Barnala Available 1, , ,448.6 Required Balance , ,027.8 Bathinda Available 1, , , , , , ,727.4 Required Balance , , , , , ,973.6 Faridkot Available 4, , , , , , ,636.8 Required Balance 3, , , , , ,272.6 Fatehgarh Sahib Available 2, , , , , , ,316.2 Required Balance 1, Firozpur Available 1, , , , , , ,760.7 Required 1, , , , , , ,352.8 Balance , , , , , ,407.9 Gurdaspur Available 1, , , , , , ,782.8 Required 1, , , , , Balance , , , , , ,828.9 Hoshiarpur Available 1, , , , , , ,840.2 Required Balance ,128.6 Jalandhar Available 3, , , , , , ,371.0 Required 1, , Balance 2, , , , , , ,776.4 Kapurthala Available 1, , , , , , ,598.2 Required Balance , , , , ,
111 Part VI : Feed Resources Districts Available/ Required/ Balance Total Digestive Nutrient Availability, Requirement and Balance ( 000 MT) Ludhiana Available 1, , , , , , ,065.4 Required 2, , , , , , ,553.1 Balance , , , , , ,512.3 Mansa Available 1, , , , , , ,945.4 Required Balance , , , , ,419.3 Moga Available , , , , , ,742.2 Required Balance , , , , , ,988.2 Patiala Available 5, , , , , , ,402.6 Required 1, , , Balance 3, , , , , , ,588.4 Rupnagar (Ropar) Available Required Balance Sangrur Available 5, , , , , ,473.6 SAS Nagar (Mohali) SBS Nagar (Nawanshahr) Required 2, , , , , ,002.7 Balance 3, , , , , ,470.9 Available Required Balance Available ,040.3 Required Balance Muktsar Available 3, , , , , , ,357.3 Required Balance 2, , , , , , ,894.6 Tarn Taran Available , ,469.8 Required Balance Source: Feedbase 2012, National Institute of Animal Nutrition and Physiology, Bangalore. 106

112 Part VI : Feed Resources VI.2. Feed Resources - Availability vs. Requirement Table VI.2.4: Availability, Requirement and Surplus/Deficit of Feed Nutrients ( 000 MT) Dry Matter Crude Protein Total Digestible Nutrients Year Availability Requirement Deficit/ Surplus Availability Requirement Deficit/ Surplus Availability Requirement Deficit/ Surplus ,367 26,916-2,549 5,156 2,688 2,468 31,370 16,652 14, ,218 29,258 1,960 6,506 2,980 3,526 40,554 17,870 22, ,011 25,212 8,799 7,167 2,556 4,611 42,265 15,446 26, ,199 24,290 10,909 7,448 2,462 4,986 44,839 14,904 29, ,199 23,482 11,717 7,448 2,379 5,069 44,839 14,433 30, ,138 22,780 9,358 6,731 2,306 4,425 40,808 14,029 26, ,826 22,175 10,651 6,905 2,244 4,661 42,157 13,686 28,471 Source: Feedbase 2012, National Institute of Animal Nutrition and Physiology, Bangalore. 107


113 Part VI : Feed Resources 108

114 Part VI : Feed Resources VI.3. Feed Resources - Consumption Table VI.3.1: Feed and Fodder Consumption (kg/animal/per day) Year Green Fodder Dry Fodder Concentrate Source: Integrated Sample Survey Reports ( to ), Animal Husbandry Department, Punjab. 109


115 Part VI : Feed Resources 110

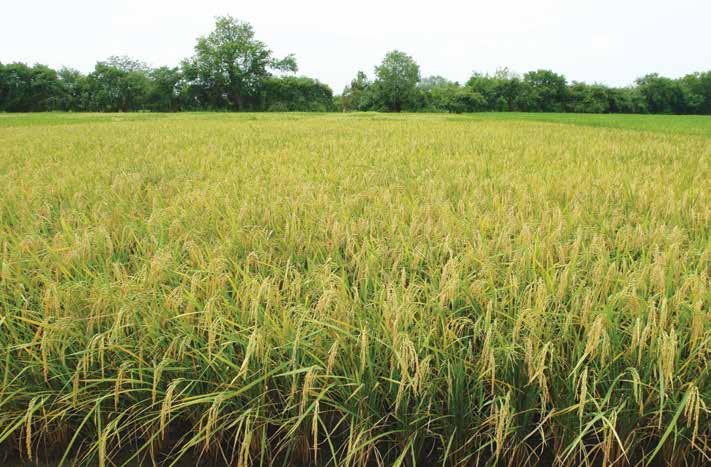
116 Part VII : Agriculture This section documents information on the resources that are available for dairy development. It provides district-wise trends in area and production of various crops, structure of land holding, land use pattern and sources of irrigation. Historically, Punjab has been a surplus state in food grain production. For decades, it has been a model state for agricultural development, which supported industrial growth and generated one of the highest per capita income in the country. More than 90 per cent of the net sown area is under irrigation. There is depletion of ground water table and 110 blocks are categorised as over exploited. Of the five agro climatic zones in Punjab, groundnut water depletion is intense in central plain zone as compared to sub-mountain undulating and undulating plain zones in northern regions. With preference to wheat-rice cropping pattern, more than 80 per cent of gross sown area is allotted to these crops; whereas area under pulses, oilseeds, cotton, sugarcane, permanent pastures and grazing lands is shrinking. This water intensive cropping pattern has increased soil salinity/alkalinity, water logging as well as imbalances in soil micro-nutrients. A The Punjab Preservation of Sub-soil Water Act has been promulgated in 2009.

117 Part VII : Agriculture VII.1. Agro-Climatic Zones Punjab State Agro-Climatic Zones Table VII.1.1: Details of Agro-climatic Zones Sr Agro-climatic Zones Districts Covered Major Crops Grown Average Rainfall (mm) Cropping Intensity (%) 1 Sub-mountain undulating zone Gurdaspur and Hoshiarpur Wheat, paddy, sugarcane 1, Undulating plain zone Rupnagar (Ropar) & SBS Nagar (Nawanshahr) Wheat, paddy, sugarcane 1, Central plain zone Amritsar, Tarn Taran, Kapurthala, Jalandhar, Ludhiana, Fatehgarh Sahib, Sangrur and Patiala Wheat, paddy Western plain zone Firozpur and Faridkot Wheat, paddy, cotton Western zone Moga, Bathinda, Mansa, Muktsar, Sangrur & Barnala Wheat, paddy, cotton Source: Compiled from and Directorate of Economics and Statistics, Ministry of Agriculture, Govt. of India. 112
118 Part VII : Agriculture VII.2. Land Use Pattern Districts Table VII.2.1: District-wise Land Use Pattern Reported Area Forest Area Fallow Land Permanent Pasture and Grazing Land ( 000 ha) Net Sown Area PUNJAB 5, , ,250 4,157.8 Amritsar Barnala Bathinda Faridkot Fatehgarh Sahib * 0* Firozpur Gurdaspur * Hoshiarpur Jalandhar * Kapurthala * Ludhiana Mansa Moga Patiala * 0* Rupnagar (Ropar) Sangrur * SAS Nagar (Mohali) SBS Nagar (Nawanshahr) Muktsar Tarn Taran (-) Not reported/not available or reported zero. Source: Directorate of Economics and Statistics, Ministry of Agriculture, Govt. of India. *Negligible. 113

119 Part VII : Agriculture 114
120 Part VII : Agriculture VII.3. Area and Production TABLE VII.3.1: District-wise Area and Production of Cereals and Pulses Cereals Pulses Districts Area ( 000 ha) Production ( 000 MT) Area ( 000 ha) Production ( 000 MT) * * * * PUNJAB 6,343 6,487 6,502 26,190 29,076 28, Amritsar ,759 1,434 1, Barnala ,022 1,078 1, Bathinda ,451 1,676 1, Faridkot , Fatehgarh Sahib Firozpur ,665 2,870 2, Gurdaspur ,571 1,772 1, Hoshiarpur ,204 1, Jalandhar ,329 1,486 1, Kapurthala Ludhiana ,354 2,485 2, Mansa ,009 1,137 1, Moga ,545 1,720 1, Patiala ,135 2,211 2, Rupnagar (Ropar) Sangrur ,996 2,774 2, SAS Nagar (Mohali) SBS Nagar (Nawanshahr) Muktsar ,223 1,441 1, Tarn Taran ,331 1,396 1, *Average from to Fazilka and Pathankot figures are included in Firozpur and Gurdaspur respectively. Source: Ministry of Agriculture, Govt. of Punjab. 115

121 Part VII : Agriculture 116
122 Part VII : Agriculture VII.3. Area and Production TABLE VII.3.2: District-wise Area and Production of Food Grains and Oilseeds Food Grains Oilseeds Districts Area ( 000 ha) Production ( 000 MT) Area ( 000 ha) Production ( 000 MT) * * * * PUNJAB 6,373 6,505 6,517 26,215 29,092 28, Amritsar ,760 1,434 1, Barnala ,023 1,079 1, Bathinda ,452 1,677 1, Faridkot , Fatehgarh Sahib Firozpur ,668 2,873 2, Gurdaspur ,572 1,773 1, Hoshiarpur ,205 1, Jalandhar ,330 1,487 1, Kapurthala Ludhiana ,357 2,487 2, Mansa ,009 1,137 1, Moga ,546 1,721 1, Patiala ,137 2,213 2, Rupnagar (Ropar) Sangrur ,000 2,775 2, SAS Nagar (Mohali) SBS Nagar (Nawanshahr) Muktsar ,224 1,442 1, Tarn Taran ,333 1,397 1, *Average from to Fazilka and Pathankot figures are included in Firozpur and Gurdaspur respectively. Source: Ministry of Agriculture, Govt. of Punjab. 117

123 Part VII : Agriculture 118
124 Part VII : Agriculture VII.3. Area and Production TABLE VII.3.3: District-wise Area and Production of Sugarcane and Cotton Sugarcane Cotton Districts Area ( 000 ha) Production ( 000 MT) Area ( 000 ha) Production ( 000 bales) * * * * PUNJAB ,247 5,653 5, ,305 1,621 1,627 Amritsar Barnala Bathinda Faridkot Fatehgarh Sahib Firozpur Gurdaspur ,453 1,864 1,818 Hoshiarpur ,158 1,293 1,321 Jalandhar Kapurthala Ludhiana Mansa Moga Patiala Rupnagar (Ropar) Sangrur SAS Nagar (Mohali) SBS Nagar (Nawanshahr) Muktsar Tarn Taran * Average from to , 1 bale = 170 kg. Source: Ministry of Agriculture, Govt.of Punjab. 119
125 Part VII : Agriculture VII.4. Land Holding TABLE VII.4.1: Operational Holdings in Punjab Size of Holding (ha) Number ( 000) Total Holdings Area ( 000 ha) Average Size of Holding (ha) Marginal Small Semi-medium Medium 298 1, Large 70 1, All Classes 1,053 3, Source: Agricultural Census Database, , Ministry of Agriculture, Govt of India. TABLE VII.4.2: Net Irrigated Area under Different Sources of Irrigation Particulars Gross Sown Area ( 000 ha) 7,831 7,941 7,907 7,868 7,870 7,912 7,883 Net Sown Area ( 000 ha) 4,238 4,254 4,240 4,192 4,187 4,169 4,158 Net Irrigated Area ( 000 ha) 4,004 4,056 4,097 4,019 4,112 4,079 4,070 Sources (net irrigated area) ( 000 ha) Canals 1,296 9,69 1, ,142 1,112 1,116 Tanks Wells and Tube Wells 2,705 3,084 3,047 2,912 2,967 2,963 2,954 Other Sources Source: Directorate of Economics and Statistics, Ministry of Agriculture, Govt. of India. 120
126 Part VII : Agriculture VII.5. Rainfall TABLE VII.5.1: District- wise Average Annual Rainfall Districts Average Rainfall (mm) Amritsar Barnala Bhatinda Faridkot Fatehgarh Firozpur Gurdaspur , ,499.1 Hoshiarpur Jalandhar Kapurthala Ludhiana Mansa Moga Patiala Rupnagar (Ropar) , Sangrur SAS Nagar (Mohali) 1, SBS Nagar (Nawanshahr) , Muktsar TaranTaran Source: Hydromet Division, India Meteorological Department, Ministry of Earth Sciences. Govt. of India, webrain/punjab. 121
127 Part VII : Agriculture VII.6. Ground Water Status TABLE VII.6.1: Distribution of Blocks According to Ground Water Status Number of Blocks Districts Semi Critical Critical Over Exploited PUNJAB Amritsar 16 8 Barnala 3 Bathinda Faridkot 2 2 Fatehgarh Sahib 5 5 Firozpur Gurdaspur Hoshiarpur Jalandhar Kapurthala 5 5 Ludhiana Mansa 5 5 Moga 5 5 Patiala Rupnagar (Ropar) Sangrur 12 9 SAS Nagar (Mohali) 2 SBS Nagar (Nawanshahr) 3 3 Muktsar NA NA NA NA NA NA Tarn Taran 8 Source: Various Reports of Dynamics of Ground Water Resources, Central Ground Water Board, Ministry of Water Resources, Govt. of India. Note: Total Assessed blocks was 137 in 2004 and 138 in
 2004 2009 4% 3% 1% 2% 17% 18%")

128 Part VII : Agriculture Status of Ground Water (% of Blocks) % 3% 1% 2% 17% 18% 75% 80% Safe Over exploited Critical Semi critical Blocks-wise Groundwater Status

129 Part VII : Agriculture 124
130 Glossary Glossary AI : Artificial Insemination is the process of deliberate introduction of sperm into the female reproductive tract for impregnation. Bovine : large ruminants like cattle, buffaloes, yak and mithun. Breedable : female animals that have attained the age of puberty. Breeding Tract : area where breeds/group of animals are found. Calving Interval : period between two calvings. Castration : technique by which males are made sterile for use in draught operations. Crossbred : animal produced by hybridization of two different breeds. CP : approximate amount of protein in the feed. DM : dry biomass available from feed and fodder. Dry Animal : adult animals calved at least once but not in-milk at present. Food Grains : cereals and pulses. GSDP : basic measure of a State s overall economic performance. It represents the market value of all final goods and services made within the borders of a State in a year. Indigenous Animals : animals native to a particular area. In-milk Animals : animals which are lactating. Irrigation Intensity : (Gross irrigated area/net irrigated area) * 100. Lactation Length : number of days the animal secretes milk. Lactation Yield : total milk production over period of 300/305 days. Literacy Rate : percentage of literates in the age group above six years. Livestock : domesticated mammals. Male to Female Ratio : number of males to females. Milch Animals : sum of in-milk and dry animals. Milk Utilisation Pattern : quantities of milk retained for home consumption in liquid form, retained for product conversion and milk sold by the milk producers. Marginal Holdings : farmers possessing less than one hectare of operational holding. Small Holdings : greater than one hectare and less than two hectare of operational holding. Semi Medium : greater than two and less than four hectare of operational holding. Medium Holdings : are more than four and less than ten hectare of operational holding. Large Holdings : are those larger than ten hectare of operational holding. Population Density : number of human beings/animals per square km of geographical area. Poultry : all categories of chicken, guinea fowls, turkey, ducks and quails. Sex Ratio : ratio of females to 1,000 males in a population. Small Ruminants : sum of sheep and goats. TDN : nutrients of feed which can be digested. Urbanisation : per cent of urban population to total population. Wet to Dry Ratio : ratio of number of in-milk animals to dry ones. 125
131
 260148 / 260149 / 260160 Fax : (02692) 260157 / 260159")
132 National Dairy Development Board Anand GUJARAT Phone : (02692) / / Fax : (02692) /
National Dairy Development Board. Dairying In. Andhra Pradesh. A Statistical Profile 2018
 Dairying In National Dairy Development Board Andhra Pradesh A Statistical Profile 2018 District Map of Andhra Pradesh Foreword In this publication Dairying in Andhra Pradesh - A Statistical Profile 2018,
CHAPTER 4 LAND USE PATTERNS AND CHANGES THEREIN. Land use means utilization of land in a particular area. Land use
 CHAPTER 4 LAND USE PATTERNS AND CHANGES THEREIN Land use means utilization of land in a particular area. Land use pattern includes types of land and how much land is being utilized under different uses.
CHAPTER 6 DELIMITATION OF CROP DIVERSIFICATION REGIONS AND CHANGES THEREIN. Concept of crop diversification means competition among various
 CHAPTER 6 DELIMITATION OF CROP DIVERSIFICATION REGIONS AND CHANGES THEREIN Concept of crop diversification means competition among various grown crops for space in a given region. It also means raising
Gross Addition to Working Age Population-Supply (Lakhs) Gross Addition to Labour Force Supply (Lakhs)
 Gross Addition to Labour Force Supply (Lakhs)") 1. Executive Summary National Skill Development Corporation (NSDC) had mandated KPMG Advisory Services Pvt Ltd to undertake a District-level Skill Gap Study of the state of Punjab, involving various Departments
1. Executive Summary National Skill Development Corporation (NSDC) had mandated KPMG Advisory Services Pvt Ltd to undertake a District-level Skill Gap Study of the state of Punjab, involving various Departments
LIVESTOCK PROFILE. PDF processed with CutePDF evaluation edition 50 ENVIS Centre on Himalayan Ecology, GBPIHED, Almora
 LIVESTOCK PROFILE 8.1 : Livestock population and total percent growth 8.2 : Progress Report of Monkey Sterilization Up to 16.02.2014 8.3 : Estimates of Milk Production, Egg Production & Wool Production
International Journal of Advance Engineering and Research Development
 Scientific Journal of Impact Factor (SJIF): 4.72 International Journal of Advance Engineering and Research Development Volume 4, Issue 10, October -2017 e-issn (O): 2348-4470 p-issn (P): 2348-6406 Perspective
State at a Glance: Arunachal Pradesh, Vol. 1(2), Livestock
, Livestock") Livestock 9.1: Livestock Population in Arunachal Pradesh (A.P.) 9.2: Estimates of Milk Production, Egg Production & Wool Production 9.3: Share of Milk Production by Cows 9.4: Per Capita Availability of
Livestock 9.1: Livestock Population in Arunachal Pradesh (A.P.) 9.2: Estimates of Milk Production, Egg Production & Wool Production 9.3: Share of Milk Production by Cows 9.4: Per Capita Availability of
Structural Growth and Development of Livestock Sector in North-Eastern Karnataka An Economic Analysis
 Agricultural Economics Research Review Vol. 27 (No.2) July-December 2014 pp 319-325 DOI: 10.5958/0974-0279.2014.00036.6 Research Note Structural Growth and Development of Livestock Sector in North-Eastern
MAR 2017 Particulars 1 AI Cow i) Exotic 0 0
 Exotic 0 0") MAR MPR of 3. Loan 2017 Particulars DM PT 1 AI Cow i) Exotic ii) Crossbred 7 50 iii) Sahiwal iv) Hariana 0 10 Total (i+ii+iii+iv) 7 60 2 AI Buffalo Murrah 178 835 3 AI Follow up i) Exotic ii) Crossbred
MAR MPR of 3. Loan 2017 Particulars DM PT 1 AI Cow i) Exotic ii) Crossbred 7 50 iii) Sahiwal iv) Hariana 0 10 Total (i+ii+iii+iv) 7 60 2 AI Buffalo Murrah 178 835 3 AI Follow up i) Exotic ii) Crossbred
ANIMAL HUSBANDRY & DAIRYING DEPARTMENT
 GOVERNMENT OF HARYANA ANIMAL HUSBANDRY & DAIRYING DEPARTMENT Integrated Sample Survey Report for Estimation of Major Livestock Products Milk, Eggs, Wool & Meat for the year 2015-16 Issued by STATISTICAL
ODISHA BOVINE BREEDING POLICY
 ODISHA BOVINE BREEDING POLICY - 2015 FISHERIES & ARD DEPARTMENT, ODISHA 12-01-2016 ODISHA BOVINE BREEDING POLICY - 2015 Introduction: Livestock is an integral part of India s agricultural economy and plays
Compendium of financing options for the food processing sector
 Investment Environment & Opportunities in Food Processing Punjab Compendium of financing options for the food processing sector Knowledge Partner Ministry of Food Processing Industries Government of India
Perspectives and prospects of milk production in Western Maharashtra
 Volume 5 Issue 2 September, 2014 224230 e ISSN22316434 International R esearch J ournal of A gricultural E conomics and S tatistics Visit Us www.researchjournal.co.in Research Paper DOI : 10.15740/HAS/IRJAES/5.2/224230
3 PERFORMANCE OF LIVESTOCK SECTOR
 3 PERFORMANCE OF LIVESTOCK SECTOR 3.1 Stock and Growth of Livestock Population Table 1 and 2 show the livestock population, composition and their compound growth rates. Livestock population increased from
CHANGING DIMENSIONS OF LIVESTOCK SECTOR IN TAMIL NAIDU - AN ECONOMIC ANALYSIS
 CHANGING DIMENSIONS OF LIVESTOCK SECTOR IN TAMIL NAIDU - AN ECONOMIC ANALYSIS Prabu M., Selvakumar K.N., Serma Saravana Pandian A., G. Senthilkumar and B. Jaya Varathan Department of Animal Husbandry Economics
Performance of Livestock Sector in India (With Reference to Bovine Population)
") Current Agriculture Research Journal Vol. 4(1), 108-113 (2016) Performance of Livestock Sector in India (With Reference to Bovine Population) B. SREENIVASA REDDY 1 and P. RAMAPPA 2 Post Doctoral Fellow
Current Agriculture Research Journal Vol. 4(1), 108-113 (2016) Performance of Livestock Sector in India (With Reference to Bovine Population) B. SREENIVASA REDDY 1 and P. RAMAPPA 2 Post Doctoral Fellow
Kharif2014. Report Volume - 1
 Kharif2014 Basmati Acreage & Yield Estimation in Punjab, Haryana, Delhi, Uttarakhand, Himachal Pradesh, Western Uttar Pradesh and Parts of Jammu & Kashmir Report Volume - 1 Submitted to Basmati Export
5 SOURCES OF OUTPUT GROWTH
 5 SOURCES OF OUTPUT GROWTH Livestock sector in Karnataka has performed reasonably well considering growth in major outputs of livestock. As output is determined by population and productivity, this section
Livestock Sector Composition and Factors Affecting Its Growth
 RESEARCH NOTES Livestock Sector Composition and Factors Affecting Its Growth Ind. Jn. of Agri. Econ. Vol. 63, No. 2, April-June 2008 Ramesh Chand and S.S. Raju* I INTRODUCTION Livestock sector plays an
Economic Analysis of Tribal Farm in Gadchiroli District of Maharashtra, India
 International Journal of Current Microbiology and Applied Sciences ISSN: 2319-7706 Volume 7 Number 07 (2018) Journal homepage: http://www.ijcmas.com Original Research Article https://doi.org/10.20546/ijcmas.2018.707.247
Integrated Fodder Development Programme
 Integrated Fodder Development Programme Introduction: Agriculture is the main source of livelihood for most of the rural population in the state of Odisha. Agricultural byproducts are inputs for livestock
Procurement and transportation of breeding stock: 300 Rs
 Annexure-IV Guidelines for Implementation of Pig Development scheme under the national Mission for Protein Supplements (NMPS) in States during 2012-13 The Department of Animal Husbandry, Dairying and Fisheries,
COST AND RETURN FROM MILK PRODUCTION AMONG TRIBALS (GUJJARS) IN DIFFERENT DISTRICTS OF JAMMU REGION OF J&K STATE IN INDIA
 IN DIFFERENT DISTRICTS OF JAMMU REGION OF J&K STATE IN INDIA") Received: 16 th August-2012 Revised: 19 th August -2012 Accepted: 24 th August -2012 Research article COST AND RETURN FROM MILK PRODUCTION AMONG TRIBALS (GUJJARS) IN DIFFERENT DISTRICTS OF JAMMU REGION
Received: 16 th August-2012 Revised: 19 th August -2012 Accepted: 24 th August -2012 Research article COST AND RETURN FROM MILK PRODUCTION AMONG TRIBALS (GUJJARS) IN DIFFERENT DISTRICTS OF JAMMU REGION
Executive Summary. PLP Jharsuguda
 Executive Summary The PLP for the year 2016-17 has been prepared for the district as per the revised guidelines for priority sector classification issued by the Reserve Bank of India, the gist of which
DEVELOPMENTAL ACTIVITIES
 DEPARTMENT OF ANIMAL HUSBANDRY & VETERINARY SERVICES DEVELOPMENTAL ACTIVITIES DEVELOPMENTAL ACTIVITIES 1. ANIMAL HEALTH AND VETERINARY SERVICES a. Livestock Health coverage through 4212 Veterinary Institutions.
PLP SHAHDOL EXECUTIVE SUMMARY
 I) General EXECUTIVE SUMMARY a) The Theme of the PLP 2016-17 is Accelerating the pace of Capital Formation in agriculture and allied sector. b) Shahdol district is situated in the eastern part of Madhya
PLP GUNA EXECUTIVE SUMMARY
 EXECUTIVE SUMMARY a) Theme of the PLP 2016-17 is Accelerating the pace of Capital Formation in agriculture and allied sector. b) Guna district is situated in the North West part of Madhya Pradesh. It has
Demand vs Supply of Food in India - Futuristic Projection
 Published Online on 22 December 2016 Proc Indian Natn Sci Acad 82 No. 5 December 2016 pp. 1579-1586 Printed in India. DOI: 10.16943/ptinsa /2016/48889 Demand vs Supply of Food in India - Futuristic Projection
Risk in Punjab Agriculture: Current Status and Emerging Issues
 Risk in Punjab Agriculture: Current Status and Emerging Issues RS Sidhu and Kamal Vatta Department of Economics and Sociology, PAU, Ludhiana-141 004 Introduction Despite having less than 2 percent of the
62 Indian Res. J. Ext. Edu. 13 (2), May, Economics of Goat Farming Under Traditional Low Input Production System in Uttar Pradesh
, May, Economics of Goat Farming Under Traditional Low Input Production System in Uttar Pradesh") 62 Indian Res. J. Ext. Edu. 13 (2), May, 2013 Economics of Goat Farming Under Traditional Low Input Production System in Uttar Pradesh R. Prasad 1, A.K. Singh 2, Lakhan Singh 3 and Atar Singh 4 1. Programme
62 Indian Res. J. Ext. Edu. 13 (2), May, 2013 Economics of Goat Farming Under Traditional Low Input Production System in Uttar Pradesh R. Prasad 1, A.K. Singh 2, Lakhan Singh 3 and Atar Singh 4 1. Programme
Dynamics and Performance of Livestock and Poultry Sector in India: A Temporal Analysis
 Volume 3, Issue 1 June 2014 1 RESEARCH ARTICLE ISSN: 2278-5213 Dynamics and Performance of Livestock and Poultry Sector in India: A Temporal Analysis M. Borah* and R.A. Halim Dept. of Agricultural Economics
25-26 Aug 14, ANAND. National Dairy Development Board August 2014
 25-26 Aug 14, ANAND National Dairy Development Board August 2014 in crore Value of output of milk > paddy and wheat 400000 350000 300000 250000 200000 150000 100000 50000 0 1950-51 1960-61 1970-71 1995-96
Basmati Acreage & Yield Estimation in Punjab, Haryana, Delhi, Uttarakhand, Himachal Pradesh, Western Uttar Pradesh and Parts of Jammu & Kashmir
 Kharif 2018 REPORT - 2 September 18th, 2018 Basmati Acreage & Yield Estimation in Punjab, Haryana, Delhi, Uttarakhand, Himachal Pradesh, Western Uttar Pradesh and Parts of Jammu & Kashmir Basmati Export
Agriculture. List of Tables
 Agriculture List of Tables 7.1: Area Production and yield of Agricultural Crops in Sikkim (Part-A) 7.2: Area Production and yield of Agricultural Crops (Part-B) 7.3: Area Production and yield of Agricultural
 Page 1 of 5 Animal Husbandry Department Policy Note 2005-2006 Demand No.6 LIVESTOCK DEVELOPMENT LIVESTOCK FARMS Livestock farms are maintained for selective scientific breeding of specific species of livestock.
CHAPTER II DEVELOPMENT OF DAIRY IN ANDHRA PRADESH
 CHAPTER II DEVELOPMENT OF DAIRY IN ANDHRA PRADESH 42 DEVELOPMENT OF DAIRY IN ANDHRA PRADESH Introduction Bovines play a very important role in the development of rural economy of India. This is particularly
CENTRAL HERD REGISTRATION SCHEME AJMER, RAJASTHAN GIR BULL
 CENTRAL HERD REGISTRATION SCHEME AJMER, RAJASTHAN 305006 GIR BULL Government of India Ministry of Agri. &Farmers Welfare, Dept. of Animal Husbandry, Dairying & Fisheries Central Herd Registration Scheme
ESTIMATES OF CHANGES IN AGRICULTURAL RETURNS DUE TO CROPPING PATTERN CHANGES IN PUNJAB: THROUGH
 Bangladesh J. Agric. Econs. XVIII, 1(1995) : 21-30 ESTIMATES OF CHANGES IN AGRICULTURAL RETURNS DUE TO CROPPING PATTERN CHANGES IN PUNJAB: 1965-70 THROUGH 1988-93. Anju Sharma K.S. Dhindsa ABSTRACT In
Government of India Ministry of Agriculture Department of Agriculture and Cooperation Directorate of Economics and Statistics
 Agricultural Statistics at a Glance 2014 Government of India Ministry of Agriculture Department of Agriculture and Cooperation Directorate of Economics and Statistics QX F O RD UNIVERSITY PRESS Contents
NUTRITIONAL STATUS OF CROSSBRED AND LOCAL COWS
 Indian J. Anim. Res., 42 (1) : 10-16, 2008 NUTRITIONAL STATUS OF CROSSBRED AND LOCAL COWS P. K. Madke 1, J. S. Murkute, S. S. Lathwal 2 and I. M. Kheir 3 Department of Animal Husbandry and Dairying College
Livestock Statistics FY 2072/73 (2015/16) Background
 Background") Government of Nepal Ministry of Livestock Development (MoLD) Department of Livestock Services (DLS)) Nepal: An agricultural country Strategy to enhance the production and productivity of buffaloes for
Government of Nepal Ministry of Livestock Development (MoLD) Department of Livestock Services (DLS)) Nepal: An agricultural country Strategy to enhance the production and productivity of buffaloes for
Special Seminar on Food Security: Focusing on Water management and Sustainable Agriculture
 Special Seminar on Food Security: Focusing on Water management and Sustainable Agriculture Kyi Myint Ministry of Agriculture and Irrigation Location Latitude 9 58-28 31 N Longitude 92 9-100 10 E Country
PLP SAGAR EXECUTIVE SUMMARY
 EXECUTIVE SUMMARY I.General: a. Theme of the PLP 2016-17 is Accelerating the pace of Capital Formation in agriculture and allied sector. b. Sagar district is situated in the Vindhya Plateau Region-5 in
Applications of Genomics Introduction of genomics selection procedures in existing genetic improvement programmes
 Applications of Genomics Introduction of genomics selection procedures in existing genetic improvement programmes 25-26 August, 2014 Animal Breeding Group NDDB Anand Genomic Selection - Concept A classical
STATE AGRICULTURAL PROFILE PUNJAB
 AERC STUDY No. 38 STATE AGRICULTURAL PROFILE PUNJAB Agro-Economic Research Centre Department of Economics and Sociology Punjab Agricultural University Ludhiana December, 2015 PREFACE The present report
Annexure-I Terms of Reference for consultant to assist in preparation of a draft report on the State of Indian Agriculture
 Annexure-I Terms of Reference for consultant to assist in preparation of a draft report on the State of Indian Agriculture 2013-14 1. The draft report on the State of Indian Agriculture should be prepared
PLP Warangal. Executive Summary
 Executive Summary The theme for the PLP 2016-17 is Accelerating the pace of capital formation in agriculture and allied sector The geographical area of the district is 12846 sq. kms and it is divided into
Vital Statistics (Part III)
") Vital Statistics (Part III) Agriculture - Compiled (manzoor@ndf.vsnl.net.in) Institute of Objective Studies 162, Jogabai Main Road, Jamia Nagar, New Delhi - 110025 Index (Part III) - Agriculture 1. Gross
Vital Statistics (Part III) Agriculture - Compiled (manzoor@ndf.vsnl.net.in) Institute of Objective Studies 162, Jogabai Main Road, Jamia Nagar, New Delhi - 110025 Index (Part III) - Agriculture 1. Gross
Animal Husbandry Department
 sustainable animal husbandry practices for kerala Helping farmers/sustaining lives/ensuring food security/enriching animal resource and moving AHEAD Animal Husbandry Department Presented By: Dr. Prem Jain
Assessment of Pre and Post Harvest Losses in Wheat and Paddy Crops in Punjab
 AERC STUDY No. 31 Assessment of Pre and Post Harvest Losses in Wheat and Paddy Crops in Punjab D.K.Grover J.M.Singh Parminder Singh Agro-Economic Research Centre Department of Economics and Sociology Punjab
Economics of Milk Production in Mandya District of Karnataka
 Economic Affairs, Vol. 61, No. 4, pp. 659-665, December 2016 DOI: 10.5958/0976-4666.2016.00081.4 2016 New Delhi Publishers. All rights reserved Economics of Milk Production in Mandya District of Karnataka
EXECUTIVE SUMMARY. 1. Introduction
 EXECUTIVE SUMMARY. Introduction Potential Linked Credit Plan (PLP) was prepared for a period of five years i.e. 202-3 to 206-7 in co-terminus with the XII Five Year Plan Period. However, keeping in view
Role of Livestock Husbandry in Livelihood Generation and Sustainability of Small and Marginal Farmers in Moradabad District, Uttra Pradesh, India
 ISSN 9-98, Impact Factor: 6.0, Volume 07 Issue 07, July 07, Page - Role of Livestock Husbandry in Livelihood Generation and Sustainability of Small and Marginal Farmers in Moradabad District, Uttra Pradesh,
a) The Theme of the PLP is Accelerating the pace of Capital Formation in agriculture and allied sector.
 The Theme of the PLP is Accelerating the pace of Capital Formation in agriculture and allied sector.") EXECUTIVE SUMMARY I. General a) The Theme of the PLP 2016-17 is Accelerating the pace of Capital Formation in agriculture and allied sector. b) Umaria district is situated in the Northen Hill Region of
EXECUTIVE SUMMARY I. General a) The Theme of the PLP 2016-17 is Accelerating the pace of Capital Formation in agriculture and allied sector. b) Umaria district is situated in the Northen Hill Region of
Economic Impact of Foot-and-Mouth Disease in India
 Economic Impact of Foot-and-Mouth Disease in India B. Ganesh Kumar Senior Scientist (Agricultural Economics) Project Directorate on Animal Disease Monitoring and Surveillance Bangalore, INDIA Importance
Is Growth in Agriculture Propelled by its Allied Sectors in North-East India?
 Agricultural Economics Research Review Vol. 28 (Conference Number) 2015 pp 69-80 DOI: 10.5958/0974-0279.2015.00023.3 Is Growth in Agriculture Propelled by its Allied Sectors in North-East India? K.U. Viswanathan*
Impact of national food security mission-pulses on legumes production performance in Punjab, India
 Legume Research, 38 (5) 2015: 609-615 Print ISSN:0250-5371 / Online ISSN:0976-0571 AGRICULTURAL RESEARCH COMMUNICATION CENTRE www.arccjournals.com/www.legumeresearch.in Impact of national food security
National Dairy Development Board Anand, India. Kamlesh Trivedi
 Information and communication technologies for integrated animal identification, traceability, performance recording and health recording for smallholder production systems the case of NDDB in India National
EXECUTIVE SUMMARY. 1. Specific features of the district:
 1. Specific features of the district: EXECUTIVE SUMMARY The district has a unique identification because of its geographical location at the centre of the country and is well connected to all metropolis
Trends and Developments in Sri Lanka s Livestock Industry
 Trends and Developments in Sri Lanka s Livestock Industry Vanitha Prasannath Eastern University, Vantharumoolai, Chenkalady, Sri Lanka vanithap@esn.ac.lk Abstract Agricultural sector contributes to Sri
Marketing of Milk in Various Agro-climatic Zones of Jammu and Kashmir
 Agricultural Economics Research Review Vol. 23 January-June 2010 pp 83-90 Marketing of Milk in Various Agro-climatic Zones of Jammu and Kashmir S.A. Wani and M.H. Wani* Division of Agricultural Economics
Executive Summary. PLP Subarnapur
 Executive Summary. The Potential Linked Credit Plans (PLP) are being prepared by NABARD each year keeping in view the national priorities, policies of the GoI, State Govt., infrastructure and linkage support
Dr. Vanaja Ramprasad. GREEN Foundation, Bangalore, Karnataka, INDIA.
 Dr. Vanaja Ramprasad GREEN Foundation, Bangalore, Karnataka, INDIA. Biogeorgraphic zones TransHimalaya Himalaya Desert Semi-Arid Western Ghats Deccan Peninsula Gangetic Plain Coasts North-East Islands
Site specific enterprise planning and implementation for developing farming system model
 Site specific enterprise planning and implementation for developing farming system model L E C T U R E 7 S S R A N A S R S C I E N T I S T Determinants of Farming Systems Natural Resources and Climate
Participation of Farm Women in Animal Husbandry in Anand District of Gujarat
 Journal of Community Mobilization and Sustainable Development Vol. 6(2), 117-121, July-December, 2011 Participation of Farm Women in Animal Husbandry in Anand District of Gujarat Sangeeta Upadhyay 1 and
Agro-Economic Research Centre Department of Economics and Sociology Punjab Agricultural University Ludhiana
 AERC STUDY No. 35 RELATIONSHIP BETWEEN WHOLESALE PRICES, RETAIL PRICES, EXPORT PRICES (FOB), PRICES REALIZED BY FARMERS AND DETAILS OF CONTRIBUTING FACTORS FOR THE PRICE DIFFERENCE FOR BASMATI RICE IN
Technological Empowerment of Rural Women of Udaipur District (Rajasthan) in Animal Husbandry through SHGs
 in Animal Husbandry through SHGs") Advances in Social Research: Vol. 2, No. 1, p. 15-20, June, 2016 Technological Empowerment of Rural Women of Udaipur District (Rajasthan) in Animal Husbandry through SHGs Seema Tyagi* Directorate of Prioritization,
Advances in Social Research: Vol. 2, No. 1, p. 15-20, June, 2016 Technological Empowerment of Rural Women of Udaipur District (Rajasthan) in Animal Husbandry through SHGs Seema Tyagi* Directorate of Prioritization,
(60:40) NATIONAL RURAL LIVELIHOODS MISSION. NRLM Mission. NRLM Guiding Principles. NRLM Values
 NATIONAL RURAL LIVELIHOODS MISSION. NRLM Mission. NRLM Guiding Principles. NRLM Values") NATIONAL RURAL LIVELIHOODS MISSION (60:40) Aajeevika - National Rural Livelihoods Mission (NRLM) was launched by the Ministry of Rural Development (MoRD), Government of India in June 2011. The Mission
NATIONAL RURAL LIVELIHOODS MISSION (60:40) Aajeevika - National Rural Livelihoods Mission (NRLM) was launched by the Ministry of Rural Development (MoRD), Government of India in June 2011. The Mission
Perceived Effectiveness of Dairy Service Delivery Systems in Namakkal District of Tamil Nadu, India
 Int.J.Curr.Microbiol.App.Sci (218) 7(5): 337-347 International Journal of Current Microbiology and Applied Sciences ISSN: 2319-776 Volume 7 Number 5 (218) Journal homepage: http://www.ijcmas.com Original
SUSTAINABLE AGRICULTURE DEVELOPMENT IN INDIA: A CASE STUDY OF UTTAR PRADESH ABSTRACT
 SUSTAINABLE AGRICULTURE DEVELOPMENT IN INDIA: A CASE STUDY OF UTTAR PRADESH ABSTRACT Agriculture is a critical sector of the Indian economy. It forms the backbone of development in the country. An average
Livestock sector development and implications for rural poverty alleviation in India
 Livestock Research for Rural Development 19 (2) 2007 Guidelines to authors LRRD News Citation of this paper Livestock sector development and implications for rural poverty alleviation in India Jabir Ali
Extensive livestock farming in Morocco: from marginal territories to major social and environmental roles
 Extensive livestock farming in Morocco: from marginal territories to major social and environmental roles Dr. SRAÏRI Mohamed Taher Hassan II Agronomy and Veterinary Medicine Institute Rabat, 10 101, MOROCCO
TRAINING NEEDS OF DAIRY FARMERS
 TRAINING NEEDS OF DAIRY FARMERS G. K. Waman, Assistant Professor (Agril.Extn.), Directorate of Extension Education, MPKV, Rahuri (M.S.) D. N. Pharate, Assistant Professor (Agril.Extn.), Dept. of Extension
AN ANALYTICAL STUDY OF LIVESTOCK IN JAMMU AND KASHMIR. Parveen Kumar*, S.K.Kher** and Sudhakar Dwivedi***
 Received: 08 th June-2012 Revised: 10 th June-2012 Accepted: 15 th June-2012 AN ANALYTICAL STUDY OF LIVESTOCK IN JAMMU AND KASHMIR Parveen Kumar*, S.K.Kher** and Sudhakar Dwivedi*** *PhD scholar, Division
Technological Problems and Training Needs of Dairy Farmers
 Technological Problems and Training Needs of Dairy Farmers Manoj Sharma*, Gurdeep Singh # and Madhu Shelly ## Krishi Vigyan Kendra Kapurthala-144 620 (Punjab) ABSTRACT A survey was conducted to assess
Does Urbanisation Influence Agricultural Activities? A Case Study of Andhra Pradesh
 Ind. Jn. of Agri.Econ. Vol.64, No.3, July-Sept. 2009 SUBJECT II URBANISATION AND ITS IMPACT ON FARM SECTOR Does Urbanisation Influence Agricultural Activities? A Case Study of Andhra Pradesh P. Parthasarathy
Satellite Based Basmati Crop Acreage and Yield Estimation for Kharif Season-2013
 Satellite Based Basmati Crop Acreage and Yield Estimation for Kharif Season-2013 (Final Report Volume IV, 15 th November 2013) Submitted to: Basmati Export Development Foundation Agricultural and Processed
Economic analysis of milk production in Rewari district of Haryana
 RESEARCH ARTICLE Economic analysis of milk production in Rewari district of Haryana Manish Kumar, Ashok Dhillon and V P Luhach Received : 29 January 2015 / Accepted : 25 March 2015 Abstract The present
Livestock Production Situation in Vietnam and Development Orientation
 Livestock Production Situation in Vietnam and Development Orientation D.K. Tuyen & L.B. Lich Department of Agricultural and Forestry Extension Ministry of Agriculture and Rural Development, Hanoi, Vietnam
Reducing the Risk in Livestock Production: Factors Influencing the Adoption of Vaccination Against Bovine Diseases
 Ind. Jn. of Agri.Econ. Vol.62, No.3, July-Sept. 2007 SUBJECT III RISK MANAGEMENT IN AGRICULTURE/RURAL SECTOR Reducing the Risk in Livestock Production: Factors Influencing the Adoption of Vaccination Against
External Training Programmes
 External Training Programmes Human Resource Development Cooperative Training & Development Non-NDPI programmes Training programmes at NDDB, Anand by Human Resource Development-Coops Group NDDB offers training/orientation
Minimum Core Data Set
 Global Strategy IMPROVING AGRICULTURAL AND RURAL STATISTICS IN ASIA PACIFIC Minimum Core Data Set Regional Office for the Asia-Pacific Regional Action Plan to Improve Agricultural and Rural Statistics
Livestock and Climate Change in South Asia. Carolyn Opio 26 August 2008 Dhaka
 Livestock and Climate Change in South Asia Carolyn Opio 26 August 2008 Dhaka Content The Livestock sector in South Asia Livestock and climate change Mitigation and Adaptation Policy options and conclusions
Comprehensive District Agriculture Plan FORWARD
 Comprehensive District Agriculture Plan FORWARD A plan is a detailed proposal for doing or achieving something. It sets the objectives based on the careful analysis of a present situation and stating the
Global Strategy. Session 1.2: Minimum Set of Core Data Items. Module 1: Sampling in the Context of the Global Minimum Set of Core Data Items
 Global Strategy IMPROVING AGRICULTURAL AND RURAL STATISTICS IN ASIA PACIFIC Module 1: Sampling in the Context of the Global Minimum Set of Core Data Items Session 1.2: Minimum Set of Core Data Items 13
Received: 2 December Revised: 7 December Accepted: 17 December
 Status of agricultural commercialization in North-Western India Dr. Sanjay Parihar Head, Department of Geography, S.G.G. Govt. College, Banswara Rajasthan Abstract: Today commercialization of agriculture
Tribal dairy farming status in the Northern Hills Zone of Chhattisgarh state, India - An survey research
 Asian J. Dairy & Food Res, 35 (4) 2016 : 278-282 Print ISSN:0971-4456 / Online ISSN:0976-0563 AGRICULTURAL RESEARCH COMMUNICATION CENTRE www.arccjournals.com Tribal dairy farming status in the Northern
DAIRY CATTLE CROSSBREEDING- POLICY AND RESPONSIBILITY
 DAIRY CATTLE CROSSBREEDING- POLICY AND RESPONSIBILITY Dr. Musarrat Abbas Khan (Research Officer) Livestock Research Institute, Bahadurnagar, Okara POPULATION CENSUS OF PAKISTAN AND PUNJAB Pakistan Total
Livestock Economy of Himachal Pradesh: Need to Strengthen Animal Health and Veterinary Services
 Agricultural Economics Research Review Vol. 25 (Conference Number) 2012 pp 501-506 Livestock Economy of Himachal Pradesh: Need to Strengthen Animal Health and Veterinary Services Virender Kumar *, Harbans
SWOT ANALYSIS AND STRATEGY FORMULATION FOR MILK PRODUCERS OF GUJARAT DAIRY SECTOR
 IMPACT: International Journal of Research in Humanities, Arts and Literature (IMPACT: IJRHAL) ISSN (P): 2347-4564; ISSN (E): 2321-8878 Vol. 5, Issue 8, Aug 2017, 19-26 Impact Journals SWOT ANALYSIS AND
An economic analysis of milk production with different types of milch animals
 RESEARCH PAPER Research Journal of Animal Husbandry and Dairy Science Volume 3 Issue 2 December, 2012 97-101 An economic analysis of milk production with different types of milch animals D.N. BASAVARAJAPPA,
Studies on Milk Production and Health Management for Livestock in Western Uttar Pradesh, India
 International Journal of Current Microbiology and Applied Sciences ISSN: 2319-7706 Volume 6 Number 7 (2017) pp. 2696-2704 Journal homepage: http://www.ijcmas.com Original Research Article https://doi.org/10.20546/ijcmas.2017.607.379
1. Introduction. 2. Past Trends of Foodgrains Demand. Growth of Agriculture & Allied and GDP Five Year Agriculture &
 Future Scenario of Foodgrains: A Case Study for Gap between Demand and Supply (Rajesh Kumar Vishwakarma, Economist (Transport & Economics), RITES Ltd., Gurgaon) 1. Introduction Foodgrains demand and supply
IMPACTS OF NATIONAL AGROFOOD POLICY TOWARDS AGRICULTURE SECTOR IN MALAYSIA
 IMPACTS OF NATIONAL AGROFOOD POLICY TOWARDS AGRICULTURE SECTOR IN MALAYSIA Rozhan Abu Dardak Director General Office, MARDI Head Quarters, Persiaran MARDI-UPM 43400 Serdang. E-mail: rozhan@mardi.gov.my
Epidemiology of ixodid ticks in cattle population of various agroclimatic zones of Punjab, India
 Asian Pacific Journal of Tropical Medicine (013)947-951 947 Contents lists available at ScienceDirect Asian Pacific Journal of Tropical Medicine journal homepage:www.elsevier.com/locate/apjtm Document
Centers for International Projects Trust
 Centers for International Projects Trust Providing solutions for sustainability 1 2 The (CIPT) is the India Offi ce of the Columbia Water Center. Established in 2008 as a not-for-profi t trust, the purpose
CHAPTER I 1.1 Introduction
 CHAPTER I 1.1 Introduction Pulses in India have long been considered as the poor man s source of protein. Pulses are grown in 22-23 million hectares of area with an annual production of 13-15 million tones
Breeding, Feeding and Distribution of Milch Animal Holdings in India:An Analysis Based on the Data from the National Dairy Sample Survey
 MPRA Munich Personal RePEc Archive Breeding, Feeding and Distribution of Milch Animal Holdings in India:An Analysis Based on the Data from the National Dairy Sample Survey Nair K.N and Krishnakumar C.S
International Journal of Science, Environment and Technology, Vol. 7, No 2, 2018,
 International Journal of Science, Environment and Technology, Vol. 7, No 2, 2018, 496 504 ISSN 2278-3687 (O) 2277-663X (P) ROLE OF LIVESTOCK IN DOUBLING THE FARMERS INCOME NATIONAL PERSPECTIVE AND THE
Target. Target Amt % 3 Total Agri NFS / MSME
 EXECUTIVE SUMMARY I Theme of the The development of the economy or sector depends upon capital formation. India is an agrarian country. However, the contribution to national GDP is not in proportion to