CHAPTER- VI PROFILE OF THE STUDY AREA: PUNE DISTRICT HISTORICAL AND GEOGRAPHICAL FEATURES LAND USE PATTERN OF PUNE DISTRICT
|
|
|
- Randolph Bridges
- 6 years ago
- Views:
Transcription
1 136 CHAPTER- VI PROFILE OF THE STUDY AREA: PUNE DISTRICT HISTORICAL AND GEOGRAPHICAL FEATURES DEMOGRAPHIC FEATURES AGRO-ECONOMIC FEATURES LAND USE PATTERN OF PUNE DISTRICT LAND USE PATTERN OF SAMPLE TAHSIL FLORICULTURE PATTERN OF PUNE DISTRICT SAMPLE TAHSILS, FLOWER CROPS AND FLOWER GROWERS SOCIO-ECONOMIC INDICATORS OF SAMPLE FARMS CONCUDING OBSERVATIONS

2 MAP.NO.3 PUNE DISTRICT 137
3 138 Chapter- VI Profile of the Study Area: Pune District Introduction For conducting micro level studies and assessing floriculture ventures, the Pune district has naturally chosen. Pune district is being diversified through horticulture and hitech floriculture recently. Therefore, it is necessary to have an intimate about study area mainly influenced by the climatic condition, rainfall, types of soil and other agroeconomic features. In shortly, this chapter presents an idea on land use and cropping pattern, agro-climatic condition and horticulture pattern, floriculture situation and information about selected tahsil, villages etc. The chapter also covers the general information about the sample growers, their family size and educational status, land use and cropping pattern based on primary data, Historical and Geographical Features Pune is one of historical place. It was known as Punnata in second century. At the time of Rastrakut, it was called Punawadi, located at the bank of river Mula- Mutha. In Mogul period, it was called Kasabe Pune, centre of Maratha raj and capital of Peshwai 1. Many revolutionaries have contributed in India s freedom movement belonging Pune. It agreed generally that, the modern Pune came into use as early as the 13 th centuries with the small settlement named Kasba Pune by Arab commandant. After, 1730 Pune rose in prominence to the national level as a power centre due to Peshave. Prime Minister of Maratha Empire reporting to their master, after the town had brought
4 139 under the control of the British rule in 1817 it served as a cantonment town as the monsoon capital of the Bombay Presidency units the independence of India in Pune is well known for its educational and health facilities in independent India. Now Pune became IT city and international educational hub. It is being developed as international city through education, health and information technology. It can be concluded that, Pune is leading district in terms of agriculture, trade, industry, education, health and now become information technology Location Pune district comes under the plain zone (transitional belt) and situated at an elevation of meter above the mean sea level. The district is located between , N altitude, 73019, and E longitude. The Sahyadri runs in the northsouth direction of the district over a distance of above 115 km 3. Pune district bordered by Ahmednagar district in the north, Solapur and Satara districts in the south, Ahmadnagar and Solapur districts of the east, Raigad and Thane district of the west. As a geographical structure Pune district, classify as under. 1. Western Ghat Zone 2. Hill Areas 3. Pathar of Eastern Zone Area Pune district occupies an area of about sq. km, which is 5per cent of the total area of Maharashtra state. Of which sq. km. comes under rural area and 621 sq. km comes under urban area. The district has 1844 villages, 1234 grampanchayats, 13 panchayat samitees, 11 councils, 2 Municipal corporations, 3 cantonment boards and 13 tahsils namely Ambegaon, Baramati, Bhor, Daund, Haveli, Indapur, Junnar, Khed,
5 140 Maval, Mulshi, Purandar, Shirur and Velha. Among the 35 districts of the state Pune ranks 2 nd in terms of area, 3 rd in terms of populations and 4 th in terms density Climate and Rainfall At the Western Ghat and hill region is cool and eastern region having hot and dry climate. The maximum temperature of Pune district ranges between 34 and 41 0 C during April-May, while the minimum temperature varies between 5 0 C to 10 0 C in the months of November to January The average annual rainfall at the district is 675 mm, most of which is received during South-West monsoon. However, medium rainfall zone at district having on average rainfall of 900 mm, eastern region have an average between 600 to 700 mm while western region have an average of 1171 mm 5. The regularity in occurrence in recent years has not experienced in the district Soil and Topography Pune district possesses mainly three types of soils, viz. black-fertile, brown and mixed type. In western region soil, type has brown and low quality while eastern region having fertile and plain type. The richest alluvial soil track found in the Valley of Bheema River. The rivers Velu, Ghod are left side of Bheema and Indrayani, Bhama, Mula-Mutha etc. are at right side. Each tahsil of the district have minimum one river 6. Therefore, the agro-climatic condition of district is favourable Demographic features Table 6.1 shows the trends of population from 1901 onwards. It clarified that since independence population increased rapidly. During , population increased by per cent while it increased by 56 per cent during
6 141 Table 6.1Population of Pune district: 1901 to 2001 Sr.No. Year Male Female Total (107.4) (100.8) (116.42) ( (178.03) (225.10) (290.00) (380.09) (504.85) (660.00) (Figures in the bracket indicate percentage change over base year) Source-Census of Pune District 2001 Table 6.2 Tahsil wise percentage share of population Sr. No. Name of tahsil % Share 1 Pune city 37 2 Haveli 19 3 Baramati, Junner and Indapur 25 4 Maval and Shirur 8 5 Ambegaon and Purandar 6 6 Bhore, Mulsi and Velhe 1 Total 100 Source- Census of Pune District 2001 The total population of Pune district according to 2001 census was 7.2 million (7.4 per cent of the total population of Maharashtra State), of which 3.7 million male and 3.4 million female and 3.02 million reside in rural areas and 4.19 million in urban areas. The literacy rate was per cent whereas 11.9 per cent population was below poverty line 7.
7 142 Table 6.3 Population Indicators Sr.No. Particular Nos. 1 Density Resides Urban 6765 Rural 202 Max(Pune city) Min( Velhe) 112 Urban 58 % Rural 42% 3 Sex ratio 919 Urban 899 Rural Literacy 80% Male 88% Female 72% Rural 72% Urban 86% Source- Census of Pune District Agro-Economic Features Some agro-economic features of the Pune district such as irrigation, communication and transportation, agro-markets, livestock etc. have discussed below Water resources River plays a very important role in molding the agro economy of Pune districts. Many rivers originate from the Sahyadri ranges and flow from west to south. Bheema the major river flows along the eastern boarder of Pune district of over 160 kms. Its tributaries are Velu and Ghod on the left and Indrayani, Mula, Mutha and Nira at right. During the rainy season, all these rivers swell but shrink to almost dry stream after monsoon. The Nira flows along the southern boundary of the district for considerable distance 8.
8 Communication and Transport Facilities Pune district is well connected to other parts of the state by an extensive network of roads and railway line. Besides, district also has an international airport. The highway NH-4 (Mumbai-Bangalore) and N.H.-9 (Pune-Solapur-Hyderabad) pass through this district. The district has a good network of roads of which 17 are national and state highways and 277 are main district roads. The communication network of the district has also well established with telephone lines and ever internet connections, 70 per cent villages having at least one communication facility Regulated Agriculture Markets Pune district having 11 agricultural marketing committees and 41 sub committees, of which Junner, Ambegaon, Shirur, Khed, Maval, Pune city, Daund, Purandar, Bhor, Baramati, Indapur have each one regulated market while Gultekadi market yard is one of the huge inter-state market, which is separate flower market promoting flower auction Live Stock According to 2003 data, the total live stock population of Pune district was lakhs. Of which cows and bullock was 37 per cent. Buffalos 14 per cent, sheep and goat 48 per cent and others were 2 per cent, besides this total population of poultry birds was lakhs. District has well developed in poultry business and egg production Industries and Employment Pune is an industrially developed district. The transport and communication facilities available here have contributed to the development of industries. Pimpri- Chinchwad, Chakan, Baramati, Jejuri, Daund, Ranjangaon (Shirur) have industrial area, while Hinjawadi and Talawade have IT park. Pimpri-Chinchwad belt is one of the most industrialized areas in the country 11. Auto parts manufacturers, engineering goods and
9 144 cloth manufacturing units are the major industries in Pune. Besides, there are about seven sugar-manufacturing units. The district also possesses co-operative and large-scale industries. Pune district has become a hub of IT services with IT giants establishing their offices in the district. These industries, along with the agriculture and government sector, provide considerable amount of employment to the population in the district as well as in the adjoining districts Education In 2002/03, in the 4440 primary schools and 1099 higher secondary institutes, 6.70 lakh students attended classes. There were 73 Junior colleges with 0.95 lakh students in 2003/04, and 4 Medical, 4 Ayurved, 3 Homeopathy, 5 Law and 12 B.ed colleges, 15 Postgraduate colleges and several ITI institutes were functioning in Pune Land use pattern of Pune district It can be seen from Table 6.4 the total geographical area remained constant i.e thousand hectare during to The area under forest was decline by 4.0 per cent during the last forty-seven years. This suggests for suitable planning for expansion of area under forests to maintain ecological balance in Pune district. The barren and uncultivable land decreased from 10.5 per cent in to 6.6 per cent in This clarifies that, barren and uncultivable land decreased to 31.9 per cent over the base year. The land put on non-agriculture use an increased by 41.5 per cent over the base year. Whereas cultivable waste decreased by 16.5 per cent and land under permanent pasture increased by 9.8 per cent, However land under miscellaneous trees, crops, current fallow and other fallow increased 1689 per cent, per cent and 81.4 per cent respectively. Net sown area of Pune district decreased by 2.5 per cent and area sown more than once increased by 55.1 per cent over the base year. Eventually, it can be seen that gross cropped area increased only 2 per cent during entire period.
10 Changes in cropping pattern of Pune district The details regarding the changes in the cropping pattern during to in Pune district is presented in Table 6.5. It indicated that, the area under total cereals, total pulses and total food grain crops was increased over a period of time. Whereas sugarcane, fruits, vegetables and flowers showed a significant during entire period. While total spices and fodder crop showed a decline. It clearly indicate that during the last fortyseven years, the farmers have diverted their resources towards the commercial crops such as cotton, groundnut, fruits, vegetables, flowers, sugarcane for getting more returns from the farming. Rice, wheat, jawar, bajra, cereals, tur, gram, pulses, sugarcane, cotton, groundnut, sunflower, soyabean, grapes, pomegranate, custard apple, fig, vegetables, flowers were the major crops grown in the district Changes in irrigation pattern of Pune district It shows from Table 6.6 that 67,143.69, , per cent change in irrigated pattern over the base year in respect to period II, period III and period IV. Net area irrigated in was 1030 hectares, which increased to 2699 thousands hectares in The percentage of net area irrigated to net sown area was 10.4 per cent in , which increased to 26.4 per cent in The percentage of gross area irrigated to gross cropped area was per cent in It reveals that the area under irrigation increased significantly, which is good sign from the viewpoint of agricultural development in Pune district. It indicates that irrigated area in increased by 162 per cent over the year but percentage change of net irrigated area after 1991 was comparatively low. It was 77 per cent net growth during to while18 percent during to
11 Land Use and Cropping Pattern of Sample Tahsil The details regarding the land use pattern of sample tahsil ( ) is presented in Table 6.7. It showed from Table 6.7 the total geographical area of sample tahsil ranges from 7 to 9 per cent of district. The area under forest was highest in Khed tahsil (11.29%) followed by Haveli (4.42%). Dound and Haveli have more cultivable waste (above 11%) than Khed and Purandar (6 and 5%). Net sown area was more or less same (8 to 9%). Whereas, gross cropped area was more in Dound (9.85%) followed by Khed (8.97%), Haveli (7.89%) and Purandar (7.60 %). The details regarding the cropping pattern of sample tahsil ( ) is presented in Table 6.8. It is noted that the area under total cereals, total pulses and total food grain crops was highest in Dound (9.28%) followed by Khed (8.91%). Sugarcane and vegetables showed a significant proportion in Dound. Fruits were dominant place in Haveli and Purandar. Area under oilseed seen more in Khed (21.24%) followed by Purandar (9.69%). Fodder crop grown more in Haveli (19.46%). Gross cropped area was more in Dound and Khed of 9.89 and 8.97per cent, respectively Area under irrigation of sample tahsil Table 6.9 shows the area under irrigation of sample tahsil (Ha). Dound having per cent of district total (highest proportion among sample tahsil) followed by Haveli of 8.86 per cent, Khed of 6.68 per cent and Purandar of 4.83 per cent. As regard to gross irrigated to gross cropped area ultimately same position have seen. Dound tahsil was more irrigated, it was 1.5 times more than district average.
12 147 Table 6.4 Changes in land use pattern of Pune district during to (Area in 00 ha) ` Sr.No. Particulars Period I Period II Period III Per cent change over base year Total geographical area Area under forest 1900(12.1) 1856(11.8) 1780(11.0) Barren & uncultivated 1655 (10.5) 1513 (9.8) 1042 (6.6) Land out on non-agriculture use 272 (1.7) 452 (3.7) 640 (4.0) Cultivable waste 27 (0.1) 389 (2.4) 329 (2.4) Permanent pasture and other 293 (1.8) 597 (4.2) 656 (4.2) Land under miscellaneous trees, crops, etc. 12 (0.07) 31 (0.08) 256 (1.6) Current fallow 82 (0.5) 102 (3.0) 621 (3.9) Other fallow 180 (1.16) 371 (2.7) 673 (4.3) Net sown area 10183(65.2) 10309(65.8) 9920(63.5) Area sown more than once 917 (5.8) 1167 (7.4) 1811 (11.5) Gross cropped area 11099(70.7) 11476(73.4) 11731(75.9) (Figures in the bracket indicate percentage of total geographical area) Source-Socio-economic abstract of Pune -2007/08
13 148 Table 6.5 Changes in cropping pattern of Pune district during to (Area in 00 ha) Sr.No. Particulars Period I Period II Period III Period IV Per cent change over the base year Cereals 7211 (64.9) (66.88) 8947 (67.75) 7541 (62.70) Pulses 738 (6.65) 800 (6.85) 822 (6.22) 935 (7.77) Total Food grains 7950 (71.64) 8602 (73.74) 9769 (73.98) 8476 (70.47) Sugarcane 131 (1.18) 269 (2.30) 452 (3.42) 668 (5.55) Spices 72 (0.64) 65 (0.55) 56 (0.42) 68 (0.56) Fruits 34 (0.30) 45 (0.38) 85 (1.64) 170(1.191) Vegetables 162 (1.46) 281 (2.41) 468 (3.54) 633 (5.26) Flowers N.A. N.A. 04 (0.03) 22 (0.18) Fiber crop 74 (0.66) 59 (0.50) 04 (0.03) 378 (3.14) Oil seed 425 (3.83) 691 (5.92) 101(7.70) 748 (6.21) Fodder crop 2079 (18.73) 1645 (14.10) 1345 (10.18) 1208 (10.04) Gross cropped area (Figures in the bracket indicate percentages to gross cropped area) Source: Season and Crop report (2002) published by Department of Agriculture. Government of Maharashtra, Pune.
14 149 Table 6.6 Changes in irrigated area of Pune district during to (00 ha) Sr.No. Particulars Period I Period II Period III Period IV Per cent change over the base year PeriodII PeriodIII PeriodIV Net cropped area Net irrigated area Percentage at net irrigated to net cropped area Area sown more than once Gross irrigated area Percentage of gross irrigated area to gross cropped area Source Season and Crop report (2002) published by Department of Agriculture. Government of Maharashtra, Pune
15 150 Table 6.7 Land use Pattern of Sample Tahsil (2000/01) Sr.No. Particulars Sample Tahsil District Total 1 Total geographical area (8.26) 2 Area under forest 4904 (2.76) 3 Barren & uncultivated (11.58) 4 Land out on non-agriculture use 7272 (11.28) 5 Cultivable waste (11.47) 6 Current fallow 4277 (11.17) 7 Other fallow 3756 (5.59) 8 Net sown area (8.58) 9 Area sown more than once 2745 (1.52) 10 Gross cropped area (9.85) Dound Haveli Khed Purandar (8.56) 7864 (4.42) (14.21) 4091 (6.35) (11.21) 1178 (3.08) (16.59) (8.75) (5.68) (7.89) (Figures in the bracket indicate percentage to respective total) (Source-Socio-economic abstract of Pune -2007/08) (8.80) (11.29) 7533 (7.23) 1997 (3.10) 9530 (5.65) 864 (2.26) 5737 (8.53) 6601 (0.55) (8.97) (8.97) (7.07) 2221 (1.25) 5567 (5.35) 2641 (4.10) 8208 (4.87) 1999 (5.22) 2621 (3.90) (8.18) 3335 (1.85) (7.60)
16 151 Table 6.8 Cropping Pattern of Sample Tahsil (2000/01) Sr.No. Particulars Sample Tahsil Sample District 1. Cereals (9.67) 2. Pulses 5838 (6.21) 3. Total Food grains (9.28) 4. Sugarcane (25.20) 5. Spices 631 (9.50) 6. Fruits 321 (2.29) 7. Vegetables 8366 (14.56) 8. Oil seed 2468 (2.93) 9. Fodder crop (8.89) 10. Gross cropped area (9.89) Dound Haveli Khed Purandar Total (5.87) 2824 (3.00) (5.54) 9400 (15.79) 513 (7.72) 1312 (9.36) 6887 (11.99) 4652 (5.52) (19.46) (7.89) (8.11) (15.16) (8.91) 60 (0.11) 1040 (15.65) 405 (2.89) 8624 (15.00) (21.24) 3019 (2.51) (8.97) (8.64) 3902 (4.15) (8.13) 810 (1.37) 1434 (21.58) 1289 (9.20) 4258 (7.42) 8166 (9.69) 6015 (5.00) (7.60) (Figures in the bracket indicate percentage to respective total) (Source-Socio-economic abstract of Pune District-2007/08)
17 152 Table 6.9 Area under irrigation of sample tahsil (Ha) Sr.No. Particulars Sample Tahsil Sample District 1. Open (14.22) 2. Wells (16.78) 3. Net irrigated area (15.81) 4. Gross irrigated area (15.36) 5. Gross cropped area (9.85) Dound Haveli Khed Purandar 9430 (7.35) (9.96) (8.86) (7.93) (7.89) 8160 (6.36) 9845 (6.77) (6.68) (8.37) (8.97) 5883 (4.59) 7152 (4.92) (4.83) (4.56) (7.60) Percentage at gross irrigated to gross cropped area (Figures in the bracket indicate percentage to respective total) Source-Socio-economic abstract of Pune District -2007/08) Floriculture pattern of Pune district Pune district is leading all the way ahead of other districts in acreage and production of flowers. Area and production of famous flowers in Pune district is showing in Table It shows that marigold, tuberose, rose, chrysanthemum and aster covered major area. Marigold covered higher area i.e per cent where as tuberose, aster and chrysanthemum covered 13.05, and per cent area, respectively, while rose cultivation covered 4.31per cent area. Table 6.10 Area and production of flowers in Pune district Sr.No. Flower Area (Ha) Production (MT.) 1. Aster 900 (13.46) 3010 (L.P.) 2. Chrysanthemum 791 (11.80) 2075 (M.T.) 3. Marigold 3737 (55.75) (M.T.) 4. Rose 289 (4.31) 1192 (L.P.) 5. Tuberose 875 (13.05) 3760 (L.P.) 6. Others 110 (1.64) 76 (MT/LP) Total 6702 (Figures in the bracket indicate percentage to respective total) Source- Data on flowers ( ) District Superintendent Agriculture Officer, Pune district (GSAO), Pune.5
18 153 Table 6.11 Tahsil wise distribution of major flower (Ha) cultivation Sr.No. Tahsil Aster Chrysan themum Marigold Rose Tuberose, Other Total 1. Ambegaon (5.02) 2. Baramati (19) - 402(6.00) 3. Bhor (0.33) 4. Daund - 300(38) 700(19) 40(14) 600(69) (24.84) 5. Haveli (38) (10.18) 6. Indapur (2.81) 7. Junnar 420(47) 215(27) 710(19) (20.59) 8. Khed 198(22) (6.48) 9. Maval (2.18) 10. Mulshi (0.97) 11. Purandar (31) (18.89) 12. Shirur (1.68) 13. Velha (0.08) Total 900 (13.43)) 791 (11.80) 3740 (55.80) 289 (4.32) (12.94) 101 (1.51) 6703 (Figures in the bracket indicate percentage to respective total) Source- Data on flowers ( ) District Superintendent Agriculture Officer, Pune District (DSAO), Pune.5
19 Tahsil wise Concentration of Flowers Table 6.11 presents the tahsil wise distribution of major flower (Ha.) cultivation. It showed that, Dound, Junner and Purandar occupied 65 per cent area while Haveli, Khed, Baramati and Ambegaon occupied 28 per cent area. As regard to flower crops, Junner and Khed occupied 69 per cent of aster, Dound and Junner 65 per cent of chrysanthemum, Dound, Junner and Purandar 69 per cent of marigold, Dound and Haveli 52 per cent of rose, Baramati and Dound 80 per cent of tuberose. It can be concluded that, Dound, Haveli, Junner, Khed and Purandar were the famous tahsil for flower cultivation in reference period. It is remarkable feature that, each tahsil concentrated with one or two flower crop. This is showing in Table Table 6.12 Tahsil Wise Concentration of Flowers Sr.No. Tahsil Flowers 1. Daund Tuberose, Chrysanthemum, Marigold 2. Haveli Aster, Chrysanthemum, Rose and Tuberose 3. Junnar Aster, Chrysanthemum, Marigold, Rose 4. Khed Aster and Marigold 5. Purandar Marigold, Chrysanthemum 6. Baramati Tuberose, Marigold 7. Indapur Aster, Chrysanthemum, Rose, Tuberose 8. Ambegaon Aster, Chrysanthemum, Marigold Source- Data on flowers ( ) District Superintendent Agriculture Officer, Pune district (GSAO), Pune Sample tahsils, flower crops and flower growers Present course of study considered five flowers namely aster, marigold rose, chrysanthemum and tuberose. Flowers taking into account as criteria of maximum coverage of area under flowers in 2007/08 and sold at APMC, Pune. As per this criterion, Khed, Purandar Haveli, and Dound, tahsils were selected for aster, marigold, rose, chrysanthemum and tuberose, respectively. Sample tahsil occupied major area i.e. Khed for aster (198 ha), Purandar for marigold (1154 ha), Haveli for rose198 ha, Dound for chrysanthemum & tuberose (300ha&600 ha).
20 155


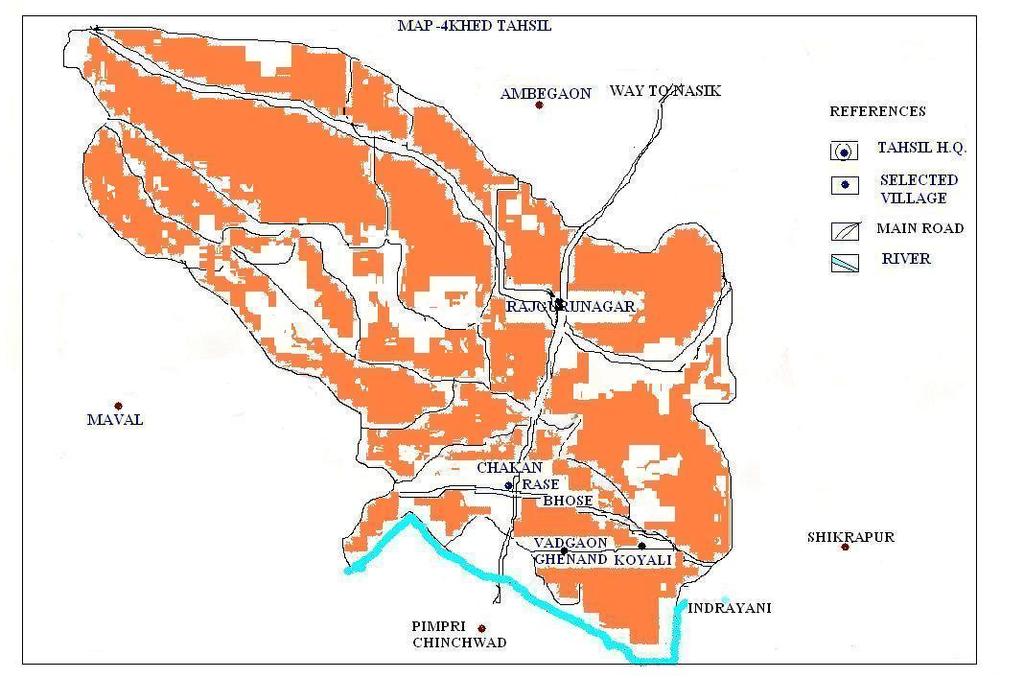
21 Khed tahsil for aster crop Khed tahsil selected as sample tahsil according to famous for aster crop, which occupied 22 per cent of Pune district. Aster crop concentrate at Chakan region of Khed
22 157 tahsil that shown in Map-4. Sample villages taking into consideration as famous for aster crop that selected from different circles which shown in Table 6.13(a). Table 6.13(a) Distribution of sample flower grower of aster by size class (ha) District Total-900 ha. (100%), Total of sample tahsil (Khed)-198 ha. (22%) Sr.No. Name of the circle Name of the village Number of respondent as per land holding size Small Medium Large Total number of respon dents Sampling % to total flower growers in respective village 1 Bhose Bhose 5(24) 3(12) 2(7) 10(43) Bhose Rase 5(20) 3(10) 2(7) 10(37) Wadgaon (Ghenand) 4 Wadgaon (Ghenand) Wadgaon (Ghenand) 5(18) 5(10) 3(6) 13(34) Koyali 5(8) 2(4) 1(3) 8(15) (70) 13(36) 8(23) 41(129) (Figures in the bracket indicate respective total) (Data compiled from circle offices of respective villages /09) Table 6.13 (a) shows that, distribution of sample flower grower of aster by size class (ha). It shows, as per villages, 10 respondents selected from 43 flower growers of Bhose village. 10 respondents selected from 37 flower growers of Rase village. 13 respondents selected from 34 flower growers of Wadgaon Ghenand village. 8 respondents selected from 15 flower growers of Koyali village, In terms of numbers, small landholders seems to be maximum followed by medium and large size group of farms, respectively whereas sampling proportion is on an average 32 per cent of total flower growers in respective villages. Table 6.13(b) Distributions of area under aster in selected villages (ha) Sr.No. Name of the village Area under aster of the sampl villages(ha) Sample area(ha) 1 Bhose (25) 2 Rase (28) 3 Wadgaon(Ghenand) (43) 4 Koyali (48) (35) (Figures in the bracket indicate percentage to respective total) (Data compiled from circle offices of respective villages /09)
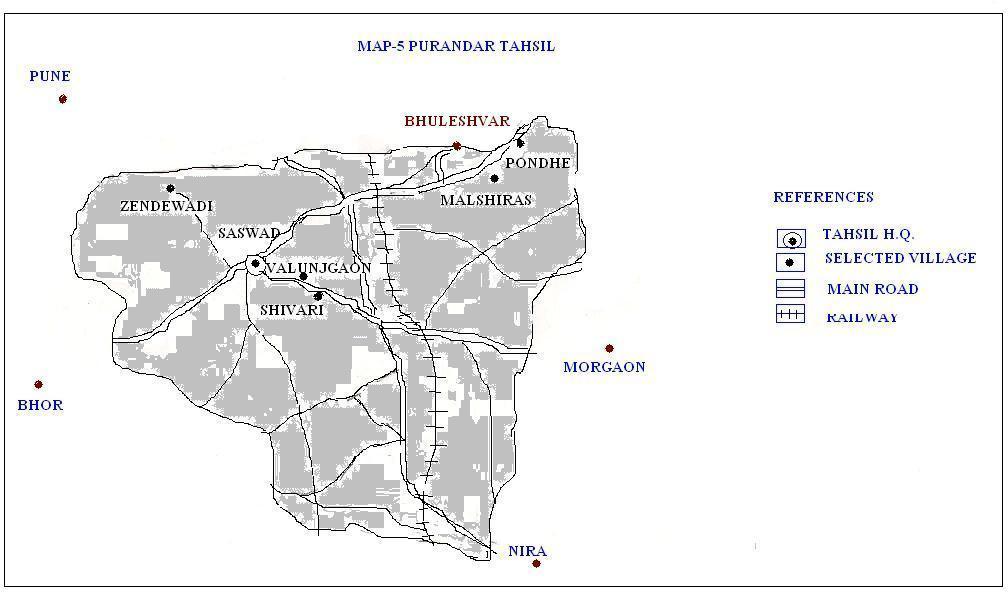
23 158 Table 6.13(b) shows that, Bhose village occupied maximum area under aster followed by Rase, Wadgaon, and Koyali, respectively. In terms of area, sampling proportion is on an average 35 per cent in respective villages Purandar tahsil for marigold crop Purandar tahsil selected as sample tahsil according to famous for marigold crop, which occupied 30.8 per cent of Pune district. Marigold crop concentrate at whole region of Purandar tahsil that shown in Map-5. Sample villages taking into consideration as famous for aster crop that selected from different circles which shown in Table 6.14(a). Table 6.14 (a) Distribution of sample flower growers of marigold by size class (ha) Study area: Pune district ha. (100%), Sample tahsil: Purandar-1154 ha. (30.8%) Sr.No. Name of the circle Name of the village Number of respondent as per land holding size Total number of respon dent Sampling % to total flower growers in respective village Small Medium Large 1 Shivari Shivari 3(20) 3(13) 5(11) 11(44) 25 2 Shivari Valunjgaon 3(14) 3(8) 1(2) 7(24) 29 3 Dive Zendewadi 5(19) 1(3) 1(3) 7(25) 28 4 Malshiras Malshiras 3(22) 3(10) 2(8) 8(40) 20 5 Malshiras Ponde 4(23) 3(11) 1(3) 8(37) (98) 13(45) 10(27) 41(170) 25 (Figures in the bracket indicate respective total) (Data compiled from circle office of respective villages-2008/09) Table 6.14 (a) shows that, distribution of sample flower grower of marigold by size class (ha). It shows, as per villages, 11 respondents selected from 44 flower growers of Shivari village. 7 respondents selected from 24 flower growers of Valunjgaon village. 7 respondents selected from 25 flower growers of Zendewadi village. 8 respondents selected from 40 flower growers of Malshiras village and 8 respondents selected from37 flower growers of Ponde village, In terms of numbers, small landholders seems to be maximum followed by medium and large size group of farms, respectively whereas
24 159 sampling proportion is on an average 25 per cent of total flower growers in respective villages. Table 6.14 (b) Distributions of area under marigold in selected villages (ha) Sr.No. Name of the village Area under marigold of the sample villages(ha) Sample area(ha) 1 Shivari (32) 2 Valunjgaon (34) 3 Zendewadi (30) 4 Malshiras (23) 5 Ponde (25) (29) (Figures in the bracket indicate percentage to respective total) (Data compiled from circle offices of respective villages /09) Table 6.14(b) shows that maximum area under marigold occupied Shivari village followed by Malshiras, Ponde, Valunjgaon and Zendewadi, respectively. In terms of area, sampling proportion is on an average 29 per cent in respective villages Haveli tahsil for rose crop Haveli tahsil selected as sample tahsil according to famous for rose crop, which occupied 38 per cent of Pune district. Rose crop concentrate at Solapur highway area of Haveli tahsil that shown in Map-6. Sample villages selected from different circles taking into consideration as famous (large area) for rose crop which shown in Table 6.15(a). Table6.15 (a) Distribution of sample cultivator of rose by size class (rose) District total-289ha (100%), Total of sample tahsil (Haveli) 110 ha (38 %) Sr.No. Name of the circle Name of the village Number of respondent as per land holding size Small Medium Large Total no. of respon dents Sampling % to total flower growers in respective village 1 Hadapsar Phursungi 4(11) 4(9) 3(7) 11(27) Loni kalbhor Sortapwadi 5(13) 3(6) 2(5) 10(24) Theur Kunjeerwadi 3(8) 3(5) 2(4) 8(17) Total (32) 10(20) 7(16) 29(68) (Figures in the bracket indicate respective total) (Data compiled from circle offices of concerned villages -2008/09)
25 160 It shows that, distribution of sample flower grower of rose by size class (ha). It shows, as per villages, 11 respondents selected from 27 flower growers of Phursungi village. 10 respondents selected from 24 flower growers of Sortapwadi village. 8 respondents selected from 17 flower growers of Kunjeerwadi village, In terms of numbers, small landholders seems to be maximum followed by medium and large size group of farms, respectively whereas sampling proportion is on an average 43 per cent of total flower growers in respective villages. Table 6.15 (b) Distributions of area under rose in selected villages (ha) Sr.No. Name of the village Area under rose of the sample villages(ha) Sample area(ha) 1 Phursungi (42) 2 Sortapwadi (42) 3 Kunjeerwadi (49) (44) (Figures in the bracket indicate percentage to respective total) (Data compiled from circle offices of respective villages /09) Table 6.15(b) shows that Phursungi village occupied maximum area under rose followed by Sortapwadi and Kunjeerwadi, respectively. In terms of area, sampling proportion is on an average 44 per cent in respective villages Dound tahsil for chrysanthemum crop Dound tahsil selected as sample tahsil according to famous for chrysanthemum crop, which occupied 38 per cent of Pune district. Chrysanthemum crop concentrate at Solapur highway area of Dound tahsil that shown in Map-7. Sample villages taking into consideration as famous for chrysanthemum crop that selected from different circles which shown in Table 6.16(a). Table 6.16 (a) shows that, distribution of sample flower grower of chrysanthemum by size class (ha). It shows, as per villages, 25respondents selected from 85 flower growers of Yavat village. 11 respondents selected from 26 flower growers of Yavat (Station) village. 15 respondents selected from 29 flower growers of Wakhari village, In
26 161 terms of numbers, small landholders seems to be maximum followed by medium and large size group of farms, respectively whereas sampling proportion is on an average 40 per cent of total flower growers in respective villages. Table 6.16 (a) Distribution of sample flower grower of chrysanthemum by size class (Ha) (District total-791 ha. (100%), Total of sample tahsil (Dound)-300 ha. (38%)) Sr.No. Name of the circle Name of the village Number of respondent as per land holding size Small Medium Large Total no. of respon dents Sampling % to total flower growers in respective village 1 Yavat Yavat 12(40) 9(38) 4(7) 25(85) Yavat Yavat (station) 5(18) 4(6) 2(2) 11(26) Kedgaon Wakhari 6(17) 4(8) 5(5) 15(29) (75) 17(51) 11(14) 51(140) (Figures in the bracket indicate respective total) (Compiled from talathi office of concerned villages /09) Table 6.16(b) Distributions of area under chrysanthemum in selected villages (ha) Sr.No. Name of the village Area under chrysanthemum of the sample villages(ha) Sample area(ha) 1 Yavat (32) 2 Yavat(station) (39) 3 Wakhari (63) (40) (Figures in the bracket indicate percentage to respective total) (Data compiled from circle offices of respective villages /09) Table 6.16(b) shows that maximum area under rose occupied Yavat village followed by Wakhari and Yavat (station) respectively. In terms of area, sampling proportion is on an average 44 per cent in respective villages Dound tahsil for tuberose crop Dound tahsil selected as sample tahsil according to famous for tuberose crop, which occupied 38 per cent of Pune district. Chrysanthemum crop concentrate at Sholapur highway area of Dound tahsil that shown in Map-7. Sample villages taking into
27 162 consideration as famous for tuberose crop that selected from different circles which shown in Table 6.17(a) Table 6.17 (a) Distribution of sample flower growers of tuberose by size class District total- 875 ha. (100%), Total of sample tahsil (Dound)-600 ha. (68.57%) Sr.No. Name of the circle Name of the village Number of respondent as per land holding size Total no. of respon dents Sampling % to total flower growers in respective village Small Medium Large 1 Yavat Yavat 11(59) 8(48) 7(30) 26(137) Yavat Yavat (station) 6(20) 4(10) 2(7) 12(37) Kedgaon Wakhari 4(11) 3(7) 2(5) 9(23) Varwand Varvand 2(8) 2(4) 1(3) 5(15) Total (98) 17(69) 12(45) 52(212) (Figures in the bracket indicate respective total) (Data compiled from circle offices of concerned villages /09) It shows from Table 6.17(a) that, distribution of sample flower grower of tuberose by size class (ha). It shows, as per villages, 26 respondents selected from 137 flower growers of Yavat village. 12 respondents selected from 37 flower growers of Yavat (station village. 9 respondents selected from 23 flower growers of Wakhari village. 5 respondents selected from 15 flower growers of Varvand village, In terms of numbers, small landholders seems to be maximum followed by medium and large size group of farms, respectively whereas sampling proportion is on an average 26 per cent of total flower growers in respective villages. Table 6.17(b) Distributions of area under tuberose in selected villages (ha) Sr.No. Name of the village Area under tuberose of the sample villages(ha) Sample area(ha) 1 Yavat (20) 2 Yavat(station) (33) 3 Wakhari 8 3.2(40) 4 Varvand 5 1.8(36) (25) (Figures in the bracket indicate percentage to respective total) (Data compiled from circle offices of respective villages /09)
28 163 Table 6.17(b) shows that maximum area under tuberose occupied Yavat village followed by Yavat (station) Wakhari and Varvand, respectively. In terms of area, sampling proportion is on an average 25 per cent in respective villages Socio-economic indicators of sample farms Information access pertaining socio-economic features of the selected farm i.e. family size, farm size and cropping pattern and analyzed as below Family size of the sample farms Flower cultivation requires comparatively more work force to various farm activities such as planting, weeding, picking of flowers, etc. To check the relationship between family size and their farm involvement, data has collected pertaining to this aspect as presented in Table-6.18 It observed from the Table that average size of family was 5.7 at the overall level. The average number of members among small, medium and large size group of farms was 5.3, 5.7 and 6.1, respectively. The composition of family at the overall level shows that each family has 2.1 adult males, 1.7 adult females and 1.9 children. As compared to different size group of farms, number of men, women and children showed relatively more in large size group followed by medium and small. According to cost of cultivation record, family member used as a labour relatively more in small. As a result of family size and cost of cultivation record, member of families among large size group involved relatively low in farm activities. As regard to number of earner and dependent, it showed 42 per cent and 58 per cent, respectively, at overall level while different size group indicate that dependent numbers were more (60%) among small and medium size group of farms Educational status of the sample farms The data on educational status of the selected farm family has presented in Table It observed from the Table that the percentage of illiteracy observed 10 per cent of
29 164 male while 11 per cent of female at overall level. The percentage of primary level schooling observed 36 per cent of male while 41 per cent of female and 40 per cent of children s. The percentage of secondary level schooling observed 41 per cent of male while 37 per cent of female and 39 per cent of children. The percentage of graduation level observed 13 per cent of male while 12 per cent of female Land use pattern of the sample farms Land use pattern in different size groups of farms is presented in Table The average size of the holding in the small, medium and large groups of farm found 1.37, 2.79 and 5.85 hectares, respectively. The proportion of operational land was 88 per cent at overall level it was 91, 87 and 85 per cent at small, medium and large size of farms, respectively. It was seen that the land under irrigation was more in large size group (2.65 ha.) in fact proportional percentage of irrigated area was more in small sized group (77%) followed by medium (67%) and large (53%). Flower crop wise comparison showed that aster and marigold concentrated area (Khed and Purandar) was relatively less irrigated compare to others at all categories. It would be seen the same features of proportion of area sown more than once and gross cropped area which related to irrigation facilities Cropping pattern of the sample farms To understand the cropping pattern of sample flower grower, crops classified in four categories such as food grains, flowers, other cash crops and ordinary crops. This presented in Table Food grains include jawar(r), bajara (K), wheat(r); other cash crops include sugarcane, groundnut, vegetables; flowers include aster, marigold, chrysanthemum, rose and tuberose; other ordinary crops include gram mug fodder, etc. It can be observed from Table 6.21 that at the overall level the gross cropped area was 3.50 hectares. Food grain crops occupied 34.3 per cent, flower crops 19 per cent, other cash crops 26.6 per cent and other ordinary crops 20.1 per cent at overall level. As compare to different size group of farms food grains occupied major area i.e per cent 33.5 per
30 165 cent and 36.5 per cent of small, medium and large size group of farms, respectively. Flowers occupied of 15.5, 18.3, and 20 per cent; other cash crops of 20, 22, and 31.3 per cent; other ordinary crops of 36, 26.2 and 12.2 per cent among small, medium and large size group of farms, respectively. Above analysis, indicate that food grains occupied major area at all size groups whereas, flower crops occupied noticeable proportion with compare to others. Cropping intensity showed decreases with increasing size of farms because decreasing ratio of operational land. It was 177, 167 and 153 per cent of small, medium and large size of groups, respectively whereas; it was per cent at overall level. Table-6.18 Average family size of the sample flower grower by size class Sr.No. Farm size/ Flower type 1 Small Adult Children No. Male Female Male Female of earner No. of dependent a Aster b Marigold c Chrysanthemum d Rose e Tuberose Medium a Aster b Marigold c Chrysanthemum d Rose e Tuberose Large a Aster b Marigold c Chrysanthemum d Rose Overall 1 Small 1.84 (34) 2 Medium 2.02 (35) 3 Large 2.34 (38) 4 Overall 2.07 (36) 1.56 (30) 1.82 (32) 1.9 (31) 1.76 (31) 0.98 (18) 1.02 (18) 1.04 (17) 1.02 (18) 0.98 (18) 0.88 (15) 0.86 (14) 0.91 (15) (Figures in the bracket indicate percentage to respective total) 2.16 (40) 2.3 (40) 2.76 (45) 2.4 (42) 3.2 (60) 3.46 (60) 3.40 (55) 3.34 (58) Total
31 166 Sr.No. 1 S M A L L 2 M E D I U M 3 L A R G E Illite rate 4 S 0.18 (10) M 0.22 (11) L 0.24 (9) O 0.22 (10) Prim ary Table 6.19Educational status of family of sample flower grower Higher Grad uation Total male (Adult) Illite rate Prim ary Higher Grad uation Total female (Adult) Preprim ary Prim ary Higher Total child ren Grand total (33) 0.7 (35) 0.9 (39) 0.74 (36) 0.8 (45) 0.8 (40) 0.9 (39) 0.84 (41) 0.22 (12) 0.3 (14) 0.3 (13) 0.28 (13) 1.84 (34) 2.02 (35) 2.34 (38) 2.07 (36) 0.14 (10) 0.22 (11) 0.2 (11) 0.19 (11) 0.7 (47) 0.7 (39) 0.7 (37) 0.7 (41) 0.6 (35) 0.6 (33) 0.7 (42) 0.64 (37) (Figures in the bracket indicate percentage to respective total) Source- Derived from primary data collected by researcher 0.12 (8) 0.3 (17) 0.3 (10) 0.24 (12) 1.56 (30) 1.82 (32) 1.9 (31) 1.76 (31) 0.46 (22) 0.26 (16) 0.44 (26) 0.36 (21) 0.8 (39) 0.9 (42) 0.7 (37) 0.8 (40) 0.7 (39) 0.8 (42) 0.8 (37) 0.77 (39) 1.96 (36) 1.9 (33) 1.9 (31) 1.92 (33)
32 167 Table-6.20 Land use pattern of sample flower grower by size class (ha) Sr. No Flower/ Farm size 1 Small Total owned Land Operational Land Irrigated Land Unirrigated Land Area sown more than once Gross cropped area Cropping intensity % Aster Marigold Chrysanthemum Rose Tuberose Medium Aster Marigold Chrysanthemum Rose Tuberose Large Aster Marigold Chrysanthemum Rose Tuberose Overall Aster Marigold Chrysanthemum Rose Tuberose Small (91) 2 Medium (87) 3 Large (85) 4 Overall (88) 0.96 (77) 1.63 (67) 2.65 (53) 1.75 (66) 0.3 (23) 0.81 (33) 2.33 (47) 1.15 (34) (Figures in the bracket indicate percentage to respective total) Source- Derived from primary data collected by researcher
33 168 Table-6.21Cropping pattern of sample flower grower by size class (ha) Sr.No. Flower/Farm size Food grains 1 Small Flowers Other cash crops Other ordinary crop Gross cropped area Aster Marigold Chrysanthemum Rose Tuberose Medium 3 Large Aster Marigold Chrysanthemum Rose Tuberose Aster Marigold Chrysanthemum Rose Tuberose Small 0.55 (28.5) 2 Medium 1.10 (33.5) 3 Large 1.93 (36.5) 4 Overall 1.20 (34.3) 0.30 (15.5) 0.60 (18.3) 1.05 (20) 0.66 (19) 0.38 (20) 0.72 (22) 1.66 (31.3) 0.93 (26.6) (Figures in the bracket indicate percentage to respective total) Source- Derived from primary data collected by researcher Concluding observations 0.7 (36) 0.86 (26.2) 0.65 (12.2) 0.49 (20.1) Concluding observations of sample area, i.e. Pune district summarized as follows Pune district having favourable agro-climatic conditions and infrastructure (market and transportation), which offering tremendous scope for horticulture.
34 169 2 Rice, wheat, jawar, bajra, cereals, tur, gram, pulses, sugarcane, cotton, groundnut, sunflower, soyabean, grapes pomegranate, custard apple, fig, vegetables, flowers were the major crops growing in the district. 3 District having large area under flowers compared to other district. It observed that, Dound, Haveli, Junner, Khed and Purandar were the famous tahsil for flower cultivation in reference period. 4 Tahsil bordered to Pune city observed famous for flower cultivation, particularly those villages situated around urban areas are famous flower growing villages. 5 It observed that, maximum numbers of flower grower belonging small and medium group of farms. 6 Haveli and Dound are canal irrigated tahsil growing perennial flower crops; whereas, Purandar and Khed are less irrigated tahsil growing seasonal flower crops. 7 It shows that marigold, tuberose, rose, chrysanthemum and aster covered major area. 8 Cropping intensity in the district showed decreases with increasing size of farms, due to decreasing ratio of operational land. 9 According to survey, the composition of family of sample flower growers shows that each family have 2.1 adult males, 1.7 adult females and 1.9 children at the overall level. 10 It observed that the percentage of illiteracy observed 10 per cent of male while 11 per cent of female at overall level.
35 170 References 1 Kotak Mahadev Ramchandra(2000) Shivpurvakalin and Shivkalin Pune, Shahar Pune (Ed) Arun Tokekar,Nilubhau Limaye Foundation 2 Maharashtra at a Glance (2005) Directorate General of Information and Public Relation, Government Central Press, Mumbai 3 Maharashtra at a Glance (2005) Directorate General of Information and Public Relation, Government Central Press, Mumbai 4 Maharashtra at a Glance (2005) Directorate General of Information and Public Relation, Government Central Press, Mumbai 5 Maharashtra at a Glance (2005) Directorate General of Information and Public Relation, Government Central Press, Mumbai 6 Maharashtra at a Glance (2005) Directorate General of Information and Public Relation, Government Central Press, Mumbai 7 Socio Economic Abstract of Pune-( ) Directorate of Economics and Statistics, GoM, Mumbai. 8 Socio Economic Abstract of Pune-( ) Directorate of Economics and Statistics, GoM, Mumbai. 9 Handbook of Basic Statistics of Maharashtra State (2004) Directorate of Economics and Statistics, GoM, Mumbai. 10 Socio Economic Abstract of Pune-( ) Directorate of Economics and Statistics, GoM, Mumbai. 11 Socio Economic Abstract of Pune-( ) Directorate of Economics and Statistics, GoM, Mumbai 12 Maharashtra at a Glance (2005) Directorate General of Information and Public Relation, Government Central Press, Mumbai
Agricultural Productivity of the Baramati Tahsil, Pune District (Maharashtra).
.") IOSR Journal of Agriculture and Veterinary Science (IOSR-JAVS) e-issn: 2319-2380, p-issn: 2319-2372. Volume 7, Issue 5 Ver. II (May. 2014), PP 25-30 Agricultural of the Baramati Tahsil, Pune District (Maharashtra).
IOSR Journal of Agriculture and Veterinary Science (IOSR-JAVS) e-issn: 2319-2380, p-issn: 2319-2372. Volume 7, Issue 5 Ver. II (May. 2014), PP 25-30 Agricultural of the Baramati Tahsil, Pune District (Maharashtra).
Scope and Prospects of Agricultural Production in Kolhapur District of Maharashtra, India
 International Journal of Current Microbiology and Applied Sciences ISSN: 2319-7706 Volume 6 Number 11 (2017) pp. 2478-2485 Journal homepage: http://www.ijcmas.com Original Research Article https://doi.org/10.20546/ijcmas.2017.611.291
BACKGROUND OF STUDY REGION
 CHAPTER-II BACKGROUND OF STUDY REGION 2.1 General Introduction 2.2 Location, Site and Situation 2.3 Geology 2.4 Physiography 2.5 Drainage 2.6 Climate 2.7 Types of Soil 2.8 Forest 2.9 Transportation 2.10
CHAPTER I 1.1 Introduction
 CHAPTER I 1.1 Introduction Pulses in India have long been considered as the poor man s source of protein. Pulses are grown in 22-23 million hectares of area with an annual production of 13-15 million tones
International Journal of Advance ISSN and Applied Research (IJAAR) A GEOGRAPHICAL ANALYSIS OF GHOD FOREST DIVISION, JUNNAR, DISTRICT -PUNE
 A GEOGRAPHICAL ANALYSIS OF GHOD FOREST DIVISION, JUNNAR, DISTRICT -PUNE") International Journal of Advance ISSN 2347-7075 and Applied Research (IJAAR) Vol. 1 No.3 Peer Reviewed Bi-Monthly Jan Feb 2014 A GEOGRAPHICAL ANALYSIS OF GHOD FOREST DIVISION, JUNNAR, DISTRICT -PUNE Mr.
International Journal of Advance ISSN 2347-7075 and Applied Research (IJAAR) Vol. 1 No.3 Peer Reviewed Bi-Monthly Jan Feb 2014 A GEOGRAPHICAL ANALYSIS OF GHOD FOREST DIVISION, JUNNAR, DISTRICT -PUNE Mr.
An Assessment Impact of Irrigation on Cropping Pattern in Solapur District with Special Reference of Case Study in Sample Selected Villages
 EUROPEAN ACADEMIC RESEARCH Vol. II, Issue 3/ June 2014 ISSN 2286-4822 www.euacademic.org Impact Factor: 3.1 (UIF) DRJI Value: 5.9 (B+) An Assessment Impact of Irrigation on Cropping Pattern in Solapur
A Geographical Perspective on Land Use Pattern in Solapur District of Maharashtra
 A Geographical Perspective on Land Use Pattern in Solapur District of Maharashtra Dr. P. P. Ubale Associate Professor,UG & PG, Department Of Geography, K.B.Patil Mahavidyalaya, Pandharpur, Dist. Solapur
CHAPTER 4. Agriculture Census Results All India All Social Groups
 26 (A) Operational holdings CHAPTER 4 Agriculture Census Results All India All Social Groups 4.1 Distribution of operational Holdings 4.1.1 The number of operational holdings has been consistently increasing
International Journal of Advance ISSN and Applied Research (IJAAR)
") International Journal of Advance ISSN 2347-7075 and Applied Research (IJAAR) Vol. 1 No.3 Peer Reviewed Bi-Monthly Jan Feb 2014 CHANGING CROPPING PATTERN IN PANCHAGANGA BASIN, MAHARASHTRA: A GEOGRAPHICAL
International Journal of Advance ISSN 2347-7075 and Applied Research (IJAAR) Vol. 1 No.3 Peer Reviewed Bi-Monthly Jan Feb 2014 CHANGING CROPPING PATTERN IN PANCHAGANGA BASIN, MAHARASHTRA: A GEOGRAPHICAL
International Multidisciplinary e-journal ISSN
 International Multidisciplinary e-journal ISSN 2277-4262 AGRICULTURAL PROBLEMS OF WEST MAHARASHTRA (SPECIALLY AHMEDNAGAR DISTRICT) Prof. Waghmode B.M. Department of Economics S.S.G.M.College, Kopargaon
AGRICULTURAL PRODUCTIVITY
 CHAPTER VI AGRICULTURAL PRODUCTIVITY 6.1 Introduction 6.2 Enyedi s Productivity Index 6.3 Productivity of Jowar 6.4 Productivity of Wheat 6.5 Productivity of Bajara 6.6 Productivity of Sugarcane 6.7 Quantitative
Variorum, Multi- Disciplinary e-research Journal Vol.-01, Issue-IV, May 2011
 1 Change in General Land Use Pattern in Raigarh District: A Geographical Analysis Mr. Deepak. S. Narkhede: Head, Dept. of Geography, C.K. Thakur College, New Panvel, Dist. Raigarh Dr. Sameer A. Butala:
DIRECTORATE OF ECONOMICS AND STATISTICS, PLANNING DEPARTMENT, GOVERNMENT OF MAHARASHTRA, MUMBAI
 DIRECTORATE OF ECONOMICS AND STATISTICS, PLANNING DEPARTMENT, GOVERNMENT OF MAHARASHTRA, MUMBAI DIRECTORATE OF ECONOMICS AND STATISTICS, PLANNING DEPARTMENT, GOVERNMENT OF MAHARASHTRA, MUMBAI PREFACE Economic
B. Articles. Identification of Predominant Farming Systems and their Economics in Telangana Region of Andhra Pradesh
 B. Articles Identification of Predominant Farming Systems and their Economics in Telangana Region of Andhra Pradesh V. RAJENDRA PRASAD, M. MALLA REDDY AND M. V. RAMANA* Introduction Telangana is one of
CHAPTER - VIII SAMPLE SURVEY MICRO LEVEL CASE STUDIES This chapter is devoted to study the sample villages at micro level selected from each of the
 CHAPTER - VIII SAMPLE SURVEY MICRO LEVEL CASE STUDIES This chapter is devoted to study the sample villages at micro level selected from each of the crop combination zone. This helps to evaluate the interactions
CASE STUDY OF SAMPLE VILLAGES
 Chapter VIII CASE STUDY OF SAMPLE VILLAGES 8.1 INTRODUCTION 8.2 REASONING FOR SAMPLING OF VILLAGES 8.3 KOLVE 8.4 KHARSAI 8.5 VARSE 8.6 SHRIGAON 8.7 WAVE DIWALI 8.8 SHILOSHI 8.9 KADAV 8.10 TUPGAON 8.11
Economic Analysis of Tribal Farm in Gadchiroli District of Maharashtra, India
 International Journal of Current Microbiology and Applied Sciences ISSN: 2319-7706 Volume 7 Number 07 (2018) Journal homepage: http://www.ijcmas.com Original Research Article https://doi.org/10.20546/ijcmas.2018.707.247
Special Seminar on Food Security: Focusing on Water management and Sustainable Agriculture
 Special Seminar on Food Security: Focusing on Water management and Sustainable Agriculture Kyi Myint Ministry of Agriculture and Irrigation Location Latitude 9 58-28 31 N Longitude 92 9-100 10 E Country
Development of Irrigation and Its Impact on Agriculture in Punjab: to
 IOSR Journal of Agriculture and Veterinary Science (IOSR-JAVS) e-issn: 2319-2380, p-issn: 2319-2372. Volume 10, Issue 6 Ver. II (June. 2017), PP 57-63 www.iosrjournals.org Development of Irrigation and
Agricultural Development in Karnataka: A Critical Analysis
 Agricultural Development in Karnataka: A Critical Analysis Vidya K 1 and Ravindranath N. Kadam 2 1 Dept. of P.G.Studies and Research in Economics, Sahyadri Arts College (A constituent College of Kuvempu
Growth in area, production and productivity of major crops in Karnataka*
 Karnataka J. Agric. Sci.,25 (4) : (431-436) 2012 Introduction Growth in area, production and productivity of major crops in Karnataka* SARASWATI POUDEL ACHARYA, H. BASAVARAJA, L. B. KUNNAL, S. B. MAHAJANASHETTI
International Journal of Advance ISSN and Applied Research (IJAAR)
") International Journal of Advance ISSN 2347-7075 and Applied Research (IJAAR) Vol. 1 No.4 Peer Reviewed Bi-Monthly Mar- Apr 2014 A GEOGRAPHICAL STUDY OF SPATIAL VARIATION IN CROP COMBINATION OF JUNNAR TAHSIL,
International Journal of Advance ISSN 2347-7075 and Applied Research (IJAAR) Vol. 1 No.4 Peer Reviewed Bi-Monthly Mar- Apr 2014 A GEOGRAPHICAL STUDY OF SPATIAL VARIATION IN CROP COMBINATION OF JUNNAR TAHSIL,
Chapter -06 Socio-Economic Charecteristics of the Districts Selected for the Primary Data Collection
 Chapter -06 Socio-Economic Charecteristics of the Districts Selected for the Primary Data Collection Introduction 6.1 Ahmednagar 6.1.1 Area and Administrative Services 6.1.2 Natural Features 6.1.3 Land
CASE STUDIES OF SAMPLE VILLAGES
 CHAPTER-VI CASE STUDIES OF SAMPLE VILLAGES 6.1 General Introduction 6.2 Basis of Sampling 6.3 Landuse Pattern of Sample villages (a) Nimbut Village (a) Padali Village (a) Naigaon Village 6.4 Resume 146
DEPARTMENT OF ECONOMICS
 DEPARTMENT OF ECONOMICS AGRICULTURE IN MAHARASHTRA: EMERGING ISSUES AND CHALLENGES BY R.G. Dandge Arun Pawar WORKING PAPER UDE 11/7/2003 OCTOBER 2003 DEPARTMENT OF ECONOMICS UNIVERSITY OF MUMBAI Vidyanagari,
Implications of Dynamics of Land Use Shifts in Rajasthan
 Annals of Arid Zone 53(3&4): 177-183, 2014 Implications of Dynamics of Land Use Shifts in Rajasthan Latika Sharma Rajasthan College of Agriculture, MPUAT, Udaipur 313 001, India Abstract: Land use pattern
Change in Land Use and Cropping Pattern in Assam: An Economic Analysis
 Economic Affairs, Vol. 63, No. 1, pp. 39-43, March 2018 DOI: 10.30954/0424-2513.2018.00150.5 2018 New Delhi Publishers. All rights reserved Change in and Use and Cropping Pattern in Assam: An Economic
Target. Target Amt % 3 Total Agri NFS / MSME
 EXECUTIVE SUMMARY I Theme of the The development of the economy or sector depends upon capital formation. India is an agrarian country. However, the contribution to national GDP is not in proportion to
Growth and Performance of Agro Based Industries in Punjab
 Growth and Performance of Agro Based Industries in Punjab Vikrant Dhawan * & Kashish** * Research fellow, Department of Agronomy, Punjab Agricultural University Ludhiana **Research Scholar, Department
Changing Pattern of Area, Production and Productivity of Principal Crops in Haryana, India
 Int.J.Curr.Microbiol.App.Sci () (): - International Journal of Current Microbiology and Applied Sciences ISSN: - Volume Number () pp. - Journal homepage: http://www.ijcmas.com Original Research Article
POTENTIAL LINKED CREDIT PLAN , BEED DISTRICT EXECUTIVE SUMMARY
 POTENTIAL LINKED CREDIT PLAN 2016-17, BEED DISTRICT General EXECUTIVE SUMMARY NABARD has been preparing Potential Linked Credit Plan (PLP) for the district annually which forms the basis of the Annual
Impact of Jamda medium irrigation project on irrigeted land cover in its command area in Jalgaon district
 2017; 3(11): 304-308 ISSN Print: 2394-7500 ISSN Online: 2394-5869 Impact Factor: 5.2 IJAR 2017; 3(11): 304-308 www.allresearchjournal.com Received: 19-09-2017 Accepted: 20-10-2017 Assistant Professor,
SOCIO ECONOMIC PROFILE OF THE SAMPLE HOUSEHOLDS
 CHAPTER - V SOCIO ECONOMIC PROFILE OF THE SAMPLE HOUSEHOLDS 46 SOCIO ECONOMIC PROFILE OF THE SAMPLE HOUSEHOLDS In this chapter an attempt is made to present socio, demographic and economic profile of sample
Temporal Land Use and Cropping Pattern in Amravati District of Maharashtra State
 Temporal Land Use and Cropping Pattern in Amravati District of Maharashtra State National Academy of Agricultural Science (NAAS) Rating : 3. 03 Serials Publications Temporal Land Use and Cropping Pattern
Status of growth in area, production and productivity of major crops in Jammu province of J&K State
 Indian J. Agric. Res., 51 (4) 2017 : 333-338 Print ISSN:0367-8245 / Online ISSN:0976-058X AGRICULTURAL RESEARCH COMMUNICATION CENTRE www.arccjournals.com/www.ijarjournal.com Status of growth in area, production
Inter-state Disparities in Socio-economic Development in North East Region of India
 Journal of Agricultural Science; Vol. 4, No. 9; 2012 ISSN 1916-9752 E-ISSN 1916-9760 Published by Canadian Center of Science and Education Inter-state Disparities in Socio-economic Development in North
AGRICULTURAL ECONOMY OF MARATHWADA REGION AND SELECTED FARMERS
 CHAPTER III AGRICULTURAL ECONOMY OF MARATHWADA REGION AND SELECTED FARMERS INTRODUCTION The chapter presents arief description in district-wise of Marathwada, the area selected for the study. Based on
SUSTAINABLE AGRICULTURE DEVELOPMENT IN INDIA: A CASE STUDY OF UTTAR PRADESH ABSTRACT
 SUSTAINABLE AGRICULTURE DEVELOPMENT IN INDIA: A CASE STUDY OF UTTAR PRADESH ABSTRACT Agriculture is a critical sector of the Indian economy. It forms the backbone of development in the country. An average
Land Use pattern and Prospects of Paschim Medinipur District, West Bengal
 Land Use pattern and Prospects of Paschim Medinipur District, West Bengal Asit Kumar Jana Govt. Approved Part-Time Teacher Department of Geography Garhbeta College, West Bengal Email: asitgeo31@gmail.com
Sreedhar Patil 5/30/2013
 Farming in India Sreedhar Patil 5/30/2013 Location of India in World Map States in India Bangalore, Karnataka, INDIA 28 states and seven union territories Annual Rainfall in India Rivers in India River
Demands of Changes in Cropping Pattern: A Case Study of Akole Tahasil (M.S, India)
") International Journal of Science and Research (IJSR) Demands of Changes in Cropping Pattern: A Case Study of Akole Tahasil (M.S, India) Mhaske Pandurang Hanumant 1, Tupe Babasaheb Karbhari 2 1 Associate
International Journal of Science and Research (IJSR) Demands of Changes in Cropping Pattern: A Case Study of Akole Tahasil (M.S, India) Mhaske Pandurang Hanumant 1, Tupe Babasaheb Karbhari 2 1 Associate
Supply Chain Management in Tomatoes in Maharashtra
 Supply Chain Management in Tomatoes in Maharashtra Dr. Sangita Vishnu Warade Assistant Professor, School of Agri-Business Management, College of Agriculture, Nagpur-01, Maharashtra, India Abstract: The
INDIA - Agricultural Census 2001 & Livestock Census 2003
 INDIA - Agricultural Census 2001 & Livestock Census 2003 Number and area of holdings Number and area of holdings by size Under 0.5 ha 51 243 000 12 329 000 0.5 and under 1 ha 24 147 000 17 477 000 1 and
ISSN region.
 Crop Combination in Sangli District (Maharashtra): A Geographical Analysis Dr. D. G. Gatade: Head And Associate Professor,Dept Of Geography,-A.S.C.College Ramanandnager,Sangli. Shri.. S. Pol: Dept Of Geography,P.V.P.College
The upper Pravara basin in the Akole tahsil of the Ahmednagar district, Maharashtra
 Methodology: Study Area: The upper Pravara basin in the Akole tahsil of the Ahmednagar district, Maharashtra (India) (figure 1) is selected for proposed study of dairy activity. The offshoots i.e. Kulangarh-Navaricha
Content. Monsoon Report and Sowing Update. Highlights. Southwest Monsoon: A flashback of Southwest Monsoon A slow beginning
 Content Highlights Southwest Monsoon: A flashback of 2011 Southwest Monsoon 2012- A slow beginning Hike in MSP of Kharif crops Sowing Progress of Kharif crops - Cereals - Pulses - Oilseeds - Cotton - Sugarcane
AGRICULTURAL PRODUCTIVITY
 Chapter Four AGRICULTURAL PRODUCTIVITY 4.1 Introduction 4.2 Inputs Used 4.3 Methodology 4.4 Bhatia s Method 4.5 Crop Productivity And Changes 4.5.1 Jowar 4.5.2 Whet 4.5.3 Rice 4.5.4 Sugarcane 4.5.5 Groundnut
UJJANI IRRIGATION PROJECT AND AGRICULTURAL LANDSCAPE
 57 CHAPTER III UJJANI IRRIGATION PROJECT AND AGRICULTURAL LANDSCAPE 3.1 Introduction With the introduction of irrigation facilities farmer is able to grow cash crops for gaining more benefits which bring
Agriculture. List of Tables
 Agriculture List of Tables 7.1: Area Production and yield of Agricultural Crops in Sikkim (Part-A) 7.2: Area Production and yield of Agricultural Crops (Part-B) 7.3: Area Production and yield of Agricultural
Progress and Potential of Horticulture in India
 Ind. Jn. of Agri.Econ. Vol.63, No.3, July-Sept. 2008 SUBJECT I TRIGGERING AGRICULTURAL DEVELOPMENT THROUGH HORTICULTURE CROPS Progress and Potential of Horticulture in India Ramesh Chand, S.S. Raju and
CHAPTER 3 PROFILE OF DAVANGERE DISTRICT
 CHAPTER 3 PROFILE OF DAVANGERE DISTRICT This chapter presents a brief profile of Davangere district, the area selected for the present study. The objective of this chapter is to provide the greater insights
DISTRICT PROFILE OF UTTARA KANANDA
 DISTRICT PROFILE OF UTTARA KANANDA 1. Name of the District : UTTARA KANNADA 2. Geographical Position* North Latitude Between 13 o 52 52 and 15 o 30 o East Longitude Between 74 05 and 75 o 05 3. Total Geographical
Importance, area, production and productivity of major cereals, pulses, oilseeds, sugar crops, medicinal and aromatics and forage crops
 LECTURE 1 Importance, area, production and productivity of major cereals, pulses, oilseeds, sugar crops, medicinal and aromatics and forage crops Importance of cereals Grains are generally classified as
6. LAND RESOURCES : AGRICULTURE
 6. LAND RESOURCES : AGRICULTURE 38 MT EDUCARE LTD. Q.1 (A) Choose the correct alternative from the brackets and rewrite the statements : 1. India ranks... in the world regarding area under cultivation.
JOURNAL OF INTERNATIONAL ACADEMIC RESEARCH FOR MULTIDISCIPLINARY Impact Factor 4.483, ISSN: , Volume 5, Issue 12, January 2018
 AGRICULTURAL LAND USE AND MORPHOMETRIC ANALYSIS OF NANGAVALLI SUB-WATERSHED, NANGAVALLI AND TOPPAIODAI(NTSW), MATTURTALUK, SALEM DISTRICT M.BALAMURUGAN* DR.A.ILANTHIRAYAN** * Research Scholar, External
Gender Preferences for Cultivation of Horticultural Crops
 Gender Preferences for Cultivation of Horticultural Crops P C Tripathi, Principal scientist &Head, Central Horticultural Experiment Station (IIHR), Chettalli-571 248, Kodagu, Karnataka,India Naresh Babu,
Agricultural Land Use And Cropping Pattern Of Uttar Dinajpur District
 IOSR Journal Of Humanities And Social Science (IOSR-JHSS) Volume 23, Issue 8, Ver. 2 (August. 2018) PP 55-60 e-issn: 2279-0837, p-issn: 2279-0845. www.iosrjournals.org Agricultural Land Use And Cropping
CONCEPT OF SUSTAINABLE AGRICULTURE
 CONCEPT OF SUSTAINABLE AGRICULTURE Agriculture is the process of producing food, feed, fibre and other desired products by cultivation of certain plants and raising of domesticated animals. Agriculture
CHAPTER 4 : AGRICULTURE
 I. ECONOMIC ACTIVITIES:- ITL Public School Social Science Hand Out (2017-18) Class VIII Subject: Geography Instructions For each questions value points are given from the content. Frame the sentences of
Sinnar Taluka Overview and preparation for field trip. Pooja Prasad (Ph D scholar) 22/8/2017
 22/8/2017") Sinnar Taluka Overview and preparation for field trip Pooja Prasad (Ph D scholar) 22/8/2017 1 Topics Overview of Sinnar taluka Geo-morphology, cropping patterns Diversion based irrigation (DBI) system
Sinnar Taluka Overview and preparation for field trip Pooja Prasad (Ph D scholar) 22/8/2017 1 Topics Overview of Sinnar taluka Geo-morphology, cropping patterns Diversion based irrigation (DBI) system
REMOTE SENSING AND GIS FOR INTEGRATED LAND MANAGEMENT: CASE OF INDIA
 REMOTE SENSING AND GIS FOR INTEGRATED LAND MANAGEMENT: CASE OF INDIA R.B.Singh and Dilip Kumar Department of Geography Delhi School of Economics University of Delhi Delhi-110007, India E-mail:rbsgeo@hotmail.com
Agriculture landuse A case study of district Kathua.
 Journal of Biosphere, 2(1): 38-43, 2013 ISSN 2278 3342 Agriculture landuse A case study of district Kathua. Amrik Singh and Rajdeep Kour Abstract: Agriculture is one of the crucial sectors of Indian economy.
Section - Agriculture Census : Schedules and Instruction for Non-Land Records States
 37 Section - C 38 Agriculture Census 2015-16 Annexure-I Schedule L-1: List of all households and Operational Holdings in the sample village 1. State : 6. R.I. Circle : 2. District : 7. Patwari Circle :
PLP SAGAR EXECUTIVE SUMMARY
 EXECUTIVE SUMMARY I.General: a. Theme of the PLP 2016-17 is Accelerating the pace of Capital Formation in agriculture and allied sector. b. Sagar district is situated in the Vindhya Plateau Region-5 in
Major Crop Combination Regions in Jammu Province: A Spatio-Temporal Analysis
 Major Crop Combination Regions in Jammu Province: A Spatio-Temporal Analysis Nisha Lecturer, Department of Geography, G.G.M. Science College, University of Jammu, Jammu, India ABSTRACT: Agriculture occupies
Rampur: Village Economy
 Chapter 9 Rampur: Village Economy Key Points: 1. Rampur lies in the fertile alluvial plains of the Gengetic basin in the Western part of U.P. Farming is the main production activity in Rampur. Majority
Report on Farmers Training in Peddapur Village, Peri Urban Hyderabad, India
 December, 2015 Report on Farmers Training in Peddapur Village, Peri Urban Hyderabad, India As Part of Capacity Building and Knowledge Sharing Activities under CoCOON - CCMCC Project Climate Policy, Conflicts
Structural Growth and Development of Livestock Sector in North-Eastern Karnataka An Economic Analysis
 Agricultural Economics Research Review Vol. 27 (No.2) July-December 2014 pp 319-325 DOI: 10.5958/0974-0279.2014.00036.6 Research Note Structural Growth and Development of Livestock Sector in North-Eastern
1 What are three cropping seasons of India? Explain any one in brief. 2 Discuss three main impacts of globalization on Indian agriculture.
 1 What are three cropping seasons of India? Explain any one in brief. 2 Discuss three main impacts of globalization on Indian agriculture. 3.Distinguish between rabi and kharif season? 4. What is Horticulture?
S.K. Jadhav and K.V. Deshmukh
 Economic Affairs: 59(1): 57-62 March, 2014 DOI Number 10.5958/J.0976-4666.59.1.006 Agriculturaldevelopment in Maharashtra State by Estimating Growth Rates of Area, Production and Productivity of Major
ISPRS Archives XXXVIII-8/W3 Workshop Proceedings: Impact of Climate Change on Agriculture
 IMPACT ASSESSMENT OF IRRIGATION DEVELOPMENT IN VEDGANGA BASIN A GEOINFORMATIC APPROACH Sachin Panhalkar a and Rucha Joshi b a Lecturer, Department of Geography, Shivaji University Kolhapur, Maharashtra,
An economic analysis on land use and cropping pattern in Dharwad district
 Visit Us - www.researchjournal.co.in DOI : 10.15740/HAS/IRJAES/6.1/176-181 International Research Journal of Agricultural Economics and Statistics Volume 6 Issue 1 March, 2015 176-181 e ISSN-2231-6434
Decadal Shift in Cropping Pattern in Karnataka Research Report July 2016
 Karnataka Agriculture Price Commission Decadal Shift in Cropping Pattern in Karnataka Research Report July 2016 This is a comprehensive analysis of the shift in the area of agriculture & horticulture crops
Government of India Ministry of Agriculture Department of Agriculture and Cooperation Directorate of Economics and Statistics
 Agricultural Statistics at a Glance 2014 Government of India Ministry of Agriculture Department of Agriculture and Cooperation Directorate of Economics and Statistics QX F O RD UNIVERSITY PRESS Contents
FARMER'S PERCEPTION TOWARDS AGRICULTURE TECHNOLOGY IN TRIBAL REGION OF RAJASTHAN
 Raj. J. Extn. Edu. 20 : 92-96, 2012 FARMER'S PERCEPTION TOWARDS AGRICULTURE TECHNOLOGY IN TRIBAL REGION OF RAJASTHAN G.L.Meena* and N.K.Punjabi** ABSTRACT The study was conducted in tribal region of Udaipur
STATISTICAL PROFILE OF COLCHESTER COUNTY. Prepared By: Nova Scotia Federation of Agriculture
 STATISTICAL PROFILE OF COLCHESTER COUNTY Prepared By: Nova Scotia Federation of Agriculture 1.0 Introduction Agriculture in the Local Economy Agriculture in County is characterized by a diversity of farm
Supplementary Report
 Supplementary Report To be included in District Model Land Use Plans By Bimal Kumar Sponsored By State Land Use Board, Uttar Pradesh Department of Planning, Government of U. P. Yojana Bhawan, Lucknow 226
Features of Non-farm employment in Karnataka: Evidence from three villages
 Features of Non-farm employment in Karnataka: Evidence from three villages T. Sivamurugan Paper prepared for the Seminar on Rural Labour Relations, NIRD, Hyderabad, March 10-12, 2016 Why study non-farm
Vital Statistics (Part III)
") Vital Statistics (Part III) Agriculture - Compiled (manzoor@ndf.vsnl.net.in) Institute of Objective Studies 162, Jogabai Main Road, Jamia Nagar, New Delhi - 110025 Index (Part III) - Agriculture 1. Gross
Vital Statistics (Part III) Agriculture - Compiled (manzoor@ndf.vsnl.net.in) Institute of Objective Studies 162, Jogabai Main Road, Jamia Nagar, New Delhi - 110025 Index (Part III) - Agriculture 1. Gross
GEOGRAPHY. H.C.G. Paper 2 (Two hours)
") GEOGRAPHY H.C.G. Paper 2 (Two hours) Answers to this Paper must be written on the paper provided separately. You will not be allowed to write during the first 15 minutes. This time is to be spent in reading
GEOGRAPHY H.C.G. Paper 2 (Two hours) Answers to this Paper must be written on the paper provided separately. You will not be allowed to write during the first 15 minutes. This time is to be spent in reading
TRAINING NEEDS OF DAIRY FARMERS
 TRAINING NEEDS OF DAIRY FARMERS G. K. Waman, Assistant Professor (Agril.Extn.), Directorate of Extension Education, MPKV, Rahuri (M.S.) D. N. Pharate, Assistant Professor (Agril.Extn.), Dept. of Extension
An Analysis of Banana Cultivation in Theni District, Tamil Nadu
 An Analysis of Banana Cultivation in Theni District, Tamil Nadu C. Mahalakshmi 1, S. Vinoth Kumar 2, P. Maneesh 3, J. Syed Ali Fathima 4 1,2, M.Phil. Scholar, Department of Economics, The American College,
CHAPTER I INTRODUCTION
 1 CHAPTER I INTRODUCTION India has witnessed significant technological change in the agricultural sector over the years due to the thrust given to research and extension. Agriculture once considered being
CONTEMPORARY RESEARCH IN INDIA (ISSN ): VOL. 7: ISSUE: 1 (2017) Received: 23/02/2017 Edited: 28/02/2017 Accepted: 04/03/2017
: VOL. 7: ISSUE: 1 (2017) Received: 23/02/2017 Edited: 28/02/2017 Accepted: 04/03/2017") ECONOMICS OF PRODUCTION AND MARKETING OF MAIZE IN WESTERN MAHARASHTRA ShindeV. A. 1, S. V.Satpute 2 and A. B. Bhosale 3 1 and 3 Associate Professors of Agricultural Economics, 2 Junior Research Assistant,
ECONOMICS OF PRODUCTION AND MARKETING OF MAIZE IN WESTERN MAHARASHTRA ShindeV. A. 1, S. V.Satpute 2 and A. B. Bhosale 3 1 and 3 Associate Professors of Agricultural Economics, 2 Junior Research Assistant,
Kharif Sorghum in Karnataka: An Economic Analysis
 Agricultural Economics Research Review Vol. 18 July-December 2005 pp 223-240 Kharif Sorghum in Karnataka: An Economic Analysis H. Basavaraja 1, A.Y. Hugar 2, S.B. Mahajanshetti 3, V.V. Angadi 4 and B.
Agricultural Productivity and Productivity Regions in West Bengal
 ISSN. 0972-8406 The NEHU Journal, Vol XIII, No. 2, July-December 2015, pp-49-61 49 Agricultural Productivity and Productivity Regions in West Bengal Introduction NASIM AKTAR* Abstract The green revolution
Minimum Core Data Set
 Global Strategy IMPROVING AGRICULTURAL AND RURAL STATISTICS IN ASIA PACIFIC Minimum Core Data Set Regional Office for the Asia-Pacific Regional Action Plan to Improve Agricultural and Rural Statistics
CHAPTER - IV GROWTH OF AREA, PRODUCTION AND YIELD OF FRUITS AND VEGETABLES IN PUNJAB STATE AND IN PATIALA DISTRICT
 CHAPTER - IV GROWTH OF AREA, PRODUCTION AND YIELD OF FRUITS AND VEGETABLES IN PUNJAB STATE AND IN PATIALA DISTRICT The horticultural crops e.g. fruits and vegetables play an important role in human nutrition
SRJIS/BIMONTHLY/DR.HAIDER-E-KARRAR ( ) Agricultural Development in Maharashtra A Temporal Analysis
 Agricultural Development in Maharashtra A Temporal Analysis") Agricultural Development in Maharashtra A Temporal Analysis Dr. Haider-e-Karrar, Principal & HOD, Department of Geography, Burhani College of Commerce & Arts, Mazagaon Mumbai - 10. Abstract Agriculture
Agricultural Development in Maharashtra A Temporal Analysis Dr. Haider-e-Karrar, Principal & HOD, Department of Geography, Burhani College of Commerce & Arts, Mazagaon Mumbai - 10. Abstract Agriculture
Shree Swami Samarth Stone Crusher
 PREFEASIBILITY STUDY FOR SHREE SWAMI SAMARTH STONE CRUSHER. Sadekar Enviro Engineers Pvt. Ltd Page 1 Executive summary Shree Swami Samarth Stone Crusher. has been granted a quarrying over an area 1.00
Global Strategy. Session 1.2: Minimum Set of Core Data Items. Module 1: Sampling in the Context of the Global Minimum Set of Core Data Items
 Global Strategy IMPROVING AGRICULTURAL AND RURAL STATISTICS IN ASIA PACIFIC Module 1: Sampling in the Context of the Global Minimum Set of Core Data Items Session 1.2: Minimum Set of Core Data Items 13
Agricultural Price Policy and Farm Profitability of Onion in Satara District of Maharashtra
 EUROPEAN ACADEMIC RESEARCH Vol. II, Issue 2/ May 2014 ISSN 2286-4822 www.euacademic.org Impact Factor: 3.1 (UIF) DRJI Value: 5.9 (B+) Agricultural Price Policy and Farm Profitability of Onion in A. J.
STATE AGRICULTURAL PROFILE PUNJAB
 AERC STUDY No. 38 STATE AGRICULTURAL PROFILE PUNJAB Agro-Economic Research Centre Department of Economics and Sociology Punjab Agricultural University Ludhiana December, 2015 PREFACE The present report
India Organic Food Market Forecast & Opportunities, 2017
 Organic Food Market Market Size Organic food market in India is likely to treble in four years organic food market in India at $0.36 billion in 2014 According to India Organic Food Market Forecast & Opportunities,
Underutilized Crop Species for Resilent Agriculture, Food & Nutritional Security. Action for Social Advancement [ASA]
![Underutilized Crop Species for Resilent Agriculture, Food & Nutritional Security. Action for Social Advancement [ASA]](/thumbs/87/96337103.jpg "Underutilized Crop Species for Resilent Agriculture, Food & Nutritional Security. Action for Social Advancement [ASA]") Underutilized Crop Species for Resilent Agriculture, Food & Nutritional Security Action for Social Advancement [ASA] Project Location The agro biodiversity conservation project is proposed to be implemented
Underutilized Crop Species for Resilent Agriculture, Food & Nutritional Security Action for Social Advancement [ASA] Project Location The agro biodiversity conservation project is proposed to be implemented
Identify Areas to Improve Agricultural Water Productivity in Upper Bhima Catchment of South India
 Identify Areas to Improve Agricultural Water Productivity in Upper Bhima Catchment of South India Kaushal K. Garg, A. Gaur International Water Management Institute; C/O ICRISAT, Patancheru, Andhra Pradesh,
Pearl millet ( Pennisetum typhoids) belongs to the
 belongs to the") researcharticle International Journal of Commerce and Business Management (April, 2010) Vol. 3 Issue 1 : 95-99 Costs, returns and profitability of pearl millet production Accepted : March, 2010 ABSTRACT
researcharticle International Journal of Commerce and Business Management (April, 2010) Vol. 3 Issue 1 : 95-99 Costs, returns and profitability of pearl millet production Accepted : March, 2010 ABSTRACT
January Social Map and Resource Map
 January 2017 How To Social Map and Resource Map Livelihoods interventions evolve based on current reality assessment of households, community, village and surrounding area. The process of Livelihoods Enhancement
LANGUAGE IN INDIA Strength for Today and Bright Hope for Tomorrow Volume 12 : 1 January 2012 ISSN
 LANGUAGE IN INDIA Strength for Today and Bright Hope for Tomorrow Volume ISSN 1930-2940 Managing Editor: M. S. Thirumalai, Ph.D. Editors: B. Mallikarjun, Ph.D. Sam Mohanlal, Ph.D. B. A. Sharada, Ph.D.
A STUDY OF GOVERNMENT SUBSIDIES, ANALYSIS OF AWARENESS & UTILIZATION OF SUBSIDIES BY THE FARMERS IN WESTERN MAHARASHTRA
 A STUDY OF GOVERNMENT SUBSIDIES, ANALYSIS OF AWARENESS & UTILIZATION OF SUBSIDIES BY THE FARMERS IN WESTERN MAHARASHTRA Prof. Jyoti Vipul Howale 1, Prof. Avinash Ghadage 2, Dr. Mrs. Meetali Prashant More