2015 United States National Postconsumer Plastic Bottle Recycling Report
|
|
|
- Tyrone Wilkerson
- 6 years ago
- Views:
Transcription


1 2015 United States National Postconsumer Plastic Bottle Recycling Report
2 INTRODUCTION The 2015 edition of the United States National Postconsumer Plastics Bottle Recycling Report is the 26 th annual report on plastic bottle recycling. This study is a cooperative effort between the Plastics Division of the American Chemistry Council (ACC) and the Association of Plastic Recyclers (APR), the goal of which is to quantify the amount of high density polyethylene (HDPE) and polypropylene (PP) bottles collected for recycling, as well as the rate of recycling of those bottles. This study includes postconsumer recycling values and comments for polyethylene terephthalate (PET) developed by the National Association for PET Container Resources (NAPCOR) and the Association of Plastic Recyclers (APR). The reclaimer survey portion of the study, other than for PET, was conducted by Moore Recycling Associates, Inc. PLEASE NOTE: After publishing the 2014 United States National Postconsumer Plastics Bottle Recycling Report we found and corrected an error in the methodology used for polypropylene bottles. Some pounds of polypropylene were mis-reported as bottles when the pounds were for non-bottle rigid packaging. Totals cited last year were in fact recycled, just not necessarily all as bottles. We have also corrected for pounds of HDPE missed in The statements in this report reflect comparisons with the corrected 2014 values. Corrected values for 2014 are given Table 1. HIGHLIGHTS / SUMMARY FOR 2015 Plastic Bottle Pounds Collected for Recycling in the United States The total pounds of plastic bottles collected for recycling reached 2,977 million pounds in an economically difficult year. The total plastic bottle recycling collection rate was 31.1%, a decrease of 0.6 percentage points compared to The total pounds of plastic bottles collected decreased by 14 million pounds for 2015 compared to 2014, with decreases for PET and HDPE and a slight increase for PP bottle resins. The annualized change in pounds of plastic bottles collected for recycling was -0.5% The five year compounded annual growth rate for plastic bottle recycling was 2.9%. PET bottles collected decreased by 15 million pounds for a total of 1,797 million pounds in The recycling collection rate dipped from 31.0% in 2014 to 30.1% in The numerator dropped while the denominator rose. Compared to 2014, HDPE bottles collected fell by 4.8 million pounds to 1,143.8 million pounds. The HDPE bottle recycling collection rate dropped to 34.4% in 2015 compared to the 2014 rate of 34.8%. The numerator dropped while the denominator rose slightly. PP bottle recycling collection totaled 31.8 million pounds, an increase of 19.5% over the corrected 2014 total of 26.6 million pounds. The collection rate rose to 17.9% in 2015 compared to 15.0% in 2014, with the numerator rising while the denominator held steady in 2015 compared to Exports of USA-collected HDPE bottle material dropped from 219 million pounds in 2014 to 184 million pounds in The 184 million pounds represented 16.1% of the domestically collected material with approximately 66% of the exports leaving North America. 2
3 Compared to 2014, imports of postconsumer HDPE to the United States rose by 25% to 65.9 million pounds in 2015, which combined with near steady domestic collection and decreased exports resulted in increased purchases for United States reclamation plants, up 43.7 million pounds since last year to million pounds. Plastic Bottle Recycling Overview for 2015 The postconsumer plastic bottle recycling industry experienced a difficult year in 2015 with lower bale prices and lower competing virgin polymer prices for reclaimers. Margins were tight both for bale sellers and for plastic bottle reclaimers. Recycled natural and pigmented HDPE bottle bale prices fell in 2015 compared to 2014 with momentary uptick in the second quarter followed by continued falling prices. PET bottle bale prices fell throughout 2015 compared to The average price for baled postconsumer plastic bottles fell by 31% for baled bottle plastic (a composite of separate HDPE and PET bales, not a mixed bale) in 2015 compared to 2014 even as crude oil fell by 47% with resulting lower virgin plastics prices. The numerator of pounds of all bottles collected fell 14 million pounds or 0.5%, well below the three year running average bottle collection growth rate of 2.3% per year. Considering the denominator, lightweighting and right-sizing of PET and HDPE bottles continued as has been the case for several years. More of the light-weighted containers were lost into the postconsumer paper stream at the sorting plants. Many consumer products are being sold in smaller bottles as household demographics change. The sales of PET for bottles increased over 2014 while sales of HDPE for bottles continued to hold nearly steady. The total for all bottles in the marketplace increased by 148 million pounds, or 1.6% which matches the three year running average bottle marketplace growth rate of 1.6% was a positive year for total bottle usage, but static on a per capita basis. Sales of virgin HDPE resin for bottles rose by 0.17% and sales of recycled HDPE resin for bottles rose by 6.5% compared to 2014 results. Sales of virgin PET resin for bottles rose by 2.2% and sales of recycled PET resin for bottles gained slightly as fiber uses, film uses, and strapping uses fell in the same time frame. Exports of all postconsumer plastic bottle bales continued the long term trend downward with a decrease of 21.5 million pounds compared to 2014 and a fall to the lowest percentage of total exports in nine years. In % of overall collected postconsumer bottles were exported from the United States. HDPE exports fell substantially in 2015 compared to 2014, to 16.1% of collected material. PET exports rose in both absolute tonnage and percentage of material collected, 23.6%, compared to 2014, but were still less than years prior to The export of recycled PP bottles rose in 2015 to 27.9% of that collected. The PP bottle exports were in mixed rigids bales, not discrete bales of PP bottles. The processing of recycled PET, sourced domestically and imported, fell in 2015 over 2014 by 120 million pounds. The processing of recycled HDPE, sourced domestically and imported, rose by 44 million pounds in 2015 compared to The processing of recycled PP bottles, sourced domestically and imported, decreased by 3.8 million pounds in 2015 over

4 Bottle resin use per capita gained back the 0.6% lost in 2014 and was a return to the slow growth seen since the 2008/2009 recession. The growth seen before the recession has been replaced by less plastic use and continual lightweighting. Bale prices for recycled bottles moved down throughout 2015 for PET. HDPE natural prices were weak in the first quarter, rose and fell and repeated the weakness in the fourth quarter. HDPE copolymer bale prices followed a similar pattern. Single stream collection of household recyclables continued growth, generally resulting in higher overall household participation rates and more challenges from contaminated bales of bottles with bale yields as dismal as in recent years. Materials recovery facility, MRF, operations were hurt by falling product prices and no commensurate drop in costs. Tension in the reclamation industry continued with increased share of material from single stream collection and more challenging processing requirements. As a continuing example, sleeve labels on PET bottles added to poor bale yields. Conversely, PET thermoforms continued to represent a growing opportunity for additional raw material for recycling processing. California Container Redemption Value redemption centers collected not only PET, but also HDPE, PP, PVC, LDPE bottles and OTHER bottles. Plastic bottle recycling continues to be an international business with U.S.-based reclaimers competing effectively in 2015 as they did in Active all bottle collection, which takes all bottles regardless of resin identification number, continued the collection of LDPE and PVC bottles, although the tonnage continues to be small. We see a small amount of #7, OTHER, bottles collected, but we do not have data for the denominators of those bottles. The LDPE and PVC bottles were often exported as part of mixed bales. The plastic bottle resins, as identified by their SPI/ ASTM resin identification codes (RIC), are: Source: Moore Recycling, Inc PET and HDPE bottles continue to comprise 97.0% of the United States plastic bottle market with PP at 1.8% of plastic bottles produced and with LDPE at 0.8% of plastic bottles and PVC at 0.3% of plastic bottles. Together, PET and HDPE are 98.8% of the bottles recycled with PP bottles constituting 1.1% of plastic bottles recycled. Some PP bottles are included with pigmented HDPE bottles for recycling, about 31% of all PP collected. An allowance, based on buyer reports and bale audits, has been included to account for those PP bottles in this report to more properly represent the PP bottles recycled, although not available as discrete PP bottles for recycling. 4
5 Although bottles made with the #3 through #7 resins are recyclable, and to varying degrees are recycled, the actual level of recycling is limited by the continuing challenge to reach a critical mass of readily recognizable bottles for economical collection and processing. However, it should be noted that bottles made from resins #3 through #7 make up just 3.0% of the plastic bottle market. Finally, bottles coded with #7, OTHER are included in this report as a discrete category, but are not included in the total for TOTAL BOTTLES shown on Table 1. Bottles coded #7 may include, among others, HDPE or PET or PP resins with barrier layer materials. These bottles are often recycled with the primary resins used in each container. Bottles coded #7 may also be made from resins other than those listed above, such as polycarbonate. No information is available for the denominator for #7, OTHER. Postconsumer Plastic Bottle Recycling Collection Results Table 1 Postconsumer Plastics Bottles Recycled in Calendar Year 2015 Compared to Calendar Year 2014 Results [1,2,3,4,5,6,7] (in millions of pounds per year) Calendar Year 2014 Calendar Year 2015 Plastic Bottle Type Plastic Resin Recycling Plastic Resin Recycling Recycled [2] Sales [3,4] Rate Recycled [2] Sales [3,4] Rate PET [4] % % HDPE Natural % % HDPE Pigmented % % Total HDPE Bottles % % PVC [5] % % LDPE [5] % % PP [6] % % Other [7] TOTAL BOTTLES % % [1] These data provide a snapshot of plastic bottle recycling collection trends from the national perspective. The data are useful in identifying national trends and highlighting changes that have occurred from year to year, and may be a useful tool for planning purposes. While national data may be useful as a comparison with local waste characterization and recycling data, significant differences will likely exist from locality to locality, and from state to state. If communities or states are making decisions where precise knowledge of the amount, composition and disposition of MSW is crucial, e.g., where a solid waste management facility is being designed, or for local or state regulatory enforcement, etc., then local characterization of the quantities of individual components generated, recycled and disposed is essential. [2] Data are based on surveys performed by Moore Recycling Associates, Inc. and include bale composition data provided by Moore Recycling Associates, Inc. and others. An error in methodology for 2014 recycled values for polypropylene is corrected here. [3] Based on data provided by the American Chemistry Council s Plastics Industry Producers Statistics Group. HDPE resin sales include both the virgin and recycled plastic pounds used to produce new bottles. Imports from non-acc members are not included. [4] Source: 2015 Report of Postconsumer PET Container Recycling Activity, National Association of PET Container Resources, Sonoma, California [5] The majority of PVC and LDPE recycled were as part of commingled bottle and container bales [6] About 2% of polypropylene bottles were deliberately recycled as polypropylene bottles. [7] Limited data for bottles of other resins are shown. Such material was sold as part of mixed export bale. No denominator values are available. Because of the lack of denominator, the bottles in the Other category are not included in the TOTAL BOTTLE sum.. 5
6 The 2015 PET bottle denominator increased by 122 million pounds to 5,971 million pounds compared to the 2014 value. The 2015 PET bottle numerator, not including thermoforms, decreased by 15 million pounds to 1,797 million pounds collected. Many natural homopolymer HDPE milk bottles are pigmented, the usual visual indicator of the use of copolymer, and those bottles are included in the usually pigmented copolymer bottles. The split for recycled HDPE between natural HDPE (presumed to all be homopolymer) and pigmented HDPE (usually presumed to be copolymer) was based on buyer estimates. The Total HDPE Bottles values on Table 1 are likely more accurate numbers. In comparison with 2014, the 2015 HDPE denominator (i.e. bottles in the market place) rose by 11 million pounds, or 0.3%. In a tough economic environment, even slight gains are appreciated as more pounds of plastic used mean more opportunity to gain economies of scale. The HDPE numerator ( i.e. bottles collected for recycling) decreased by 4.8 million pounds, or -0.4%. The collection rate for HDPE bottle recycling fell in 2015 to 34.4% versus 2014 at 34.8% with fewer pounds recycled and the denominator rising slightly. Both natural HDPE and pigmented HDPE recycling rates, as defined, fell in 2015 versus Overall, HDPE bottle recycling saw a slight decrease in pounds collected for recycling. About 6.6% of the total #2 through #7 bottles collected was part of commingled bottles bales. For HDPE bottles the contribution from commingled bottles bales and mixed rigids bales was about 2.8% of the total HDPE bottles collected in For PP bottles the contribution from commingled bottles bales and mixed rigids bales was about 67% of the total bottles collected. For PVC bottles the contribution from commingled bottles bales and mixed rigids bales was about 98% of the total bottles collected. For LDPE bottles the contribution from commingled bottles bales and mixed rigids bales was about 100% of the total bottles collected. Domestic processing of postconsumer PP bottles totaled 23.7 million pounds, a 14% decrease from PP recycling collection saw a 5.2 million pound increase in collected material and a steady usage of PP for initial bottles, resulting in an increase in the collection rate for recycling to 17.9% from a revised 2014 collection rate of 15.0%. Exports of PP bottles as part of mixed bales increased in In addition to bottles, PP from injection molded closures was also recycled, but that amount is not part of this report on bottles. For information on PP from injection molded closures, please refer to Moore Recycling s Non-Bottle Rigid Plastic Recycling Annual Reports. 6

7 The total pounds of postconsumer bottles collected for recycling in 2015 was 2,977 million pounds for #1 through #6 plastic bottles. The change from 2014 was a decrease of 14 million pounds of recycled bottles, or a decrease of 0.5%. This happened with modest increase in plastic bottle resin usage and the moderate real GDP growth of 2.4% for Bottle Resin Sales The denominator used to calculate the recycling rate is composed of both virgin resin and recycled resin used for bottle making. Plastic bottle light-weighting continued to occur for all bottle resins. Light-weighting helps companies to meet economic and sustainability goals and is a relentless force in bottle making. Many HDPE bottle applications are using product concentrates, which means an increasing number of smaller bottles, or fewer bottles made for the total number of uses, such as laundry loads. Recycling is denominated by weight and reduced weight per container adversely affects recycling economics. Reclaimers have noticed a decrease in available bales of natural HDPE milk bottles, perhaps showing a shift in packaging types. 7

8 The change in total resins used to make bottles resulted in an increase of 148 million pounds, or an increase in bottle polymer production of 1.6%. Use of HDPE to make bottles increased by 11 million pounds, or 0.3%, up from the amount used in 2014, and almost back to the levels used in 2009 and previous years. Use of PET to make bottles increased by 122 million pounds, or 2.1%, to an all-time high. The 2015 use of 9,583 million pounds of #1-#6 resins for bottles is an all-time high. It is vital for the growth of plastic bottle recycling that bottles are present in the marketplace and consumers appropriately recycle used bottles. The pounds of material in bottles used by consumers shown in Figure 2 include recycled content. Without available pounds of recycled material to be industrial feedstock, plastics recycling may grow in recycling rate, but not in the tons needed for a robust industry. Inability to secure wanted feedstocks has increased reclaimer interest in additional resins and non-bottle items such as PET thermoforms. Figure 3 shows the United States per capita consumption for plastic bottles since In 2014 the per capita consumption of bottle resins, virgin and recycled plastic, fell. In 2015 the per capita consumption recovered to the 2013 level, but continued well below the pre 2008/2009 recession levels. This chart shows that use of plastic bottles for more applications is offset by the continuing lightweighting and use of product concentrates with smaller, lighter bottles. The very slow growth in per capita consumption of 8

9 plastics for bottles signals that growth in supply of bottles must come from more effective collection, not just simple growth in the pool of bottles created. PET and HDPE continued to dominate as selected resins to produce plastic bottles: 97.0% by weight of produced bottles were made of PET or HDPE. PET and HDPE bottles also continued to dominate the bottles collected for recycling, collectively at 98.8% and PP at 1.1% of the total bottles recycled. 9

10 Barriers to Increased Plastic Bottle Recycling As noted for 2005 through 2014, one barrier to plastic bottle recycling is that too many consumers continue to be unaware of the significant usefulness, demand, and value of recycled plastic including HDPE and PET and PP. Data and experience show that plastic bottle recycling can be increased through sustained local education campaigns. Municipalities also need to understand that they can benefit from the sale of bales of bottles, including revenue sharing to fund educational programs and other costs of collection. Another barrier to increased recycling is lack of sufficient convenient access to recycling collection opportunities for products used away from home. Consumers respond to additional opportunities to be able to recycle such as at public venues, offices, recreational sites, schools, and retail establishments. In a time of low commodity prices, which include plastic recyclables, MRF s that would process the entire municipal waste stream for recyclables, not just a collected stream of recyclable packaging, are being considered. This business model is still being refined. 10
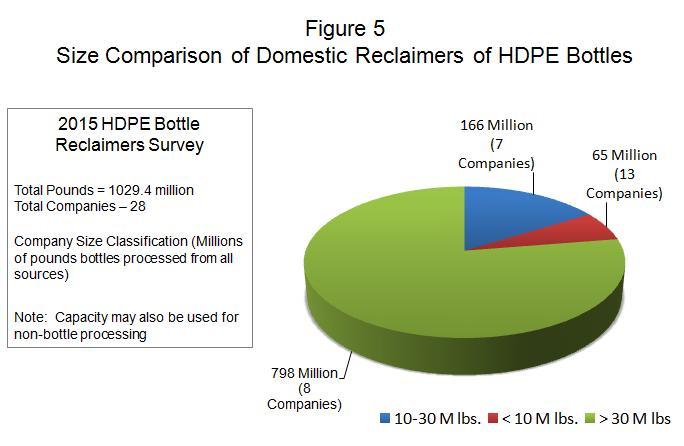
11 The impact of fluctuating crude oil and natural gas byproduct prices made for a very tough competitive market for postconsumer plastics in The lower cost of petroleum and petrochemicals impacted the price of virgin plastics and that challenged the competitiveness of postconsumer plastic. With the influence of four major factors: the increase in single stream collection of recyclables at household residences, the increased interest to collect more than bottles, the overall reduced quantity of export material, and the extreme economic pressure on the bale suppliers, the quality of available postconsumer bottle material to U.S. reclaimers slumped slightly for HDPE. For PET with an increasing variety of packaging applications, the quality of bales as reflected by bale yields, continued to be a challenge. Use of the APR Design Guide for Plastics Recyclability by packaging designers can help reduce economic and technical barriers to plastic bottle recycling. HDPE Reclamation Industry Update Reclaimers Reporting The number of HDPE reclaimers reporting increased in 2015 as compared to 2014 with 28 companies active at year s end. The number of smaller companies may vary year-to-year as industrial scrap companies change their business plans and start-ups, shut-downs, and acquisitions continue. The amount of HDPE reported processed by the survey of USA HDPE reclaimers rose by 78 million pounds to million pounds. While HDPE recycled bottle domestic collection decreased slightly compared to 2014, exports decreased and imports increased to account for the greater amount of HDPE bottles processed. This value, million pounds processed, is slightly different than the million pounds of postconsumer HDPE bottles purchased. The processed value reflects inclusion of other pedigree HDPE such as post commercial material in pounds processed and individual company experiences with mixed bales. Eight larger companies, defined as those processing over 30 million pounds annually, processed 78% of the HDPE processed with a net annual increase in the pounds processed. The mid-sized companies decreased by one in number from eight in 2014 to seven in 2015 and the amount processed in 2015 increased compared to the amount processed in Small companies, processing less than 10 million pounds annually, increased in number and increased in the amount processed compared to Two reclaimers shutdown. Two reclaimers initiated reporting. Several shifted focus related to feedstocks and reallocated resources. 11
12 12

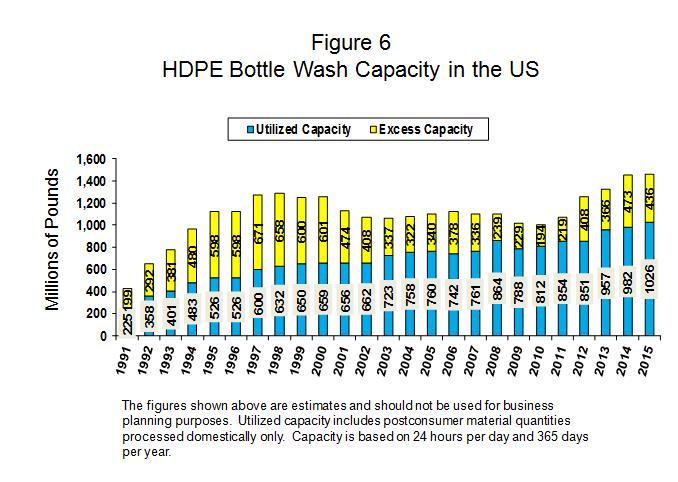
13 The capacity utilization is shown for the given conditions of hours worked. The capacity utilization, as calculated, rose to 70% for 2015 as compared to 68% in Production capacity increased and more production occurred with a net increase in utilization. The HDPE reclaimers continue to use assets to process non-bottle postconsumer HDPE and PP from varying sources. The total utilized capacity rose in 2015 to 1,026 million pounds, compared to 982 million pounds in The overall USA industry capacity, as calculated, increased to 1,461 million pounds of HDPE postconsumer reclamation capacity. As reported, USA PET reclamation capacity utilization was about 58%, a reflection of less recycled material being used in competitive markets and an increase in available capacity to process recycled PET. Export and Import Markets Postconsumer bottles are a valuable commodity and are traded globally. Purchases of USA postconsumer bottles for export continued in Postconsumer plastic was exported out of the United States as bales of PET, PP, and HDPE bottles; bales of commingled bottles and containers; mixed rigid container bales; and unwashed flake material. A total of 20.8% of collected plastic bottle material of all types was exported in 2015, million pounds, compared to 21.5% or million pounds in For context, the exports exceeded 28% of bottles collected in 2012 and before. 13
14 For USA-collected HDPE bottle material, 184 million pounds were exported. This amount represented 16.1% of the total HDPE bottle material collected domestically, a decrease of 35 million pounds since Of those exported pounds, 34% went to Canada. The trade in bales is not one-sided. USA HDPE reclaimers imported 66 million pounds in 2015, up from 52 million pounds of postconsumer HDPE bottle bales imported in The imported pounds of postconsumer resin are not included in the totals of pounds collected in the USA and are not part of the totals on Table PET exports totaled 23.6% of the total PET bottles collected with most exports going to China and Hong Kong. This percentage is more than the experience in 2014, when 22.9% of the USA-collected PET was exported. The Chinese Green Fence initiative continued to slow imports into China of postconsumer baled bottles in 2015 as the flow to Hong Kong stayed steady. The exports for PP bottles rose in 2015 from 4.9 in 2014 to 8.9 million pounds, most as part of mixed bales. The PP exports rose from 19% in 2014 to 28% in 2015 for bottle material. 61% of PVC bottles were exported, a total of 0.66 million pounds. 89% of LDPE bottles were exported, a total of 2.9 million pounds, mostly in bales of rigid containers. These quantity values reflect updated bale content analyses. End Use Markets for Recycled Plastics in 2015 Per the annual survey of postconsumer reclaimers: Natural HDPE postconsumer recycled resin s primary markets continued to be for non-food application bottles, such as for detergent, motor oil, household cleaners, etc. and for film. Pigmented HDPE postconsumer recycled resin s markets continued to include pipe, lawn products, and non-food application bottles. Plastic lumber continued to consume a broad range of materials including recycled HDPE, LDPE, mixed rigid containers, and wide-specification virgin resin. PET postconsumer resin retained its traditional markets for fiber, film and sheet, and food bottles. Fiber and sheet & film applications for recycled PET fell in 2015, particularly for fiber. Competitive economics was the driving force for decreased recycled PET fiber usage in Use of PET postconsumer resin for bottles held steady in The use of recycled PET for strapping dropped significantly. Postconsumer polypropylene bottles uses were not reported for Anecdotal reports suggest the uses were the same as reported in 2014: pallets, crates, and buckets. 14

15 There was some relative change in the recycled postconsumer HDPE end use markets in 2015 over 2014, with new bottles still a major use, but pipe applications growing larger. Pipe applications usage rose in 2015 to the highest tonnage levels seen for that application. The tons of postconsumer HDPE used for pipe, lawn/garden, and decking increased. The tons for bottles, film/sheet, pallets, and automotive fell compared to End use markets and usage of material in those markets are as reported by the survey of reclaimers. The reported yield of postconsumer HDPE bottles to clean product ranged from low-70s to 90 %, depending on raw material and end use. The average of reported yield values of bales to clean HDPE pellets in 2015 was 80.0%, compared to 81.8% in 2014 and 81.0% long term. For PET, the bale yields varied from mid- 60s to mid-70s %, depending on source of bottles. The yield situation is different for recycling HDPE and PET bottles. For PET bottles, the labels are not recovered as PET while for HDPE bottles labels may be recovered as HDPE. Contamination in bales of HDPE bottles and PET bottles continued to present an ongoing challenge to reclaimers. 15
16 Economic Impact The estimated value of purchased bales of postconsumer bottles of PET and of HDPE in 2015 was approximately 508 million dollars compared to 744 million dollars in 2014 due almost exclusively to low prices for bales. Additional Information The Association of Plastic Recyclers (APR) is The Voice of Plastics Recycling. As the international trade association representing the plastics recycling industry, membership includes independent recycling companies of all sizes, processing numerous resins, as well as consumer product companies, equipment manufacturers, testing laboratories, organizations, and others committed to the success of plastics recycling. APR advocates the recycling of all plastics. Visit for more information. The American Chemistry Council s (ACC) Plastics Division represents the leading U.S. manufacturers of plastic resins. ACC offers resources to communities that wish to increase postconsumer plastic collection, including some targeted specifically at bottles and rigid plastics, as well as others focusing on plastic films, bags and wraps, and applications such as mattresses that are outside the scope of this Report. Details on the highly successful All Plastic Bottle collection programs can be found at A database for the recycling of clean plastic film and grocery/retail bags is provided at Additional resources on plastic recycling can be found at Moore Recycling Associates Inc., supported by ACC, APR, J store front, and Resource Recycling, manages a database of buyers and sellers of recycled plastic, open to all market participants. The website also provides other useful information, such as historical scrap prices and guidance for handling and bailing guidelines. NAPCOR provides additional information about PET at its website, Legal Notice The 2015 United States National Post Consumer Plastics Bottle Recycling Report has been prepared to provide helpful ideas and information for parties interested in recycling plastics. Facilities developing a recycling process and all entities involved in the chain of collection, processing, distribution, and sale of recycled products have an independent obligation to ascertain that their plans, actions, and practices meet all relevant laws and represent sound business practices for their particular operations. Facilities may vary their approach with respect to particular operations, products, or locations based on specific factual circumstances, the practicality and effectiveness of particular actions and economic and technological feasibilities. This report is not designed or intended to define or create legal rights or obligations. Although the information contained in this document has been produced and processed from sources believed to be reliable, no warranty expressed or implied is made regarding the accuracy, adequacy, completeness, legality, reliability or usefulness of any information, and this information is provided on an "as is" basis. NO WARRANTIES ARE GIVEN; ALL IMPLIED WARRANTIES OF MERCHANTABILITY OR FITNESS FOR A PARTICULAR PURPOSE ARE EXPRESSLY 16
17 EXCLUDED. Neither ACC nor APR assumes any liability of any kind whatsoever resulting from the use of or reliance upon any information, conclusions, or options contained herein. The Association of Plastic Recyclers and the Plastics Division of the American Chemistry Council produced this report. The United States National Postconsumer Plastics Bottle Recycling Report is published by the Association of Plastic Recyclers and the Plastics Division of the American Chemistry Council. 17
2010 UNITED STATES NATIONAL POST- CONSUMER PLASTICS BOTTLE RECYCLING REPORT
 2010 UNITED STATES NATIONAL POST- CONSUMER PLASTICS BOTTLE RECYCLING REPORT INTRODUCTION The 2010 edition of the United States National Post-Consumer Plastics Bottle Recycling Report is the 21 st annual
2017 United States National Postconsumer Plastic Bottle Recycling Report
 2017 United States National Postconsumer Plastic Bottle Recycling Report www.plasticsrecycling.org www.americanchemistry.com INTRODUCTION The 2017 edition of the United States National Postconsumer Plastics
2009 UNITED STATES NATIONAL POST- CONSUMER PLASTICS BOTTLE RECYCLING REPORT
 2009 UNITED STATES NATIONAL POST- CONSUMER PLASTICS BOTTLE RECYCLING REPORT INTRODUCTION The 2009 edition of the United States National Post-Consumer Plastics Bottle Recycling Report is the 20 th annual
2008 UNITED STATES NATIONAL POST- CONSUMER PLASTICS BOTTLE RECYCLING REPORT
 2008 UNITED STATES NATIONAL POST- CONSUMER PLASTICS BOTTLE RECYCLING REPORT INTRODUCTION The 2008 edition of the United States National Post-Consumer Plastics Bottle Recycling Report is the 19 th annual
2005 NATIONAL POST-CONSUMER PLASTICS BOTTLE RECYCLING REPORT
 2005 NATIONAL POST-CONSUMER PLASTICS BOTTLE RECYCLING REPORT INTRODUCTION The 2005 National Post-Consumer Plastics Bottle Recycling Report is the 16th annual plastics recycling study. This study represents
American Plastics Council
 American Plastics Council 2004 NATIONAL POST-CONSUMER PLASTICS RECYCLING REPORT INTRODUCTION The 2004 National Post Consumer Plastics Recycling Report is the 15th annual APC Plastics Recycling Study. This
2007 United States National Post-Consumer Report on Non- Bottle Rigid Plastics Recycling
 2007 United States National Post-Consumer Report on Non- Bottle Rigid Plastics Recycling Introduction The 2007 National Post-Consumer Recycling Report on Non-Bottle Rigid Plastics is the first annual report
2009 National Postconsumer Recycled Plastic Bag & Film Report
 Introduction 2009 National Postconsumer Recycled Plastic Bag & Film Report February 2011 Prepared for the American Chemistry Council The 2009 National Postconsumer Recycled Plastic Bag and Film Report
Postconsumer PET Container Recycling Activity in 2016
 Report on Postconsumer PET Container Recycling Activity in 2016 October 31, 2017 www.napcor.com www.plasticsrecycling.org ACKNOWLEDGEMENTS 2016 marks the twenty second year that the National Association
National Association for PET Container Resources PO Box 1327 Sonoma, California
 National Association for PET Container Resources PO Box 1327 Sonoma, California 95476 707.996.4207 www.napcor.com www.plasticsrecycling.org 2009 REPORT ON POST CONSUMER PET CONTAINER RECYCLING ACTIVITY
The Association of Postconsumer Plastic Recyclers
 The Association of Postconsumer Plastic Recyclers The Voice of Plastics Recycling APR THE ASSOCIATION OF POST CONSUMER PLASTIC RECYCLERS Maryland Recycling Network May 17, 2012 APR 95% of Postconsumer
National Association for PET Container Resources PO Box 1327 Sonoma, California
 National Association for PET Container Resources PO Box 1327 Sonoma, California 95476 707.996.4207 www.napcor.com www.plasticsrecycling.org 2011 REPORT ON POSTCONSUMER PET CONTAINER RECYCLING ACTIVITY
Envisioning a Greener World. By Tamsin Ettefagh Of Envision Plastics
 Envisioning a Greener World By Tamsin Ettefagh Of Envision Plastics Points of Discussion A little history of HDPE Recycling Our Industry today End uses for HDPE A little bit about Envision Plastics and
FEBRUARY National Post-Consumer Non-Bottle Rigid Plastic Recycling Report
 Prepared by More Recycling for the American Chemistry Council FEBRUARY 2018 2016 National Post-Consumer Non-Bottle Rigid Plastic Recycling Report MORE RECYCLING P.O. BOX 358 SONOMA CA 95476 844.687.4757
SCOPE. APR s DEFINITION OF RECYCLABLE
 The APR Design Guide for Plastics Recyclability is the most comprehensive and user-friendly resource outlining the plastics recycling industry s recommendations in the marketplace today. The content has
Market Snapshot June 2017
 Market Snapshot June 2017 Uncertainty over Chinese import restrictions affected both recovered paper and plastic markets during the second quarter. Mixed paper and board prices fell by 20% on fears that
The Sort for Value Matrix A New APR Tool for MRFs April 23, 2014
 The Sort for Value Matrix A New APR Tool for MRFs April 23, 2014 Today s Presenters Kara Pochiro APR Communications Director Patty Moore Moore Recycling Associates Liz Bedard APR Rigid Plastics Recycling
Plastics Recyclers (APR), 2009 Report on Post Consumer PET Container Recycling Activity, Final Report.
, 2009 Report on Post Consumer PET Container Recycling Activity, Final Report.") 4361 Keystone Ave. Culver City, CA 90232 Telephone (310) 559-7451 Fax (310) 839-1142 www.container-recycling.org www.bottlebill.org September 30, 2011 Ms. Hope Pillsbury Office of Resource Conservation
4361 Keystone Ave. Culver City, CA 90232 Telephone (310) 559-7451 Fax (310) 839-1142 www.container-recycling.org www.bottlebill.org September 30, 2011 Ms. Hope Pillsbury Office of Resource Conservation
THE FACTS: CHINA S TIGHTER CONTROLS ON THE QUALITY OF WASTE IMPORTS
 UPDATED 16 th February 2018 THE FACTS: CHINA S TIGHTER CONTROLS ON THE QUALITY OF WASTE IMPORTS The recycling, recovery and trade in recovered materials is a multi-billion dollar global business. Millions
THE FACTS: CHINA S TIGHTER RESTRICTIONS ON WASTE IMPORTS
 THE FACTS: CHINA S TIGHTER RESTRICTIONS ON WASTE IMPORTS The recycling, recovery and trade in recovered materials is a multi-billion dollar global business. Millions of tonnes of recovered materials are
2015 Annual Report January 2016
 2015 Annual Report January 2016 A LETTER FROM STEVE ALEXANDER Happy New Year, On behalf of the APR Board of Directors, along with Kara, John, Dave, Sandi, Liz Bedard, Meredith Leahy and myself, let me
October 26, 2011 RIGID PLASTIC PACKAGING ACC OVERVIEW
 October 26, 2011 RIGID PLASTIC PACKAGING ACC OVERVIEW ACC s Plastic Division The Plastics Division of the American Chemistry Council (ACC) represents leading manufacturers of plastic resins. The Rigid
PET Recycling Markets, Trends & Challenges. Resa Dimino Director of Public Policy NYS Federation Conference May 16, 2016
 PET Recycling Markets, Trends & Challenges Resa Dimino Director of Public Policy NYS Federation Conference May 16, 2016 Overview Introduction to NAPCOR PET Recycling Context NAPCOR Initiative to Address
Critical Guidance Protocol for Clear PET Articles with Labels and Closures
 Critical Guidance Protocol for Clear PET Articles with Labels and Closures Document number PET-CG-C02 Creation or Revision Date: November 16, 2018 Introduction Scope, significance and use This is a comprehensive
Trends Affecting Recycling s Future. Jerry Powell Resource Recycling Portland, Oregon
 Trends Affecting Recycling s Future Jerry Powell Resource Recycling Portland, Oregon www.resource-recycling.com What we ll look at today A quick review of recycling s progress An analysis of key trends
The Aluminum Can Advantage Key Sustainability Performance Indicators May 2015
 The Aluminum Can Advantage Key Sustainability Performance Indicators May 2015 Introduction As the leading voice for the aluminum industry in North America, the Aluminum Association is committed to providing
What' s can? ByTed SieglerandNatalie Starr
 Reprinted from We know what plastics are being recycled, but what's still being tossed out with the trash? A fascinating waste characterization study looks into which plastics are being thrown out, and
Newport Beach, CA June 22, 2016
 Newport Beach, CA June 22, 2016 Overview About Avangard Innovative Recycling Rates/Availability Collection Mechanisms Sources of Commercial Film Streams Examples of Commercial Film Reclaimers Challenges
Environmental Technical Brief: HDPE
 Dordan Manufacturing Co. Inc. 2025 S. Castle Rd. Woodstock, IL, 60098 815.334.0087 Dordan.com Environmental Technical Brief: HDPE An overview of High-density Polyethylene s environmental profile HPDE An
Minimum thickness of plastic bottles to be recycled research findings
 Final Report Minimum thickness of plastic bottles to be recycled research findings Calculation of minimum thickness of rigid plastic packaging in order to be recycled Project code: RCY125-002 Date: October
The Many Challenges of Plastic Recycling
 The Many Challenges of Plastic Recycling http://www.sustainablebrands.com/news_and_views/waste_not/tom_szaky/many_challenges_plastic_recycling Upwards of 100 million tons of plastic are manufactured annually
National Recycling and Recovery Surveys (NRRS) Prepared for the Australian Packaging Covenant
 Prepared for the Australian Packaging Covenant") National Recycling and Recovery Surveys (NRRS) PAPER PACKAGING, GLASS CONTAINERS, STEEL CANS AND ALUMINIUM PACKAGING Prepared for the Australian Packaging Covenant Prepared by IndustryEdge Pty Ltd and
National Recycling and Recovery Surveys (NRRS) PAPER PACKAGING, GLASS CONTAINERS, STEEL CANS AND ALUMINIUM PACKAGING Prepared for the Australian Packaging Covenant Prepared by IndustryEdge Pty Ltd and
What Really Goes in That Bale? An Overview of the National Mixed Rigid Bale Composition Study
 What Really Goes in That Bale? An Overview of the 2014-15 National Mixed Rigid Bale Composition Study August 11, 2015 Coming Up September 15th Sponsored By: Resources to Support Domestic Plastic Recycling
Cleaning the rpet Stream: How we scale post-consumer recycled PET in the US
 Cleaning the rpet Stream: How we scale post-consumer recycled PET in the US A new study by Closed Loop Partners Table of contents 1 INTRODUCTION 2 RECENT TRENDS IN RPET CAPACITY IN NORTH AMERICA 3 RPET
Household Container Recycling - High School Student Worksheet. Newspapers, Plastic Bottles, Glass Jars, Cardboard Boxes, etc.
 Name: Date: Part I: Introduction 1. List 4 household items that can be recycled. Newspas, Plastic Bottles, Glass Jars, Cardboard Boxes, etc. 2. What is Single Stream Recycling? A system where all types
Recycling Plastics from Municipal Solid Waste
 Chapter 1 Recycling Plastics from Municipal Solid Waste An Overview Wayne Pearson Downloaded via 148.251.232.83 on August 22, 2018 at 02:22:16 (UTC). See https://pubs.acs.org/sharingguidelines for options
Plastic Sorting Best Management Practices: Resources for MRFs, Municipalities, & Reclaimers. September 25, 2018
 Plastic Sorting Best Management Practices: Resources for MRFs, Municipalities, & Reclaimers September 25, 2018 * RESCHEDULED Presentation slides and recording will be posted on the APR Website. Today s
Population Access to the Recycling of Post Consumer Plastic Packaging in Canada
 Population Access to the Recycling of Post Consumer Plastic Packaging in Canada May 2013 Submitted to: Canadian Plastics Industry Association Prepared by: Executive Summary In 2004, CM Consulting prepared
PET Thermoform Recycling:
 PET Thermoform Recycling: Current Markets & Outlook Kate Eagles Rigids Committee Meeting / APR October 8, 2013 New Sources: PET Thermoforms What are thermoformed packages? Cups, clamshells, trays, tubs,
Market Snapshot March 2016
 Market Snapshot March 2016 UK recovered material prices generally increased in value between December 2015 and March 2016 with the strongest gains seen in recovered metal can markets. The price of recovered
Packaging Savings Go Beyond Recycling
 Packaging Savings Go Beyond Recycling Sara Hartwell US Environmental Protection Agency Office of Resource Conservation and Recovery Why Packaging is Important Packaging protects the product Physically
TN RECYCLES INVEST IN SUSTAINABLE GROWTH REDUCE DISPOSAL REALIZED POTENTIAL CAPTURE VALUE CREATE JOBS
 TN RECYCLES INVEST IN SUSTAINABLE GROWTH CREATE JOBS REDUCE DISPOSAL CAPTURE VALUE REALIZED POTENTIAL Lifecycle of Material in Tennessee s Recycling Economy JOBS MATERIAL COST/VALUE URBAN W/ CURBSIDE &
THE PARADIGM SHIFT What s Wrong With Our Financials? SERDC November 2016 David Lank
 THE PARADIGM SHIFT What s Wrong With Our Financials? SERDC November 2016 David Lank THE OLD PARADIGM Recycling is source separated from trash OCC is large and flat Fiber is 2 dimensional, mostly newspaper
Plastics Recycling Market Report - UK Analysis
 Plastics Recycling Market Report - UK 2011-2015 Analysis Published: 16/09/2011 / Number of Pages: 87 / Price: 795.00 495.00 Introduction and Overview AMA Research are pleased to announce the publication
Economic Impact of Recycling in Alabama and Opportunities for Growth. Alabama Department of Environmental Management. Land Division Solid Waste Branch
 Economic Impact of Recycling in Alabama and Opportunities for Growth Alabama Department of Environmental Management Land Division Solid Waste Branch June 2012 Alabama Department of Environmental Management
The APR Design TM Guide for Plastics Recyclability
 The APR Design TM Guide for Plastics Recyclability Introduction The APR Design TM Guide for Plastics Recyclability has been prepared by the Association of Postconsumer Plastic Recyclers (the APR) as a
ECONOMIC IMPACT OF ADVANCED PLASTICS RECYCLING AND RECOVERY FACILITIES IN THE U.S.
 ECONOMIC IMPACT OF ADVANCED PLASTICS RECYCLING AND RECOVERY FACILITIES IN THE U.S. American Chemistry Council Economics & Statistics February 2019 EXECUTIVE SUMMARY In this updated report, Economic Impact
Market Snapshot December 2016
 Market Snapshot December 2016 Of all the UK s recovered material prices metal can prices exhibited the strongest gains, increasing sharply during Q4-2016 with steel can prices up 17% and aluminium can
Dirty Regrind Specifications
 Dirty Regrind Specifications Issue: The quality requirements for PET regrind are far more demanding than for baled PET. And, the allowable levels of contamination in PET regrind are in the parts per million
Request for Qualifications. Purchase, Transport and Management of Recovered Post-Consumer Recyclables
 Request for Qualifications Purchase, Transport and Management of Recovered Post-Consumer Recyclables Issued by: Monterey Regional Waste Management District 14201 Del Monte Blvd Marina, CA 93933 Prepared
Dynamic Duo PET AND HDPE // RECYCLED/RECYCLABLE MATERIAL TRAYS
 > Dynamic Duo PET AND HDPE // RECYCLED/RECYCLABLE MATERIAL TRAYS SWITCH TO THE ENVIRONMENTALLY RESPONSIBLE SOLUTIONS TM Replace your foam trays with repeteable TM and rehdpeable trays. Polystyrene (PS)
Benchmark Test for Clear PET Resin and Molded Articles
 Benchmark Test for Clear PET Resin and Molded Articles Document number PET-B-01 Revision date - November 16, 2018 Introduction Scope, significance and use This is a laboratory scale evaluation that can
PET Package Materials Balance
 PET Package Materials Balance Document Code PET-S-04 Publication or Revision Date: November 16, 2018 Introduction Scope, Significance and Use This document presents a standard method to evaluate PET packages
Champions for Change Critical Issues Guidance for Innovations
 Association of Postconsumer Plastic Recyclers 2000 L Street, NW, Suite 835, Washington D.C. 20036 (202) 316-3046 www.plasticsrecycling.org Champions for Change Critical Issues Guidance for Innovations
Case Study for Multi-Stakeholders Partnerships
 1 Case Study for Multi-Stakeholders Partnerships ~From Wastes to Valuable Resources~ (PET Bottle Recycling in Japan) Mar. 19, 2013 The Council for PET Bottle Recycling (CPBR, Japan) 2 Plastic Packages
Critical Guidance Protocol for Clear PET Resin and Molded Articles
 Critical Guidance Protocol for Clear PET Resin and Molded Articles Document number PET-CG-01 Revision date - November 16, 2018 Introduction Scope, significance and use This is a comprehensive laboratory
PWMI Newsletter. Plastic Products,Plastic Waste and Resource Recovery[2007]
![PWMI Newsletter. Plastic Products,Plastic Waste and Resource Recovery[2007]](/thumbs/88/116041481.jpg "PWMI Newsletter. Plastic Products,Plastic Waste and Resource Recovery[2007]") PWMI Newsletter NO 38 2009.5 Plastic Waste Management Institute JAPAN Plastic Products,Plastic Waste and Resource Recovery[2007] Background information and notes on the publication of the Flowchart of
PWMI Newsletter NO 38 2009.5 Plastic Waste Management Institute JAPAN Plastic Products,Plastic Waste and Resource Recovery[2007] Background information and notes on the publication of the Flowchart of
PET Thermoforms excerpt from The APR Design TM Guide for Plastics Recyclability
 PET Thermoformed Packages PET thermoformed packages are produced by extruding a sheet, then heating that sheet to a pliable forming temperature and then usually assisted by a vacuum formed by a mold and
Doing the Right THING Can be a Confusing THING
 Doing the Right THING Can be a Confusing THING Sabrina Combs Recycling and Public Services Projects Administrator City of Bothell Public Works Department Who am I? City of Bothell Public Works Department
RECYCLING AS A SUSTAINABILITY PRACTICE IN THE NORTH AMERICAN VINYL INDUSTRY Richard Krock, The Vinyl Institute, Stephen Tarnell, Tarnell Company, LLC
 RECYCLING AS A SUSTAINABILITY PRACTICE IN THE NORTH AMERICAN VINYL INDUSTRY Richard Krock, The Vinyl Institute, Stephen Tarnell, Tarnell Company, LLC Abstract: Recycling of vinyl materials has been ongoing
Polyethylene (HDPE) Thin Wall Containers
 Thin Wall Containers") Polyethylene (HDPE) Thin Wall Containers For purposes of this design guidance document, thin walled packaging, also known as thin walled containers, are rigid plastic packaging with a wall thickness less
Polyethylene (HDPE) Thin Wall Containers For purposes of this design guidance document, thin walled packaging, also known as thin walled containers, are rigid plastic packaging with a wall thickness less
Pouch Packaging: Popular, Profitable and Problematic
 Pouch Packaging: Popular, Profitable and Problematic A Presentation of the Closed Loop Foundation Research Initiative Investigating Emerging Recycling Solutions for Post consumer Film and Flexible Packaging
Divert More Earn More!!! Mixed Rigid Plastics (MRP) Small Plastic Containers (SPC) Igor Beylin Universal Commodity Services, Inc
 Small Plastic Containers (SPC) Igor Beylin Universal Commodity Services, Inc") Divert More Earn More!!! Mixed Rigid Plastics (MRP) Small Plastic Containers (SPC) Igor Beylin Universal Commodity Services, Inc What is MRP? Large & Bulky Plastics Non-Bottle & Non-Film Easy to Identify
Divert More Earn More!!! Mixed Rigid Plastics (MRP) Small Plastic Containers (SPC) Igor Beylin Universal Commodity Services, Inc What is MRP? Large & Bulky Plastics Non-Bottle & Non-Film Easy to Identify
3. In the first simulation with 2 workers, how many total items are sorted in one hour?
 Name: Date: Part I: Introduction 1. List 4 household items that can be recycled. 2. What is Single Stream Recycling? 3. What are three benefits of recycling? 4. What are three possible disadvantages of
Materials Pricing Report 30 November 2012
 Materials Pricing Report 3 November 212 Market overview Recovered paper and board prices are broadly stable with slight increases in mixed paper and OCC grades. Demand from China is expected to remain
Out- throws: Materials that can be tolerated or removed during the recycling process.
 [Type text] Contents 1. Purpose... 1 2. Definitions... 1 3. Plastics Identification Code for Polymers... 2 4. Contaminants... 3 4.1. Prohibited materials... 4 4.2. Out throws... 4 5. Substandard Quality...
Foodservice Packaging: Trash? No, Treasure!
 Foodservice Packaging: Trash? No, Treasure! Carolina Recycling Association 25 th Annual Conference March 25, 2015 - DRAFT - PRG MEMBER PRESENTATION 12/12/12 About Us 2 Foodservice Packaging Institute (FPI)
Cleaning the rpet Stream Opportunities to strengthen the capital landscape for circular supply chains November 2017
 Cleaning the rpet Stream Opportunities to strengthen the capital landscape for circular supply chains November 2017 Closed Loop Partners is investing in circular supply chains $35 million deployed as of
Changing the dialogue around solid waste and recycling programs
 Changing the dialogue around solid waste and recycling programs Kansas Solid Waste Management Conference Susan Robinson October 3, 2018 Waste Management Recycling Overview WM CORe: Urban Solution to Food
National Recycling and Recovery Surveys (NRRS) Prepared for the Australian Packaging Covenant Organisation
 Prepared for the Australian Packaging Covenant Organisation") National Recycling and Recovery Surveys (NRRS) PAPER PACKAGING, GLASS CONTAINERS, STEEL CANS AND ALUMINIUM PACKAGING Prepared for the Australian Packaging Covenant Organisation Prepared by IndustryEdge
National Recycling and Recovery Surveys (NRRS) PAPER PACKAGING, GLASS CONTAINERS, STEEL CANS AND ALUMINIUM PACKAGING Prepared for the Australian Packaging Covenant Organisation Prepared by IndustryEdge
CIRCULAR ECONOMY of Plastics
 CIRCULAR ECONOMY of Plastics OUR COMMITMENT to a Circular Economy is to foster premium re-use of plastic scrap to reduce carbon emissions and to divert plastics destined for landfills or incineration into
Plastics Recycling: Tools to Collect for Value. Tonya Randell Moore Recycling Associates NRRA Conference May 16, 2016
 Plastics Recycling: Tools to Collect for Value Tonya Randell Moore Recycling Associates NRRA Conference May 16, 2016 Overview Why Quality Pays: Market Drivers & Influences Plastic Scrap Pricing How to
Information Item No. 3
 P.O. Box 1749 Halifax, Nova Scotia B3J 3A5 Canada Information Item No. 3 Environment and Sustainability Standing Committee November 2, 2017 TO: Chair and Members of Environment and Sustainability Standing
ADAPTING TO THE EVOLVING TON Accordant s Competitive Approach
 ADAPTING TO THE EVOLVING TON Accordant s Competitive Approach Jens A. Hybertson THE PRINCIPLES The municipal solid waste stream has experienced significant compositional changes over recent time, indicated
Executive Summary UNDERSTANDING BEVERAGE CONTAINER RECOVERY. Background. Key Conclusions
 UNDERSTANDING BEVERAGE CONTAINER RECOVERY A Value Chain Assessment prepared for the Multi-Stakeholder Recovery Project, Stage 1 Background Businesses and Environmentalists Allied for Recycling (BEAR),
A Report on the Status of Post Consumer Plastic Packaging Recycling in the USA and Canada
 A Report on the Status of Post Consumer Plastic Packaging Recycling in the USA and Canada Contents: I) Preface II) Overview III) Polyethylene Terephthlate (PET) IV) High Density Polyethylene (HDPE) V)
Recycling Markets & Residential Curbside Recycling Contamination October 12, 2018
 Recycling Markets & Residential Curbside Recycling Contamination October 12, 2018 Presentation By Greg Maxwell Senior Vice President Resource Management Companies Part 1 MRF Paper Fiber Recycling Markets
Sonoco s Environmental Sustainability Portfolio A long history of reclamation and recycling
 Sonoco s Environmental Sustainability Portfolio A long history of reclamation and recycling Long before it became popular, Sonoco operated an aggressive paper recovery and recycling program. Today, after
3. In the first simulation with 2 workers, how many total items are sorted in one hour?
 Name: Date: Part I: Introduction 1. List 4 household items that can be recycled. 2. What is Single Stream Recycling? 3. What are three benefits of recycling? 4. What are three possible disadvantages of
In 2017, South Africa recycled tons of material into raw material. Of these, only 6.3 % was exported to be recycled elsewhere.
 Tonnages recycled EXECUTIVE SUMMARY 1.1 PLASTICS RECYCLING IN SOUTH AFRICA IN 2017 Plastics raw materials are becoming scarcer as the population increases. Humankind has to deal responsibly with its resources.
Market View. Aluminum Highlights. Aluminum Demand Grows for 6 th Consecutive Year
 Market View Aluminum Highlights Week Ending: An update on Industry activity and economic indicators By: Paul Williams, Head of Aluminium CRU Analysis The views expressed in the Market View are those of
Market Snapshot March 2017
 Market Snapshot March 2017 Metal can prices continued to show strong gains during the first quarter of 2017, with steel and mixed can prices up 29% and 15% respectively. An increase in iron ore prices
Executive Summary UNDERSTANDING BEVERAGE CONTAINER RECOVERY
 UNDERSTANDING BEVERAGE CONTAINER RECOVERY A Value Chain Assessment prepared for the Multi-Stakeholder Recovery Project, Stage 1 Background Businesses and Environmentalists Allied for Recycling (BEAR),
Washington D.C. Accepting Food Service Packaging. Department of Public Works Ameripen Conference 2018 May 31, 2018
 Washington D.C. Accepting Food Service Packaging Department of Public Works Ameripen Conference 2018 May 31, 2018 1 AGENDA What are the requirements What was behind the decision to accept food service
Oregon E-Cycles Biennial Report
 Legislative Report Oregon E-Cycles Biennial Report March 2012 Last Updated 3/1/12 By: L.Pickerell This report prepared by: 811 SW 6 th Avenue Portland, OR 97204 1-800-452-4011 www.oregon.gov/deq Oregon
Recycling, It s In Your Hands
 Recycling, It s In Your Hands Just taking a few extra minutes to sort and prepare your recyclables properly can make a big difference. Think of it as an investment in the health of our environment. And
Composition of plastic waste collected via kerbside. Results of a waste compositional analysis of plastics at MRFs and PRFs
 Composition of plastic waste collected via kerbside Results of a waste compositional analysis of plastics at MRFs and PRFs Date: October 2018 WRAP s vision is a world in which resources are used sustainably.
Recycle BC Tour. Sept Extended Producer Responsibility (EPR) 9/7/2018
 9/7/2018") Recycle BC Tour Sept 2016 Extended Producer Responsibility (EPR) 1 Scope of Tour To learn about the new system in British Columbia for collecting/processing packaging and printed paper (PPP) from residents
Recycle BC Tour Sept 2016 Extended Producer Responsibility (EPR) 1 Scope of Tour To learn about the new system in British Columbia for collecting/processing packaging and printed paper (PPP) from residents
Chemical. Operational review / Diversified chemical. Polymers 85% of revenue Resins 15% of revenue. Revenue increased by 79% 3 production facilities
 Operational review / Diversified chemical Chemical Polymers 85% of revenue Resins 15% of revenue Revenue increased by 79% 539 employees 3 production facilities 106 000+ tonnes of UF resin produced 121
Alberta s Manufacturing Industry is Recovering in 2017
 ECONOMIC COMMENTARY Alberta s Manufacturing Industry is Recovering in 2017 Highlights: Alberta s manufacturing industry was in recession in 2015 and 2016 as a result of the dramatic drop in crude oil prices.
PROCESS ECONOMICS PROGRAM
 PROCESS ECONOMICS PROGRAM SRI INTERNATIONAL Abstract Process Economics Program Report No. 199 PLASTICS RECLAMATION AND RECYCLING Menlo Park, California 94025 (January 1992) In the rapidly growing business
We didn't plan to talk about it, but since you asked...
 We didn't plan to talk about it, but since you asked... Here s some info re recycle of plastics vs. landfills Are the benefits of recycling plastics outweighed by the pollution that results from recycling
California Department of Conservation. Six Month Report of Beverage Container Recycling & Significant Carbon Reductions
 California Department of Conservation Six Month Report of Beverage Container Recycling & Significant Carbon Reductions Table of Contents Executive Summary... 1 Background of the California Beverage Container
Background. What is a bale?
 Background To assist Stewardship Ontario in setting blue box fees for stewards each year, MRF Material Composition Studies are undertaken at selected material recycling facilities (MRFs) on an annual basis.
THE TRUTH ABOUT PCR. KW Plastics Recycling Division. Keynote Presentation PSCI Annual Meeting-Dana Point, CA March 21, 2010
 THE TRUTH ABOUT PCR KW Plastics Recycling Division Keynote Presentation PSCI Annual Meeting-Dana Point, CA March 21, 2010 Stephanie Baker Director of Market Development -KW & PCR -PCR 101: definitions
we add character to plastics Baerlocher Additives for Recycled Polymers
 we add character to plastics Baerlocher Additives for Recycled Polymers Active Chemistry - Baerlocher Additives: Effective, Efficient, Economical. Baeropol One-Packs Deliver Additive Solutions for Polymer
Material Recovery Facility Mass Balance and Efficiency Study
 Bluewater Recycling Association Material Recovery Facility Mass Balance and Efficiency Study PREPARED BY: Reclay StewardEdge, Inc. December 8, 2017 Contents 1. Executive Summary... 1 2. Objectives and
PP Benchmark Test HDPE- B- 01
 PP Benchmark Test HDPE- B- 01 Introduction This document is intended to allow a stake holder to understand if a polypropylene (PP) article that is in the market today, or intended to be brought to the
Taking Full Advantage of Secondary Raw Materials
 Compounding RECYCLING 1 [VEHICLE ENGINEERING] [MEDICAL TECHNOLOGY] [PACKAGING] [ELECTRICAL & ELECTRONICS] [CONSTRUCTION] [CONSUMER GOODS] [LEISURE & SPORTS] [OPTICS] Sonderdruck aus Kunststoffe international
EMPLOYMENT TRENDS IN NORTH CAROLINA S RECYCLING INDUSTRY 2015
 EMPLOYMENT TRENDS IN NORTH CAROLINA S RECYCLING INDUSTRY 2015 North Carolina Department of Environmental Quality Division of Environmental Assistance and Customer Service Recycling Business Assistance