Feed Use in the NZ Dairy Industry
|
|
|
- Estella McDowell
- 6 years ago
- Views:
Transcription
 ISSN No: 2253-3923 (online) June")
1 Feed Use in the NZ Dairy Industry MPI Technical Paper 2017/53 Prepared for the Ministry for Primary Industries ISBN No: (online) ISSN No: (online) June 2016
2 Disclaimer While every effort has been made to ensure the information in this publication is accurate, the Ministry for Primary Industries does not accept any responsibility or liability for error of fact, omission, interpretation or opinion that may be present, nor for the consequences of any decisions based on this information. Requests for further copies should be directed to: Publications Logistics Officer Ministry for Primary Industries PO Box 2526 WELLINGTON Telephone: Facsimile: This publication is also available on the Ministry for Primary Industries website at Crown Copyright - Ministry for Primary Industries


3 Feed Use in the NZ Dairy Industry A review of feed volumes consumed by New Zealand dairy cows since , including future estimates to Prepared for the Ministry of Primary Industries June 2016 DairyNZ Economics Group
4 DairyNZ Feed and Farm Systems Group Contents Executive Summary... 3 Introduction... 4 Objective... 5 Background... 5 Methodology... 6 Feed Demand Approach... 7 Farm Data Approach... 9 National Statistical Approach... 9 Comparing Approaches Feed Characteristics Assumptions and Limitations Results Feed Demand Approach Farm Data Approach National Statistical Approach Palm Kernel Extract (PKE) Maize Grain Maize Silage Barley Wheat Oats Cereal Whole Crop Silage Fodder Beet Kale Rape Turnips Swedes Other Brassicas Brewer s Grain Tapioca Soyabean Meal Cottonseed Other Supplements Total Supplements from National Statistical Approach
5 Characteristics of Non-pasture Feeds Forecast Methodology Forecast Assumptions Forecast Feed Demand Forecast Results Modest Growth Forecast Scenario Modest Growth Forecast Scenario High Growth Forecast Scenario High Growth Driven by Supplements High Growth Driven by Pasture and Crops Forecast Summary Final Comments and Considerations
6 Executive Summary This report provides a summary of the trends in non-pasture feed use on New Zealand dairy farms from to as well as future projections of feed demand out to , including the breakdown between pasture, crops grown, harvested supplementary feed and imported supplementary feed. The dairy industry has expanded considerably over the last 25 years with additional land areas used for dairy production; the industry has become more intensive with higher stocking rates and increased per cow milk production. Improved milk production has occurred from increased feed levels, particularly pasture (including hay and pasture silage), palm kernel extract (PKE), maize silage and in recent years fodder beet as well as improvements in feed conversion efficiency (FCE) partly through increased days in milk. Given the absence of feed data, this project has utilised multiple approaches to estimate the volume of nonpasture feeds consumed by dairy cows, regardless of where the feed is grown. This includes the Feed Demand Approach which sourced data from New Zealand Dairy Statistics and derived feed requirements per cow given values for average liveweight and milksolids production per cow. The Farm Data Approach used DairyBase benchmark data to calculate adjusted total supplements eaten per cow. The National Statistical Approach, obtained individual feed data from many sources, some published and some from experienced people working in specialist feed and research organisations. The proportion of individual feeds grown, but consumed by dairy cows (as opposed to other livestock or other uses) was the most challenging component to estimate. The total amount of feed eaten by New Zealand dairy cows has increased 161 per cent over the last 25 years, a growth rate of 3.8 per cent CAGR (compound annual growth rate). This increase has occurred primarily (80%) through more cows, from both new dairy land and increased stocking rates. On a per cow basis feed eaten has increased one tonne (0.8% CAGR) to 4.93 tonnes dry matter per cow in Imported supplements, including PKE increased 7.6 per cent CAGR, harvested supplement including maize silage and barley increased 6.7 per cent CAGR while grown crops including fodder beet, kale and swedes increased 4.9 per cent CAGR between and refer to Figure 9. Cows Milked (million) Feed Demand (million t DM) Feed Demand (t DM/cow) Pasture eaten (t DM/cow) Crop eaten (t DM/cow) Harvested supplement (t DM/cow) Imported Supplement (t DM/cow) Feed eaten per hectare increased 53 per cent (+1.7% CAGR) or 4.9 tonne from to This is a faster increase than on a per cow basis as it includes an increase in stocking rate. Pasture eaten accounted for just over half the increase in feed eaten per hectare, while imported supplements (+1.0 tonne), harvested supplement (+0.7 tonnes) and grown crops (+0.4 tonnes) all increased over the past 25 years. Feed Demand (t DM/ha) Pasture eaten (t DM/ha) Crop eaten (t DM/ha) Harvested supplement (t DM/ha) Imported Supplement (t DM/ha) Non-pasture feeds consumed by dairy cows increased from 0.16 tonnes DM per cow in to 0.89 tonnes per cow in As a proportion of a cow s total diet non-pasture feeds increased from 4.2 per cent in to 18.0 per cent in Harvested crop increased steadily over the last 25 years, while imported supplements increased significantly during the 2000s and crop eaten increased significantly recently. The amount of pasture eaten per cow increased in the 1990s, but eased during the 2000s. Pasture eaten per hectare increased 1.7 per cent per year to , but growth slowed to a rate of 0.7 per cent since. Feed Demand (t DM/ha) Pasture eaten (t DM/ha) Crop eaten (t DM/ha) Harvested supplement (t DM/ha) Imported Supplement (t DM/ha) % 95.8% 0.9% 2.1% 1.2% % 93.4% 0.8% 3.4% 2.4% 3
7 % 86.2% 1.3% 4.9% 7.6% % 82.0% 3.7% 6.3% 8.0% Predicting future feed consumed is extremely difficult, particularly given the low milk prices currently experienced, volatile seasonal weather conditions and environmental pressures to reduce nutrient losses and different options farmers may take to achieve targets. As a result, two forecast scenarios were developed to ; modest milksolids growth which increased milk production by 0.8 per cent per year; while the high growth scenario assumed milk production would increase at twice this rate of 1.7 per cent per year. In both moderate and high growth scenarios, effective hectares increase slowly at the same rate. There were two pathways to the modest growth scenario, either through holding stocking rates constant and a modest increase in milksolids per cow or by reducing stocking rates and increasing milksolids per cow more to achieve the same overall production. The high growth forecast scenario also assumed stocking rates would increase from 2.8 to 3.0 cows per hectare. Annual per cow feed demand was derived based on estimated milksolids per cow and constant average cow liveweights. Two pathways were developed for the high growth scenario with either pasture and crop or imported supplementary feed being the drivers of the additional feed consumed, while for the modest growth scenario it was assumed the growth would be driven from increased pasture and crop eaten per cow. A summary of the key feed use per hectare in is provided in the table below. The modest growth scenario with constant stocking rates feed eaten increases to tonnes per hectare, with the increase occurring from more pasture and fodder beet consumed, while PKE imports and maize silage decline. The second modest growth scenario with reduced stocking rates shows feed eaten per hectare only reaches tonnes dry matter per hectare with the difference being lower pasture consumed per hectare. In the high growth supplements scenario, total feed eaten increases to tonnes per hectare due to increased milksolids production. The majority of the additional feed consumed will be from increased PKE, maize silage and barley. In the high growth pasture and crop scenario, the increase in feed eaten will be driven by twice as much fodder beet, while the volumes of imported supplements were capped at current levels. Pasture eaten per hectare is one tonne higher than the modest growth constant stocking rate scenario. The modest growth scenario with constant stocking rate is considered to be the most likely dairy industry pathway into the future, although if more growth occurs over the next decade the high growth pasture and crop scenario is considered the more likely of the two scenarios developed for this project Modest Growth Constant SR Modest Growth Low SR High Growth- Supplements High Growth - Pasture & Crop Milksolids (billion kg) Milksolids per cow Milksolids per hectare 1,127 1,127 1,245 1,245 Stocking rate Cows milked Feed eaten (t DM/ha) Pasture (t DM/ha) Crop (t DM/ha) Harvested supplements (t DM/ha) Imported supplements (t DM/ha) Introduction The purpose of this study is to quantify the volume of non-pasture feed consumed by New Zealand dairy cows since , including future estimates to This information will be used by the Ministry of Primary Industries (MPI) to consider how non-pasture feed consumption may affect estimates of New Zealand s greenhouse gas inventory. The usage of non-pasture feed was low in the early 1990s, largely comprising maize grain and maize silage along with winter and summer crops such as barley, kale, swedes and turnips. The use of non-pasture feeds increased gradually in line with growing stocking rates until The following season, milk prices increased to record levels which also coincided with a severe drought. The response from dairy farmers was to purchase more supplementary feed (particularly palm kernel expeller, PKE), in order to continue milking to capture the advantages of the high milk prices. Volumes of non-pasture feeds, particularly 4
8 palm kernel expeller, have increased further since as many farmers have intensified in response to high milk prices, dry seasonal conditions and increased feeding infrastructure on farms. Conversely, many farmers are currently reviewing their farm systems and adjusting to the lower milk prices by reducing cow numbers, keeping more young stock and wintering cows on the milking platform as well as reducing expenditure on harvested and imported supplementary feeds. It is unclear at this stage if these adjustments will be sustained in the future or if it is a short term adjustment. Objective This report aims to quantify the usage of non-pasture feeds on New Zealand dairy farms between and For the purpose of this report, all non-pasture based feeds consumed by dairy cows (excluding young stock) include grown crops and harvested and purchased supplement. Excluded from these figures are pasture hay and silage or any forage herbs such as chicory and plantain as well as lucerne as these are included as pasture. Liquid feeds such as proliq are recorded in tonnes of dry matter and are included as other supplements under the National Statistical Approach. Figure 1 below illustrates the distinction between crops, harvested supplements and imported supplements as non-pasture feeds. Figure 1: Feed categories including pasture and non-pasture feeds Following the development of future industry growth, this project then aims to forecast the use of non-pasture feed use in the New Zealand dairy industry for each season up to Also provided in this report is an overview of the main non-pasture feed types in terms of the method of feeding, metabolisable energy, crude protein and nitrogen content. Background Over the last 25 years the New Zealand dairy industry has experienced considerable expansion with the total number of cows more than doubling from 2.4 million in to 5.0 million in The increase in cow numbers resulted from more dairy effective hectares, particularly from the expansion of dairying in the South Island, as well as an increase in stocking rates. Effective hectares are defined as the area available to dairy cows for grazing; this does not include houses, sheds, tracks, bush, waterways and steep areas which are not grazed but may include areas sown in crop. National milk production has increased 4.5 per cent per year from 0.6 billion kilograms to 1.9 billion kilograms of milksolids since This growth in milk production was due to more cows but in part also due to increases in milksolids production per cow, the result of genetic gain, improved farm management, improved pastures and increased use of supplementary feed 2. Despite the increased use of supplementary feed, pasture continues to be the dominant feed offered to New Zealand dairy cows. In the proportion of pasture eaten by a dairy cow was 96 per cent of the total diet. This decreased to 82 per cent over the last 25 years. A suitable temperate climate with regular rainfall and fertile 1 New Zealand Dairy Statistics New Zealand Dairy Statistics
9 soils allows for extensive pasture growth and grazing all year round. This underpins New Zealand's internationally competitive position and has kept our cost of production lower than many other major dairy exporting countries. In order to overcome short-term pasture deficits, maintain cow body condition and to improve milksolids production, supplements offered to New Zealand dairy cows have increased significantly over the past 25 years. There is a very strong relationship between the volume of feed consumed and milk production per cow. Feed conversion efficiency (FCE) measures how effectively dairy cows convert feed eaten (dry matter) into milksolids production. The relationship between FCE, feed demand and milksolids production is shown Figure 2. Two FCE measures are used in this report, one divides milksolids production (kg MS) by feed demand (t DM) to give the kilograms of milksolids produced per tonne of feed eaten. The other divides feed demand (kg DM) by milksolids production (kg MS) to give the kilograms of dry matter feed required to produce one kilogram of milksolids. Driven by genetic gains and increased lactation length, both measures of FCE have improved steadily since Figure 2: Relationship between feed demand, FCE and milksolids production This report investigates the trends in non-pasture feed use on New Zealand dairy farms since Unfortunately there is limited data to provide accurate volumes of all the different non-pasture feeds consumed by dairy cows. Therefore, multiple approaches along with some key assumptions were employed in order to improve the accuracy of the figures and to ensure the figures were sensible. Milksolids production per cow, liveweight, stocking rate and effective hectares from the New Zealand Dairy Statistics were used to provide a guide for national feed demand each season. Methodology This report employs multiple approaches to derive the estimated volume of non-pasture feeds Feed Demand Approach - total feed eaten can be derived from data obtained from New Zealand Dairy Statistics publications and an estimate of feed demand per cow. Farm Data Approach - utilises benchmarking reports that are based on empirical farm data from DairyBase, the industry s benchmarking database. DairyBase provides data to estimate national supplementary feed eaten on a per cow and per hectare basis. National Statistical Approach - gathers data from external sources in order to give an overall representation of non-pasture feed use from to In reality, none of these methodologies on their own can provide the necessary data. Combining these three approaches ensures the results in this study are realistic and consistent with industry knowledge and understanding. Where necessary, adjustments were made so that the three approaches, provided valid results. This includes accounting for bias in DairyBase towards farms using higher than average imported supplementary 6
10 feeds as well as removing volumes of various feeds that are consumed by non-dairy animals and dairy young stock. Feed Demand Approach Feed requirements per cow were derived from the average liveweight and milksolids production per cow data sources from New Zealand Dairy Statistics. FCE could then be calculated, as shown in Figure 2. A national average cow liveweight (kg) was calculated for each season where data was available ( to ) using New Zealand Dairy Statistics publications by weighting liveweight by age (3 year olds and up) and breed category. The average over this period was used for seasons prior to where liveweight data was not available as there was little change in trend for liveweight over this time. Although cows are being fed more and producing more milk, national breeds have shown a trend towards more crossbred cows and less of the heavier Holstein-Friesians. Therefore, little change in average liveweight has occurred (refer to Figure 5). For each season, average per cow milksolids production and the calculated average liveweight were used to compute feed demand requirements per cow given a standardised metabolisable energy of 11.0 megajoules (MJ) per kilogram of dry matter (kg DM). This standardised value of 11 MJ/ kg DM provides a suitable estimate of metabolisable energy that is consumed by dairy cows on average 3. Although pasture and other feed types differ in metabolisable energy, most fall within the range of 10 to 14 MJ/ kg DM, with those comprising a high proportion of a cow s diet, such as pasture, averaging 11 MJ/ kg DM. Basal annual feed demand requirements per cow, as determined by cow liveweight and milksolids production, were based on the relationships identified by Nicol and Brookes (2007) 4. These relationships, as restated in DairyNZ Facts and Figures (2010) 3, were then used to generate a smooth function through multiple regression, based on a second degree polynomial with cross terms, to provide unbiased interpolations 5. This multiple regression relationship was then applied to each season using the corresponding liveweight and milksolids production per cow values sourced from New Zealand Dairy Statistics publications, to provide values for feed demand required per cow (t DM) for each season. Figure 3: Feed demand calculation Seasonal feed demand requirements per hectare could be obtained by multiplying the feed demand per cow by the average stocking rate for each season. Using total effective dairy hectares, the total required feed was 3 DairyNZ Facts and Figures, Nicol, A.M. and Brookes, I.M The Metabolisable Energy Requirements of Grazing Livestock, in Pasture and Supplements for Grazing Animals, PV Rattray, IM Brooks & AM Nicol (Eds), Occasional Publication No. 14, New Zealand Society for Animal Production 5 The relationship was estimated for actual feed demand (excluding an allowance for wastage). The estimated equation was Feed Demand = *LW *MS -5.8*10-7 *LW 2-1.1*10-6 *MS *10-6 LW*MS 7
11 calculated from feed demand requirements per hectare. These three measures provided national volumes of feed eaten by dairy cows on a per cow, per hectare and total basis for the last 25 years. As a sensibility check, the two feed conversion efficiency measures shown above were calculated for this 25 year period. Both measures showed improved efficiency of feed use in terms of milksolids production. There has been a decrease in the feed required to produce one kilogram of milksolids from approximately 16.2 kilograms of dry matter eaten per kilogram of milksolids produced in to around 13.1 kilograms in The other FCE measure showed that milksolids produced per tonne of feed eaten increased from about 62 kilograms milksolids per tonne of dry matter eaten to 76 kilograms milksolids- refer to Table 1. Another measure of FCE is the calculation of milksolids production as a percentage of liveweight. This shows milksolids production per cow relative to cow liveweight and indicates the efficiency of a cow in terms of producing its own liveweight in milk. Over this 25 year period, milksolids as a percentage of liveweight has increased steadily from 52 to 82 per cent, illustrating an increase in efficiency of per cow production as liveweights have not changed significantly. This suggests that feed eaten per cow is now more effectively utilised for milksolids production, rather than for activity and maintenance. Table 1 below provides these three efficiency measures from to These three measures have a very strong correlation with each other, with the correlation between milksolids as a percentage of liveweight and FCE (kg MS/ t DM) as 99.6 per cent, FCE (kg MS/ t DM) and FCE (kg DM/ kg MS) as 99.5 per cent and FCE (kg DM/ kg MS) and milksolids as a percentage of liveweight as 98.3 per cent. Table 1: Feed Conversion Efficiency measures from to , 4 Season MS % Liveweight FCE (kg MS/ t DM) FCE (kg DM/ kg MS) % % % % % % % % % % % % % % % % % % % % % % % %
12 % Source: New Zealand Dairy Statistics, DairyNZ Economics Group Farm Data Approach DairyBase contains physical and financial information for a selection of New Zealand dairy farms. DairyBase captures a sample of farms that have voluntarily entered data, typically these farms are larger, higher producing farms than depicted by the New Zealand Dairy Statistics but this report aims to remove any bias that may be present in this data set. DairyBase is a tool that enables users to benchmark farm performance by comparing their own farm to industry aggregates or targets. The Farm Data Approach used weighted average New Zealand data from DairyBase to estimate supplements eaten (per cow and per hectare). DairyBase benchmark data from to was used to calculate an adjusted total supplements eaten per cow value, scaled to milksolids production per cow from the New Zealand Dairy Statistics. The purpose of this was to obtain a national estimate of supplements eaten (excluding crop), rather than use what was stated in the benchmarking reports given DairyBase contains a self-selected sample of farms and could be biased. Supplements (t DM/cow) were estimated for seasons prior to Feed demand per cow from the Feed Demand Approach was used in conjunction with supplements per cow to calculate pasture and crop eaten per cow. A sum of the crops grown and consumed by dairy cows from the National Statistical Approach discussed in the next section was used to split pasture and crop eaten volumes. This process is shown in Figure 4 and was also carried out on a per hectare basis. Figure 4: Pasture eaten calculation As a sensibility check, FCE calculated in the Feed Demand Approach was compared to the FCE values derived from each seasonal DairyBase benchmarking report, scaled to milksolids production using the New Zealand Dairy Statistics. This was to assess the suitability of combining the two approaches and to ensure they closely aligned. National Statistical Approach This approach involved the collection of national supplementary feed data from various sources to form a time series of the different non-pasture feed types consumed by dairy cows from to Data for each June ending season was recorded for consistency and for comparison with dairy industry milk production data. The aim of the National Statistical Approach was to utilise data available from external sources so that an overall representation of non-pasture feed use could be obtained for the dairy industry. Data was obtained for three key measures; area sown nationally (hectares), national harvest volume (tonnes) and imported (to New Zealand) quantities (tonnes). Depending on the type of supplementary feed and the data available, one, two or three of these measures were used to estimate its use in the dairy industry. Where no national level data was available, professional or industry estimates for that feed type were sought. Seed sales data and sowing rate were supplied by feed industry professionals such as Pioneer, FAR and PGG Wrightsons, which were used to calculate area sown and was considered the best estimate available for some feed types. 9
13 Where data for area sown could be obtained for a supplementary feed, it was used to estimate national harvest volume by multiplying an expected yield for that feed type. However, if any harvest volume data for the time series of the particular feed was available, this was used. The volume of each supplement type was calculated using a standardised dry matter percentage. It was then determined, based on feedback from knowledgeable feed industry opinions, what proportion of total harvest volume was destined for dairy cows. From this, the actual volume of the feed eaten (tonnes of dry matter) was calculated by multiplying by the average utilisation for that feed. Utilisation is defined as the proportion of the feed which is consumed by dairy cows (excluding young stock) after taking into account the losses associated with the method of feeding, storage and transport of the feed. Utilisation for a given feed can vary depending on the management practices observed on farm. Industry opinions and use of the DairyNZ Facts and Figures publication were consulted in order to determine utilisation for each feed type based the most common method of feeding, storage and transport. A similar procedure was applied for imported supplementary feeds. Import quantities (tonnes) for certain feed types were extracted from Statistics New Zealand. Once import quantity data was collected for a supplementary feed, conversion to dry matter tonnes was applied, if applicable, using the dry matter percentage for that feed type. An assessment was made on what proportion of the total import quantity was destined for dairy cows. From this, the actual volume of the feed eaten (tonnes of dry matter) was calculated by multiplying by the average utilisation. The data collection process required the use of national databases, external reports, industry assessments, feed expert opinions and literature reviews. Together these sources provided a national estimate of the volumes of 17 supplementary feed types consumed by dairy cows. A sum of the crops grown and consumed by dairy cows (feeds grazed in situ or fed by cut and carry methods such as fodder beet, kale, rape, turnips, swedes and other brassicas) was used to split pasture and crop eaten volumes in the Farm Data Approach. This approach was limited by the availability of data, and in many cases values were missing which required subjective techniques to fill these gaps. For instance, where yields could be assumed constant between seasons, area sown and yield for that feed type were used to calculate total volume. Also for feed types derived from other sources, such as brewer s grain, yields of by-product as a proportion of production were considered constant and total production was used as a proxy for determining total volume. In other cases the missing data values for particular seasons were estimated using linear interpolation and discussions with those in the industry. Comparing Approaches The final stage combined the three approaches outlined above, ensuring the results from each approach were consistent with one another. The National Statistical Approach and Feed Demand Approach were considered top-down methods which utilised data available from several external sources such as national databases and publications, external reports, industry assessments, expert opinions and literature reviews. Given the National Statistical Approach was unable to capture all non-pasture feed use on New Zealand dairy farms due to the limited availability of data, this was treated as a rough depiction of the trends in non-pasture feed use over this 25 year period. The Farm Data Approach was considered as a bottom-up method of analysis which utilised robust dairy industry data sources. 10
14 Given the considerable variation in supplementary feed types offered to dairy cows, not all supplementary feed types could be accurately recorded in the National Statistical Approach. Total supplements eaten from the Farm Data Approach was compared to the sum of all individual supplement types (harvested and imported supplements excluding crops) recorded in the National Statistical Approach. Total supplements eaten from the Farm Data Approach are derived from DairyBase benchmark data which was used to calculate adjusted total supplements eaten per cow values, scaled to milksolids production per cow from the New Zealand Dairy Statistics. In DairyBase, supplements are recorded separately while pasture and crop are grouped together thus the sum of the crops grown and consumed by dairy cows from the National Statistical Approach was used to split pasture and crop eaten volumes. Each feed type was placed into one category only, either as crops, harvested supplements and imported supplements based on management practices. Crops grown and consumed by dairy cows (feeds grazed in situ or fed by cut and carry methods such as fodder beet, kale, rape, turnips, swedes and other brassicas) from the National Statistical Approach were used to split pasture and crop eaten in the Farm Data Approach, creating pasture eaten as a residual. In a similar method, supplements eaten from the Farm Data Approach were split into harvested supplements (feeds either grown and harvested on farm or harvested off farm and purchased such as maize grain, maize silage, barley, wheat, oats and cereal whole crop silage) and imported supplements (nonharvested purchased feeds such as PKE, brewer s grain, soyabean meal, cottonseed meal, tapioca and other supplements). The sum of harvested supplements and imported supplements from the National Statistical Approach equalled total supplements eaten derived from the Farm Data Approach as the other supplements category was used to balance the two approaches and encompassed all other non-pasture feed types used on New Zealand dairy farms that could not be individually captured using the National Statistical Approach. Feed Characteristics In addition to the three approaches used to quantify non-pasture feed use on New Zealand dairy farms, data on the most common method of feeding, metabolisable energy, crude protein and nitrogen content for each feed type were gathered. Collecting information regarding the most common method of feeding was done through discussion with industry professionals. This was used as a basis for determining appropriate utilisation percentages for each feed type. Metabolisable energy and crude protein values were also sourced from the DairyNZ Facts and Figures publication for the majority of feed types, although rape, other brassicas and cottonseed meal were unpublished and were therefore omitted from Table 23. Metabolisable energy (ME MJ/kg DM) is a measure of feed quality. It estimates the amount of usable or metabolisable energy (ME) in a given dry weight of feed as megajoules of energy per kilogram of dry matter. The DairyNZ Facts and Figures estimates crude protein as a percentage of dry matter weight from the nitrogen content of the feed (g/kg DM). This is completed by following recognised industry practice and multiplying nitrogen content by In order to obtain nitrogen content for each feed type in this study, crude protein values were used to back calculate nitrogen content (g/kg DM) by following recognised industry practice and dividing crude protein as a percentage of dry matter weight by Assumptions and Limitations In the preparation of this report a number of assumptions were required regarding the robustness and treatment of the data. For the Feed Demand Approach, dairy industry statistics were used to derive national feed demand. Under this approach, two year olds entering the milking herd were excluded on the basis that this report was to focus on mature milking cows and to avoid estimating feed used for liveweight gain relative to milksolids production. The methodology used implies that the energy requirement of liveweight gain by two year olds during their first season wouldn t be captured. Inclusion of two year olds (weighting of 20% of the average herd) did not have a significant impact (a kg decrease observed) on average liveweight across breeds in terms of altering feed demand requirements per cow. It is implicitly assumed under this methodology that culling patterns and the average days in milk have remained constant over this 25 year period. It has been recognised that culling patterns and days in milk would have changed during this time but was considered negligible in terms of calculating national feed demand. It should be noted that because these differences could not be captured under this approach, efficiency gains reflected by improvements in the FCE measures are likely to be overestimated. This report focuses on lactating cows only as 11
15 recorded in the New Zealand Dairy Statistics and so replacement young stock reared to support the industry have been implicitly excluded. For the Farm Data Approach using DairyBase, there are assumptions surrounding how representative the sample for each season is on a national level. DairyBase contains a self-selected sample which comprises only a small proportion of the national dairy herd. Given this, there is assumed to be some bias towards larger, higher producing farms in the sample. Therefore, it may be likely that supplementary feed use is overestimated due to the skew towards higher producing farms which may utilise more non-pasture feeds. To account for this, values were adjusted using data from the New Zealand Dairy Statistics as an index to reduce this bias. This approach used available DairyBase benchmarking reports from to to determine supplements (t DM/cow) and to compare FCE (kg MS/t DM) with that from the Feed Demand Approach. Seasons prior to were not available as DairyBase was not yet operating, so supplements were estimated using linear extrapolation with guidance from industry experts, however these should be considered as estimates only. Another limitation of the Farm Data Approach is the aggregation of pasture and crop values recorded in DairyBase. Therefore, crop data sourced from the National Statistical Approach was considered the best method to split pasture and crop eaten for this project. The volume of crops eaten will impact on the amount of pasture eaten, i.e. if the volume of crops are overestimated then the volume of pasture eaten will be underestimated, and vice versa. For the National Statistical Approach, annual data was collected on a June year basis from a wide range of sources which can lead to consistency issues. The approach required the area of some particular feed types to be converted to total volumes through yield calculations and volumes of some particular feeds to be converted to dry matter tonnes using standard percentages. As estimated yields for each feed type were greatly unknown, industry expert opinion and literature reviews were consulted to approximate appropriate yields (t/ha). This is susceptible to error depending on the source and feed type but is expected to be reasonable at an aggregate level. Dry matter percentages for each feed type were gathered from the DairyNZ Facts and Figures publication and were considered as the best available information. However, as some sources did not specify whether the data was recorded in tonnes wet weight or tonnes dry matter, a judgement by the authors was required. In addition, the volume of feed, in dry matter tonnes, was apportioned to the estimated amount fed to dairy cows. This was an attempt to exclude the volume fed to livestock other than dairy. The proportion of the feed type consumed by dairy cows was determined by industry expert opinions which were considered as a guide. Wastage was also taken into consideration with utilisation of each feed determined by the most common method of feeding, storage and transport based on industry opinions and sourced from the DairyNZ Facts and Figures publication. However, as there is considerable variation in the methods of feeding particular supplement types across New Zealand dairy farms, the utilisation percentages used in this paper are considered as estimates. Considering this procedure, there are likely to be some inaccuracies in each of the assumptions, which combined could be significant. More time and effort was devoted to the larger nonpasture feed types such as PKE, maize silage and fodder beet. This report aims to give a comprehensive overview of non-pasture feed consumed by dairy cows from to but given the lack of supplementary feed data, required estimating some values using linear extrapolated based on available data points and discussion with industry experts was required. Although this was considered the best solution and uses the best available data, estimates may not truly reflect the actual number. Results The results show that during this period there was an increasing trend in non-pasture feed use. In particular, the volumes of PKE use on New Zealand dairy farms have increased considerably over the last decade. Maize silage volumes have increased steadily while the emergence of fodder beet crops has seen a rapid rise in areas grown with less than 500 hectares in increasing to approximately 50,000 hectares grown in These three feeds are the most common accounting for 71.3 per cent of the estimated total supplementary feed consumed by New Zealand dairy cows in Figures 5, 6, 7 and 8 show the change in the volumes and proportion of the different non-pasture feed types from to
16 Feed Demand Approach The Feed Demand Approach calculated seasonal feed demand requirements based on published industry values from the New Zealand Dairy Statistics. Feed requirements (t DM/year) increased as milksolids production per cow increased 55 per cent (4.7 kilograms milksolids per cow per year) over the 25 year period. The amount of feed (kg DM) required to produce each kilogram of milksolids has decreased over time, illustrating an increase in efficiency. Weighted average liveweight values calculated from New Zealand Dairy Statistics for seasons to did not show a significant change in trend during this period despite cows being fed more. This reflects the change in national breeds towards lighter crossbred cows. In nearly half (46%) the cows in New Zealand were Holstein-Friesian / Jersey crossbred, with 35 per cent Holstein-Friesians and 10 per cent Jersey. This compares with 18 per cent Holstein-Friesian / Jersey crossbred, 57 per cent Holstein-Friesians and 16 per cent Jersey breeds in the mid-1990s. Milksolids production per cow as a per centage of liveweight shows an increasing trend reflecting constant liveweight but increasing milksolids production per cow over this period. As liveweight did not change considerably from to , the average over this period (470 kg) was used for seasons prior to as an estimate. This is shown in Figure 5 below. Adjusting liveweight values up or down by 10 kg prior to had little impact on the derived feed demand on a per cow, per hectare and total basis, so the estimate of 470 kg for these seasons was considered satisfactory. Figures 6 and 7 below show the close relationship between milksolids production per cow and required feed demand per cow given the relatively constant average liveweight values over this period. Figure 5: Average cow liveweight from to Source: New Zealand Dairy Statistics, DairyNZ Economics Group 13
17 Figure 6: Average milksolids production per cow from to Source: New Zealand Dairy Statistics Figure 7: Required feed demand per cow from to , 4 Source: New Zealand Dairy Statistics, DairyNZ Economics Group Table 2 provides a summary of the findings from the Feed Demand Approach for seasons to It shows the growth in national feed demand from 9,460,125 t DM/year in to 24,725,673 in as milksolids production per cow, stocking rate and effective hectares have all increased significantly over this period with liveweight remaining constant. Figure 7 above shows the trend in feed demand requirements per cow from Over the last 25 years the volume of feed consumed has increased approximately 1.0 tonne per cow. On a per hectare basis, the increase was approximately 4.9 tonnes to 14.2 tonnes per hectare. 14
18 Table 2: Feed Demand Approach Summary 1, 4 Season Cow numbers Effective area (hectares) Stocking Rate (cows/ha) Total Milksolids (kg) MS/cow MS/ha Liveweight (kg) Feed Demand (t DM/cow/year) Feed Demand (t DM/ha/year) Feed Demand (t DM/year) FCE (kg DM/ kg MS) ,402,145 1,023, ,431, ,460, ,438,641 1,024, ,577, ,605, ,603,049 1,069, ,414, ,623, ,736,452 1,122, ,054, ,558, ,830,977 1,175, ,502, ,703, ,935,759 1,208, ,642, ,329, ,064,523 1,267, ,962, ,513, ,222,591 1,276, ,612, ,899, ,289,319 1,306, ,886, ,571, ,269,362 1,292, ,814, ,311, ,485,883 1,329, ,096,267, ,710, ,692,703 1,404, ,152,471, ,506, ,740,637 1,463, ,190,758, ,972, ,851,302 1,421, ,253,689, ,672, ,867,659 1,411, ,212,682, ,349, ,832,145 1,398, ,267,438, ,669, ,916,812 1,412, ,316,302, ,058, ,012,867 1,436, ,269,777, ,047, ,252,881 1,519, ,397,798, ,414, ,396,675 1,563, ,438,499, ,288, ,528,736 1,638, ,513,177, ,060,
19 ,634,226 1,638, ,684,884, , ,657, ,784,250 1,677, ,657,722, ,621, ,922,806 1,716, ,824,971, , ,197, ,018,333 1,746, ,889,885, , ,725, Source: New Zealand Dairy Statistics, DairyNZ Economics Group 16
20 Farm Data Approach DairyBase benchmarking reports were used to compute adjusted supplements eaten per hectare values for the seasons to with milksolids production per hectare from the New Zealand Dairy Statistics used as an index to reduce production bias. For seasons prior to , supplements (t DM/ha) were estimated using linear interpolation with guidance from industry professionals. Using feed demand (t DM/cow) from the Feed Demand Approach, adjusted supplements (t DM/cow) and an estimation of crop eaten (t DM/cow) using the National Statistical Approach, pasture eaten (t DM/cow) was created as a residual. This methodology showed increasing supplement use as well as a steady increase in total feed eaten and pasture (calculated as a residual) eaten over time, in line with expectations. Supplements and crop eaten as a percentage of total feed increased significantly over this period from 4 per cent in to 18 per cent in Figure 8 shows the percentage split between pasture and total supplements including crops over this 25 year period. It is implicit under this approach that feed substitution between pasture and supplements including crops occurs, as supplements and crops increase, the remaining dry matter intake required for the level of milksolids production comes from pasture which is calculated as a residual. FCE (kg MS/ t DM) was calculated by dividing milksolids production per hectare by feed demand per hectare from the Feed Demand Approach and compared to the FCE values derived from each seasonal DairyBase benchmarking report, scaled to milksolids production using the New Zealand Dairy Statistics. This was to assess the suitability of combining the two approaches and to ensure they closely aligned. In Tables 3 and 4 FCE from the two approaches are given and show a high level of similarity. Table 3 provides a summary of the Farm Data Approach on a per cow basis for seasons to This summary was also derived on a per hectare basis and is shown in Table 4.
21 17
22 Figure 8: Percentage spilt between pasture eaten and non-pasture feed (crops, harvested supplements and imported supplements) eaten 100 % 90 % 80 % 70 % 60 % 50 % Pasture 40 % 30 % Crops, harvested supplements and imported supplements 20 % 10 % 0 % Source: DairyNZ Economics Group 19
23 Table 3: Per cow summary using the Farm Data Approach 6 Season Total Feed Demand (t DM/cow) Pasture (t DM/cow) Crop (t DM/cow) Harvested Supplements (t DM/cow) Imported Supplements (t DM/cow) Total Supplements & Crop (t DM/cow) Supplements & Crop % of Feed Demand FCE (kg MS/ t DM) DairyBase FCE (kg MS/ t DM) % % % % % % % % % % % % % % % DairyBase Benchmarking Reports, to
24 % % % % % % % % % % Table 4: Per hectare summary using the Farm Data Approach 6 Season Total Feed Demand (t DM/ha) Pasture (t DM/ha) Crop (t DM/ha) Harvested Supplements (t DM/ha) Imported Supplements (t DM/ha) Total Supplements & Crop (t DM/ha) Supplements & Crop % of Feed Demand FCE (kg MS/ t DM) DairyBase FCE (kg MS/ t DM) % % % % % % % %
25 % % % % % % % % % % % % % % % % %
26 National Statistical Approach This approach involved the collection of national supplementary feed data as a time series from to Data was obtained for three key measures; area sown nationally (hectares), national harvest volume (tonnes) and import quantity (tonnes). The data collection process required the use of national databases, external reports, industry assessments, expert opinions and literature reviews. Together these sources provided a national estimate of non-pasture feed use for the New Zealand dairy industry. The most common types of non-pasture feeds are reviewed in this section, illustrating their use over the last 25 years. Of the 17 supplementary feed types included in this report, PKE, maize silage and fodder beet have emerged as the most prolific non-pasture feed types. For PKE, import volumes started to pick up in the mid2000s as it provided farmers with a cheap, easy to manage feed source to sustain lactation during the shoulders of the season or during dry periods as well as increasing milksolids production in seasons with higher milk price. Maize silage increased in use from the early to mid-2000s and has fluctuated around this level since. Maize silage is typically fed in autumn to improve body condition near the end of the season but also provides farmers with a cheap, easily stored feed that can be used throughout the season. In recent years, fodder beet has become a key supplement used by the dairy industry as a feed for cows both over winter and increasingly during lactation. Fodder beet use in New Zealand has increased significantly in the last five years as it is capable of high yields relative to other crops, which reduces cost per kilogram of dry matter. 23
27 Palm Kernel Extract (PKE) In the early 1990s PKE was not a common supplementary feed for dairy cows. However, over the last 25 year period import volumes have increased significantly making PKE the most common feed supplement for dairy cows in Table 5 shows the use of PKE as a supplementary feed from to after taking into account dry matter percentage, utilisation and the estimated proportion destined for the dairy industry. Table 5: Total PKE eaten by dairy cows from to Season Volume Imported (t) Dry Matter % % used for Dairy Utilisation % Feed Eaten by Dairy Cows (t DM) % 95% 80% % 95% 80% % 95% 80% % 95% 80% % 95% 80% % 95% 80% % 95% 80% % 95% 80% % 95% 80% % 95% 80% ,232 90% 95% 80% 2, ,730 90% 95% 82% 17, ,573 90% 95% 82% 22, ,425 90% 95% 84% 39, ,029 90% 95% 85% 91, ,374 90% 95% 85% 163, ,469 90% 95% 86% 267, ,259 90% 95% 88% 608, ,572 90% 95% 90% 703, ,888 90% 95% 90% 767, ,413,867 90% 95% 90% 1,087, ,411,524 90% 95% 90% 1,086, ,464,219 90% 94% 90% 1,114, ,890,569 90% 93% 90% 1,424, ,949,526 90% 92% 90% 1,452,787 Maize Grain Maize grain used as a supplementary feed for dairy cows has been reasonably static over the last two and a half decades, fluctuating between 40,000 to 50,000 tonnes DM per season. Table 6 shows the use of maize grain as 7 Statistics NZ Infoshare, Harmonised Trade- Imports. Oil-cake and other solid residues; whether or not ground or in the form of pellets, resulting from the extraction of cotton seed oils ( Annual-June). 24
28 a supplementary feed from to after taking into account utilisation and the estimated proportion destined for the dairy industry. Table 6: Total maize grain eaten by dairy cows from to , 9, 10, 11 Season Area Sown (hectares) Yield (tonnes per hectare) Total Volume (t DM) % used for Dairy Utilisation % Feed Eaten by Dairy Cows (t DM) , ,388 25% 95% 43, , ,842 25% 95% 38, , ,100 25% 95% 31, , ,800 25% 95% 33, , ,797 25% 95% 38, , ,700 25% 95% 49, , ,000 25% 95% 46, , ,000 25% 95% 41, , ,000 25% 95% 46, , ,000 25% 95% 42, , ,800 25% 95% 41, , ,847 25% 95% 35, , ,685 25% 95% 50, , ,248 25% 95% 55, , ,253 25% 95% 49, , ,649 25% 95% 51, , ,627 25% 95% 44, , ,557 25% 95% 48, , ,844 25% 95% 56, , ,812 25% 95% 44, , ,200 25% 95% 49, , ,200 25% 95% 50, , ,700 25% 95% 47, , ,200 25% 95% 56, , ,300 25% 95% 53,746 Maize Silage Maize silage has seen considerable increases since the early 1990s, rising from around 4,000 hectares in to 70,000 hectares in A large proportion is used as feed for dairy cows, with just over 1,200,000 tonnes dry matter eaten in Table 7 shows the use of maize silage as a supplementary feed from to after taking into account utilisation and the estimated proportion destined for the dairy industry. 8 Brooker, W.J. (2009). Production, distribution and utilisation of maize. 9 Agricultural Production Statistics (June 2015P). Table 8 Grain Crops Statistics NZ 10 Statistics NZ Infoshare, Agriculture. Area Sown and Total Yield ( Annual-June). 11 AIMI Maize Reports, 2012 to
29 Table 7: Total maize silage eaten by dairy cows from to , 11,12 Season Area Sown (hectares) Yield (tonnes per hectare) Total Volume (t DM) % used for Dairy Utilisation % Feed Eaten by Dairy Cows (t DM) , ,040 98% 70% 52, , ,040 98% 70% 52, , ,040 98% 70% 52, , ,030 98% 70% 39, , ,060 98% 70% 78, , ,247 98% 70% 100, , ,950 98% 70% 92, , ,177 98% 70% 129, , ,898 98% 70% 194, , ,541 98% 70% 232, , ,138 98% 70% 279, , ,320 98% 70% 327, , ,978 98% 70% 396, , ,818 98% 70% 504, , ,105 98% 71% 556, , ,829 98% 72% 611, , ,199,188 98% 73% 857, , ,536,296 98% 74% 1,114, , ,424,260 98% 75% 1,046, , ,071,967 98% 76% 798, , ,042,546 98% 78% 796, , ,043,358 98% 80% 817, , ,191,697 98% 82% 957, , ,507,522 98% 84% 1,240, , ,539,721 97% 85% 1,269,500 Barley The areas sown of barley has been reasonably constant over the last 25 years, but the proportion to dairy cows is thought to have increased which has seen barley use increase in line with cow numbers and growth of dairying in the South Island during this time. Table 8 shows the use of barley as a supplementary feed from to after taking into account dry matter percentage, utilisation and the estimated proportion destined for the dairy industry. Table 8: Total barley eaten by dairy cows from to , 10 Area Sown Yield (tonnes per Total Dry % used for Utilisation Feed Eaten by Dairy Season (hectares) hectare) Volume (t) Matter % Dairy % Cows (t DM) , ,043 87% 16% 90% 47, Yield data obtained via Pioneer personal contact 26
30 , ,787 87% 17% 90% 42, , ,523 87% 18% 90% 54, , ,476 87% 19% 90% 58, , ,804 87% 20% 90% 47, , ,181 87% 21% 90% 60, , ,000 87% 22% 90% 55, , ,000 87% 23% 90% 58, , ,960 87% 24% 90% 52, , ,000 87% 25% 90% 63, , ,000 87% 26% 90% 66, , ,883 87% 27% 91% 94, , ,837 87% 28% 92% 83, , ,082 87% 29% 93% 53, , ,023 87% 30% 94% 74, , ,020 87% 31% 95% 70, , ,627 87% 32% 95% 88, , ,730 87% 33% 95% 111, , ,270 87% 34% 95% 122, , ,298 87% 35% 95% 89, , ,958 87% 36% 95% 109, , ,789 87% 37% 95% 134, , ,478 87% 38% 95% 130, , ,747 87% 39% 95% 130, , ,100 87% 40% 95% 144,505 Wheat The volume of wheat eaten by dairy cows has increased over the last 25 years, but is only a small proportion of the total harvest of wheat grown in New Zealand with other uses including food manufacturing and other livestock feeds. Table 9 shows the use of wheat as a supplementary feed from to after taking into account dry matter percentage, utilisation and the estimated proportion destined for the dairy industry. Table 9: Total wheat eaten by dairy cows from to , 10 Area Sown Yield (tonnes per Dry Matter % used Utilisation Feed Eaten by Dairy Season (hectares) hectare) Total Volume (t) % for Dairy % Cows (t DM) , ,690 88% 10% 90% 14, , ,039 88% 10% 90% 15, , ,414 88% 10% 90% 17, , ,853 88% 10% 90% 19, , ,173 88% 10% 90% 19, , ,014 88% 10% 90% 21, , ,500 88% 10% 90% 23,166 27
31 , ,500 88% 10% 90% 23, , ,181 88% 10% 90% 27, , ,500 88% 10% 90% 23, , ,500 88% 10% 90% 23, , ,499 88% 10% 91% 24, , ,916 88% 10% 92% 25, , ,860 88% 10% 93% 20, , ,947 88% 10% 94% 26, , ,798 88% 10% 95% 21, , ,434 88% 10% 95% 28, , ,350 88% 10% 95% 28, , ,463 88% 10% 95% 33, , ,890 88% 11% 95% 40, , ,262 88% 12% 95% 38, , ,614 88% 13% 95% 53, , ,799 88% 14% 95% 52, , ,497 88% 15% 95% 51, , ,500 88% 16% 95% 55,310 Oats The volume of oats eaten by dairy cows is small and has been reasonably constant over the last 25 years. Table 10 shows the use of oats as a supplementary feed from to after taking into account dry matter percentage, utilisation and the estimated proportion destined for the dairy industry. Table 10: Total oats eaten by dairy cows from to , 10 Season Area Sown (hectares) Yield (tonnes per hectare) Total Volume (t) Dry Matter % % used for Dairy Utilisation % Feed Eaten by Dairy Cows (t DM) , ,187 89% 10% 85% 4, , ,625 89% 10% 85% 4, , ,793 89% 10% 85% 4, , ,718 89% 10% 85% 4, , ,735 89% 10% 85% 2, , ,217 89% 10% 85% 3, , ,000 89% 10% 85% 3, , ,000 89% 10% 85% 3, , ,716 89% 10% 85% 3, , ,000 89% 10% 85% 2, , ,000 89% 10% 85% 2, , ,986 89% 10% 85% 2, , ,934 89% 10% 85% 2, , ,844 89% 10% 85% 2, , ,714 89% 10% 85% 2,172 28
32 , ,478 89% 10% 85% 2, , ,531 89% 10% 85% 2, , ,463 89% 10% 85% 1, , ,703 89% 10% 85% 2, , ,608 89% 10% 85% 3, , ,466 89% 10% 85% 2, , ,118 89% 10% 85% 1, , ,225 89% 10% 85% 2, , ,741 89% 10% 85% 2, , ,569 89% 10% 85% 2,539 Cereal Whole Crop Silage The number of hectares grown for cereal whole crop silage increased from early the 1990s to the early 2000s where the estimated peak was approximately 50,000 hectares. Since the mid-2000s, area sown for cereal whole crop silage has declined to levels less than in the early 1990s. Cereal whole crop silage eaten by dairy cows followed a similar trend with peak consumption occurring in with 120,000 t DM. Following this, levels declined, but not to levels below that of the early 1990s as a greater proportion of cereal whole crop silage was used as supplementary feed for dairy cows during this period. Table 11 shows the use of cereal whole crop silage as a supplementary feed from to after taking into account dry matter percentage, utilisation and the estimated proportion destined for the dairy industry. Table 11: Total cereal whole crop silage eaten by dairy cows from to Area Sown Yield (tonnes per Dry % used Utilisation Feed Eaten by Dairy Season (hectares) hectare) Total Volume (t) Matter % for Dairy % Cows (t DM) , ,000 35% 60% 80% 40, , ,000 35% 60% 80% 40, , ,000 35% 60% 80% 40, , ,000 35% 60% 80% 40, , ,000 35% 60% 80% 40, , ,000 35% 60% 80% 60, , ,000 35% 60% 80% 60, , ,000 35% 60% 80% 60, , ,000 35% 60% 80% 60, , ,000 35% 60% 80% 80, , ,000 35% 70% 80% 117, , ,000 35% 70% 80% 117, , ,000 35% 70% 80% 117, , ,000 35% 70% 80% 117, , ,000 35% 70% 80% 117, , ,000 35% 70% 80% 117, , ,600 35% 80% 80% 120, Plant & Food Research personal communication using Agricom data 29
33 , ,000 35% 80% 80% 107, , ,000 35% 80% 80% 80, , ,240 35% 80% 80% 47, , ,000 35% 80% 80% 40, , ,000 35% 80% 80% 40, , ,000 35% 80% 80% 40, , ,000 35% 80% 80% 40, , ,000 35% 80% 80% 40,320 Fodder Beet The volume of fodder beet eaten by dairy cows has increased considerably in recent years, particularly due to increased use in the South Island. Table 12 shows the use of fodder beet as a supplementary feed from to after taking into account utilisation and the estimated proportion destined for the dairy industry. Table 12: Total fodder beet eaten by dairy cows from to , 15, 16, 17 Area Sown Yield (tonnes per Total Volume (t % used for Utilisation Feed Eaten by Dairy Cows (t Season (hectares) hectare) DM) Dairy % DM) % 95% % 95% % 95% % 95% % 95% % 95% % 95% % 95% % 95% % 95% % 95% ,800 75% 95% 1, ,800 75% 95% 1, ,800 75% 95% 1, ,800 75% 95% 1, ,800 75% 95% 1, ,800 75% 95% 1, ,500 90% 95% 8, , ,000 90% 95% 17, , ,500 90% 95% 44, , ,000 90% 95% 89, Gibbs, J., Saldias, B. & Trotter, C. (n.d.) Feeding Fodder beet in lactation and to replacement heifers. 15 Matthew, C., Nelson, N.J., Ferguson, D. & Xie, Y. (2011). Fodder beet revisited. 16 FAR personal contact, supplementary crops data 17 Yield data obtained via personal contact at Lincoln University 30
34 , ,000 80% 95% 159, , ,000 80% 95% 319, , ,000 75% 95% 673, , ,050,000 70% 95% 698,250 Kale The volume of kale eaten by dairy cows has increased steadily over the last 25 years. Table 13 shows the use of kale as a supplementary feed from to after taking into account dry matter percentage, utilisation and the estimated proportion destined for the dairy industry. Table 13: Total kale eaten by dairy cows from to Season Area Sown (hectares) Yield (tonnes per hectare) Total Volume (t) Dry Matter % % used for Dairy Utilisation % Feed Eaten by Dairy Cows (t DM) , ,027,500 13% 40% 85% 45, , ,050,000 13% 41% 85% 46, , ,072,500 13% 41% 85% 48, , ,095,000 13% 42% 85% 50, , ,117,500 13% 42% 85% 51, , ,140,000 13% 43% 85% 53, , ,162,500 13% 43% 85% 55, , ,185,000 13% 44% 85% 56, , ,207,500 13% 44% 85% 58, , ,230,000 13% 45% 85% 60, , ,252,500 13% 45% 85% 62, , ,275,000 13% 46% 85% 64, , ,297,500 13% 46% 85% 65, , ,320,000 13% 47% 85% 67, , ,342,500 13% 47% 85% 69, , ,365,000 13% 47% 85% 70, , ,387,500 13% 47% 85% 72, , ,410,000 13% 47% 85% 73, , ,432,500 13% 48% 85% 75, , ,455,000 13% 48% 85% 76, , ,477,500 13% 48% 85% 78, , ,500,000 13% 48% 85% 79, , ,875,000 13% 48% 85% 100, , ,250,000 13% 49% 85% 120, , ,250,000 13% 49% 85% 121,080 31
35 Rape The volume of rape eaten by dairy cows is small but has increased steadily over the last 25 years. Table 14 shows the use of rape as a supplementary feed from to after taking into account dry matter percentage, utilisation and the estimated proportion destined for the dairy industry. Table 14: Total Rape eaten by dairy cows from to Season Area Sown (hectares) Yield (tonnes per hectare) Total Volume (t) Dry Matter % % used for Dairy Utilisation % Feed Eaten by Dairy Cows (t DM) , ,000 15% 10% 80% 2, , ,000 15% 10% 80% 3, , ,000 15% 10% 80% 3, , ,000 15% 10% 80% 3, , ,000 15% 10% 80% 3, , ,000 15% 10% 80% 4, , ,000 15% 10% 80% 4, , ,000 15% 10% 80% 4, , ,000 15% 10% 80% 4, , ,000 15% 10% 80% 5, , ,000 15% 10% 80% 5, , ,000 15% 10% 80% 5, , ,000 15% 10% 80% 5, , ,000 15% 10% 80% 5, , ,000 15% 10% 80% 5, , ,000 15% 10% 80% 6, , ,000 15% 10% 80% 6, , ,000 15% 10% 80% 6, , ,000 15% 10% 80% 6, , ,000 15% 10% 80% 6, , ,000 15% 10% 80% 6, , ,000 15% 10% 80% 7, , ,000 15% 10% 80% 8, , ,000 15% 10% 80% 10, , ,000 15% 10% 80% 10,920 Turnips The volume of turnips eaten by dairy cows has been reasonably steady over the last 25 years. Table 15 shows the use of turnips as a supplementary feed from to after taking into account dry matter percentage, utilisation and the estimated proportion destined for the dairy industry. Table 15: Total turnips eaten by dairy cows from to Season Area Sown (hectares) Yield (tonnes per hectare) Total Volume (t) Dry Matter % % used for Dairy Utilisation % Feed Eaten by Dairy Cows (t DM) 18 PGG Wrightson personal communication, seed data 32
36 , ,000 10% 40% 85% 16, , ,000 10% 40% 85% 16, , ,000 10% 40% 85% 16, , ,000 10% 40% 85% 16, , ,000 10% 40% 85% 16, , ,000 10% 40% 85% 16, , ,000 10% 40% 85% 16, , ,000 10% 40% 85% 16, , ,000 10% 40% 85% 16, , ,000 10% 40% 85% 16, , ,000 10% 40% 85% 16, , ,000 10% 40% 85% 17, , ,000 10% 40% 85% 17, , ,000 10% 40% 85% 17, , ,000 10% 40% 85% 17, , ,000 10% 40% 85% 17, , ,000 10% 40% 85% 17, , ,000 10% 40% 85% 18, , ,000 10% 40% 85% 18, , ,000 10% 40% 85% 18, , ,000 10% 40% 85% 18, , ,000 10% 40% 85% 19, , ,000 10% 40% 85% 19, , ,000 10% 40% 85% 22, , ,000 10% 40% 85% 20,400 Swedes The volumes of swedes eaten by dairy cows has increased over the last 25 years as a larger proportion of national harvest volumes are thought to have gone to dairy, although volumes eaten declined in due to animal health issues. Table 16 shows the use of swedes as a supplementary feed from to after taking into account dry matter percentage, utilisation and the estimated proportion destined for the dairy industry. Table 16: Total swedes eaten by dairy cows from to Season Area Sown (hectares) Yield (tonnes per hectare) Total Volume (t) Dry Matter % % used for Dairy Utilisation % Feed Eaten by Dairy Cows (t DM) , ,400,000 11% 13% 80% 15, , ,400,000 11% 15% 80% 17, , ,400,000 11% 17% 80% 20, , ,400,000 11% 19% 80% 22, , ,400,000 11% 21% 80% 25, , ,400,000 11% 23% 80% 27,720 33
37 , ,400,000 11% 25% 80% 30, , ,400,000 11% 26% 80% 32, , ,400,000 11% 28% 80% 33, , ,400,000 11% 29% 80% 35, , ,400,000 11% 31% 80% 37, , ,400,000 11% 32% 80% 39, , ,400,000 11% 34% 80% 41, , ,400,000 11% 35% 80% 43, , ,400,000 11% 37% 80% 44, , ,400,000 11% 38% 80% 46, , ,400,000 11% 40% 80% 48, , ,414,000 11% 41% 80% 51, , ,442,000 11% 43% 80% 53, , ,470,000 11% 44% 80% 56, , ,498,000 11% 46% 80% 59, , ,526,000 11% 47% 80% 63, , ,554,000 11% 49% 80% 66, , ,750,000 11% 50% 80% 77, , ,302,000 11% 40% 80% 45,830 Other Brassicas The volume of other brassicas eaten by dairy cows is small but has increased considerably over the last 25 years. Table 17 shows the use of other brassicas as a supplementary feed from to after taking into account dry matter percentage, utilisation and the estimated proportion destined for the dairy industry. Table 17: Total other brassicas eaten by dairy cows from to Season Area Sown (hectares) Yield (tonnes per hectare) Total Volume (t) Dry Matter % % used for Dairy Utilisation % Feed Eaten by Dairy Cows (t DM) , ,000 15% 10% 80% 3, , ,000 15% 10% 80% 4, , ,000 15% 10% 80% 4, , ,000 15% 10% 80% 5, , ,000 15% 10% 80% 6, , ,000 15% 10% 80% 6, , ,000 15% 10% 80% 7, , ,000 15% 10% 80% 7, , ,000 15% 10% 80% 8, , ,000 15% 10% 80% 8, , ,000 15% 10% 80% 9, , ,000 15% 10% 80% 9, , ,000 15% 10% 80% 10,080 34
38 , ,000 15% 10% 80% 10, , ,000 15% 10% 80% 10, , ,000 15% 10% 80% 10, , ,000 15% 10% 80% 11, , ,000 15% 10% 80% 11, , ,000 15% 10% 80% 11, , ,008,000 15% 10% 80% 12, , ,032,000 15% 10% 80% 12, , ,056,000 15% 10% 80% 12, , ,080,000 15% 10% 80% 12, , ,104,000 15% 10% 80% 13, , ,080,000 15% 10% 80% 12,960 Brewer s Grain The volume of brewer s grain eaten by dairy cows has been reasonably constant over the last 25 years, following beer production which has been steady. Table 18 shows the use of brewer s grain as a supplementary feed from to after taking into account dry matter percentage, utilisation and the estimated proportion destined for the dairy industry. Table 18: Total brewer s grain eaten by dairy cows from to Season Volume (t) Dry Matter % % used for Dairy Utilisation % Feed Eaten by Dairy Cows (t DM) ,500 23% 75% 90% 5, ,500 23% 75% 90% 5, ,500 23% 75% 90% 5, ,500 23% 75% 90% 5, ,500 23% 75% 90% 5, ,500 23% 75% 90% 5, ,536 23% 75% 90% 5, ,515 23% 75% 90% 5, ,671 23% 75% 90% 5, ,506 23% 75% 90% 4, ,582 23% 75% 90% 4, ,419 23% 75% 90% 5, ,315 23% 75% 90% 5, ,256 23% 75% 90% 5, ,563 23% 75% 90% 5, ,906 23% 75% 90% 4, ,186 23% 75% 90% 4, James and Son personal communication, volumes supplied data 35
39 ,246 23% 75% 90% 5, ,565 23% 75% 90% 4, ,861 23% 75% 90% 4, ,907 23% 75% 90% 4, ,859 23% 75% 90% 4, ,774 23% 75% 90% 4, ,000 23% 75% 90% 4, ,000 23% 75% 90% 4,502 Tapioca The volume of tapioca eaten by dairy cows is small but has increased over the last 25 years with its use in blended feeds also comprising PKE. Table 19 shows the use of tapioca as a supplementary feed from to after taking into account dry matter percentage, utilisation and the estimated proportion destined for the dairy industry. Table 19: Total tapioca eaten by dairy cows from to Season Volume Imported (t) Dry Matter % % used for Dairy Utilisation % Feed Eaten by Dairy Cows (t DM) % 10% 95% % 10% 95% % 10% 95% % 10% 95% % 10% 95% % 10% 95% % 10% 95% % 10% 95% % 12% 95% % 14% 95% % 16% 95% % 18% 95% % 20% 95% % 30% 95% ,220 88% 50% 95% ,406 88% 55% 95% 1, ,510 88% 60% 95% 1, ,797 88% 90% 95% 8, ,236 88% 60% 95% 1, Statistics NZ Infoshare, Harmonised Trade- Imports. Food preparations; tapioca and substitutes therefor, prepared from starch, in the form of flakes, grains, pearls, siftings or similar ( Annual-June). 36
40 ,675 88% 65% 95% 2, ,425 88% 70% 95% 3, ,950 88% 75% 95% 2, ,720 88% 80% 95% 2, ,813 88% 80% 95% 4, ,449 88% 80% 95% 2,307 Soyabean Meal The volume of soyabean meal eaten by dairy cows is small relative to other supplement types but showed a reasonable increase during the mid-2000s and remained at this level since. Table 20 shows the use of soyabean meal as a supplementary feed from to after taking into account dry matter percentage, utilisation and the estimated proportion destined for the dairy industry. Table 20: Total soyabean meal eaten by dairy cows from to Season Volume Imported (t) Dry Matter % % used for Dairy Utilisation % Feed Eaten by Dairy Cows (t DM) ,722 90% 10% 95% ,259 90% 10% 95% ,930 90% 10% 95% 1, ,002 90% 10% 95% ,164 90% 10% 95% 1, % 10% 95% ,329 90% 10% 95% ,077 90% 10% 95% 4, ,664 90% 10% 95% 2, ,107 90% 10% 95% 4, ,567 90% 10% 95% 3, ,340 90% 10% 95% 5, ,277 90% 10% 95% 5, ,349 90% 10% 95% 6, ,066 90% 10% 95% 5, ,709 90% 10% 95% 9, ,360 90% 10% 95% 3, ,782 90% 10% 95% 11, ,994 90% 10% 95% 12, ,740 90% 10% 95% 7, ,904 90% 10% 95% 10, Statistics NZ Infoshare, Harmonised Trade- Imports. Oil-cake and other solid residues; whether or not ground or in the form of pellets, resulting from the extraction of soya-bean oil ( Annual-June). 37
41 ,858 90% 10% 95% 11, ,100 90% 10% 95% 11, ,844 90% 10% 95% 16, ,256 90% 10% 95% 18,746 Cottonseed The volume of cottonseed eaten by dairy cows is also small, with quantities increasing to more significant levels from Table 21 shows the use of cottonseed as a supplementary feed from to after taking into account dry matter percentage, utilisation and the estimated proportion destined for the dairy industry. Table 21: Total cottonseed eaten by dairy cows from to Season Volume Imported (t) Dry Matter % % used for Dairy Utilisation % Feed Eaten by Dairy Cows (t DM) % 95% 90% % 95% 90% % 95% 90% % 95% 90% % 95% 90% % 95% 90% % 95% 90% % 95% 90% % 95% 90% % 95% 90% % 95% 90% ,136 80% 95% 90% % 95% 90% % 95% 90% % 95% 90% % 95% 90% % 95% 90% % 95% 90% % 95% 90% % 95% 90% ,145 80% 95% 90% 9, ,321 80% 95% 90% 9, ,557 80% 95% 90% 19, Statistics NZ Infoshare, Harmonised Trade- Imports. Oil-cake and other solid residues; whether or not ground or in the form of pellets, resulting from the extraction of cotton seed oils ( Annual-June). 38
42 ,347 80% 95% 90% 15, ,296 80% 95% 90% 13,199 Other Supplements Given the considerable variation in supplementary feed types offered to dairy cows, not all non-pasture feed types could be accurately recorded in the National Statistical Approach. Total supplements eaten derived in the Farm Data Approach (harvested and imported as shown in Table 3) using DairyBase benchmarking reports was compared to the sum of all individual supplement types (excluding crops) recorded in the National Statistical Approach. Total supplements eaten from the Farm Data Approach exceeded the sum of all individual supplements types (excluding crops) recorded in the National Statistical Approach, with the difference attributable to those feed types not captured in the National Statistical Approach. The difference was termed other supplements. Table 22 below compares total supplements (harvested and imported) eaten from the Farm Data Approach to the sum of all individual supplement types (excluding crops) recorded in the National Statistical Approach to give other supplements. Supplementary feeds that have not been captured and comprise other supplements include molasses, proliq, imported grains, fishmeal, horticultural by-products such as vegetables and fruit and any other feed type fed to dairy cows. Table 22: Other supplements derived as a residual from to Season Total Supplements Eaten t DM (Farm Data Approach) Total Supplements (excluding Crops) t DM (National Statistical Approach) Other Supplements t DM , , , , , , , , , , , , , , , , , , , , , , , , , , , , , , , , , ,008, , , ,069, , , ,151, , , ,206, , , ,245,447 1,054, , ,416,411 1,419, , ,325,789 2,046, , ,105,419 2,065, , ,032,544 1,806, ,216 39
43 ,638,317 2,154, , ,851,070 2,210, , ,153,503 2,384, , ,535,916 2,987, , ,544,697 3,057, ,235 Source: DairyNZ Economics Group Total Supplements from National Statistical Approach Total feed eaten by supplementary feed type over the last 25 years is shown in Figure 9. It illustrates the increase in non-pasture feeding to dairy cows as well as showing the trends for each feed type over this period. Figures 10, 11 and 12 show the division of supplementary feed eaten by type for seasons , and respectively. The growth of PKE and maize silage as a proportion of total supplementary feed eaten is evident with maize silage comprising 42 per cent in and PKE comprising 36 per cent in
44 Figure 9: Total feed eaten by supplementary feed type from to Source: DairyNZ Economics Group
45 41


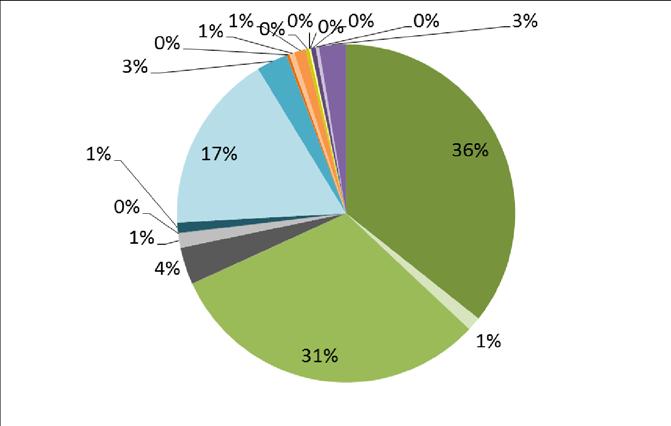
46 Figure 10: Total feed eaten by supplementary feed type in Figure 11 : Total fe ed eaten by supplementary feed type in Figure 12 : Total feed eaten by supplementary feed type in
47 Source: DairyNZ Economics Group Characteristics of Non-pasture Feeds New Zealand dairy farms show considerable variation in the types of supplementary feeds used and this is reflected in different characteristics for each. The method of feeding has a significant impact on the utilisation percentage for a particular feed type. Collecting information regarding the most common method of feeding was done through discussion with industry professionals. This was used as a basis for determining appropriate utilisation percentages for each feed type. For feed types fed in shed, barns or in bins (concentrates such as PKE, maize grain, barley, wheat, oats, brewer s grain, tapioca, soyabean meal and cottonseed meal), the wastage was assumed to be low and were allocated high utilisation percentages. For the remaining feed types grazed in situ or harvested and fed in paddock (silages and crops such as maize silage, cereal whole crop silage, fodder beet, kale, rape, turnips, swedes and other brassicas), lower utilisation percentages were applied due to a higher level of wastage associated with feeding. For specific utilisation percentages for each feed, refer to Tables 5 to 21. Metabolisable energy and crude protein values were also sourced from the DairyNZ Facts and Figures publication for the majority of feed types, although rape, other brassicas and cottonseed meal were unpublished and were therefore omitted from Table 23. For each feed type, crude protein values were used to back calculate nitrogen content (g/kg DM) by following recognised industry practice and dividing crude protein as a percentage of dry matter weight by Table 23 below provides a summary of the characteristics for each non-pasture feed type, including metabolisable energy, crude protein and nitrogen content. Table 23: Summary of the characteristics of each non-pasture feed type 4 Supplement Type Metabolisable Energy (ME MJ /kg DM) Crude Protein (% of DM) Nitrogen Content (g/kg DM) PKE Maize Grain Maize Silage Barley Grain Wheat Grain Oats Cereal Whole Crop Silage Fodder Beet Kale Turnips Swedes Brewers Grain Tapioca Soyabean Meal Source: DairyNZ Facts and Figures, 2010 Forecast Methodology This section describes the methodology used to forecast the scale and level of milksolids production of the New Zealand dairy industry from to There are two growth forecast scenarios; modest growth and 44
48 high growth, with the high growth scenario driven from two different feed pathways, increased supplementary feed and increased pasture and crop eaten. All scenarios assume the number of milking platform effective hectares increase slowly, but at the same rate i.e. all forecast scenarios have the same hectares assumed for each season. A base scenario for modest milk production growth is driven by increased pasture and grown crops consumed by dairy cows with two possibilities for stocking rates, one holding at current levels and a second reducing in light of environmental regulations and the possibility of more young stock and cows being wintered on the milking platform. Figure 13 below describes the four forecast scenarios. Figure 13: Forecast scenarios summary Total Milksolids Growth Modest (+0.8% CAGR) Scenario 1 Scenario 2 Scenario 3 Scenario 4 Modest (+0.8% CAGR) High (+1.7% CAGR) High (+1.7% CAGR) Stocking Rate (cows/ha) Hold (2.8) (2.65) (3.0) (3.0) Milksolids per cow (+1.9 kg MS/cow/year) (+3.7 kg MS/cow/year) (+2.8 kg MS/cow/year) (+2.8 kg MS/cow/year) Total Feed Eaten per hectare (+0.5 t DM/ha) (+0.2 t DM/ha) (+1.8 t DM/ha) (+1.8 t DM/ha) Pasture Eaten (t DM) Crops Eaten (t DM) Harvested Supplements Eaten (t DM) Imported Supplements Eaten (t DM) The national forecasts are a product of regional models, where herd numbers, effective hectares, stocking rates and milksolids per cow are all estimated. The model is founded on a series of three-way validations for two variables (detail below). The base data is , but manual estimates are applied for and Regressions are then applied for the period to and then each five year period thereafter. Effective dairy hectares were the first to be estimated using regional annual rates of change (either an increase or decrease) for each five year period. In determining the effective dairy hectares, consideration was given to actual land availability, pressures from alternative land use (both agricultural and non-agricultural), existing environmental pressures, and historical changes in dairy land use as well as the assumptions applied (refer to Forecast Assumptions section). However, in doing this no attempt was made to balance the area used for agricultural or total land use. Stocking rate was then estimated, again using regional rates of change, to reflect the expected level of intensification (or de-intensification). Consideration has been given to changes in infrastructure that support intensified systems (both within and outside the farm gate), existing environmental pressures, changes in managerial ability that allow better balancing of feed demand and supply and the assumptions applied. The resulting change in cow numbers (i.e. stocking rate x effective hectares) was then validated on the basis that such an increase (if applicable) was realistically achievable, and consistent with historical seasons. Having established the cows and hectares, the next stage was to apply a productive potential to these resources. In order to derive total milksolids production, kilograms milksolids per cow was deemed to be the most appropriate variable to estimate. This removed the impact of off-farm grazing, and other intensification not associated with the effective milking platform, which could potentially be introduced using kilograms milksolids per hectare. Although variable across the regions, a linear kilograms milksolids per cow increase has been applied through the long range projection. This reflects constant technological gains (including animal and plant genetic improvement) and constant increases in managerial ability expected over time. While technological 45
49 developments are likely to cause step-wise improvements to production, the purpose of this projection is to provide gradual long-term predictions. The typical climate and natural environment have an obvious impact on the ability to generate production. Farmer attitudes to risk also influence future production gains. For example, through choice of production system, pasture management, dealing with climatic events e.g. dry spells, labour management and levels of borrowing. Forecast Assumptions All forecasts require a series of assumptions to be set for the variables that can potentially impact the outcomes. For a projection of a long-term nature, such as contained in this paper, there are many assumptions required and therefore the results are more a projection of change rather than absolute numbers. As the future is uncertain we have provided four different scenarios to demonstrate a range of possible outcomes, but there are many more that could be considered. The following have been identified as factors that could critically influence future cow numbers, effective dairy hectares and milk production: Commodity prices: while prices are at very low levels, we assume the medium and long term outlooks are positive and that milk prices over the next 15 years will average only slightly below those of the last years. Whole Milk Powder (WMP) prices are projected to sustain a long-term average within a range of US$2,500 and US$2,800 per tonne WMP. We have not attempted to forecast volatility or year to year fluctuations in commodity prices. Commodity prices for competing land uses (sheep, beef and deer, horticulture and arable) are currently quite strong. Given the predictions for dairy, it is assumed the gap has closed, but dairy will continue to be the leader in farm profitability in the medium to long term. Milk Prices: it is assumed that the average dairy industry payout sustains a long-term average (within a range of $5 and $7) of around $5.80 per kilogram milksolids. This is $0.5/kg MS lower than the average of the last decade. However, volatility is not estimated. Trade conditions: it is assumed that free markets prevail in their current state (i.e. contains some degree of EU and US protectionism). Removal of EU quotas has led to increased production, and oversupply on world markets, but this is expected to only exist in the short term. However, we do not see the Russian market being opened for the importation of Western dairy products. Population growth: it is assumed that population growth continues at current projections (a positive, but diminishing rate of growth), so too does the demand for dairy and protein-based foods. Bio-security: it is assumed that New Zealand remains free of any major plant or animal bio-security breach that could significantly impact milk supply. This includes no further incursions of Velvetleaf. PKE: it is assumed PKE will continue to be available for New Zealand to import. Different scenarios are run where the volumes of imported PKE decrease, hold at current levels and increase over the next 15 years. Government regulation: it is assumed that the New Zealand government (central) remain status quo. In particular, it assumes no Emissions Trading Scheme (or similar equivalent for Greenhouse gases) legislation is implemented for agriculture. Environmental regulation: regional councils around the country are taking different approaches to implementing catchment limits and regulations to protect and improve freshwater quality. We have 46
50 taken this into consideration when thinking about future growth and mitigations farms may need to take in different regions over the next 15 years. Water: it is assumed that current water availability (for stock and shed) remains status quo. For irrigation, assumptions were made for likely future irrigation schemes, particularly for Canterbury, Otago and Hawke s Bay. These form much of the additional hectares available for conversion to dairy, with most of the irrigation schemes having their own environmental requirements. Climate: it is assumed that each season is subject to typical climatic conditions and is exclusive of any significant climate change. Further, it assumes no force majeure events, e.g. natural disaster. Cows: it is assumed that current genetic direction is maintained. Cow numbers in the projections refer to only 2 year old animals or older. Young stock are excluded, but an assumption of around 20 per cent replacement rates could be fairly assumed and held constant for the forecast horizon. Cow liveweights: liveweights are assumed to hold constant at 470 kilograms per cow for all scenarios, these weights reflect the average liveweight for a New Zealand dairy cow weighted by age and breed category over the last 25 years. Intensification: it is assumed that farm systems are close to or have reached their maximum intensity. It is believed that the current low milk prices and environmental regulations in the next 10 to 15 years will see more focus on home-grown feed, including the use of fertiliser, with similar or even less use of supplementary feeds. However, this does not necessarily mean less milk production. A second option assuming further intensification with higher stocking rates, and higher per cow milk production was also developed in order to test the likely range. Stocking rates in the various forecast scenarios range between 2.65 and 3.00 cows per hectare by Forecast Feed Demand Having developed predictions for the possible future size of the industry and milksolids production, feed demand is calculated based on expected average liveweight per cow and average milksolids production per cow. For both the modest and high growth forecast scenarios, liveweights are held constant on the basis that there will be more Friesian-Jersey crossbred cows with less Holstein-Friesian cows and a higher level of milksolids production per cow, but will be offset by an increase in feed consumed. Feed demand per cow is derived in the same way it was estimated for the historical data. That is, a regression equation 5 was developed based on liveweights and milksolids per cow to determine the feed demand requirements per cow to achieve the forecast level of production. The base feed demand requirement is sourced from the DairyNZ Facts and Figures publication. Feed conversion efficiency is calculated and used as a further check that the feed demand is sensible. Multiple assumptions under different scenarios are then made as to the likely split of feed use between the different types (pasture, grown crops, harvested supplement and imported supplement) to predict future trends and estimate the proportions of feeds consumed by dairy cows to This process takes into consideration the possible future availability of supplement types due to environmental issues as well as assumptions around milk price, feed costs, land use change in New Zealand and future dairy farm systems. The overall approach to these forecasts was developed and discussed by a number of farm systems and feed experts at DairyNZ and the likely future directions of various crops and supplementary feeds was discussed with feed experts (usually commercial sales people or technical researchers). Given the uncertainties the future hold, the majority of forecasts at the individual feed level are applied in a linear fashion. This means the actual movement and quantities of individual feeds between years is a lot less 47
51 reliable than the actual projection of change and the levels in The impacts of milk prices, feed prices, seasonal weather variations, future regional environmental policy and/or any biosecurity/animal health issues from planting and feeding different feeds, along with changes in farm systems and management will have the largest impact on the mix of feeds consumed by dairy cows. It is important to note that while pasture is and will continue to be the largest feed consumed by New Zealand dairy cows, they eat quite a mix of feeds and this varies considerably regionally, seasonally and individually based on system type, availability of feeds, farmer preferences and nutritional requirements. Forecast Results The results and assumptions for each of the two milksolids growth forecast scenarios are discussed below. Additional hectares in dairy are assumed, but these are kept at the same level for all the forecasts scenarios. The modest growth scenario assumes total milksolids production grows at a rate of 0.8 per cent CAGR to The higher growth scenario assumes total milk production grows twice (+1.7% CAGR) as fast as the modest growth scenario. Differences in stocking rates and milksolids per cow drive the forecast scenarios. Modest Growth Forecast Scenario 1 The key assumption for this modest growth scenario is that stocking rates will remain largely unchanged over the next 15 years at around 2.8 cows per hectare. This determines that cow numbers will only increase slightly from current levels to 5.15 million by On this basis, milksolids per cow increases at a rate of 1.9 kilograms per year. This growth rate is slightly less than half the milksolids per cow growth rate experienced between and Feed demand based on this modest growth forecast scenario, would increase slowly from 4.97 tonnes per cow in to 5.15 tonnes per cow in This is based on the assumption that livestock weights remain constant at 470 kilograms per cow throughout the period. When stocking rates are considered, the growth in feed eaten per hectare increases 0.5 tonne per hectare to 14.4 tonne dry matter per hectare by The lift in future production is primarily from increased feed, although FCE improves slightly from 13.1 kg DM/ kg MS to Once again this is expected to be at a much slower rate of FCE improvement over the next 15 years compared with the last 15 years, based on the large change in feed systems including the development and use of feeding infrastructures such as feed pads, in-shed feeding and barns and an improvement in days in milk. Table 24 provides a summary of the modest growth forecast scenario 1 including expected cow numbers, effective hectares, milksolids production and derived total feed demand. 48
52 Table 24: Modest Growth Forecast Scenario 1 Summary Statistics Season Cow numbers Effective area (hectares) Stocking Rate (cows/ha) Total Milksolids (kg) MS/cow MS/ha Liveweight (kg) Feed Demand (t DM/cow/year) Feed Demand (t DM/ha/year) Feed Demand (t DM/year) FCE (kg DM/ kg MS) FCE (kg MS/ t DM) ,909,181 1,752, ,858,967, , ,388, % ,892,372 1,751, ,843,001, , ,233, % ,917,615 1,757, ,862,832, , ,435, % ,942,793 1,762, ,882,739, , ,637, % ,967,908 1,768, ,902,720, , ,840, % ,992,958 1,774, ,922,777, , ,043, % ,023,712 1,784, ,945,185, , ,276, % ,057,979 1,795, ,968,984, , ,527, % ,092,247 1,806, ,992,918, , ,778, % ,126,516 1,816, ,016,986, , ,031, % ,160,787 1,827, ,041,188, , ,284, % ,161,790 1,831, ,049,492, , ,348, % ,159,117 1,834, ,056,431, , ,394, % ,156,342 1,836, ,063,320, , ,439, % ,153,465 1,839, ,070,160, , ,483, % ,150,486 1,842, ,076,949, , ,527, % MS % of Liveweight
53 48
54 The most likely outcome of the increased feed supply in the modest growth forecast scenario 1 will be through pasture and crops. Fodder beet use is estimated to double from 815,000 tonnes DM to 1.6 million tonnes DM by , based on the rapid rise in its popularity, due to reasonably high yields, low cost per kilogram of dry matter and lower nitrogen leaching advantages. The increased use of fodder beet started in the South Island but is spreading rapidly in the North Island. The growth in fodder beet will displace some other crops, such as maize grown for silage (-18%) and turnips (-19%) in the North Island, with the use of brassica crops declining (- 18%) and swedes in the South Island down 28 per cent. Under this scenario imported PKE volumes are expected to decline 35 per cent from the current levels. This is due to increasing pressure from milk companies to ensure milk composition (fat and protein mix) is not adversely affected and to reduce environmental and biosecurity risks. Pasture including pasture silage is the residual feed in the calculation. A decrease in harvested crop (maize silage) and imported supplement (PKE) is partially offset by an increase in crop volumes (fodder beet). This means pasture consumed by cows will increase from 4.07 tonnes to 4.34 tonnes, equivalent to an increase of 0.7 tonne per hectare to tonnes by Under this scenario the percentage of pasture consumed by dairy cows increases from 82 to 84 per cent. However, if fodder beet only increases at half the rate projected in this scenario, per hectare pasture consumed would increase to tonnes (86% of total feed consumed). Tables 25 and 26 shows the split of total feed per cow and per hectare for the modest growth scenario 1 between pasture, crop and supplements (harvested and imported). It shows the increase in pasture and crops eaten per cow increasing over this period with supplements (harvested and imported) decreasing on a per cow basis. Table 27 shows the forecasted changes in individual supplementary feed types for this scenario. Table 25: Modest Growth Forecast Scenario 1 Feed Categories- per cow Total Feed Pasture (t Crop (t Harvested Supplements (t Imported Supplements (t Season (t/cow) DM/cow) DM/cow) DM/cow) DM/cow)
55 49 Table 26: Modest Growth Forecast Scenario 1 Feed Categories- per hectare Season Total Feed Eaten (t/ha) Pasture (t DM/ha) Crop (t DM/ha) Harvested Supplements (t DM/ha) Imported Supplements (t DM/ha)
56 Season Table 27: Modest Growth Forecast Scenario 1 Supplementary Feed Breakdown (t DM) PKE Maize Grain Maize Silage Barley Wheat Oats Cereal whole crop silage Fodder Beet Kale Rape Turnips Swedes Other Brassicas Brewers Grain Tapioca Soyabean Cottonseed Total Supplements & Crop (t DM) ,500,000 50,000 1,100, ,000 50,000 2,000 40, , ,000 11,000 20,000 50,000 13,000 4,500 2,000 15,000 10, ,000 4,432, Other Supplements Total Supplements & Crop (t DM/cow) ,400,000 50,000 1,050, ,000 49,000 2,000 40, , ,000 11,000 19,750 50,000 12,900 4,500 2,000 15,000 10, ,000 4,229, ,400,000 50,000 1,100, ,000 48,000 2,000 40,000 1,045, ,500 11,000 19,500 49,000 12,800 4,500 2,000 15,000 10, ,000 4,453, ,400,000 50,000 1,100, ,000 47,000 2,000 40,000 1,175, ,000 11,000 19,250 48,000 12,700 4,500 2,000 15,000 10, ,000 4,528, ,365,000 50,000 1,050, ,000 46,000 2,000 40,000 1,285, ,500 11,000 19,000 47,000 12,600 4,500 2,000 15,000 10, ,000 4,497, ,330,000 50,000 1,000, ,000 45,000 2,000 40,000 1,395, ,000 11,000 18,750 46,000 12,500 4,500 2,000 15,000 10, ,000 4,466, ,295,000 50, , ,000 44,000 2,000 40,000 1,505, ,500 11,000 18,500 45,000 12,400 4,500 2,000 15,000 10, ,000 4,485, ,260,000 50, , ,000 43,000 2,000 40,000 1,615, ,000 11,000 18,250 44,000 12,300 4,500 2,000 15,000 10, ,000 4,504, ,225,000 50, , ,000 42,000 2,000 40,000 1,615, ,500 11,000 18,000 43,000 12,200 4,500 2,000 15,000 10, ,000 4,463, ,190,000 50, , ,000 41,000 2,000 40,000 1,615, ,000 11,000 17,750 42,000 12,100 4,500 2,000 15,000 10, ,000 4,422, ,155,000 50, , ,000 40,000 2,000 40,000 1,615, ,500 11,000 17,500 41,000 12,000 4,500 2,000 15,000 10, ,000 4,382, ,120,000 50, , ,000 39,000 2,000 40,000 1,615, ,000 11,000 17,250 40,000 11,900 4,500 2,000 15,000 10, ,000 4,341, ,085,000 50, , ,000 38,000 2,000 40,000 1,615, ,500 11,000 17,000 39,000 11,800 4,500 2,000 15,000 10, ,000 4,300, ,050,000 50, , ,000 37,000 2,000 40,000 1,615, ,000 11,000 16,750 38,000 11,700 4,500 2,000 15,000 10, ,000 4,259, ,015,000 50, , ,000 36,000 2,000 40,000 1,615, ,500 11,000 16,500 37,000 11,600 4,500 2,000 15,000 10, ,000 4,218, ,000 50, , ,000 35,000 2,000 40,000 1,615,625 99,000 11,000 16,250 36,000 11,500 4,500 2,000 15,000 10, ,000 4,177,
57 Modest Growth Forecast Scenario 2 Total milk production growth in this scenario is exactly the same as the first modest growth scenario. The key assumption for the second modest growth scenario is that stocking rates will decrease to 2.65 cows per hectare by This determines that cow numbers will remain around current levels of 4.9 million cows. On this basis, milksolids per cow increases at a rate of 3.7 kilograms per year. This growth rate is nearly twice the milksolids per cow growth rate expected in the previous modest growth scenario. Feed demand based on this scenario, would increase from 4.97 tonnes per cow in to 5.32 tonnes per cow in , faster than the previous modest growth scenario. This is based on the assumption that livestock weights remain constant at 470 kilograms per cow throughout the period. However, when stocking rates are considered, the growth in feed eaten per hectare increase only 0.2 tonne per hectare to 14.1 tonne dry matter per hectare by The lift in future production is driven as much by increased FCE, which improves from 13.1 kg DM/ kg MS to 12.5, as it is by more feed eaten. Table 28 provides a summary of the modest growth forecast scenario 2 including expected cow numbers, effective hectares, milksolids production and derived total feed demand. 54
58 Table 28: Modest Growth Forecast Scenario 2 Summary Statistics Season Cow numbers Effective area (hectares) Stocking Rate (cows/ha) Total Milksolids (kg) MS/cow MS/ha Liveweight (kg) Feed Demand (t DM/cow/year) Feed Demand (t DM/ha/year) Feed Demand (t DM/year) FCE (kg DM/ kg MS) FCE (kg MS/ t DM) ,909,181 1,752, ,858,967, , ,388, % ,892,372 1,751, ,843,001, , ,233, % ,917,615 1,757, ,862,832, , ,435, % ,917,615 1,762, ,882,739, , ,583, % ,915,615 1,768, ,902,720, , ,728, % ,913,615 1,774, ,922,777, , ,872, % ,910,615 1,784, ,945,185, , ,032, % ,907,615 1,795, ,968,984, , ,202, % ,904,615 1,806, ,992,918, , ,372, % ,901,615 1,816, ,016,986, , ,543, % ,897,615 1,827, ,041,188, , ,713, % ,893,615 1,831, ,049,492, , ,766, % ,889,615 1,834, ,056,431, , ,808, % ,885,615 1,836, ,063,320, , ,850, % ,880,615 1,839, ,070,160, , ,889, % ,875,615 1,842, ,076,949, , ,928, % MS % of Liveweight
59 53
60 The most likely outcome of the increased feed supply in the modest growth forecast scenario 2 will be through pasture and crops. As with the modest growth forecast scenario 1, fodder beet is estimated to increase rapidly from 815,000 tonnes DM to 1.6 million tonnes DM by , and will displace some other crops, such as maize grown for silage (-18%) turnips (-19%), brassica crops (-18%) and swedes (-28%). Under this scenario imported PKE volumes are expected to decline 35 per cent from the current levels. Pasture including pasture silage is the residual feed in the calculation. A decrease in harvested crop (maize silage) and imported supplement (PKE) is partially offset by an increase in crop volumes (fodder beet). This means pasture consumed by cows will need to increase from 4.07 tonnes to 4.46 tonnes, equivalent to an increase of 0.4 tonne per hectare to tonnes by in order to achieve the level of production forecast. Tables 29 and 30 shows the split of total feed per cow and per hectare for the modest growth scenario 2 between pasture, crop and supplements (harvested and imported). It shows the increase in pasture and crops eaten per cow increasing over this period with supplements (harvested and imported) decreasing on a per cow basis. Table 31 shows the forecasted changes in individual supplementary feed types for this scenario. Table 29: Modest Growth Forecast Scenario 2 Feed Categories- per cow Total Feed Pasture (t Crop (t Harvested Supplements (t Imported Supplements (t Season (t/cow) DM/cow) DM/cow) DM/cow) DM/cow)
61 Table 30: Modest Growth Forecast Scenario 2 Feed Categories- per hectare Season Total Feed Eaten (t/ha) Pasture (t DM/ha) Crop (t DM/ha) Harvested Supplements (t DM/ha) Imported Supplements (t DM/ha)
62 Table 31: Modest Growth Forecast Scenario 2 Supplementary Feed Breakdown (t DM) Season PKE Maize Grain Maize Silage Barley Wheat Oats Cereal whole crop silage Fodder Beet Kale Rape Turnips Swedes Other Brassicas Brewers Grain Tapioca Soyabean Cottonseed Other Supplements Total Supplements & Crop (t DM) ,500,000 50,000 1,100, ,000 50,000 2,000 40, , ,000 11,000 20,000 50,000 13,000 4,500 2,000 15,000 10, ,000 4,432, Total Supplements & Crop (t DM/cow) ,400,000 50,000 1,050, ,000 49,000 2,000 40, , ,000 11,000 19,750 50,000 12,900 4,500 2,000 15,000 10, ,000 4,229, ,400,000 50,000 1,100, ,000 48,000 2,000 40,000 1,045, ,500 11,000 19,500 49,000 12,800 4,500 2,000 15,000 10, ,000 4,453, ,400,000 50,000 1,100, ,000 47,000 2,000 40,000 1,175, ,000 11,000 19,250 48,000 12,700 4,500 2,000 15,000 10, ,000 4,528, ,365,000 50,000 1,050, ,000 46,000 2,000 40,000 1,285, ,500 11,000 19,000 47,000 12,600 4,500 2,000 15,000 10, ,000 4,497, ,330,000 50,000 1,000, ,000 45,000 2,000 40,000 1,395, ,000 11,000 18,750 46,000 12,500 4,500 2,000 15,000 10, ,000 4,466, ,295,000 50, , ,000 44,000 2,000 40,000 1,505, ,500 11,000 18,500 45,000 12,400 4,500 2,000 15,000 10, ,000 4,485, ,260,000 50, , ,000 43,000 2,000 40,000 1,615, ,000 11,000 18,250 44,000 12,300 4,500 2,000 15,000 10, ,000 4,504, ,225,000 50, , ,000 42,000 2,000 40,000 1,615, ,500 11,000 18,000 43,000 12,200 4,500 2,000 15,000 10, ,000 4,463, ,190,000 50, , ,000 41,000 2,000 40,000 1,615, ,000 11,000 17,750 42,000 12,100 4,500 2,000 15,000 10, ,000 4,422, ,155,000 50, , ,000 40,000 2,000 40,000 1,615, ,500 11,000 17,500 41,000 12,000 4,500 2,000 15,000 10, ,000 4,382, ,120,000 50, , ,000 39,000 2,000 40,000 1,615, ,000 11,000 17,250 40,000 11,900 4,500 2,000 15,000 10, ,000 4,341, ,085,000 50, , ,000 38,000 2,000 40,000 1,615, ,500 11,000 17,000 39,000 11,800 4,500 2,000 15,000 10, ,000 4,300, ,050,000 50, , ,000 37,000 2,000 40,000 1,615, ,000 11,000 16,750 38,000 11,700 4,500 2,000 15,000 10, ,000 4,259, ,015,000 50, , ,000 36,000 2,000 40,000 1,615, ,500 11,000 16,500 37,000 11,600 4,500 2,000 15,000 10, ,000 4,218, ,000 50, , ,000 35,000 2,000 40,000 1,615,625 99,000 11,000 16,250 36,000 11,500 4,500 2,000 15,000 10, ,000 4,177,
63 High Growth Forecast Scenario Feed demand based on the high growth forecast scenario, would increase slowly from 4.97 tonnes per cow in to 5.24 tonnes per cow in This is based on the assumption that livestock weights remain similar to current levels throughout the period and that milk production per cow lifts modestly from around 379 kg MS to 415 kg MS in The lift in production is from both increased feed and FCE. FCE improves from 13.1 kg DM/ kg MS to Average stocking rates under this forecast scenario increase from around 2.8 cows per hectare to 3.0 cows per hectare. The results of the higher stocking rates increase cow numbers to 5.50 million in This compares to 5.15 million cows in the first modest growth scenario. Total milk production under the high growth scenario grows twice as fast as the modest scenario at 1.7 per cent compound annual growth rate (CAGR) compared with 0.8 per cent CAGR. Table 30 provides a summary of the high growth forecast scenario including expected cow numbers, effective hectares, milksolids production and derived total feed demand. 60
64 Table 32: High Growth Forecast Summary Statistics Season Cow numbers Effective area (hectares) Stocking Rate (cows/ha) Total Milksolids (kg) MS/cow MS/ha Liveweight (kg) Feed Demand (t DM/cow/year) Feed Demand (t DM/ha/year) Feed Demand (t DM/year) FCE (kg DM/ kg MS) FCE (kg MS/ t DM) ,909,181 1,752, ,858,967, , ,388, % ,892,372 1,751, ,843,001, , ,233, % ,934,297 1,757, ,869,151, , ,518, % ,976,394 1,762, ,900,757, , ,844, % ,018,661 1,768, ,932,684, , ,172, % ,061,100 1,774, ,964,935, , ,503, % ,114,028 1,784, ,001,616, , ,890, % ,170,831 1,795, ,039,998, , ,297, % ,227,946 1,806, ,078,844, , ,709, % ,285,371 1,816, ,118,159, , ,124, % ,343,107 1,827, ,157,943, , ,543, % ,380,883 1,831, ,185,563, , ,830, % ,415,080 1,834, ,212,049, , ,100, % ,449,354 1,836, ,238,725, , ,371, % ,483,704 1,839, ,265,592, , ,644, % ,518,131 1,842, ,292,649, , ,918, % MS % of Liveweight
65 58
66 The increased feed supply under the high growth forecast scenario could be through a combination of any of the feed types, but most likely driven by more PKE, fodder beet and/or more pasture consumed. We have examined two different options under the high growth forecast scenario more supplementary feed and more pasture and crop. High Growth Driven by Supplements The consumption of PKE volumes by dairy cows is estimated to increase 33 per cent from the current levels to 2.0 million tonnes. In addition, the use of soyabean, cottonseed and tapioca feeds double to However, these imported feeds are of small volumes. Other imported feeds are also estimated to increase 50 per cent in this scenario. The increase in supplementary feed is not sufficient to meet the feed demands required under this scenario so the volume of pasture and crops will also need to increase. As with the modest growth scenario we have assumed there will be a rapid rise in the use of fodder beet, doubling the consumption to 1.6 million tonnes by Both maize silage and maize grain have been increased 25 per cent while barley increases 50 per cent from current levels. Under this scenario pasture and pasture silage consumption increases 0.85 tonne (+7%) per hectare by The percentage of pasture consumed by dairy cows decreases from 82 to 78 per cent. Tables 33 and 34 shows the split between pasture, crop and supplements (harvested and imported) of total feed per cow and per hectare for the high growth scenario driven by supplements (scenario 3). It shows the increase in pasture, crops, supplements (harvested and imported) on a per cow basis. Table 35 shows the forecasted changes in individual supplementary feed types for this scenario. Table 33: High Growth Driven by Supplements Forecast Feed Categories- per cow Total Feed Pasture (t Crop (t Harvested Supplements (t Imported Supplements (t Season (t/cow) DM/cow) DM/cow) DM/cow) DM/cow)
67 Table 34: High Growth Driven by Supplements Forecast Feed Categories- per hectare Season Total Feed Eaten (t/ha) Pasture (t DM/ha) Crop (t DM/ha) Harvested Supplements (t DM/ha) Imported Supplements (t DM/ha)
68 60 65
69 Table 35: High Growth Driven by Supplements Forecast Supplementary Feed Breakdown (t DM) Season PKE Maize Grain Maize Silage Barley Wheat Oats Cereal whole crop silage Fodder Beet Kale Rape Turnips Swedes Other Brassicas Brewers Grain Tapioca Soyabean Cottonseed Other Supplements Total Supplements & Crop (t DM) ,500,000 50,000 1,100, ,000 50,000 2,000 40, , ,000 11,000 20,000 50,000 13,000 4,500 2,000 15,000 10, ,000 4,432, Total Supplements & Crop (t DM/cow) ,533,000 50,845 1,120, ,300 50,000 2,000 40, , ,000 11,000 20,000 50,000 13,000 4,500 2,130 16,000 10, ,500 4,509, ,566,000 51,690 1,140, ,600 50,000 2,000 40,000 1,045, ,000 11,000 20,000 50,000 13,000 4,500 2,260 17,000 11, ,000 4,815, ,599,000 52,535 1,160, ,900 50,000 2,000 40,000 1,175, ,000 11,000 20,000 50,000 13,000 4,500 2,390 18,000 11, ,500 5,022, ,632,000 53,380 1,180, ,200 50,000 2,000 40,000 1,285, ,000 11,000 20,000 50,000 13,000 4,500 2,520 19,000 12, ,000 5,208, ,665,000 54,225 1,200, ,500 50,000 2,000 40,000 1,395, ,000 11,000 20,000 50,000 13,000 4,500 2,650 20,000 13, ,500 5,395, ,698,000 55,070 1,220, ,800 50,000 2,000 40,000 1,505, ,000 11,000 20,000 50,000 13,000 4,500 2,780 21,000 13, ,000 5,581, ,731,000 55,915 1,240, ,100 50,000 2,000 40,000 1,615, ,000 11,000 20,000 50,000 13,000 4,500 2,910 22,000 14, ,500 5,768, ,764,000 56,760 1,260, ,400 50,000 2,000 40,000 1,615, ,000 11,000 20,000 50,000 13,000 4,500 3,040 23,000 15, ,000 5,844, ,797,000 57,605 1,280, ,700 50,000 2,000 40,000 1,615, ,000 11,000 20,000 50,000 13,000 4,500 3,170 24,000 15, ,500 5,921, ,830,000 58,450 1,300, ,000 50,000 2,000 40,000 1,615, ,000 11,000 20,000 50,000 13,000 4,500 3,300 25,000 16, ,000 5,997, ,863,000 59,295 1,320, ,300 50,000 2,000 40,000 1,615, ,000 11,000 20,000 50,000 13,000 4,500 3,430 26,000 17, ,500 6,073, ,896,000 60,140 1,340, ,600 50,000 2,000 40,000 1,615, ,000 11,000 20,000 50,000 13,000 4,500 3,560 27,000 17, ,000 6,150, ,929,000 60,985 1,360, ,900 50,000 2,000 40,000 1,615, ,000 11,000 20,000 50,000 13,000 4,500 3,690 28,000 18, ,500 6,226, ,962,000 61,830 1,380, ,200 50,000 2,000 40,000 1,615, ,000 11,000 20,000 50,000 13,000 4,500 3,820 29,000 19, ,000 6,303, ,995,000 62,675 1,400, ,500 50,000 2,000 40,000 1,615, ,000 11,000 20,000 50,000 13,000 4,500 3,950 30,000 19, ,500 6,379,
70 61
71 High Growth Driven by Pasture and Crops The increased feed demand to under this scenario is met by increased volumes of pasture and crops eaten per cow. Another way to describe this scenario is that the volumes of imported supplements are capped at current levels. If all crops, harvested and imported supplementary feeds are restricted to current levels, pasture consumption will increase from 4.07 tonnes per cow to 4.28 tonnes per cow, equivalent to tonnes per hectare increasing to tonnes per hectare (+1.4 tonne/hectare). This is the maximum amount of pasture eaten possible under the two scenarios but would have pasture maintaining at 82 per cent of total feed consumed in However, under this scenario fodder beet doubles as in the previous scenarios. This will impact other grown crops by reducing their area harvested. All other grown crops were reduced by approximately 30 per cent from current volumes. Tables 36 and 37 shows the split between pasture, crop and supplements (harvested and imported) of total feed per cow and per hectare for the high growth scenario driven by pasture and crops (scenario 4). It shows the increase in pasture and crops eaten per cow increasing over this period with supplements (harvested and imported) decreasing on a per cow basis. Table 38 shows the forecasted changes in individual supplementary feed types for this scenario. Table 36: High Growth Driven by Pasture and Crops Forecast Feed Categories- per cow Season Total Feed (t/cow) Pasture (t DM/cow) Crop (t DM/cow) Harvested Supplements (t DM/cow) Imported Supplements (t DM/cow)
72 62 Table 37: High Growth Driven by Pasture and Crops Forecast Feed Categories- per hectare Season Total Feed Eaten (t/ha) Pasture (t DM/ha) Crop (t DM/ha) Harvested Supplements (t DM/ha) Imported Supplements (t DM/ha)
73 63
74 Table 38: High Growth Driven by Pasture and Crop Forecast Supplementary Feed Breakdown Season PKE Maize Grain Maize Silage Barley Wheat Oats Cereal whole crop silage Fodder Beet Kale Rape Turnips Swedes Other Brassicas Brewers Grain Tapioca Soyabean Cottonseed Other Supplements Total Supplements & Crop (t DM) ,500,000 50,000 1,100, ,000 50,000 2,000 40, , ,000 11,000 20,000 50,000 13,000 4,500 2,000 15,000 10, ,000 4,432, Total Supplements & Crop (t DM/cow) ,500,000 50,000 1,150, ,000 50,000 2,000 39, , ,500 10,750 19,600 49,000 12,750 4,500 2,000 15,000 10, ,000 4,470, ,500,000 50,000 1,200, ,000 50,000 2,000 38,000 1,045, ,000 10,500 19,200 48,000 12,500 4,500 2,000 15,000 10, ,000 4,737, ,500,000 50,000 1,250, ,000 50,000 2,000 37,000 1,175, ,500 10,250 18,800 47,000 12,250 4,500 2,000 15,000 10, ,000 4,905, ,500,000 50,000 1,300, ,000 50,000 2,000 36,000 1,285, ,000 10,000 18,400 46,000 12,000 4,500 2,000 15,000 10, ,000 5,053, ,500,000 50,000 1,300,000 95,000 50,000 2,000 35,000 1,395, ,500 9,750 18,000 45,000 11,750 4,500 2,000 15,000 10, ,000 5,151, ,500,000 50,000 1,300,000 90,000 50,000 2,000 34,000 1,505, ,000 9,500 17,600 44,000 11,500 4,500 2,000 15,000 10, ,000 5,250, ,500,000 50,000 1,300,000 90,000 50,000 2,000 33,000 1,615, ,500 9,250 17,200 43,000 11,250 4,500 2,000 15,000 10, ,000 5,355, ,500,000 50,000 1,300,000 90,000 50,000 2,000 32,000 1,615, ,000 9,000 16,800 42,000 11,000 4,500 2,000 15,000 10, ,000 5,349, ,500,000 50,000 1,300,000 90,000 50,000 2,000 31,000 1,615,625 97,500 8,750 16,400 41,000 10,750 4,500 2,000 15,000 10, ,000 5,344, ,500,000 50,000 1,300,000 90,000 50,000 2,000 30,000 1,615,625 95,000 8,500 16,000 40,000 10,500 4,500 2,000 15,000 10, ,000 5,339, ,500,000 50,000 1,300,000 90,000 50,000 2,000 29,000 1,615,625 92,500 8,250 15,600 39,000 10,250 4,500 2,000 15,000 10, ,000 5,333, ,500,000 50,000 1,300,000 90,000 50,000 2,000 28,000 1,615,625 90,000 8,000 15,200 38,000 10,000 4,500 2,000 15,000 10, ,000 5,328, ,500,000 50,000 1,300,000 90,000 50,000 2,000 27,000 1,615,625 87,500 7,750 14,800 37,000 9,750 4,500 2,000 15,000 10, ,000 5,322, ,500,000 50,000 1,300,000 90,000 50,000 2,000 26,000 1,615,625 85,000 7,500 14,400 36,000 9,500 4,500 2,000 15,000 10, ,000 5,317, ,500,000 50,000 1,300,000 90,000 50,000 2,000 25,000 1,615,625 82,500 7,250 14,000 35,000 9,250 4,500 2,000 15,000 10, ,000 5,312,
75 Forecast Summary Forecasting the future size of the dairy industry and production is extremely difficult, let alone the different levels of feeds consumed by dairy cows. The projections provided in this paper are merely an indication of some possibilities, but there are many more alternatives. We have provided two different milksolids growth levels, with differing stocking rates and variations in the volumes of each of the feeds consumed. Figure 13 provides a summary of the four forecast scenarios. Figure 14 below shows the percentage of pasture eaten for each of the scenarios. The high growth from more supplement scenario is a continuation of the trend observed over the last 25 years, while the modest growth scenario is the opposite with pasture increasing to around 84 per cent of total feed eaten. The high growth from more pasture and crop, has more reliance on the growth of crops in the first period to and then an increase in pasture eaten to 82 per cent in , near the same proportion of pasture eaten in Figure 14: Forecast pasture as a percentage of total feed eaten 85.0 % 84.0 % 83.0 % 82.0 % 81.0 % 80.0 % 79.0 % 78.0 % Modest Growth - constant stocking rate Modest Growth - lower stocking rate High Growth - more pasture and crop High Growth - more supplement 77.0 % 76.0 %

76 65 Final Comments and Considerations It is our opinion that the number of dairy cows milked, the level of milk production and corresponding total feed demand will impact Greenhouse gases. The split between the various feed types will also impact Greenhouse gas, but not to the same magnitude. This aside, the quantification of the various feed types will be very useful for the industry to monitor and respond to future changes. It should be noted that this report has been written on a range of base assumptions given the lack of available data and disperse industry knowledge surrounding feed use in the New Zealand dairy industry. Considering this, best endeavours were undertaken to ensure that the approaches used in this analysis neither over- nor under estimate the true results. On a national level, the feed demand estimate is believed to be reasonable as well as consistent with various expert opinions from those working in the various feed industries. More time was spent on ensuring the accuracy of the major feed types of PKE, maize silage and fodder beet. More work could be undertaken to improve the accuracy of some of the smaller feed types. On this basis, this report is a very good starting position in quantifying historical and future volumes of feed eaten by dairy cows. We will endeavour to improve the information and continue to update the data series annually. A summary of the three non-pasture feed types is shown in Figure 15. While they have all grown on a per hectare basis from a low base, imported supplements have grown the most since However, it is unlikely this trend will continue in the future. Figure 15: Non-pasture feeds consumed (t DM/ha) As reflected by the four forecasting scenarios included in this report, there is considerable uncertainty around the future direction of the New Zealand dairy industry and the resulting composition of the average dairy cow s diet in terms of pasture, crops, harvested supplements and imported supplements. The scenarios provided are reliant on a variety of factors including environmental regulations and policy, market forces, trade conditions, population growth, climate, new technologies and the ability of New Zealand dairy farmers to expand or intensify systems. Given this uncertainty, the forecasting scenarios provided a guide to potential changes that could occur. However, there are many other scenarios that could also occur.
Analysis of supplemental feed use in the new zealand sheep industry
 Analysis of supplemental feed use in the new zealand sheep industry MPI Technical Paper 2017/57 Prepared for the Ministry for Primary Industries ISBN No: 978-1-77665-677-6 (online) ISSN No: 2253-3923 (online)
Survey of management practices of dairy cows grazing kale in Canterbury
 49 Survey of management practices of dairy cows grazing kale in Canterbury H.G JUDSON 1 and G.R EDWARDS 1 Agricom, P.O Box 3761, Christchurch Lincoln University, P.O Box 84, Lincoln University gjudson@agricom.co.nz
Development and testing of new performance measures for milksolids production per hectare
 253 Development and testing of new performance measures for milksolids production per hectare C.B. GLASSEY Dexcel, Private Bag 3221, Hamilton chris.glassey@dexcel.co.nz Abstract With increased use of feed
Carbon footprint of farm systems from the Stratford and Waimate West Demonstration Farms
 Carbon footprint of farm systems from the Stratford and Waimate West Demonstration Farms June 2011 Carbon footprint analyses of Taranaki farm systems 21 Carbon footprint of farm systems from the Stratford
Energy from forages and grain
 Feed requirements and forage quality The northern dairy industry falls broadly into two groupings based on rainfall. Higher rainfall coastal farms are tropical pasture-based (mainly grass and tropical
Regular estimates of paddock pasture mass can improve profitability on New Zealand dairy farms
 29 Regular estimates of paddock pasture mass can improve profitability on New Zealand dairy farms P.C. BEUKES, S. McCARTHY, C.M. WIMS and A.J. ROMERA DairyNZ, Private Bag 3221, Hamilton 3240 pierre.beukes@dairynz.co.nz
The Grass. alculator
 10988 FINAL Friday COVER_Layout 1 17/06/2011 16:30 Page 1 The Grass alculator The Grass alculator The Grass alculator Moorepark Animal & Grassland Research and Innovation Centre, Teagasc, Fermoy, Co. Cork
THE VIABILITY OF MILK PRODUCTION IN PASTURE-BASED SYSTEMS INTRODUCTION
 THE VIABILITY OF MILK PRODUCTION IN PASTURE-BASED SYSTEMS Kevin Macdonald 4 INTRODUCTION Throughout the world there is an increasing interest in grazing production systems, primarily a result of expected
Maize Silage. More profit, More environmentally friendly
 Maize Silage More profit, More environmentally friendly References 1 Pioneer, 2012. Pioneer brand products Maize for Silage 2012/2013 catalogue. 2 Roche and Hedley, 2011. Supplements the facts to help
Water use efficiency of forages on subtropical dairy farms
 Water use efficiency of forages on subtropical dairy farms Findings from the Sustainable dairy farm systems for profit project M5 Project Information Series - Studies on Mutdapilly Research Station and
MILK DEVELOPMENT COUNCIL
 MILK DEVELOPMENT COUNCIL Agronomic Practicality, Economic Viability & Nutritional Value of Home-Grown Soya, Lupins & Naked Oats Project No. 99/T2/31 FINAL REPORT AGRONOMIC PRACTICALITY, ECONOMIC VIABILITY
Implications of changing a Friesian dairy system to a Friesian- Jersey crossbred dairy system
 Extension Farming Systems Journal volume 1 number 1 Research Forum 37 Implications of changing a Friesian dairy system to a Friesian- Jersey crossbred dairy system Bill Malcolm 1 and C Grainger 2 1 The
Nordic Association of Agricultural Scientists
 NJF Report Vol. 1 No 1 2005 Nordic Association of Agricultural Scientists NJF-Seminar 369 Organic farming for a new millennium -status and future challenges Published by Nordic Association of Agricultural
Resilient milk production systems for an expanding Irish dairy industry post 2015
 Resilient milk production systems for an expanding Irish dairy industry post 2015 Dr. Brendan Horan Animal and Grassland Research and Innovation Centre, Teagasc Moorepark Presentation Outline Expansion
Elaine Leavy Teagasc Organic Adviser, Stephen Nolan Teagasc Rural Economy and Development Programme Athenry
 Elaine Leavy Teagasc Organic Adviser, Stephen Nolan Teagasc Rural Economy and Development Programme Athenry Winter grazing forage crops are being successfully grown on organic farms throughout Ireland,
Section 1 : Identification sheet
 MINISTRY OF AGRICULTURE, FISHERIES AND FOOD Research and Development 30/09/98 Final Project Report (Not to be used for LINK projects) Date project completed: 1. (a) MAFF Project Code OF0113 Section 1 :
White Grain Sorghum a resilient flexible forage
 White Grain Sorghum a resilient flexible forage Last spring, the Queensland Department of Agriculture and Fisheries (DAFQ) C4Milk team had a series of regional workshops promoting a variety of new forage
Feeding to manage animal stress and maintain as much condition as possible is critical in a heavy snow situation.
 Heavy snow response Feeding to manage animal stress and maintain as much condition as possible is critical in a heavy snow situation. Here is some key information which will help you manage feed through
Resilient milk production systems for an expanding Irish dairy industry post 2015
 Resilient milk production systems for an expanding Irish dairy industry post 2015 Dr. Brendan Horan Animal and Grassland Research and Innovation Centre, Teagasc Moorepark Presentation Outline Expansion
Supplier # NITROGEN RECORDING PAGES
 Supplier # NITROGEN RECORDING PAGES NITROGEN RECORDING PAGES The information you provide in this form will be entered into Overseer and used to generate a report. This report will provide you with ongoing
NITROGEN LOSSES IN DIFFERING DAIRY WINTERING SYSTEMS IN CANTERBURY
 NITROGEN LOSSES IN DIFFERING DAIRY WINTERING SYSTEMS IN CANTERBURY J. M. de Ruiter and B.J. Malcolm The New Zealand Institute for Plant & Food Research Limited Private Bag 4704, Christchurch, New Zealand
Economic value of neonicotinoid seed treatment to New Zealand
 Economic value of neonicotinoid seed treatment to New Zealand March 2014 www.berl.co.nz Background Author(s): Shaun Twaddle, Kel Sanderson DISCLAIMER All work is done, and services rendered at the request
What stocking rate for my farm? Maximising milk production from pasture
 What stocking rate for my farm? Maximising milk production from pasture Brendan Horan, Laurence Shalloo and Donal Patton Animal and Grassland Research and Innovation Centre, Teagasc Moorepark Presentation
Southland Monitor Farm Project
 Southland Monitor Farm Project Weekly Update 27 April 2011 All of the APC s across the region have been showing a gradual decline as the weather turns colder. The APC s now range from 1815 to 2166 kg DM/ha.
A comparison of the intake of cows grazing swedes and kale and consequent condition score change.
 63 A comparison of the intake of cows grazing swedes and kale and consequent condition score change. B.R. THOMPSON and D.R. STEVENS AgResearch Ltd, Invermay, Private Bag 50034, Mosgiel. bryan.thompson@agresearch.co.nz
Nutrient Budgeting. An Overview of What, How and Why. June 2014
 Nutrient Budgeting An Overview of What, How and Why 2014 Topics to Cover 1. Why the need for nutrient budgets 2. What is OVERSEER? 3. Principles Behind OVERSEER 4. User Inputs 5. Importance of accurate
Comparative Efficiency of Autumn and Spring Calving for Pasture-based Dairy Systems
 Comparative Efficiency of Autumn and Spring Calving for Pasture-based Dairy Systems S. C. García,, C. W. Holmes, A. MacDonald, M. Lundman, J. Lundman, R. Pacheco-Navarro Massey University, Private Bag,
A model of the New Zealand beef value chain: evaluating opportunities
 81 A model of the New Zealand beef value chain: evaluating opportunities A.K. MCDERMOTT, D.C. SMEATON, G.W. SHEATH and A.E. DOOLEY AgResearch, Ruakura Research Centre, PB 3123, Hamilton alan.mcdermott@agresearch.co.nz
Lincoln University Dairy Farm Farm Walk notes
 Tuesday 29 th October 2013 Lincoln University Dairy Farm Farm Walk notes Critical issues for the short term 1. Manage feed supply on the platform and respond quickly to changing growth rates. 2. Use back
Estimating annual irrigation water requirements
 Estimating annual irrigation water requirements Findings from the Sustainable dairy farm systems for profit project M5 Project Information Series - Studies on Mutdapilly Research Station and subtropical
Back to the future making pasture work for you this spring
 Back to the future making pasture work for you this spring Kevin Macdonald, Senior Scientist, Feed and Farm Systems John Roche, Principal Scientist, Animal Science and Biosecurity Summary statement: You
Copyright is owned by the Author of the thesis. Permission is given for a copy to be downloaded by an individual for the purpose of research and
 Copyright is owned by the Author of the thesis. Permission is given for a copy to be downloaded by an individual for the purpose of research and private study only. The thesis may not be reproduced elsewhere
Economic Analysis on the Valuue of Winter Housing for Dairy Farming in Tararua District Phil Journeaux Paper presented at the 2013 NZARES Conference
 Economic Analysis on the Value of Winte er Housing for Dairy Farming in Tararua District Phil Journeaux AgFirst Waikato phil.journeaux@agfirst.co.nz Paper presented at the 2013 NZARES Conference Lincoln
Formulating profitable rations
 12 Formulating profitable rations This chapter presents examples of milking rations formulated to optimise their profitability, as quantified by milk income less feed costs. The main points in this chapter
Yield potential of forage crops in Tasmania
 Yield potential of forage crops in Tasmania Keith Pembleton and Richard Rawnsley TIAR Part of the Beyond 212 project funded by Dairy Australia and TIAR Overview Brassica (Rape, Kale and Turnips) Modelling
8 Managing organic feeding
 8 Managing organic feeding While organically-fed cows have exactly the same nutrient requirements as conventionally managed animals, meeting them under organic standards is considerably more complicated
Herd Homes: nutrient management and farmer perceptions of performance
 309 Herd Homes: nutrient management and farmer perceptions of performance R.D. LONGHURST 1, J LUO 1, M.B. O CONNOR 1 and T POW 2 1 AgResearch Ruakura, PB 3123, Hamilton 2 Wiremu Farms, Mata, RD1, Whangarei
2 Calculating the cost of your feeds
 2 Calculating the cost of your feeds 2 Calculating the costs of your feeds Objective: To understand the real farm cost of different feed types. Challenge: Calculate your current feed costs Plan feed cost
Modelling the impact of surplus pasture management techniques on production and profit in a pasture-based dairy system
 243 Modelling the impact of surplus pasture management techniques on production and profit in a pasture-based dairy system K.T. WYNN 1, P.C. beukes 2 and A.J. Romera 2 1 DairyNZ, 259 Jordan Valley Road,
Stretching out forage supplies for the dairy herd
 The extremely dry weather means grass has stopped growing and conserved forages are in short supply. If you are running an all year-round indoor feeding system, or a more conventional summer buffered grazing
Appendix 5: Farm modelling methodology
 Appendix 5: Farm modelling methodology Perrin Ag Consultants Limited Box 596 Rotorua 1330 Eruera Street Rotorua, New Zealand Ph 07 3491212, Fax 07 349 1112 consult@perrinag.net.nz www.perrinag.net.nz MEMORANDUM
Fertility. New Zealand Animal Evaluation Limited, Rationale. Lost milk production and changed feed requirement pattern. 5 th February 2013
 Fertility 5 th February 2013 DISCLAIMER Every effort has been made to ensure the accuracy of the investigations, and the content and information within this document. However NZAEL/DairyNZ expressly disclaims
Steps to making efficient use of water
 Steps to making efficient use of water Findings from the Sustainable dairy farm systems for profit project M5 Project Information Series - Studies on Mutdapilly Research Station and subtropical dairy farms
The Effective Fibre Source for Livestock
 Australian oaten hay The Effective Fibre Source for Livestock Inside: Oaten Hay 2-5 Feed Analysis 5 Story 6 How Oat Hay is produced 6 Bale Sizes 7 Contact Details 8 Oaten Hay (Avena Sativa) is an annual
Principles from the P21 research programme into lower N input dairy systems. Mark Shepherd AgResearch, Ruakura
 Principles from the P21 research programme into lower N input dairy systems Mark Shepherd AgResearch, Ruakura What the investors wanted from P21 Industry accessible, adoptable, systems-level solutions
DairySA. Dairy Farm Monitor Project. South Australia Annual Report 2012/13
 DairySA Dairy Farm Monitor Project South Australia Annual Report 2012/13 Acknowledgments The cooperation, patience and goodwill of the farmers who willingly supplied their farm information is gratefully
7.0 - nutrient uptake, removal and budgeting
 7.0 - nutrient uptake, removal and budgeting - nutrient uptake - nutrient removal - nutrient budgeting 7.0 nutrient uptake, removal and budgeting NUTRIENT UPTAKE The generalised relationship between plant
Forecasting fertiliser requirements of forage brassica crops
 205 Forecasting fertiliser requirements of forage brassica crops D.R. WILSON 1, J.B. REID 2, R.F. ZYSKOWSKI 1, S. MALEY 1, A.J. PEARSON 2, S.D. ARMSTRONG 3, W.D. CATTO 4 and A.D. STAFFORD 4 1 Crop & Food
Assessments of N leaching losses from six case study dairy farms using contrasting approaches to cow wintering
 51 Assessments of N leaching losses from six case study dairy farms using contrasting approaches to cow wintering J. M. CHRYSTAL 1, R.M. MONAGHAN 1 D. DALLEY 2 and T. STYLES 1 1 AgResearch, Invermay, Private
LIFE CYCLE ASSESSMENT OF SHEEP
 LIFE CYCLE ASSESSMENT OF SHEEP PRODUCTION IN ONTARIO FINAL SUMMARY REPORT OCTOBER 12 2017 Antoine Léger-Dionne, Jr. Eng., Analyst François Charron-Doucet, Eng., M.Sc., Scientific Director Edouard Clément,
Carbon Credit Potential from Intensive Rotational Grazing under Carbon Credit. Certification Protocols
 Carbon Credit Potential from Intensive Rotational Grazing under Carbon Credit Certification Protocols Kurt Stephenson Dept of Ag & Applied Econ Virginia Tech Blacksburg, VA 24061 Email: Kurts@vt.edu Phone
Ruminant grassland production systems in Ireland. Dr Michael O Donovan, Animal and Grassland Innovation Centre, Teagasc, Moorepark, Fermoy, Co Cork
 Ruminant grassland production systems in Ireland Dr Michael O Donovan, Animal and Grassland Innovation Centre, Teagasc, Moorepark, Fermoy, Co Cork 1 Presentation outline Importance to economy Land and
Once-a-day Milking in Late Lactation
 Once-a-day Milking in Late Lactation Jane Kay, DairyNZ Once-a-day (OAD) milking has been used as a management strategy for many years in New Zealand. Current records indicate that 4% of herds are milked
Introduction FORAGE CROPS 82
 Forage Crops Introduction There are various home-grown forage crops that offer alternatives to grass. Short term yields will be competitive with well managed grass, but costs of establishment are higher
Agricultural Science Past Exam Questions Animal Production Higher Level
 Agricultural Science Past Exam Questions Animal Production Higher Level 2013 Question 1 Part (a) (a) Name three breeds of pig including at least two breeds suitable for outdoor (non-intensive) rearing.
Dairy Farm Monitor Project
 Dairy Farm Monitor Project Western Australia annual report 2016 17 Acknowledgements Western Dairy would like to gratefully acknowledge the cooperation, patience and goodwill of the farmers who willingly
1. When transitioning from endophyte-infected tall fescue to an improved forage in the pasture.
 1209 Wenthe Drive Effingham, IL 62401 www.extension.uiuc.edu Alternative Fall and Winter Grazing Species Ed Ballard Extension Specialist Animal Systems/Retired Many livestock producers often think of annual
27 July 2018 Dryland farming in New Zealand. Derek Daniell Masterton
 27 July 2018 Dryland farming in New Zealand Derek Daniell Masterton Handling droughts in the North Island hills Hill country, no feed crops, no supplementary feed Wairere high stocking rates (25DSE/ha)
The profitability of increasing efficiency in the herd Brian Cumming. bcagriculture.com.au
 The profitability of increasing efficiency in the herd Brian Cumming Efficiency production with minimum waste or effort (Australian Concise Oxford Dictionary) Impact of beef CRC technologies on the efficiency
Farm-scale Modelling Report
 Farm-scale Modelling Report Ruamahanga Whaitua Collaborative Modelling Project MPI Information Report No: 2016/22 Prepared for the Ruamahanga Whaitua Committee and Greater Wellington Regional Council by
Moo s R Us Limited Effective and consistent farm performance. Northland Corin & Wendy Schick. Farm Systems Change 2016 Dairy Farm Case Study
 Moo s R Us Limited Effective and consistent farm performance Northland Corin & Wendy Schick Farm Systems Change 2016 Dairy Farm Case Study Moo s R Us Limited At a glance Moo s R Us Limited We are really
Financial Survey 2015 Southland Dairy
 Financial Survey 2015 Southland Dairy This report summarises the results of a financial survey of dairy farms across Southland, carried out by AgFirst through June 2015. A description of the model farm
National System Local Delivery. With organisations such as Landmark and Fonterra.
 National System Local Delivery With organisations such as Landmark and Fonterra. Introduction To Feed Central Online database of fodder and grain for sale Fodder Inspected to the same procedure Described
CASE STUDIES USING THE OUTDOOR PIG MODEL IN OVERSEER
 Barugh I., Wheeler D., Watkins N., 2016. Case studies using the outdoor pig model in Overseer. In: Integrated nutrient and water management for sustainable farming. (Eds L.D. Currie and R Singh). http://flrc.massey.ac.nz/publications.html.
Report Title: Quantifying the Effect of Two Different Pasture Management Systems on Milk Production and Farm Profitability
 Report Title: Quantifying the Effect of Two Different Pasture Management Systems on Milk Production and Farm Profitability Prepared for DairyNZ Inc by: Chris Boom and Stacey Belton AgFirst Northland Ltd
Dairy Businesses for Future Climates
 Dairy Businesses for Future Climates 2016 TASMANIA - Research Findings The profitability of dairy farm businesses in this research was negatively affected by the 2040 climate change scenarios modelled.
GRAZING CROPS IN PRACTICE
 TAKE HOME MESSAGES GRAZING CROPS IN PRACTICE Forage barley 1variety Moby has vigorous early growth and matures quickly, and should be grazed sufficiently early to enable recovery for a second grazing.
Changing New Zealand dairy farm systems
 Changing New Zealand dairy farm systems Bruce Greig, Commerce Faculty, Lincoln University Introduction There have been dramatic changes in New Zealand dairy farm systems over the last decade. There is
More than just a number Your guide to improving nitrogen-use efficiency on your farm
 More than just a number Your guide to improving nitrogen-use efficiency on your farm Protecting our present and our future New Zealand farmers have a reputation for producing safe, healthy food, and for
Benefit Cost Study of Increased Holstein-Friesian Jersey Crossbred Dairying in Victoria
 Benefit Cost Study of Increased Holstein-Friesian Jersey Crossbred Dairying in Victoria By Bill Malcolm University of Melbourne and Chris Grainger 1 Department of Primary Industries Victoria 1 Many knowledgeable
Canadian Forage and Grassland Association s Strategy for the Future
 Canadian Forage and Grassland Association s Strategy for the Future The Canadian Forage and Grassland Association is a national, non-profit association supported by stakeholders in the forage and grassland
FORAGE BRASSICAS FOR SUPPLEMENTING PASTURE SLUMPS. Richard Leep Forage Extension Specialist Michigan State University
 FORAGE BRASSICAS FOR SUPPLEMENTING PASTURE SLUMPS Richard Leep Forage Extension Specialist Michigan State University Beat the summer slump and late fall decline in food plots by planting forage brassicas.
Introduction BEEF 140
 Beef Cattle Introduction Markets and price drivers Recent years have seen greater volatility in the market. Reasons range from the effective closure of the EU beef intervention scheme, the horsemeat scare,
Calibre BMR Forage Sorghum
 Calibre BMR Forage Sorghum Sorghum bicolor x sudanese Early to mid maturing, Brown Mid Rib sorghum x Sudan grass hybrid 12 gene BMR now delivering new high quality in the forage market Low Lignin = highly
SAC Grass Day in Nairn. Grass. Growing and utilising Grass. Nairn 13 th March Paddy Jack DLF Seeds
 SAC Grass Day in Nairn Grass Growing and utilising Grass Nairn 13 th March 2018 Paddy Jack DLF Seeds What we will look at today Is grass a cheap feed? How does a grass plant grow? What species should we
Fertiliser Choice Optimising grass and forage yields on livestock farms
 Grassland Fertiliser Information Guide Fertiliser Choice Optimising grass and forage yields on livestock farms CF CF CF Blueprints for Growth It has often been said that grass is the cheapest feed on the
Finishing Store Lambs During Winter: Which Diet to Offer? Tim Keady Athenry Study
 Finishing Store Lambs During Winter: Which Diet to Offer? Tim Keady Animal & Grassland Research & Innovation Centre, Teagasc, Mellows Campus, Athenry, Co. Galway. Approximately 20% of the annual lamb kill
Nutrition and young stock
 16 Nutrition and young stock This chapter: Explains the nutritional needs of heifers in their three phases of development milk-fed calf, weaned calf and yearling. The main points in this chapter: a system
TIMELY INFORMATION. Agriculture & Natural Resources AGRICULTURAL ECONOMICS AND RURAL SOCIOLOGY, AUBURN UNIVERSITY, AL
 AG ECONOMIC SERIES TIMELY INFORMATION Agriculture & Natural Resources AGRICULTURAL ECONOMICS AND RURAL SOCIOLOGY, AUBURN UNIVERSITY, AL 36849-5639 DAERS 08-5 September 2008 U. S. Beef Cattle Situation
Cereal Stocks UK / England and Wales June 2013
 Cereal Stocks UK / England and Wales June 2013 Published 2 September 2013 This release provides the tonnages of wheat, barley and oats held on farms in England and Wales and wheat, barley, oats and maize
Measuring the cost of environmental compliance for Waikato dairy farmers a survey approach
 159 Measuring the cost of environmental compliance for Waikato dairy farmers a survey approach T.O.R. MACDONALD 1, J.S. ROWARTH 2 and F.G. SCRIMGEOUR 2 1 Landcorp Farming Limited, Taupo 2 University of
ROOTS AND POTATOES AS SUPPLEMENTS TO AN ALFALFA GRASS DIET TO DAIRY COWS. T. Eriksson, P. Ciszuk and E. Burstedt
 ID # 19-13 ROOTS AND POTATOES AS SUPPLEMENTS TO AN ALFALFA GRASS DIET TO DAIRY COWS T. Eriksson, P. Ciszuk and E. Burstedt Swedish University of Agricultural Sciences, Kungsängen Research Centre, 75323
The changing face of southern New Zealand farming: opportunities of land use change
 1 The changing face of southern New Zealand farming: opportunities of land use change R.J. COPLAND 1, D.R. STEVENS 2 1 Rabobank, P.O. Box 150, Gore. 2 AgResearch Invermay Research Centre, Puddle Alley
Greenhouse Gas Emissions on Northern Ireland Dairy Farms
 Greenhouse Gas Emissions on Northern Ireland Dairy Farms - A carbon footprint time series study January 2017 Statistics and Analytical Services Branch, DAERA Contents Page Executive Summary 1 Chapter 1:
PASTURE MANAGEMENT CHECKLIST NORTHERN RIVERS OF NSW. Lewis Kahn and Judi Earl FOR THE. Agricultural Information & Monitoring Services
 PASTURE MANAGEMENT CHECKLIST FOR THE NORTHERN RIVERS OF NSW Lewis Kahn and Judi Earl Agricultural Information & Monitoring Services Low and ideal values for the 12 key pasture checklist points Low Ideal
Joint IGFA/Teagasc Nutrition Event 27 th June Resilient farming systems for an expanding Irish dairy industry
 Resilient farming systems for an expanding Irish dairy industry Brendan Horan, Teagasc Moorepark Like it or not we live in interesting times. For most of the last 30 years, milk output has been constrained
Annual Crops for Grazing
 Annual Crops for Grazing Sign up for our E-Newsletter This document is part of the Capturing Feed Grain & Forage Oppportunities - Proceedings from a Conference on Feeding, Growing & Selling series. Introduction
Teagasc Dairy Farm Walk
 Animal & Grassland Research & Innovation Programme Teagasc Dairy Farm Walk 120 cows on 75 acre milking platform - How does Jim run a grass based system? Jim & Pauline Delahunty, Carrig, via Birr, Co. Tipperary
Table 1: Key parameters, financial results and budget for the Waikato/Bay of Plenty intensive sheep and beef farm model
 FARM MONITORING 2012 WAIKATO/BAY OF PLENTY INTENSIVE SHEEP AND BEEF Key results from the Ministry for Primary Industries 2012 sheep and beef monitoring programme KEY POINTS Farmer confidence levels are
Choice of forage crops for winter feed
 Choice of forage crops for winter feed Alison Frischke, (BCG) Take home messages the choice of vigorous, leafy, nutritious forage crops available for low to medium rainfall environments to supply nutritious
NEW ZEALAND SURVEY OF CEREAL AREAS AND VOLUMES: JULY 1, 2018
 NEW ZEALAND SURVEY OF CEREAL AREAS AND VOLUMES: JULY 1, 218 Survey details The objective of this AIMI survey of cereal growers in New Zealand (NZ) was to determine, as at July 1, 218: the final size of
New Zealand Institute for Crop & Food Research Limited, Private Bag 4704, Christchurch, New Zealand
 'Breeding for Success: Diversity in Action' C.F. Mercer (ed). Proceedings of the 13 th Australasian Plant Breeding Conference, Christchurch, New Zealand 1-21 April 26. pp. 4-92. Cereal forage breeding
Economic evaluation of pasture renovation options in irrigated dairy farming
 46 th Annual Conference of the Australian Agricultural and Resource Economics Society Canberra 13 15 February 2002 Dailin Kularatne 1 and Alister Lawson 2 1 Department of Natural Resources and Environment,
S.J. GIBBS 1, B. SALDIAS 1, J. WHITE 2, D. WALSH 2, N. STOCKER 2, C. TROTTER 3, B. FISHER 4, A. FISHER 4, B. BANKS 4 and S.
 23 A comparison of liveweight gain of two groups of weaners of different entry liveweight in an ad libitum fodder beet feeding system for finishing beef cattle S.J. GIBBS 1, B. SALDIAS 1, J. WHITE 2, D.
The following checklist provides a convenient framework for making accurate fertiliser decisions.
 Section 7: Grass Checklist for decision making 137 Principles of Fertilising Grassland 139 Protection of the environment 142 Finding the Nitrogen Recommendation 143 Assessing the Soil Nitrogen Supply (SNS)
CEREAL PASTURE EVALUATiON
 NEED EARLY winter SHEEP FEED? CEREAL PASTURE EVALUATiON Alison Frischke and Dannielle McMillan (BCG) TAKE HOme messages Growing season lengths did not necessarily influence variety feed value; both early
Low Input Dairying Challenges and Opportunities Sinclair Mayne, AFBI. 26 January, 2016 Novotel,Bristol
 Low Input Dairying Challenges and Opportunities Sinclair Mayne, AFBI 26 January, 2016 Novotel,Bristol Overview Why Low Input? Role of Grass and Forage - Growing grass - Effective grassland management -
Sheep and Cattle Breeding Farm
 10-4 - 2014 Sheep and Cattle Breeding Farm Purpose The purpose of this case study is to establish the benefit of incorporating irrigated Ruataniwha Plains land into a sheep and beef breeding farm. More
Getting Stocking Rates Right & Integrating the Outside Block
 Getting Stocking Rates Right & Integrating the Outside Block Brendan Horan & Donal Patton Animal & Grassland Research and Innovation Centre Teagasc, Moorepark, Fermoy, Co Cork. Phone: 025 42 222 web: www.teagasc.ie/dairy
EVALUATION OF THE GREENFEED METHANE MEASUREMENT SYSTEM
 EVALUATION OF THE GREENFEED METHANE MEASUREMENT SYSTEM A summary Report to MPI and NZAGRC funded by the New Zealand Government in support of the Global Research Alliance on Agricultural Greenhouse Gases