KAZAGRO. National Management Holding. Analytical review of grain market
|
|
|
- Octavia Tate
- 6 years ago
- Views:
Transcription

1 KAZAGRO National Management Holding Analytical review of grain market 1
 3 1.3 Prognosis for import and export 4 1.")

2 CONTENT 1. FOREIGN MARKET Long-term prognosis of grain market till 2021 (FAO) World market balance, short-term prognosis of the United States Department of Agriculture (USDA) Prognosis for import and export World prices dynamics Situation with provision with grain in main Kazakhstan grain importing countries 7 2. DOMESTIC MARKET Grain production in the Republic of Kazakhstan Price environment Grain balance Prices for services of elevators and mills Current capacities for grain storage Kazakhstan grain export CURRENT SITUATION IN GRAIN SECTOR EXPERT ASSESSMENT 19 2

 According to prognosis of Food and Agricultural Organization of the United Nations (FAO) increase of global wheat production till 2021 is")
3 1. FOREIGN MARKET Main kinds of grain crops at the world market are wheat, barley, oat, maize, rice, buckwheat and pea. At present grain world market is controlling by five main exporters: USA, Canada, Australia, Argentina and EU. Total export proposal of grain from the main five exporters amounts to over 84% of total world trade volume. 1.1 Long-term prognosis of grain market till 2021 (FAO) According to prognosis of Food and Agricultural Organization of the United Nations (FAO) increase of global wheat production till 2021 is expected at level of 11%. Kazakhstan, Russia and Ukraine will increase production of grain crops for 40%, 20% and 28% accordingly. At that expected increase of global production of forage grain crops (first of all, maize and barley) in medium-term perspective will amount approximately 20% - till 1.4 billion tons. Particularly in Kazakhstan, Russia and Ukraine production of forage crops will increase for 22%, 14% and 23% accordingly. Increase of global production of forage crops will be of priority rates in relation to food ones, approximately for 20%. All these prognoses are based on models of global level, models of economic imbalance and, naturally, as any economic model, are based in range of prepositions about growth of GDP, population revenues, population growth, and change of level of products consumption. Diagram 1. Prognosis of grain production in the world till Wheat, million tons Feed grains, million tons OECD-FAO Agricultural Outlook Balance of world market, short-term prognosis of production of USDA USDA in its regular report dated March 10, 2014 insignificantly increased evaluation of world resources of wheat in 2013/14 (Marketing year) almost for 0.08 million tons and amounted to million tons, that is higher than in the last marketing year for 8.0 million tons. Also evaluation of wheat production was increased for almost 0.8 million tons and amounted to million tons (table 1). It is for 56.4 million tons higher of the last year indicator. 3
4 According to IGC, International Grains Council (IGC) the prognosis of world wheat stock in 2013/14 marketing year was increased by 1.6 million tons, that is million tons, but evaluation of wheat production was decreased by 6.8 million tons and amounted to 700.2million tons. At that evaluation of consumption increased by 8.6 million tons till million tons, also by 4% more than in the last marketing year (table 2). Table 1. Balance of world wheat market according to USDA, million tons. 2010/ / /13 Prognosis 2013/14 January February March Production 652,3 697,27 656,34 712,65 711,88 712,71 (+0,83) Consumption 655,7 697,3 679,4 703,39 703,99 704,82 (+0,83) Trade 134,0 153,8 147,1 155,55 155,50 158,42 (+2,92) Final stock 198,9 198,9 175,8 185,39 183,73 183,81 (+0,08) - according to USDA Table 2. Balance of world wheat market according to IGC, million tons. 2010/ / /13 Prognosis 2013/14 November January March Production ,4 707,0 700,2 (-6,8) Consumption ,0 691,4 700 (+8,6) Trade ,3 146,6 143 (-3,6) Final stock ,0 188,4 190 (+1,6) - according to IGC According to report of USDA, prognosis of wheat production for Kazakhstan in 2013/14 marketing year is presented downward from 15.5 till million tons, increase for Russia till million tons and for Ukraine till million tons (table 3). Table 3. Prognosis of production on main exporting-importing countries, million tons. Difference 2009/ / / / /14* (2013/ /13) USA 60,4 60,1 54,4 61,76 57,96-3,80 Argentina 12,0 16,7 15,5 10,0 10,5 +0,5 Australia 21,8 27,4 29,9 22,46 27,0 +4,54 Canada 26,9 23,3 25,3 27,2 37,5 +10,3 EU 139,72 136,67 138,08 133,87 142,88 +9,01 Russia 61,77 41,5 56,24 37,72 52,06 +14,34 Ukraine 20,9 16,8 22,1 15,76 22,28 +6,52 Kazakhstan 17,0 9,64 22,73 9,84 13,94 +4,10 India 80,68 80,80 86,87 94,88 93,51-1,37 China 115,12 115,18 117,4 121,02 121,72 +0,70 Total: 686,74 652,28 697,17 656,33 712,71 +56,30 * Prognosis of USDA as of March 10, Prognosis on export and import Prognosis of wheat exporting on Kazakhstan in 2013/14 marketing year with account of adjustment as of March 10, 2014 are presented with increase by 0.2 million tons (7.0 million tons) compared with the last marketing year (6.8 million tons), 4
5 significant increase on Russia by 6.22 million tons (17.5 million tons) and on Ukraine by 2.8 million tons (10 million tons). Table 4. Prognosis of USDA on export, by main exporting-importing countries, million tons. 2009/ / / / /14* Difference (2013/ /13) USA 24,1 35,9 28,07 27,69 31,5 +3,81 Argentina 5,2 7,74 11,9 7,45 2,0-5,45 Australia 13,76 18,48 23,0 21,3 18,5-2,8 Canada 19,0 16,79 17,6 18,58 22,5 +3,92 EU 22,1 22,90 16,57 22,6 29,0 +6,38 Russia 18,56 3,98 21,63 11,28 17,5 +6,22 Ukraine 9,34 4,3 5,44 7,2 10,0 +2,8 Kazakhstan 7,87 5,52 11,07 6,8 7,0 +0,2 Total: 135,37 134,0,1 153,76 147,12 158,42 +11,30 - Prognosis of USDA as of Machc 10, Table 5. Prognosis of USDA on world carry-over stocks, by main exporting-importing countries, million tons. 2009/ / / / /14* Difference (2013/ /13) USA 26,55 23,46 20,21 19,54 15,18-4,36 Argentina 2,337 4,107 0,735 0,290 1,74 +1,45 Australia 5,6 8,3 7,04 4,24 4,92 +0,68 Canada 7,74 7,36 5,93 5,05 9,84 +4,79 EU 16,13 11,67 13,81 10,07 10,71 +0,64 Russia 14,72 13,74 10,89 4,95 6,02 +1,07 Kazakhstan 2,36 2,88 6,38 2,93 3,08 +0,15 Ukraine 5,00 3,34 5,16 2,17 3,05 +0,88 China 54,42 59,09 55,94 53,96 57,68 +3,72 Total: 201,71 199,23 199,49 175,84 183,73 +7,90 - Prognosis of USDA as of March 10,
6 Table 6. Prognosis of USDA for import, by main exporting-importing countries, million tons. 2009/ / / / /14* Difference (2013/ /13) EURASIA Russia 0,164 0,089 0,55 1,17 0,5-0,67 EU 5,52 4,71 7,37 5,3 4,0-1,3 Turkey 3,22 3,52 4,4 3,3 4,0 +0,7 Uzbekistan 1,67 1,61 2,69 1,86 1,9 +0,04 NORTH AFRICA Egypt 10,5 10,6 11,65 8,3 10,5 +1,7 Algeria 5,17 6,44 6,35 6,2 6,7 +0,5 Morocco 2,30 4,02 3,21 3,8 2,2-1,6 MIDDLE EAST Saudi Arabia 1,91 1,74 2,90 1,95 3,2 +1,28 Afghanistan 2,5 2,0 2,2 1,6 2,0 +0,4 Iran 3,65 0,35 2,7 5,55 6,0-0,45 Iraq 3,90 3,63 3,79 3,9 3,4-0,5 SOUTH-EAST ASIA China 1,39 0,93 2,93 2,96 8,5 +5,54 Bangladesh 3,35 3,95 2,01 2,7 3,3 +0,6 Indonesia 5,4 6,6 6,5 7,1 7,2 +0,1 Philippines 3,2 3,2 4,1 3,6 3,4-0,2 AMERICA Brazil 7,16 6,69 7,05 7,54 7,5-0,04 Total: 135,37 134,18 153,76 147,12 158,42 +11,3 - Prognosis of USDA as of March 10, Dynamics of world prices Evaluating condition at world market, according to information of International Food Policy Research Institute, it should be noted that dynamics of world prices for grain is determined by the largest world exporters and importers: USA, Canada, Australia, Argentina, EU, China, India, Pakistan, and Japan. Increase of world prices for wheat is due to dynamically developing countries of South-East Asia not possessing sufficient land resources satisfying increasing demand for world market resources. One of the main factors influencing wheat price is natural and climatic conditions. Fall in wheat price in UA at SWOT Chicago stopped before February 10 and turned to growth. In Europe fall of wheat quotations continued. Wheat in USA from February 10 to April 1 increased by 17.2 %, in Paris MATIF by 8%. Table 7. Dynamics of price quotation for wheat, from January 10 to February 7 (in dollars per ton). 10.Jan 20.Jan 10.Feb 20.Feb 26.Feb 10.Mar 20. Mar 02.Apr SWOT - Chicago 209,06 206,95 214,85 226,42 220,45 236,99 258,73 245,9 MATIF - Paris 264,86 258,68 265,68 273,6 273,76 287,17 292,75 284,1 6
7 Diagram 2. Price environment. Futures: results of stock trading at world commodity exchanges , ,5 286, ,3 282, , ,4 238, ,8 228, , , , CBOT-Chicago MATIF-Paris T able 8. Cash market (wheat): Origin Wheat quality Price ($/ton) Change +/ USA (Gulf of Mexico) FOB SRW2 (soft, red grained, winter, 2 nd class) USA (Gulf of Mexico) FOB HRW (hard grained, winter) EU (France, Rouen port) FOB FCW1 (milling) Australia FOB Milling ASW Russia (Novorossiysk port) FOB Food 12,5% Russia (Azov port) FOB Food 11,5% Ukraine (Black sea ports) FOB Food 12,5% Source Food corporation NC JSC 1.5 Situation with grain provision in main countries importing Kazakhstan grain For the period from July 1, 2013 to February 20, 2014 about 5.7 million tons of grain crops and flour in grain equivalent were exported from Kazakhstan that is 25% more than in the relevant period of the last season. According to the Ministry of agriculture of the Republic of Kazakhstan, grain exporting for 2013/2014 marketing year will amount 9 million tons. Kazakhstan supplies grain mainly by railway. Caspian Aktau sea port in the west of Kazakhstan can transship thousand tons of grain in year only. Main direction of Kazakhstan grain export are the traditional markets neighbors for Central Asian and the Caspian. 7
8 Table 9. Dynamics of Kazakhstan grain and flour exporting. August, September, Trade classification. Exporting thousand thousand country tons tons October, thousand tons November, thousand tons December, thousand tons Total grain and flour in grain equivalent Including flour , Including wheat and meslin Total CIS Including Azerbaijan Uzbekistan Tajikistan Kyrgyzstan Remote countries Including Iran Georgia Turkey Afghanistan Sweden China UAE Germany 18 Barley (total) Source И Kazakh-Zerno information agency 8
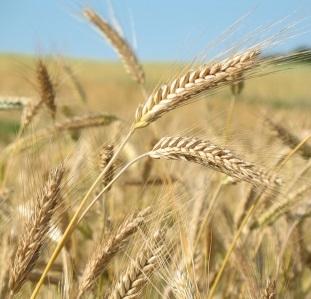
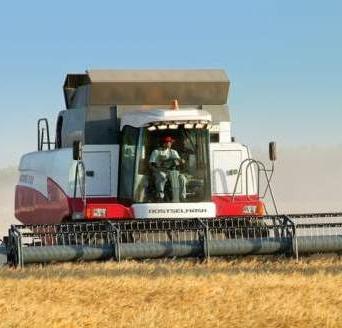
9 2. DOMESTIC MARKET Main industry of Kazakhstan cropping is grain growing. In recent year total crops of grain take over 80% of arable area for agricultural crops. Natural and climatic conditions of northern, north-eastern and significant part of western and central regions of the country are suitable for growing of grain and legume crops and, firstly, food wheat with high content of gluten, high-demanded at world markets as improver of baking capacities of flour. In this regard, grain production is one of strategic industries of the republic, on which depends food security of the country, revenues and employment of population, development of related industries (livestock, poultry breeding, food and processing industry). 2.1 Grain production in the Republic of Kazakhstan According to the Agency of RK for statistics, wheat yield in 2013 in the republic amounted at average to 10.8 centners from hectare. Compared with yield of 2012 there is an increase by 36.7 or 2.9 centner from hectare. The most indicator is shown in South-Kazakhstan region, when yield achieved 19.4 and in Almaty regions 18.2 centners from hectare (Zhambyl region 16.5, East-Kazakhstan 14.2) table 10. Table 10. Wheat yield, centner from one hectare * Republic of Kazakhstan 11,9 7,3 16,6 7,9 10,8 Akmola 10,9 5,1 15,5 7,0 10,0 Aktobe 6,4 2,4 7,4 2,8 5,2 Almaty 21,4 18,0 19,0 16,3 18,2 Atyrau ,9 West-Kazakhstan 5,8 4,4 9,5 5,8 7,1 Zhambyl 21,9 14,6 15,4 8,6 16,5 Karaganda 7,8 4,6 10,8 6,5 11,5 Kostanay 11,0 7,3 18,3 6,1 9,6 Kyzylorda 13,2 12,4 7,8 4,7 7,1 South-Kazakhstan 19,3 14,7 14,1 10,9 19,4 Pavlodar 13,9 5,7 7,6 3,8 12,0 North-Kazakhstan 14,4 9,6 20,9 11,5 12,4 East-Kazakhstan 16,0 9,8 10,7 10,9 14,2 Astana city 11,4 6,8 14,2 6,1 7,4 Almaty city 10, * Data about grain and legume crops are adjusted as of by results of preliminary calculation of grain balance for Source: Agency of RK for statistics In Kazakhstan at average million tons of grain are producing, that gives the country a right to take the third place in CIS after Russia and Ukraine. According to the Agency of RK for statistics, gross collection of grain crops on the republic in 2013 amounted to thousand tons, including wheat thousand tons, with increase by 41.7% compared with 2012 ( thousand tons) 9
10 (table 11). At that a significant increase of gross production in 2013 was in relation to dry 2012 and is significantly less than in yielding 2009, Table 11. Gross collection of grain crops including wheat, thousand tons * Republic of Kazakhstan , , , , ,1 including: wheat Republic of Kazakhstan , , , , ,8 Akmola 4 413, , , , ,8 Aktobe 328,1 59,7 376,1 72,8 176,5 Almaty 425,1 399,6 405,5 305,7 305,9 Atyrau ,0 West-Kazakhstan 126,3 65,1 256,2 101,1 145,6 Zhambyl 248,1 182,4 183,6 84,3 163,5 Karaganda 476,9 261,3 611,4 332,2 593,2 Kostanay 4 626, , , , ,9 Kyzylorda 9,3 6,3 5,2 2,7 2,5 South-Kazakhstan 290,6 244,1 234,5 137,2 308,5 Pavlodar 643,5 194,2 311,1 123,7 470,3 North-Kazakhstan 4 836, , , , ,0 East-Kazakhstan 626,8 316,6 380,2 376,6 507,7 Astana city 0,4 0,2 0,3 0,4 0,4 Almaty city 0, * Data about grain and legume crops are adjusted as of by results of preliminary calculation of grain balance for Source: Agency of RK for statistics. 2.2 Price environment Average prices for wheat of 3 rd class in main countries producing food wheat. Diagram 3. Dynamics of average prices for wheat of 3 rd in Russia, Ukraine and Kazakhstan, US dollars/ton (EXW) July August 2013 Source Food corporation NC JSC September 2013 October November December 2013 Russia Kazakhstan Ukraine January February

11 Diagram 4. Average market prices for wheat of 3 rd class for the period from 2004 to 2013 in the Republic of Kazakhstan Source Kazagromarketing JSC Table 12. Export prices for grain crops and flour in dollars per ton, including VAT 0 % (exelevator) as of Station Petropavlovsk st. (ЮУЖД) Wheat 3 class, with gluten Wheat 4 class Wheat 5 class Barley 23-24% 27-30% - 2 class Top grade 1 sort 2 sort Sale flour Sale Sale Sale Sale Sale Sale Sale Supply terms DAP Sary-agash st DAP Lugovaya st DAP Tobol st DAP Aktau port FOB Bekabad st СРТ Khairaton st СРТ Kudukli st СРТ Sarakhs st Source Kazakh-Zerno information agency 2.3 Grain balance As of March 1, 2014, according to the Agency of RK for statistics, in households of Kazakhstan volume of accounting stock of grain crops amounted to thousand tons. Compared with January 1, 2014 volume of grain crops stock was thousand tons. In result, for two months, in the process of domestic consumption, export and losses volume of grain crops in the republic decreased by thousand tons, or by 20.2% (table 13). Compared with the last year, grain in the republic is a little less. As of March 1, 2013 grain stock amounted to thousand tons that is 4.2% or thousand tons more that in the current year. For the last year period stock for two months decreased by thousand tons, or 16.5%. 11
12 Table 13. Grain availability in the republic Region Akmola region Aktobe region Almaty region Atyrau region East-Kazakhstan region Zhambyl region West-Kazakhstan region Karaganda region Kostanay region Kyzylorda region Mangistau region Pavlodar region North-Kazakhstan region South-Kazakhstan region Almaty city Astana city Total in RK Current prices for elevator and mill services The following are tariffs for elevator and mill services by regions as of April 1, 2014 (according to Kazagromarketing JSC). Table 14. Tariffs for elevator services Cities Tariffs for storage, $/ton/ month Elevators (dollar course: 182,06 KZT/USD) Underworkin g, Acceptance by vehicle, $ Shipment by vehicle, $ Shipment by railway vehicle,$ ($/ton) Kostanay 1,40 0,20 1,80 2,60 5,70 Petropavlovsk 1,49 0,23 1,25 3,02 4,61 Karaganda 1,81 0,63-4,37 -* 2,68 3,02 Pavlodar 1,50 0,60 1,40 1,40 2,90 Kokshetau 1,80 0,2-2,1 1,60 4,00 4,30 Ust-Kamenogorsk 1,02 2,04 1,19 1,00 1,80 Taldykorgan 1,50 - * 1,30 2,20 3,20 * not producing. Table 15. Tariffs for mill services Cities Wholesale price for flour of 1st sort (in tenge per 1 kg) Mills (dollar course: 182,06 KZT/USD) Milling Flour output, % Tariff for milling ($/ton) Kostanay * Petropavlovsk ,13 Karaganda ,00 Pavlodar * Kokshetau * Ust-Kamenogorsk ,70 Taldykorgan ,00 * not producing. 12
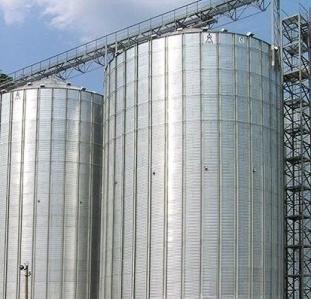
13 2.5 Existing capacities of grain storage Total existing capacity of grain storage in the republic is about 24.5 million tons, including licensed grain-collecting stations 13.9 million tons, agricultural producers 10.6 million tons. From assets of KazAgro Holding for elevators were commissioned with total storage capacity over 458 thousand tons, including in thousand tons. Capacities existing in the republic are sufficient to ensure storage of grain in years with average yield, but insufficient in yielding years. Furthermore, material and technical base of the most of grain-collecting stations is outwear and needs reconstruction. To develop storage infrastructure and export of grain products it is provided to commission additional storage capacities for 3.5 million tons, including it is planning to create 350 thousand tons of capacities for grain transshipment through Food corporation NC JSC on main export directions. Table 16. Prognosis of expansion of grain storage capacities, thousand tons Region grain produc tion progno sis by 2020 grain producti on prognosi s in yielding years Grain storage capacities availability total Grain collecti ng station including: Agricu ltural produc ers Insuffici ent capacitie s of grain storage Construction prognosis Akmola ,1 5657,1 3789,7 1867, Aktobe 423,1 542,3 912, , Almaty 1293,8 1643,6 728,4 243,2 485,2 915, Atyrau 0,9 1,3 1,3 0 East-Kazakhstan 848,4 1069,7 1137,2 574,8 562,4-67,5 0 Zhambyl 458,3 584, , West-Kazakhstan 349,8 444,5 790,6 624,8 165,8-346,1 0 Karaganda 662,1 843,3 599,1 202,8 396,3 244, Kyzylorda 323,9 364,5 275,8 223,7 52,1 88, Kostanay 5166,5 6635,2 6576,5 3880,3 2696,2 58, Mangistau Pavlodar 519,4 649,8 875,5 185,3 690,2-225,7 0 North-Kazakhstan 5468,9 7073,4 6003,7 3409,8 2593,9 1069, South-Kazakhstan 443,6 565,3 73,9 73,9 491, On the republic 21067, , , , ,8 2951, Data of Master plan Stabilization of grain market placed at site f the Ministry of agriculture of RK as of Export of Kazakhstan grain High qualitative characteristics of Kazakhstan wheat facilitated to positioning of Kazakhstan as one of the leading world exporters of grain and flour. Kazakhstan is included into ten leading suppliers of wheat to world market, and for flour export takes a leading position in the world. Thus, for period of an annual average volume of grain export with account of flour in grain equivalent amounted to 8.2 million tons or increased compared with the previous five-year period by 2.5 million tons or 42.6%, consolidated currency revenue from grain and flour sale for export amounted to more than 8.8 billion US dollars with increase to level of in 2.2 times Tota l for 8 year s 13
14 Diagram 5. Dynamics of grain and flour export, thousand tons grain export flour export (in grain equivalent) Table 17. Information about grain shipment for export by months, thousand tons Months Grain * January 1015,6 1188,8 246,3 432,8 144,9 922,5 280,9 457,8 February 636,6 1091,3 220,7 400,1 99,5 768,0 387,0 504,7 March 588,5 922,5 214,6 418,8 96,1 925,1 279,5 559,4 April 592,5 681,3 313,0 464,3 100,8 863,0 440,3 May 585,3 91,5 326,5 719,7 125,2 1094,3 376,9 June 429,4 37,8 364,8 484,5 91,3 844,7 504,8 July 297,4 31,9 222,9 351,8 92,9 593,1 335,1 August 97,6 12,7 229,9 391,7 187,2 445,1 227,5 September 247,0 354,6 266,3 458,8 208,7 392,8 418,0 October 586,8 417,6 346,5 577,3 582,0 371,6 671,0 November 758,0 423,9 351,6 390,6 804,9 344,4 713,4 December 1046,1 391,7 474,0 401,8 960,0 296,9 756,4 Total 6880,8 5645,6 3577,1 5492,2 3493,5 7861,5 5390,8 1521,9 TOTAL export of grain and flour in grain equivalent 8958,4 8220,7 6788,2 8773,3 6210, ,6 7962,5 2148,3 * as of March 30 according to Kazakhstan TemirZholy NC JSC" Table 18. Information about flour shipment for export by months, thousand tons. Flour Months * January 144,2 125, , ,7 125,1 139,3 February 144,5 135,5 132,6 187,8 88,4 246,2 111,4 154,4 March 119,1 93,4 96,4 151,4 93,7 232,1 98,7 144,8 April 121,4 137,8 185,6 205,2 87,3 190,9 143,4 May 110,8 177,4 192,1 220,3 97,3 251,3 138,8 June 128,8 103,7 153,7 263,8 94,9 185,6 128,7 July 115,2 129,9 142,5 193, ,3 158,3 August 76,9 140,3 148,7 202,1 165, September 82,8 143,6 214,1 211,2 176,9 127,8 138,1 October 144,4 237, ,2 219,7 228 November 148,5 218,7 302,7 163,7 335,9 170,6 242,7 December 117,7 158,5 246,4 162,4 257,4 126,8 160 Total 1454,3 1802,6 2247,8 2296,8 1901, ,2 438,5 * as of March 30 according to Kazakhstan TemirZholy NC JSC" 14
15 Table 19. Information about grain and flour shipment for export for marketing years, thousand tons. Marketing year grain flour in terms of grain grain and flour in terms of grain Share of flour export in total amount of grain export 2007/2008 MY 7046,1 1459,2 2084,6 9130,7 22,8 2008/2009 MY 3318,3 1953,3 2790,4 6108,7 45,7 2009/2010 MY 4811,4 2510,1 3585,9 8397,3 42,7 2010/2011 MY 3229,8 1656,7 2366,7 5596,5 42,3 2011/2012 MY 8253,3 2644,1 3777, ,6 31,4 2012/2013 MY 4713,3 1702,3 2431,9 7145,2 34,0 2012/2013 MY * 2853,8 1118,4 1597,7 4451,5 35,2 2013/2014 MY * 3724,2 1218,3 1740,4 5464,6 31,5 * as of March 30 according to Kazakhstan TemirZholy NC JSC MY- from July 1 to June 30 In 2013 Food corporation NC JSC exported 10 thousand tons of grain to China. In 2014 it is expecting to increase export volume till 30 thousand tons of grain. 15

16 3. CURRENT SITUATION IN GRAIN INDUSTRY For the last five years grain producers survived two high-yield (2009, 2011) and two dry years (2010, 2012). These periods coincided with financial crisis and devaluation of 2009, which from one part resulted in rise in price of borrowed funds for agricultural producers, from other reduced availability of long-term loans. At evaluation of financial condition of grain companies it is necessary to account specifics of grain production. Attraction of borrowed funds in many cases is implementing for short-term period and is calculating for one production cycle. Thus, loan repayment received before sowing campaign is implementing in the period of yield sale before the next sowing for which a new loan is attracted. Moreover, due to shortage of long-term funding sources at second-tier banks, some agricultural producers purchased machines, modernized production capacities on account of short bank loans, accounting with refinancing in future. Such practice of grain production financing enforces risks of deterioration of grain producers financial condition at bad yield and/or unprofitable price conjuncture. As a primary result of unfavorable set of circumstances, many grain producers turn out to be reloaded with dear loans. According to information of the National bank of RK, past due debt on bank loans in agriculture by results of 2013 amounted to 35.1 billion tenge (diagram 6). Diagram 6. Past due debt on bank loans in agriculture, million tenge at period end * according to information of the National bank of RK As diagram shows critical phase of financial crisis, devaluation and high yield breaking down prices for grain, in 2009 resulted in sharp increase of past due debt 77% of which were short-term loans. As banks reduce financing of grain producers for working capital financing, by the instruction of the Government KazAgro Holding from temporarily free funds of the National Fund directed for spring sowing and harvesting financing 69 billion tenge and 55 billion tenge for grain purchase, that allows stabilize situation on the market and do not allow sharp deterioration of financial condition of agrarians. In the subsequent years for lending of sowing and harvesting campaigns the Holding was allocated budget loans. 16
17 It shall be noted that the mentioned specialty of long production cycle from sowing to grain yield conditions possibility of borrowers to repay past due debt appearing from bad market conjuncture, from the yield of the next year. It is shown on example of more that twofold decrease of past due debt level in 2010 compared with 2009 when agrarians could not repay debt in 2009 due to sharply broken prices, and made it in 2010 when less yield resulted in significant increase in prices and, accordingly, solvency of grain producers. There is an opportunity that statistics reflects the situation with past due debt not in full in relation to difference of borrowers categories classification (is not to be confused with loans classification) as loans in grain industry are attracted not only by agricultural formations, but by grain traders, which activity is classified as trading. In whole high loan load of grain companies complicates granting of new financial resources for operational activity and production development. In this situation one of instrument to solve the problem is program of financial recovery of agribusiness entities under the program Agribusiness Financial recovery of agribusiness entities provided that they will be included into the program, supposes subsidizing of fee rates by means of decrease till not more 7% per annum on loan and/or leasing obligations for whole period of their validation, extension of terms for obligations repayment for period not more than 9 years. Thanks to loan long term the grain producers after financial recovery, an average annual loan load hectare of cultivated area will decrease that allows agrarians receive in ownership more revenues from yield sale and direct it to expansion of production, renewal of agricultural machines, construction and modernization of grain stores, etc. In 2014 practice of financing spring sowing and harvesting through KazAgro Holding will be continued. For these purposes the Holding was allocated a budget loan in 40 billion tenge with repayment term till December 20, Besides, own funds of the Holding subsidiary companies will be used. To provide scale reach of agribusiness entities and availability of funds the loan products will be implemented similar to programs of 2013: - lending under commercial banks guarantees and grin receipts; - forward purchase of grain (through spring purchase of grain with delay of implementation till autumn) under guarantees of social-entrepreneurship corporations, having no overdue liabilities before Food corporation NC JSC; - financing of agribusiness entities through loan associations, system of microloan organizations. Moreover, given the necessity to expand availability of financial resources, KazAgro Holding in the current year plans to introduce additional loan products of agrarians financing through commercial banks. All together prognostic volume of spring sowing and harvesting financing through KazAgro Holding from all sources is evaluated in 61.6 billion tenge, that allows reach about 6.1 million ha of cultivated area. 17
18 Moreover, from 2014 agrarians will have an opportunity to lend in banks on preferential terms thanks to new program of the Ministry of agriculture for subsidizing fee rates on loans. Also the programs of the Ministry of agriculture of RK and local executive bodies will be continued to implement for subsidizing of purchasing mineral fertilizers, fuel and inventories, insurance of planted areas. 18
19 4. EXPERT EVALUATION In whole, condition of grain industry in Kazakhstan is stable. Traditional importers of Kazakhstan grain due to natural and climatic conditions are not provided with grain of own production and in long-term perspective preserve demand for Kazakhstan grain. Besides, stable dynamics of population growth in the countries of the Central Asia will stimulate demand growth for Kazakhstan grain. Good perspectives for Kazakhstan exporters have Chines market, where according to statistics in 2013 there was exported 124 thousand tons of grain. Thanks to significant investment and technologies inflow to grain industry, for the last years a stable production basis was created. Notwithstanding periodic lean years, in whole profitability of grain production for the last periods was at the level of 52-65%, at expenses cost per 1 ha of planted area in thousand tenge. It preserves in long-term perspective an investment attraction of grain industry. Current problem of high debt ration of agricultural formations shall decrease thanks to program of financial recovery. Sue to reduce of annual average payments on loans after financial recovery procedures it is expected increase of free cash resources remaining in grain companies that will stimulate investments to production modernization and, as consequence, facilitate to labor productivity growth. KazAgro Holding supposes it reasonable for grain companies to invest to construction and modernization of grain stores, that allows sale grain in period of higher prices and so increase business profitability. In its turn, KazAgro Holding may give for projects implementation on construction and modernization of grain stores long-term loan resources at fee rate 6% per annum. Besides, from 2014 the program of investment subsidizing will start which allow recompense part of expenses for creation of grain storage capacities and so to accelerate project pay-back. Separately we shall note currency devaluation in February 2014 which as it is expected positively affects export oriented grain industry. Large grain companies may receive additional liquidity for loans maintenance, without tying in to foreign currencies. Especially, it regards to loans of KazAgro Holding companies. 19
20 Information containing in this review is actual for the moment of research, and bears information character only and is not a proposal or recommendation for any investment and other business decisions. Information and opinions containing in this review are based on information received from public sources, published at sites of exchange, ministries, Agency of RK for statistics, central banks, information agencies and other organizations, and own data of KazAgro Holding JSC. KazAgro Holding JSC does not bear responsibility for results of use materials, data, opinion given in the review, and resulting in losses, missed profit or other negative effects including connected with errors, differences in data, evaluations. 20
THIS REPORT CONTAINS ASSESSMENTS OF COMMODITY AND TRADE ISSUES MADE BY USDA STAFF AND NOT NECESSARILY STATEMENTS OF OFFICIAL U.S.
 THIS REPORT CONTAINS ASSESSMENTS OF COMMODITY AND TRADE ISSUES MADE BY USDA STAFF AND NOT NECESSARILY STATEMENTS OF OFFICIAL U.S. GOVERNMENT POLICY Required Report - public distribution Date: GAIN Report
INTERNATIONAL GRAINS COUNCIL
 INTERNATIONAL GRAINS COUNCIL GRAIN MARKET REPORT www.igc.int GMR No. 420 2 April 2012 WORLD ESTIMATES million tons 08/09 09/10 10/11 11/12 12/13 est forecast proj 23.02 02.04 02.04 WHEAT Production 685
Market situation Cereals. AGRI C 5 Advisory Group on Cereals, Oilseeds and Proteins 30 March 2012
 Market situation Cereals AGRI C 5 Advisory Group on Cereals, Oilseeds and Proteins 30 March 2012 World cereal balance : IGC 1000 900 World Ending Stocks of which 8 major exporters World Production World
MARKET OUTLOOK REPORT Volume 2 Number 1
 MARKET OUTLOOK REPORT Volume 2 Number 1 WHEAT: SITUATION AND OUTLOOK April 1, 2010 Prepared by: Market Analysis Group Grains and Oilseeds Division Food Value Chain Bureau Market and Industry Services Branch
Monitoring production of main producing countries
 Monitoring production of main producing countries Bruno Buffaria HoU Arable Crops European Commission Directorate General for Agriculture and Rural Development AGRISAT workshop, 13/10/2010 13-14 Oct 2010
Improvement in global production and a gradual recovery in ending stocks over the past three years have allowed the global wheat market to balance at
 Wheat Improvement in global production and a gradual recovery in ending stocks over the past three years have allowed the global wheat market to balance at much lower prices than in the 2007/08 to 2012/13
Low prices last year induced a decline in global wheat area, and as a result production increased less than 1%, helping to support an expected price i
 Wheat Low prices last year induced a decline in global wheat area, and as a result production increased less than 1%, helping to support an expected price increase in 2017/18. It is expected that prices
Agriculture Commodity Markets & Trends
 Agriculture Commodity Markets & Trends Agenda Short History of Agriculture Commodities US & World Supply and Demand Commodity Prices Continuous Charts What is Contango and Backwardation Barge, Truck and
MARKET OUTLOOK REPORT Volume 1 Number 1
 MARKET OUTLOOK REPORT Volume 1 Number 1 WHEAT: SITUATION AND OUTLOOK April 17, 2009 Prepared by: Market Analysis Group Grains and Oilseeds Division Food Value Chain Bureau Market and Industry Services
World Grains and Oilseeds: Recent Trends and Perspectives. Agribusiness in Argentina A seminar on Investment Opportunities London 14 December 2011
 www. IGC 2011 World Grains and Oilseeds: Recent Trends and Perspectives Agribusiness in Argentina A seminar on Investment Opportunities London 14 December 2011 Darren Cooper Senior Economist International
Total Net Exports 97, , , , , , , , , , ,001
 Wheat Trade Net Exporters Argentina 2,495 7,623 8,013 8,368 8,651 8,813 8,828 8,866 9,026 9,218 9,539 Australia 14,925 16,281 16,750 16,816 17,382 17,549 17,671 17,743 17,952 18,157 18,384 Canada 18,100
Developments and challenges in commodity markets: current situation and outlook- Agricultural Commodities
 Multi-year Expert Meeting on COMMODITIES AND DEVELOPMENT 23-25 March 211, Geneva Developments and challenges in commodity markets: current situation and outlook- Agricultural Commodities by Mr. Etsuo Kitahara,
Wednesday July 11, 2012 World Ag Supply & Demand Report
 World Ag Supply & Demand Report U.S. 2011/12 Old Crop Corn is neutral Global Old Crop Corn is neutral USDA estimates the 2011/12 U.S. corn carryout at 903 million bushels, up from 851 million bushels from
BLACK SEA OUTLOOK IAOM 2012 Abu Dhabi. Swithun Still
 BLACK SEA OUTLOOK IAOM 2012 Abu Dhabi Swithun Still 2 KEY QUESTIONS Black Sea Wheat 2012-2013 1. Due to the drought last summer Exports are sharply reduced for the second half of this season. How much
Global Agricultural Supply and Demand: Factors contributing to recent increases in food commodity prices
 Global Agricultural Supply and Demand: Factors contributing to recent increases in food commodity prices Ron Trostle Economic Research Service U.S. Department of Agriculture Agricultural Markets and Food
A Ten Year Strategic Outlook for the Global Flexible Plastic Packaging Market. Sample pages. Commodity Inside Ltd
 A Ten Year Strategic Outlook for the Global Flexible Plastic Packaging Market Sample pages Chapter 1- Executive summary 1.1 Changes in the global flexible plastic packaging industry 1.2 Cost effectiveness
Kazakhstan s Competitiveness in the Export of Flour Products
 BIOSCIENCES BIOTECHNOLOGY RESEARCH ASIA, April 2014. Vol. 11(1), 365-370 Kazakhstan s Competitiveness in the Export of Flour Products Gulnar Joldasbayeva and Urzada Esaydar Gulnar Joldasbayeva is Chief
March 10, Dear Subscriber:
 March 10, 2014 Dear Subscriber: We will be adding material to this shell letter after the report is released on March 10 at 11:00 a.m CST. Be sure to click back on the link often for the latest information.
Factors Affecting Global Agricultural Markets. Fred Giles Director, Agricultural Trade Office USDA / SP
 Factors Affecting Global Agricultural Markets Fred Giles Director, Agricultural Trade Office USDA / SP Factors Impacting Global Agricultural Markets Commodity Prices Energy Prices Value of the U.S. Dollar
REGIONAL WHEAT MARKET FUNDAMENTALS Central Asia. November 2016 WHEAT CONSUMPTION AND PRODUCTION IN CENTRAL ASIA
 kg/capita/year kg/capita/year REGIONAL WHEAT MARKET FUNDAMENTALS Central Asia November 2016 WHEAT CONSUMPTION AND PRODUCTION IN CENTRAL ASIA Wheat is by far the dominant staple in the Central Asia region
Recommendations to Sustainable Development of Wheat Sector in Kazakhstan
 Recommendations to Sustainable Development of Wheat Sector in Kazakhstan Astana 2014 Contents List of acronyms/abbreviations... 3 Introduction... 4 General characteristics of production and market of wheat...
REGIONAL SUPPLY AND MARKET OUTLOOK Central Asia. October 7, 2016 KEY MESSAGES
 MT (thousand) REGIONAL SUPPLY AND MARKET OUTLOOK Central Asia October 7, 216 KEY MESSAGES Wheat production in Central Asia for the 216/217 marketing year is similar to 215/216 and slightly above the five-year
June 12, USDA World Supply and Demand Estimates
 June 12, 2018 - USDA World Supply and Demand Estimates Corn Market Reaction: July 2018 corn futures closed up 10 ¼ cents at $3.77 ½ with a trading range for the day of $3.67 ¼ to $3.79 ½. December 2018
Food Markets Wheat & Maize Outlook 2018/19
 Food Markets Wheat & Maize Outlook THIRTEENTH SESSION OF THE AMIS GLOBAL FOOD MARKET INFORMATION GROUP FAO Headquarters, Rome 3-4 May 2018 Presentation Outline I. Macro conditions & food markets II. Market
August 10, USDA World Supply and Demand Estimates
 August 10, 2017 - USDA World Supply and Demand Estimates Corn Market Reaction: September 2017 corn futures closed down 15 cents at $3.57 ¼ with a trading range for the day of $3.56 ½ to $3.75 ½. December
June 9, USDA World Supply and Demand Estimates
 June 9, 2017 - USDA World Supply and Demand Estimates Corn Market Reaction: July 2017 corn futures closed up 2 cents at $3.87 ¾ with a trading range for the day of $3.80 ¾ to $3.89 ½. December 2017 corn
United Nations Conference on Trade and Development
 United Nations Conference on Trade and Development 1th MULTI-YEAR EXPERT MEETING ON COMMODITIES AND DEVELOPMENT 25-26 April 218, Geneva Assessing the recent past and prospects for grains and oilseeds markets
Total Net Exports 105, , , , , , , , , , ,153
 Wheat Trade Net Exporters Argentina 7,495 6,454 7,206 6,988 7,144 7,205 7,343 7,492 7,737 7,766 7,711 Australia 18,900 20,066 20,021 20,047 20,254 20,486 20,827 21,027 21,262 21,494 21,619 Canada 17,600
2014 Wheat Situation. Crop Outlook & Durum Forum November 2014
 2014 Wheat Situation Crop Outlook & Durum Forum November 2014 World Wheat 2014 Impact Issues RECORD CROP BUT SHORTAGE OF QUALITY BIG U.S. CORN CROP No shortage of sellers on world wheat market Inland rail
May 10, USDA World Supply and Demand Estimates
 May 10, 2018 - USDA World Supply and Demand Estimates Corn Market Reaction: July 2018 corn futures closed down ¾ cent at $4.02 with a trading range for the day of $4.00 to $4.07. December 2018 corn futures
THE FUTURE OF GLOBAL MEAT DEMAND IMPLICATIONS FOR THE GRAIN MARKET
 1 THE FUTURE OF GLOBAL MEAT DEMAND IMPLICATIONS FOR THE GRAIN MARKET Mitsui Global Strategic Studies Industrial Studies Dept. II Yukiko Nozaki In the 2000s, the growing demand for meat pushed up the demand
World Agricultural Outlook Board Interagency Commodity Estimates Committee Forecasts. Lockup Briefing April 9, 2014
 World Agricultural Outlook Board Interagency Commodity Estimates Committee Forecasts Lockup Briefing World Wheat Production Country or Region Million Tons World 656.5 712.5 8.5 United States 61.7 58.0-6.0
World Agricultural Outlook Board Interagency Commodity Estimates Committee Forecasts. Lockup Briefing June 11, 2014
 World Agricultural Outlook Board Interagency Commodity Estimates Committee Forecasts Lockup Briefing World Wheat Production Country or Region 2014/15 Million Tons World 714.0 701.6 0.7-1.7 United States
Wheat Outlook. Economic Research Service September 16, Approved by the World Agricultural Outlook Board
 Wheat Outlook Economic Research Service September 16, 008 U.S. Department of Agriculture WHS-08ht text and tables Approved by the World Agricultural Outlook Board Larger Production and Beginning Stocks
Agricultural Outlook Forum 2003 Presented: Thursday, February 20, 2003 THE FUTURE OF UKRAINE S GRAIN SECTOR
 Agricultural Outlook Forum 2003 Presented: Thursday, February 20, 2003 THE FUTURE OF UKRAINE S GRAIN SECTOR Leonid P. Kozachenko President of Ukrainian Agrarian Confederation Advisor to Prime Minister
Current Market Situation and Outlook*
 Current Market Situation and Outlook* Abdolreza Abbassian, AMIS Secretary Trade and Markets Division Economic and Social Development Department Food and Agriculture Organization of the United Nations,
Investor presentation September 2011
 Investor presentation September 2011 Content Samruk-Energy at a glance Review of Kazakhstan electricity market Operational overview and performance Financial overview and performance Strategy Key risks
September 12, USDA World Supply and Demand Estimates
 September 12, 2018 - USDA World Supply and Demand Estimates Corn Market Reaction: December 2018 corn futures closed down 14 ¼ cents at $3.52 ½ with a trading range for the day of $3.50 ¾ to $3.66 ¼. December
Market situation. Projection highlights CEREALS
 3. COMMODITY SNAPSHOTS Market situation CEREALS Global supplies of major cereals continued to exceed overall demand, leading to a significant build-up of inventories and much lower prices on international
Power system of the Republic of Kazakhstan
 State regulation of tariffs and prices in the fields of electricity and gas supply Azamat Maitiyev Committee on Regulation of Natural Monopolies, Protection of Competition and Consumer Rights under the
Sugar: World Markets and Trade
 United States Department of Agriculture Foreign Agricultural Service Sugar: World Markets and Trade May 218 Elevated in 218/19 Keeps Stocks High, Pressuring Prices Ending Stocks 2 18 16 14 12 1 8 6 4 Other
Food Industry of the Republic of Kazakhstan
 JSC Rating Agency of the Regional Financial Center of Almaty 136 Dostyk ave., 9 th floor, office 904, 050051 Almaty, The Republic of Kazakhstan Food Industry of the Republic of Kazakhstan Analytical service
AGRICULTURE IN KAZAKHSTAN: CURRENT SITUATION, PROBLEMS AND POSSIBLE SOLUTIONS Ainur Yesbolova
 AGRICULTURE IN KAZAKHSTAN: CURRENT SITUATION, PROBLEMS AND POSSIBLE SOLUTIONS Ainur Yesbolova CONTENT 1 General information 2 Main socio economic indicators 3 Main indicators of agriculture 4 SWOT analysis
Grain: World Markets and Trade
 e 218 Department of Agriculture Foreign Agricultural Service Grain: World Markets and Trade 3 28 26 24 Southeast Asia and Sub-Saharan Africa Now Top Wheat Importers MMT 22 2 18 16 14 12 1 Southeast Asia
2012 Farm Outlook. Highlights
 2012 Farm Outlook Office of the Chief Economist USDA Highlights A promising spring planting was followed by historic drought. Record high commodity prices followed. Farm incomes are expected to be near
IGC GRAINS CONFERENCE 2012: London - 7 June for futher details see INTERNATIONAL GRAINS COUNCIL GRAIN MARKET REPORT EXPORT PRICES
 IGC GRAINS CONFERENCE 2012: London - 7 June for futher details see www.igc.int INTERNATIONAL GRAINS COUNCIL GRAIN MARKET REPORT www.igc.int GMR No. 422 24 May 2012 WORLD ESTIMATES million tons 08/09 09/10
FOOD INDUSTRY OF KAZAKHSTAN
 FOOD INDUSTRY OF KAZAKHSTAN ALMATY, 2008 As of today the Kazakhstan s food industry is presented by 2330 functioning small, medium and large enterprises where the small business share is the largest one.
January 12, USDA World Supply and Demand Estimates
 January 12, 2018 - USDA World Supply and Demand Estimates Corn Market Reaction: March 2018 corn futures closed down 2 ½ cents at $3.46 ¼ with a trading range for the day of $3.45 ½ to $3.50. December 2018
World Agricultural Supply and Demand Estimates
 World Agricultural Supply and Demand Estimates Report of Interagency Commodity Estimates Committee Forecasts World Agricultural Outlook Board, Chairing Agency Economic Research Service Foreign Agricultural
Economic Research Service Situation and Outlook Report. Russian Wheat Exports Raised to a New Record, U.S. Exports Cut by 25 Million Bushels
 Economic Research Service Situation and Outlook Report WHS-18c March 12, 2018 Next release is April 12, 2018 Wheat Outlook Jennifer K. Bond, coordinator Olga Liefert Russian Wheat Exports Raised to a New
Vietnam. Grain and Feed Update. October 2012
 THIS REPORT CONTAINS ASSESSMENTS OF COMMODITY AND TRADE ISSUES MADE BY USDA STAFF AND NOT NECESSARILY STATEMENTS OF OFFICIAL U.S. GOVERNMENT POLICY Required Report - public distribution Vietnam Grain and
2016 Risk and Profit Conference General Session Speakers. GENERAL SESSION IV Grain Market Situation and Outlook
 2016 Risk and Profit Conference General Session Speakers GENERAL SESSION IV Grain Market Situation and Outlook Dan O Brien, Kansas State University Daniel O Brien was raised on a grain and livestock farm
May 12, Dear Subscriber: We will be adding material to this shell letter after todays reports are released at 11:00 a.m.
 May 12, 2015 Dear Subscriber: We will be adding material to this shell letter after todays reports are released at 11:00 a.m. Be sure to click back on the link often for the latest information. Whle today
April 9, Dear Subscriber:
 April 9, 2014 Dear Subscriber: We will be adding material to this shell letter after the report is released on April 9, 2014 at 11:00 a.m CST. Be sure to click back on the link often for the latest information.
Grain: World Markets and Trade
 Department of Agriculture Foreign Agricultural Service tember 218 Grain: World Markets and Trade EU Corn Imports to Rise Even Higher Million Metric Tons 2 18 16 14 12 1 8 6 4 2 Corn Imports (Oct-) USD/ton
Black Sea Grain: Export expansion, new markets, Outlook for 2014
 Black Sea Grain: Export expansion, new markets, 2000-2013. Outlook for 2014 Sergey Feofilov UkrAgroConsult Black Sea Grain Conference, April 17-18 2013 Black Sea Grain in the Global Markets Black Sea Wheat
Market Fundamentals. August October 2017
 Market Fundamentals August October 2017 1 Safe Harbor Statement & Disclosures This presentation includes forward-looking comments subject to important risks and uncertainties. It may also contain financial
Rice Market Situation and Outlook
 May 1 Rice Market Situation and Outlook THIRTEENTH SESSION OF THE AMIS GLOBAL FOOD MARKET INFORMATION GROUP FAO Headquarters, Rome 4 May 1 GLOBAL RICE PRODUCTION To grow by 1. percent to a fresh peak of
Cereals market situation. Committee for the Common Organisation of Agricultural Markets. 30 th August 2018
 Cereals market situation Committee for the Common Organisation of Agricultural Markets 30 th August 2018 Exchange Rates 2 Euro US Dollar exchange rate 3 Euro Argentine Peso and Brazilian Real exchange
FINANCING OF THE INNOVATIVE PROJECTS IN THE AGRO-INDUSTRIAL COMPLEX OF KAZAKHSTAN
 ~ 92 ~ ISSN 1728-3817.,..-.,.,, -.., -,. :,,..,..-.,.,, -.., -,. :,, -. UDC 338.436.33 JEL Q 18 B. Zhumanova, PhD in Economics, Associate Professor Kazakh University of Technology and Business, Republic
Global Sugar Consumption Expands While Production Stagnates
 United States Department of Agriculture Foreign Agricultural Service Sugar: World Markets and Trade Global Sugar Consumption Expands While Production Stagnates 180 Million Metric Tons, Raw Value 170 160
AUSTRALIA GRAINS INDUSTRY CONFERENCE SINGAPORE MICHAEL WHITEHEAD ANZ CLIENT INSIGHTS MARCH 2014
 AUSTRALIA GRAINS INDUSTRY CONFERENCE SINGAPORE MICHAEL WHITEHEAD ANZ CLIENT INSIGHTS MARCH 2014 AGENDA > 2 SECTION TOPIC 1. GRAIN & OIL SEED INDUSTRY OUTLOOK 2. GRAIN & OIL SEED FORECAST 3. GRAIN & OILSEED
[Деловое общение] Grain and SBM Market Research Daniel Trading SA
![[Деловое общение] Grain and SBM Market Research Daniel Trading SA](/thumbs/82/86580339.jpg "[Деловое общение] Grain and SBM Market Research Daniel Trading SA") [Деловое общение] Grain and SBM Market Research [Название April организации] 27 Daniel Trading SA Global positioning of Ukrainian agricultural market Production 7% 6% 7% #4 #6 #8 3% 2% 3% 3% 4% 4% 4/5
[Деловое общение] Grain and SBM Market Research [Название April организации] 27 Daniel Trading SA Global positioning of Ukrainian agricultural market Production 7% 6% 7% #4 #6 #8 3% 2% 3% 3% 4% 4% 4/5
U.S. Rice Growers Face Higher Prices and Tighter Supplies in 2017/18
 U.S. Rice Growers Face Higher Prices and Tighter Supplies in 217/18 217 Rice Outlook Conference December 12, 217 Nathan Childs Economic Research Service USDA Approved by the World Agricultural Outlook
Wheat Outlook. Economic Research Service May 13, Approved by the World Agricultural Outlook Board
 Wheat Outlook Economic Research Service May 13, 008 U.S. Department of Agriculture WHS-08dt text and tables Approved by the World Agricultural Outlook Board Continued High Farm Prices Projected for 008/09
WORLD AGRICULTURAL SUPPLY AND DEMAND ESTIMATES
 WORLD AGRICULTURAL SUPPLY AND DEMAND ESTIMATES United States Department of Agriculture Washington, D.C. Approved by the World Agricultural Outlook Board WASDE-339 - June 12, 1998 NOTE Because planting
Commodity Outlook: September 2017 West Central Illinois: July 2017
 Commodity Outlook: September 2017 West Central Illinois: July 2017 William George Senior Agriculture Economist U.S. Department of Agriculture Foreign Agriculture Service Office of Global Analysis Commodity
U.S. Rice Market Faces Tighter Supplies and Higher Prices in 2017/18
 U.S. Rice Market Faces Tighter Supplies and Higher Prices in 217/18 University of Arkansas Webinar Series October 26, 217 Nathan Childs Economic Research Service USDA Approved by the World Agricultural
John Deere Committed to Those Linked to the Land Market Fundamentals
 John Deere Committed to Those Linked to the Land Market Fundamentals Deere & Company July 2013 Safe Harbor Statement & Disclosures This presentation includes forward-looking comments subject to important
Grain: World Markets and Trade
 MMT MMT MMT May 218 Department of Agriculture Foreign Agricultural Service Grain: World Markets and Trade Record Global Grain Consumption Drives Stocks Down 1, 1, 1, 9 9 8 8 76 74 72 7 68 66 64 62 6 49
Argus Ethylene Annual 2017
 Argus Ethylene Annual 2017 Market Reporting Petrochemicals illuminating the markets Consulting Events Argus Ethylene Annual 2017 Summary Progress to the next peak of the economic cycle, now expected by
THE AGRICULTURE AND FOOD INDUSTRY IN RUSSIA: 2015 FACTS AND FIGURES
 THE AGRICULTURE AND FOOD INDUSTRY IN RUSSIA: 2015 FACTS AND FIGURES 2016, April. Russian Direct Investment Fund TABLE OF CONTENTS 4 18 32 RUSSIA IN THE GLOBAL AGRICULTURE AND FOOD INDUSTRY THE AGRICULTURE
Durum wheat market An EU perspective. Eric Willems Deputy Head of Unit DG Agriculture Unit G.4
 Durum wheat market An EU perspective Eric Willems Deputy Head of Unit DG Agriculture Unit G.4 Outline 1. World market 2. EU market 3. EU trade 4. EU Balance sheet 5. Voluntary Coupled Support 2 1. World
U.S. Rice Market Faces Larger Supplies and Lower Prices in 2018/19; Global Trade Projected Another Record High
 U.S. Rice Market Faces Larger Supplies and Lower Prices in 218/19; Global Trade Projected Another Record High 218 Rice Outlook Conference December 5-7, 218 Nathan Childs Economic Research Service USDA
Grain: World Markets and Trade
 MMT 1, 975 95 925 9 875 85 825 8 Department of Agriculture Foreign Agricultural Service Grain: World Markets and Trade Near-Record Grain Supplies Support Growing Global Consumption Global Corn Production
John Deere. Committed to Those Linked to the Land. Market Fundamentals. Deere & Company September 2013
 John Deere Committed to Those Linked to the Land Market Fundamentals Deere & Company September 2013 Safe Harbor Statement & Disclosures This presentation includes forward-looking comments subject to important
The dynamics of global food and agribusiness
 Welcome to the world of Rabobank! The dynamics of global food and agribusiness Adrie Zwanenberg NUFFIELD Global Head F&A Research 20 February 2006 2 The world of Rabobank Food & agribusiness: a global
Market Situation and Outlook 2013/14 Wheat & Maize
 Market Situation and Outlook 2013/14 Wheat & Maize FOURTH SESSION OF THE AMIS GLOBAL FOOD MARKET INFORMATION GROUP ROME, FAO HEADQUARTERS 1-2 October 2013 1 Prices Falling! 2 1 Brent Crude vs West Texas
Summary of WASDE and Production USDA
 Summary of WASDE and Production USDA The following information are summary and extracts from the latest, AUG 2016, WASDE and World Agricultural Production reports provided by the United States Department
Fresh Deciduous Fruit: World Markets and Trade (Apples, Grapes, & Pears)
") United States Department of Agriculture Foreign Agricultural Service December 2017 Fresh Deciduous Fruit: World Markets and Trade (Apples, Grapes, & Pears) FRESH APPLES World production for 2017/18 is
United States Department of Agriculture Foreign Agricultural Service December 2017 Fresh Deciduous Fruit: World Markets and Trade (Apples, Grapes, & Pears) FRESH APPLES World production for 2017/18 is
World Agricultural Supply And Demand Estimates
 World Agricultural Supply And Demand Estimates United States Department of Agriculture Office of the Chief Economist Agricultural Marketing Service Economic Research Service Farm Service Agency Foreign
World Agricultural Outlook Board Interagency Commodity Estimates Committee Forecasts. May 9, 2014
 World Agricultural Outlook Board Interagency Commodity Estimates Committee Forecasts World Wheat Production Country or Region Million Tons 2014/15 World 714.0 697.0-2.4 United States 58.0 53.4-7.8 Foreign
World Agricultural Outlook Board Interagency Commodity Estimates Committee Forecasts. Lockup Briefing March 10, 2014
 World Agricultural Outlook Board Interagency Commodity Estimates Committee Forecasts Lockup Briefing World Wheat Production Country or Region 2013/14 Million Tons World 656.4 712.7 0.1 8.6 United States
THE AGRICULTURE AND FOOD INDUSTRY IN RUSSIA: FACTS AND FIGURES
 THE AGRICULTURE AND FOOD INDUSTRY IN RUSSIA: FACTS AND FIGURES 2014 ABOUT THE RUSSIAN DIRECT INVESTMENT FUND The Russian Direct Investment Fund is a $10 billion fund established to make equity investments
Wheat Outlook. Economic Research Service August 14, Approved by the World Agricultural Outlook Board
 Wheat Outlook Economic Research Service August 14, 008 U.S. Department of Agriculture WHS-08gt text and tables Approved by the World Agricultural Outlook Board U.S. Wheat Production Nearly Unchanged From
Grain: World Markets and Trade
 MMT $/MT FOB MMT ust 218 Department of Agriculture Foreign Agricultural Service Grain: World Markets and Trade Tightening Wheat Supplies in Europe and Black Sea Ripple Through Global Commodity Markets
COMMITTEE ON WORLD FOOD SECURITY
 September 2012 CFS 2012/39/Inf.14 E COMMITTEE ON WORLD FOOD SECURITY Thirty-ninth Session Rome, Italy, 15-20 October 2012 UPDATE O THE AGRICULTURAL MARKET I FORMATIO SYSTEM (AMIS) This document is printed
Wheat Outlook. Economic Research Service March 13, Approved by the World Agricultural Outlook Board
 Wheat Outlook Economic Research Service March 13, 2012 U.S. Department of Agriculture WHS-12ct text and tables Approved by the World Agricultural Outlook Board Higher Projected Exports Lower Ending Stocks
OPPORTUNITIES WITHIN THE AGRICULTURE SECTOR
 OPPORTUNITIES WITHIN THE AGRICULTURE SECTOR KAZAKHSTAN November 2016 Business Sweden, Kazakhstan IN THE LAST THREE YEARS THE AGRICULTURAL SECTOR GREW BY 37 PERCENT GDP COMPOSITION BY SECTOR SEGMENTATION
PUBLIC-PRIVATE PARTNERSHIP IN KAZAKHSTAN
 PUBLIC-PRIVATE PARTNERSHIP IN KAZAKHSTAN First Meeting of the Public-Private Partnership and Infrastructure Financing Network of Asia and the Pacific City of Guiyang, Guizhou Province, PRC 12-13 th of
World Energy Outlook 2010 Renewables in MENA. Maria Argiri Office of the Chief Economist 15 December 2010
 World Energy Outlook 2010 Renewables in MENA Maria Argiri Office of the Chief Economist 15 December 2010 The context: a time of unprecedented uncertainty The worst of the global economic crisis appears
Wheat Global Value Chains, Global Corporations and Food Security in MENA
 Wheat Global Value Chains, Global Corporations and Food Security in MENA Gary Gereffi and Ghada Ahmed Center on Globalization, Governance & Competitiveness Duke University Harvard IGLP Workshop, Doha,
World Agricultural Outlook Board Interagency Commodity Estimates Committee Forecasts. Lockup Briefing July 11, 2014
 World Agricultural Outlook Board Interagency Commodity Estimates Committee Forecasts Lockup Briefing World Wheat Production Country or Region estimate 2014/15 forecast June 11 Million Tons Percent Percent
World Agricultural Supply And Demand Estimates
 World Agricultural Supply And Demand Estimates United States Department of Agriculture Office of the Chief Economist Agricultural Marketing Service Economic Research Service Farm Service Agency Foreign
Zimbabwe. Grain and Feed Annual
 THIS REPORT CONTAINS ASSESSMENTS OF COMMODITY AND TRADE ISSUES MADE BY USDA STAFF AND NOT NECESSARILY STATEMENTS OF OFFICIAL U.S. GOVERNMENT POLICY Voluntary - Public Date: 7/13/2012 GAIN Report Number:
January 12, USDA World Supply and Demand Estimates
 January 12, 2017 - USDA World Supply and Demand Estimates Corn This month s U.S. corn outlook is for lower production, reduced feed and residual use, increased corn used to produce ethanol, and smaller
Grain: World Markets and Trade
 y 218 Department of Agriculture Foreign Agricultural Service Grain: World Markets and Trade Near-Record U.S. Corn Exports in 217/18 Monthly Exports Annual Exports (Oct-Sep) 8 7 MMT 7 6 4 3 2 1 3yr average
Nuclear Power Outlook
 Q1 2019 A PUBLICATION OF UXC.COM Nuclear Power Outlook 1501 MACY DRIVE ROSWELL, GA 30076 PH +1 770 642-7745 FX +1 770 643-2954 NOTICE UxC, LLC ( UxC ) shall have title to, ownership of, and all proprietary
World Agricultural Supply And Demand Estimates
 United States Department of Agriculture Office of the Chief Economist World Agricultural Supply And Demand Estimates Agricultural Marketing Service Economic Research Service Farm Service Agency Foreign
Fresh Deciduous Fruit (Apples, Pears, and Grapes): World Markets and Trade
: World Markets and Trade") Fresh Deciduous Fruit (Apples, Pears, and Grapes): World Markets and Trade June 9 SUMMARY Global apple production is expected to expand percent and trade is expected to surge 5 percent in 8/9 due to strong
Fresh Deciduous Fruit (Apples, Pears, and Grapes): World Markets and Trade June 9 SUMMARY Global apple production is expected to expand percent and trade is expected to surge 5 percent in 8/9 due to strong