WHOLE FARM NUTRIENT BALANCE CALCULATOR TUTORIAL WORKBOOK-TEACHING GUIDE
|
|
|
- Heather Morgan
- 6 years ago
- Views:
Transcription
1 WHOLE FARM NUTRIENT BALANCE CALCULATOR TUTORIAL WORKBOOK-TEACHING GUIDE Caroline Rasmussen, Patty Ristow, Quirine Ketterings March 2011 Nutrient Management Spear Program Collaboration among the Cornell University Department of Animal Science, PRODAIRY and Cornell Cooperative Extension i
2 Correct Citation: Rasmussen, C.N., P.L. Ristow, P.L., Q.M. Ketterings (2011). Whole Farm Nutrient Balance Calculator; Tutorial Workbook. Department of Animal Science. Cornell University, Ithaca NY. Downloadable from: For more information contact Quirine Ketterings at the Cornell Nutrient Management Spear Program, Department of Animal Science, Cornell University, 330 Morrison Hall, Ithaca NY 14583, or ii
3 Contents Teaching Goals... iv Introduction... 5 Nutrient Balance Program Overview... 5 Nutrient Balance Program Data Requirements... 5 Using the Program... 6 Enter Farm Crop Production... 8 Enter Farm Imports Enter Farm Exports Generating Reports and Balances Some Further Analysis Exporting Data to Cornell Nutrient Management Spear Program Farm Analysis with the Nutrient Mass Balance Appendix: iii
4 Teaching Goals This section of the teaching module follows the Whole Farm Nutrient Balance Calculator; Tutorial Workbook and is designed to be compatible with a 1-hour computer laboratory exercise in which the whole class follows along together with an overhead projected version of the Whole Farm Nutrient Balance Calculator. The purposes of this segment of the curriculum are two-fold: (1) To reinforce concepts associated with nutrient mass balance analyses presented in lecture, by reading through extension fact sheets and answering question independently or through group discussions. (2) Become familiar with the look and feel of the tool/software by adding data and the functionality of the software by actually interacting with it. Completing this section of the curriculum after the lecture solidifies concepts presented in lecture by providing the same information in multiple learning formats. It also engages the use of professional reference tools (fact sheets and software), which provides experiences and skills that are immediately applicable for crop and farm advisors or managers. Materials used for this section of the curriculum are: (1) Software Whole Farm Nutrient Balance Calculator (2) Whole Farm Nutrient Balance Calculator Tutorial Workbook. The tutorial for the Whole Farm Nutrient Balance calculator takes the users through a step by step set of data entry, questions and evaluation exercises using the Whole Farm Nutrient Balance Calculator. This Teaching Guide offers guidance on discussion points for each section. This tutorial walks the user through the input of the needed data and the tools used to generate the mass balance reports. For this tutorial we will look at the imaginary small herd of Jersey cattle and goats owned by Mr. Joe Deere. The tutorial begins with downloading and opening the Whole Farm Nutrient Balance Calculator on each student s desktop which requires an internet connection. If an internet connection is unavailable in the classroom, the calculator can be downloaded on a computer that does have internet access, and then transferred to class computers using a portable drive or disk. It is recommended that no more than two people share a computer for optimal learning. iv
5 Introduction The Mass Nutrient Balance Calculator is a tool developed by Cornell University s Nutrient Management Spear Program in an effort to educate farmers and nutrient management planners of potential discrepancies between nutrient input and output on farms. The program accounts for common sources of nutrient imports (feed, fertilizer, animals, etc.) and exports (animals or products sold, manure or other wastes, crops sold, etc.), using farm data to generate an overall summary of the nutrient balance on the farm. Producers can obtain a list of the needed information on Cornell s Nutrient Management Spear Program website: The input data sheets form found on this page details all the information needed, allowing easy input into the program at a later time. The software can be downloaded from the same website. To determine the nutrient balances, the amounts of nutrient sources and exports need to be determined. Just as important are the nutrient analyses and total amounts of feed, fertilizer, bedding, and manure. The accuracy and reliability of the mass nutrient balance is dependent on the accuracy and quality of the inputs. Nutrient Balance Program Overview Teaching Guide: Overview of NMB data function and data requirements. Before getting started with the calculator, take some time to get an overview of the nutrient mass balance by reading Agronomy Fact Sheet 25 which can be found in the Appendix: Agronomy Fact Sheet #25: Mass Nutrient Balance Software. Now answer the following question: Question (1): What does the Mass Nutrient Balance calculate? Answer (1): Calculates the amount of nutrients (N, P and K) being imported to the farm in the form of purchased feeds (i.e. not homegrown), fertilizers, animals, and bedding material. Calculates the amount of nutrients being exported (N, P, K) from the farm in the form of products sold including, feed, milk, animals, crops, and manure/compost. Calculates the difference between the nutrients (N, P and K) imported and exported. Nutrient Balance Program Data Requirements Teaching Guide: Overview of NMB data function and data requirements. Getting accurate calculations from this calculator will depend on entering accurate farm-specific data. 5
6 Determine what farm data will need to be assembled by reviewing the Input Data Form Instructions and Input Data Form which can be found in the Appendix. Mass Nutrient Balance Input Form Instructions Mass Nutrient Balance Input Form Now answer the following question: Question (2): List four typical dairy farm nutrient imports and four typical dairy farm exports. Answer (2): Imports: 1) purchased feed; 2) purchased fertilizer; 3) purchased livestock; 4) purchased bedding. Exports: 1) milk sold; 2) livestock sold; 3) crops sold; 4) manure or compost exported. Using the Program Teaching Guide: Take-home message: keeping data/information organized helps to ensure the necessary information is accessible and can easily be used to derive a farm balance and give guidance on nutrient management. Action 1: Open the calculator and click on the contact button. Fill in the information as follows. Enter the information shown below: Contact information Producer name Joe Deere Farm name Joe s Jerseys Address 1 JD Lane City, state, zip Somewhere, NY Phone jd@jj.com Farm information The balance year determines the calendar year (January to December) for which the data are being entered. Entering information over time allows producers to track their nutrient balances and evaluate the success of new programs or management changes. The total farm acres are needed to calculate yields and land area over which manure or fertilizers are spread. Action 2: Enter the following information: Farm Information Balance year 2008 Total farm acres 100 All tillable crop and pasture acres 75 # acres, perennial and annual with > 10% legume 30 Acres receiving manure 50 6
7 Watershed Most farms are only located in one watershed. Enter the primary (and secondary, if applicable) watershed in which the farm resides. This allows for watershed specific end-of-year farm summaries to be compiled. Action 3: Enter the following information: Watershed Primary Genesee River Secondary None Animal Information This section is only applicable to livestock farmers and can be ignored by crop farmers. Simply leave 0 in the fields when working with a crop farm. For those with livestock, enter the number of cattle by category, including an average weight. As animal numbers may vary throughout the year, an average population size should be used. This helps to calculate the amount of manure produced during the year. The total animal units (AU) are calculated and listed below the input fields. Action 4: Enter the following information: Animal information # of animals Weight (lbs) Milking and dry cows Heifers: 1-2 year Heifers < 1 year 0 0 Calves Bulls and steers Other livestock (goats) Question (3): What is the total animal units value and how is it calculated? Answer (3): Joe Jersey has 76.2 animal units. An animal unit is equal to 1,000 lbs live weight. The total animal units are the combined weight (lbs) of all animals divided by 1,000. Other Information Also included are some yes/no questions pertaining to various farm summaries and production info. These are not used by the program, but merely serve as an indicator of records kept by the farm. Check the appropriate fields. Action 5: Enter the following information: Other information Cornell Dairy Farm Business Summary (DFBS) Yes Intensive grazing Yes All others No Once you have entered the information, the Contact Screen should look like Figure 1. 7

8 Action 6: Once all the information is entered, select Next at the top of the screen. Figure 1: After adding the data listed above the Contact Screen will include contact, farm, watershed, animal and additional farm characteristic information. Enter Farm Crop Production Teaching Guide: Accurate farm crop production records are important to an accurate nutrient balance analysis. Determining farm crop yields may be especially difficult. Enter in relevant information for all crops grown and harvested on the farm, including those used for pasture and bedding. Several types of crops and average nutrient analyses are already programmed into the calculator, and appear in a list on the right-hand side of the screen. Double-clicking one of these will put it on your list. From there, adjustments can be made to the nutrient values. Yield and Inventory Entered as: select the appropriate response. If As Fed is selected, you will need to enter the % Dry Matter in a later column. The yield and inventory values must all be entered in DM or AF, whichever you chose. Inventories: these track the carryover of nutrients from one year to the next and ensure that nutrients in things like stored feed are accounted for properly when dealing with 8
9 multiple years of data. The ending inventory values can be used to automatically update the next year s starting inventory. For the Farm Crop Production table, these values must be in DM. Note that in these entry fields, and all others, the entire row of information must be completed before you can go back to correct a mistake or change a value. If you either add a crop accidentally or otherwise wish to get rid of one from the chart, highlight the row by clicking the panel to the left of the Crop column and then clicking Delete Current Row at the top of the screen. Select Okay to confirm the deletion. Action 7: Enter the following information: Crop Dry Hay Corn Silage Legume Acre Manure applied CP P K Feed type Yield & inventory DM Yield Beg. Inv. End. Inv. % %DM % (t/a) (tons) (tons) No Forage Dry n/a No Forage As Fed Question (4): If Joe did not know his corn silage yield, how could he go about estimating it? Answer (4): The objective is to determine the quantity of crop harvested. Since Joe did not sell any corn silage, the quantity harvested = [Beginning inventory + (daily feed out * number of days since harvest) current inventory] * [1+ shrink %, in decimal form). Harvested Yield = Quantity harvested / Acres harvested Joe should initiate a system to track yield for next year. Question (5): Where would Joe find his corn silage crude protein, P and K? Answer (5): Joe should have a forage analysis done to determine crude protein, P and K. On the forage analysis sheet, be sure to use the values under the Dry Matter Basis column. If he does not have a forage analysis, there are book values on the right hand side of the crop production screen. Once you have entered the information, the Crop Production screen should look like Figure 2. Action 8: Once all the information is entered, select Next at the top of the screen. 9

10 Figure 2. Farm crop production screen. Note that the manure applied box only is accessible for fields with legume content >0%. The pre-made crop types are on the right-hand side of the page. Enter Farm Imports Teaching Guide: Recording the quantity purchased, as well as the dollar amount spent, will provide accurate values for the mass nutrient balance analysis. The imports pages tabulate nutrient sources, like animal feed, fertilizer, and livestock, which are imported to your farm i.e. they were brought onto the farm and not generated on-farm as would be the case for homegrown feeds or previously-acquired animals. Purchased Feed Here you can enter various purchased products used in livestock rations. As with the crop screen, there are already a series of pre-entered common feedstuffs for easy use. % Forage: for total mixed rations (TMRs); this value is used to calculate how much forage is brought in for the mix. The program assumes that all of the TMR (forage and concentrate portions) are purchased. If you grow forage that gets added to purchased concentrates to form a TMR, enter the concentrate values here, as the forage component is included on the Farm Crops page. Inventories: allow tracking of starting and ending supplies of feeds (in tons as-fed so wet tons) Action 9: Enter the following information. Item Tons per year DM CP P K Feed type Forage Beg. Inv. % % DM % (wet tons) Soybean Meal Grain n/a Brewers Grain-Wet Grain n/a 1 3 Action 10: Once all the information is entered, select Next at the top of the screen. End Inv. 10

11 Fertilizers Purchased Here enter the amount and analyses of all fertilizers used on the farm. Note that, unlike the feed and crop pages, there are no columns for beginning and ending inventories. Thus you should only enter the amount of fertilizer actually spread, and not include any bought but not used. Like the previous pages, there are pre-made fertilizers that can be quickly put into the chart. Action 11: Record 15 tons of as the amount of fertilizer purchased. Action 12: Once all the information is entered, select Next at the top of the screen. Animals Purchased Any animals purchased during the year should be put into this page, including replacement heifers, bulls, etc. Use the dropdown menu on the left to select a species, add a description, and then input the number and average weight of the animals. Action 13: Enter the following information. Animals Purchased Type Description Number Weight per head (lbs) Goats Buck Dairy Replacement heifers Action 14: Once all the information is entered, select Next at the top of the screen. Once you have entered the information, the Animal Imports Screen should look like Figure 3. Figure 3. Animal imports screen. Bedding and Miscellaneous Imports Enter other sources of nutrient imports, including bedding. However, bedding produced on the farm should not be included in this section. As in earlier screens, there are some pre-made inputs for bedding varieties. Unless you test your own bedding, it is best to use these pre-made values. 11
12 Action 15: Enter the following information: Bedding and Miscellaneous Imports Item Tons/yr % DM N (% DM) P (% DM) K (% DM) Wheat Straw Action 16: Once all the information is entered, select Next at the top of the screen. Question (6): Where would you find crude protein, P and K composition of a custom feed blend? Answer (6): The nutrient composition of purchased feeds is commonly on the bag or on a sheet provided with deliver of bulk feeds. The farm nutritionist or the mill providing the feed can also provide the CP, P and K composition of the feed. Enter Farm Exports Teaching Guide: Recording the quantity sold, as well as the dollar amount received, will provide accurate values for the mass nutrient balance analysis. Through the year record the weight as well as the number of animals sold. The export pages account for nutrients produced on-farm that leave things like manure, milk, and sold livestock and crops. Milk Sold Enter the pounds of milk sold and the % Milk Protein, as listed on milk checks. Make sure that the pounds produced per head looks reasonable. If not, you may want to double check on the average herd size entered in the Contacts page. Action 17: Select Milk Sold screen and enter 750,000 lb milk at 3.30% protein. Action 18: Once all the information is entered, select Next at the top of the screen. Animals Exports Here enter any animals sold throughout the year, including breeding stock, cull or beef cows, etc. This also includes stock that die and are composted or rendered off-farm do not include animals you compost yourself. Action 19: Select Animal Exports screen and enter: Animal Exports Type Description Number Weight/head (lbs) Goats Does Dairy Cull cows Dairy Feeder calves
13 Action 20: Once all the information is entered, select Next at the top of the screen. Crops Sold Enter any crops, including hay and forage or grains, which were grown on the farm and sold (not fed on-farm). The information required is similar to that for earlier crop pages. Action 21: Select Crop Exports screen and enter: Crop Exports Crop Wet tons/yr % DM CP (% DM) P (% DM) K (% DM) Dry hay Action 22: Once all the information is entered, select Next at the top of the screen. Manure, Compost, and Other Exports Here enter any manure or compost that is produced on the farm but sent elsewhere. This does not include manure, compost or sludge, etc. that are spread on the field of the farm itself. Note that the nutrient analysis columns ask for nutrient values in % wet rather than % DM, as this is how manure nutrient reports are often presented on the manure analyses. For the purpose of this tutorial, no nutrients were exported. Action 23: Select Next at the top of the screen. Question (7): How would you enter the data for a farm that sends all heifers off of the farm at 300 lbs and brings them back at 1000 lbs? No farm feeds are fed to off-site animals and manure from off-site animals is not applied to farm fields. Answer (7): Enter the number of heifers sent off the farm at 300 lbs as animals exported. Enter the number of heifers coming onto the farm at 1000 lbs as animals imported. Make sure the animal numbers on the Contact screen represents the number and weight of animals on the farm and does include animals that are housed off-site. Generating Reports and Balances Teaching Guide: Use the program reports to analyze farm nutrient balance performance. After clicking Next after the final page, you will return to the Contact screen. From here, select Home at the top of the screen to return to the overall map screen from which you started. Now, the other buttons should be highlighted, enabling you to click on any of them (figure 4). You can navigate to any of the various import or export pages and change values if needed. Once all the required information is entered into the program, you may determine the overall Mass Nutrient Balance of the farm. 13

14 Action 14: Select Balance Reports from the bottom of the main screen to move to the report summary page. There are five reports that may be viewed and printed. They can be viewed individually by clicking on the box to the left of the report name, and then selecting View Report, or by clicking Select All and then View Report a multi-tab summary report will be generated. Figure 4. Home screen after information has been filled out. Now all the buttons are activated. When printing reports, particularly the Annual Mass Nutrient Summary, print sideways on the page (landscape view). When looking at the report, select Print Preview on the top of the screen, and then select the landscape view button (third from the left) on the preview page. After viewing a report, the program will save a copy of it. The location of the copy will be displayed below the report s name on the Select Reports screen. Annual Mass Nutrient Summary This report totals all the N, P, and K imported and exported by category (for inputs feed, fertilizer, animals, and misc; for exports milk, animals, crops, and misc). The statistics themselves are displayed three ways, and the balance (imports exports) is calculated (figure 5). 14
15 Output Tons per year: simply gives the absolute amount (in tons) of the given nutrient imported or exported. Note that in the bottom row, the nutrient difference, Joe has imported only 0.11 tons more N than he has exported indicating a near zero balance. Lbs/acre receiving manure per year: divides the total pounds of nutrient imported or exported by the number of acres listed as receiving manure. Lbs/total tillable acres per year: divides the total pounds of nutrient imported or exported by the number of acres listed as tillable. Diagnostics The top rows summarize some of the information given on the first few pages of the spreadsheet. Some numbers, such as milk production and animal density, are displayed in terms of per acre receiving manure and per tillable acre. This allows some comparison of different farms of different sizes and intensities; similarly, it allows the farm to track changes if land and/or herd size change. Animal feeds are broken down by source imported/purchased or farm-produced. The nutrients remaining (imports exports) are displayed in a variety of ways. Again, this puts the raw numbers (those on the top left of the report the tons per year of imports and exports) into perspective. The % row expresses the difference between nutrients imported and exported (i.e. remaining nutrients) as a percent of imported nutrients. Feed use efficiency shows how much (in %) of a nutrient was sold in the milk versus how much was put in through feed (both imported and farm-grown) (figure 5). Other numbers show the pounds of nutrients imported and remaining per hundredweight of milk. Efficiencies can thus be evaluated and compared from year-to-year, even if parameters like animal numbers change. Question (8): What % of nutrients fed to Joe s animals are purchased? Answer (8): Joe s Jerseys are eating mostly feed from the farm only 7% of the feed (some grains) are bought onto the farm in the form of purchased feed. Other Nitrogen Contributions This section shows N balances in further detail, accounting for things like legume N fixation and atmospheric N deposition. Added to the Import Export difference from the top segment of the report, this yields the Total N Remaining. This is then broken down by pounds per animal unit or mature cow, and then as a percent of nutrients imported. 15

16 Figure 5. Annual Mass Nutrient Balance report. Some of the parameters mentioned in the text are highlighted; particularly difference between nutrient imports and exports (blue), % remaining imports (green), and feed use efficiency (red). 16

17 Distribution of Nutrient Imports and Exports This report details the proportion of imports and exports due to the different enterprises on the farm feed, fertilizer, animals, and bedding/manure/miscellaneous. This report summarizes the information that you put in, allowing a quick and easy way to double-check your numbers, or to print out and have on-hand. Question (9): What import category contributes the most to Joe s nutrient imports and exports? Answer (9): Joe gets most of his N, P, and K from fertilizer he uses, and ships most of it out through milk. Itemized Nutrient Imports and Exports (%) This report more specifically breaks down the sources of nutrients brought in or shipped out. The total values are the same as those on the Distribution of Nutrient Imports and Exports report. Itemized Nutrient Imports and Exports (lbs per tillable acre) This report presents the same information as the Itemized Nutrient Imports and Exports (%) report, but expresses the values as pounds per tillable acre. We can see, for instance, that Joe imports 5.7 lbs K per tillable acre due to the purchase of wheat straw, or that he brings in 66.4 lbs K per tillable acre as fertilizer. Data Entry Report Figure 6. Data Entry report. 17
18 Some Further Analysis Teaching Guide: Use the program to consider management alternatives. After looking at Joe s data, we see that he has a near even balance of N (0.11 tons/year difference), but that P and K are less balanced (1.01 and 2.26 tons/year, respectively). What can he do to have his farm become more balanced for P and K? To achieve a reduced Mass Nutrient Balance, Joe either needs to reduce his imports of P and K, or increase his outputs. Increasing outputs may be hard it may not be economically viable for Joe to export manure (i.e. if he then has to buy more fertilizer instead), and he cannot easily increase the amount of P or K in milk (without increasing herd size, thus increasing nutrient demands and manure output, etc.). Looking at the Itemized (lbs per tillable acre) report, we saw that Joe imports a lot of K through fertilizer (66.4 lbs). Often dairy farms do not need a lot of imported fertilizer K; let s assume soil test illustrate that Joe s fields are optimum or high in K. By switching to a different fertilizer blend, he may be able to reduce his K imports. Let s try this for the following year (2009). Action 15: Return to the Home page, and File > Transfer Current Data to New Year. This will update the file to the next year, particularly in terms of the balances of feed and other nutrient sources. Note that it will not update animal numbers based on the animals bought and sold this must be done manually. Action 16: Go through the pages again, making the following adjustments: Remember that Joe brought in 3 replacement heifers, and sold 4 cull cows. Assume those heifers are still in the herd but have calved, so decrease the number of Milking and Dry Cows by 1 (3 bought 4 sold = -1). Similarly, the ten 1-2 year heifers from last year calved as well change the heifer column to 0 and add 10 to the mature cowherd (total of 59 milking cows). While 15 calves were sold last year, assume Joe kept the same amount of this year s crop don t change that number. Joe did not buy or sell any bulls or steers, but during the past year they all gained weight. Increase the pound per head to 1500 for that row. Recall that Joe sold two does and bought one buck; decrease the other livestock from 10 to 9. The total AU should be Note on the crop production page that the ending balances from 2008 (0 tons dry hay and 20 tons corn silage) are now the beginning balances. Keep the ending balance of hay at 0 tons, and make the ending balance for corn silage 10 tons. Feed purchases stay the same. Fertilizer purchase will change, since Joe decided to try and reduce his P and K balances. Change the to 10 tons of Joe purchased no animals. Delete the two rows. Miscellaneous purchases (bedding) stays the same. Milk sold rose to 880,000 (taking into account the new animals in the herd). Joe sold 2 Cull Bulls (1800 lb each). Crops Sold and Other Exports stay the same. 18
19 Action 17: Return to the Home page, and click the Balance Reports button. Look at the different reports. A quick look at the Annual Mass Nutrient Summary shows that Joe s nutrient balances have changed. The increased N from fertilizer has driven his N difference up to 0.64 tons/year, but his P and K balances decreased. This can be seen throughout the report. Action 18: Let s say Joe wants to compare some of the values from 2008 and 2009 specifically the Feed Use Efficiency % and Import from Purchased Fertilizer values. To access an old report, return to the home page. Click File > Load Existing Balance. You will see a list of saved files, at this point containing only Joe sjerseys_2008.mnbx and Joe sjerseys_2009.mnbx. Select the 2008 file, and then pull up the appropriate reports. Without closing the report page, switch back to the program screen and return to the Home page. Load the 2009 balance, and open the reports from that file. You can now compare the two (figure 7). Figure 7. Comparison of 2008 and 2009 Itemized N, P, and K imports and exports reports. Figure 7. Comparison of 2008 and 2009 Itemized N, P, and K imports and exports reports. Question (10): What has changed and why? Answer (10): Annual Nutrient Mass Balance: we can see that Joe s N imports from fertilizer increased (1.50 to 2.00 tons), but the P and K imports decreased (1.29 to 0.43 for P, and 2.49 to 0.83 for K). In terms of Production Efficiency, the Feed Use Efficiency increased for all three nutrients, while the Nutrients remaining decreased for P and K, as would be expected. Distribution of Nutrient Imports and Exports: as anticipated, the % of imports from fertilizer for P and K decreased. Accordingly, the proportion from other imports (bedding and feed) increased. Again, this is not because more nutrients were necessarily imported through those routes a larger portion of total imported nutrients came through them. Itemized Nutrient Imports and Exports (lbs/acre): this also shows an appreciable drop in overall P and K imports. The absolute tons of imported P and K decreased in 2009 due to a change in fertilizer type; there was a smaller change in the % P and K imports from that source. 19

, indicating that the export (file conversion) has taken place, and giving the location that the file was saved.")
20 Exporting Data to Cornell Nutrient Management Spear Program Teaching Guide: To save the data in a format that will allow inclusion in and comparison to a multiple year, state-wide dataset. Now that the information has been entered, and you have looked at the mass nutrient balance summaries, you can send the data to Cornell University s Nutrient Management Spear Program to be added to the database of participating farms. Action 20: On the home screen, select File > Export Data for Cornell. This will convert the data into a.zip file, which is what the database will need. A small pop-up box will appear (figure 8), indicating that the export (file conversion) has taken place, and giving the location that the file was saved. The title of the file will be C:\MNB\farmname_year.zip. will be used to send the data to Cornell via . Figure 8. Pop-up screen indicating the successful conversion of the data file. Note the location and filename of the data, which At this point, the data have not been sent to Cornell! Note the location given in the pop-up, and select Okay. To send the converted file, attach the file to an sent to Caroline Rasmussen (cnr2@cornell.edu). Be sure to attach the.zip file when you search for the file on an program, there will be other files with similar names (figure 9). Figure 9. Identifying the correct file to . You may find multiple files with similar names when attaching a file for , but the ones you want are.zip files (circled in red). Note the multicolored icon to the left of the filename, indicating a.zip file. Moving the mouse over the filename will cause pop-up text to appear, indicating the file type. 20
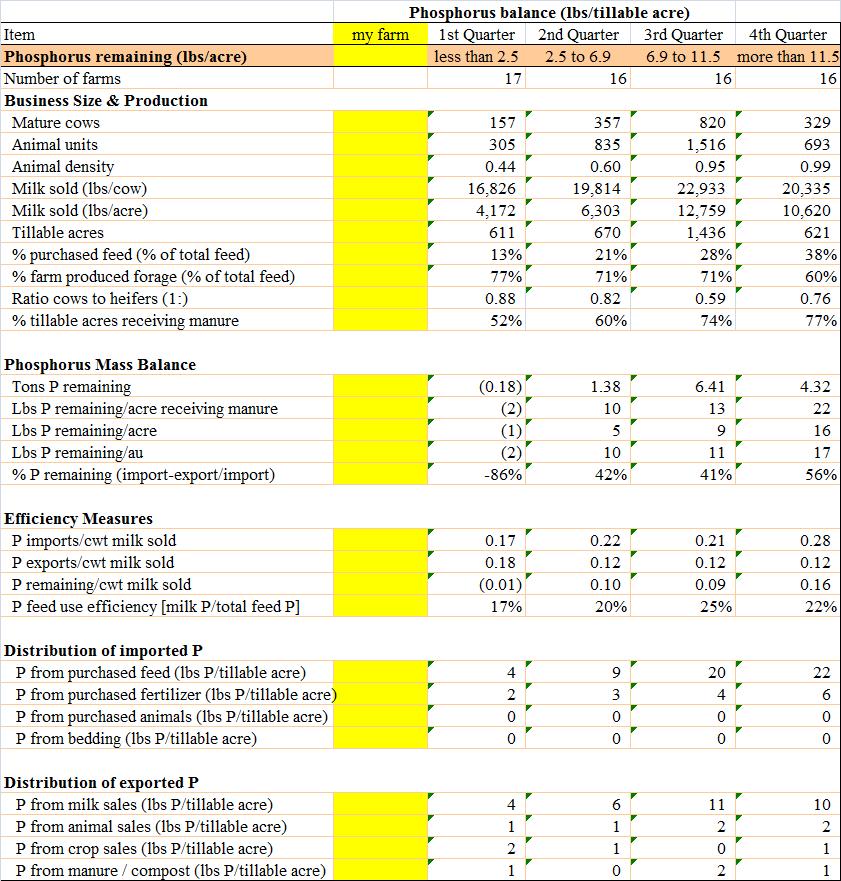
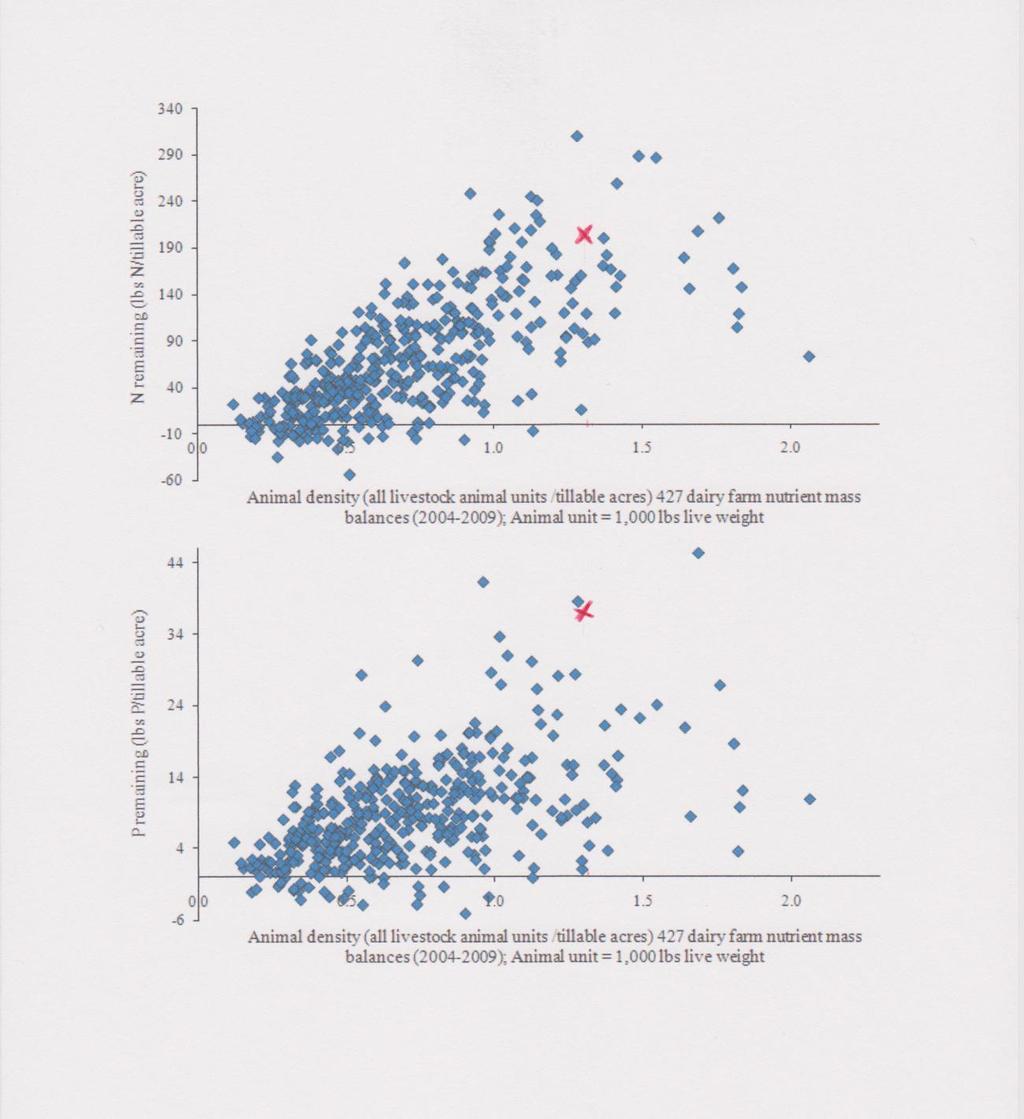
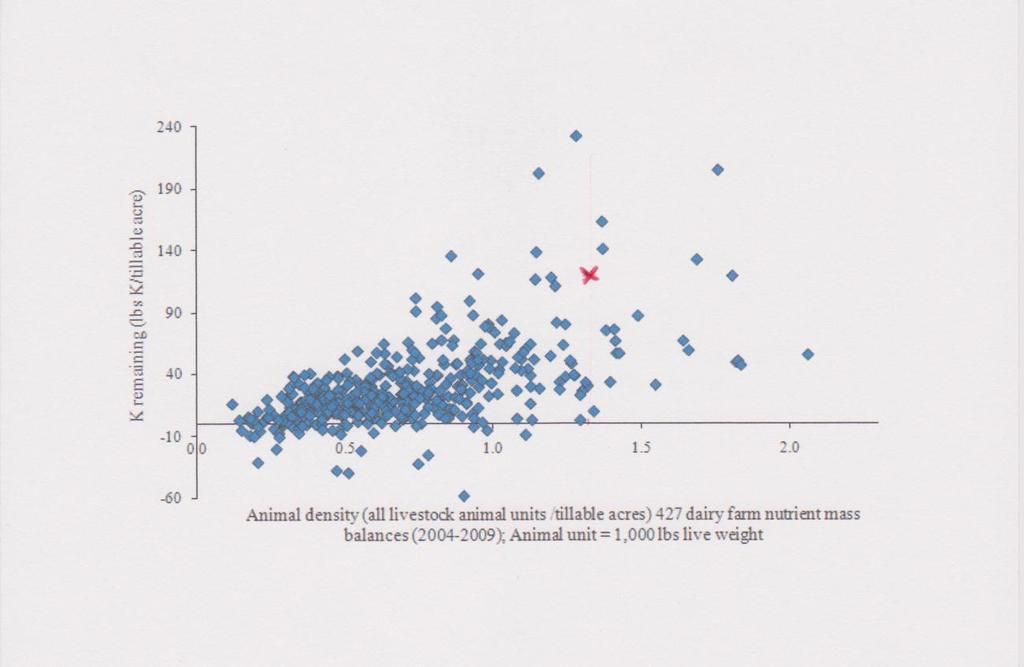
21 Farm Analysis with the Nutrient Mass Balance Question (11): Enter data from entry sheets found on the next four pages into the NMB program. Print the Annual Mass Nutrient Summary Report. Mark an x on each of the graphs shown on pages to indicate where the Homework farm would appear. Enter the Homework Farm values in the column Homework farm for the quartile phosphorus balance report (page 28). 21
22 22
23 23
24 24
25 25
26 26
27 27
28 28
: 29")
29 Answer (11): 29
30 30
31 31
32 32
33 Appendix: Agronomy Fact Sheet # 25: Mass Nutrient Balance Software Mass Nutrient Balance Input Form Mass Nutrient Balance Input Form Instructions 33
34 Agronomy Fact Sheet Series Fact Sheet 25 Mass Nutrient Balance Software Introduction For the sustainability of the dairy sector in New York State, it is important to find ways to enhance profitability while minimizing environmental loss of nitrogen (N) and phosphorus (P). This requires farms to maintain sustainable farm-gate nutrient balances. A nutrient balance is defined as the difference between the amount of N, P, and potassium (K) imported through purchased products and the amounts exported off the farm via milk, meat, crops, manure and/or compost (Figure 1). Such assessments can help identify management alternatives that can enhance whole farm nutrient use efficiency (and hence reduce nutrient losses) and increase farm profitability. In this agronomy fact sheet we describe how to use the Mass Nutrient Balance software to derive a farm s N, P and K balance. N-P-K Feed INPUT Whole Farm Mass Nutrient Balances N fixation Calculate the amount of nutrients being imported to the farm in the form of purchased feeds (i.e. not homegrown), fertilizers, animals, and bedding material. Calculate the amount of nutrients being exported from the farm in the form of products sold including, feed, milk, animals, crops, and manure/compost. Generate reports that show farm N, P and K imports and exports in tons for the whole farm and in pounds per acre cropland, per pound of product sold, or per animal unit. Identify areas of concern and opportunities for more efficient nutrient use that, if addressed, could increase profitability and reduce environmental impact. Where Do I Start? Step 1: Obtain the Mass Nutrient Balance Input Data Form. This form (three pages) can be downloaded from the Mass Nutrient Balance webpage of the Nutrient Management Spear Program: balance.html. Step 2: Record Keeping. Throughout the year, keep records of the quantities of feed, fertilizer and other materials purchased as identified in the Input Data Form. The record keeping booklet is designed to help with this too. OUTPUT Figure 1: A farm mass nutrient balance is the difference between nutrient (N, P, and K) imports and exports. What Can Mass Nutrient Balance Do? A Mass Nutrient Balance analysis helps farm managers determine where the greatest nutrient use inefficiencies occur. A software program ( Mass Nutrient Balance ) was developed to allow users to: Calculate the amount of nutrients being imported, exported, and recycled through the production of pasture and crops. Step 3: Fill out the Input Data Form. Print the Input Data Form from the Nutrient Management Spear Program website. At the top of the sheet, write down the producer and farm information including the number of farm acres and animals. Fill out the Crop production section including farm-produced legumes, non-legumes and pasture. Forage analyses are helpful to obtain accurate values for crude protein, P and K. Fill out the Imports section which includes all feeds, fertilizers, animals, and bedding purchased or brought onto the farm. Forage Field Crops Extension 1 College of Agriculture and Life Sciences
35 analyses are also helpful for this section. If feed composition values are not available from farm analysis or from feed companies and nutritionists, the software provides standard, book values for common feeds. Fill out the Exports section which includes any crops, milk, animals, and manure or compost that is sold or moved off the farm. Step 4: Download the Nutrient Mass Balance Calculator and Install This software requires Windows XP or later and at least 5 Mb of storage. Download free of charge from: balance.html. After clicking on Download the Nutrient Mass Balance Calculator, click run and follow the on-screen instructions. The program installation will place the program name in your Start menu. Step 5: Fill out the Whole Farm Nutrient Balance Spreadsheet. Click on Start Program to see the screen below (Figure 2). For additional help, download the Help file, accessible at the same project website. Continue to transfer the information from the Input Form to the import and export sites of the software. When you are finished with entering all the information from the Data Input Form, click on Home to return to the main menu. Click on the Balance Reports button to see the results of your mass balance assessment. Data are automatically saved as you move from one data entry field to the next. You can save put your data into a format to send to the Nutrient Management Spear Program to obtain a comparison between your farm and all farms in the database to date by choosing Export Data for Cornell in the File drop down menu at the top of the screen. You must then attach the resulting file ( your farm name_balance year.zip ) to an and send it to cnr2@cornell.edu. All Mass Nutrient Balance data/results are kept strictly confidential. In your farm comparison report, your farm will be one of many data points on the charts. For Support and/or Training If you need help transferring your information from the Data Input Form into the software, send the completed Data Input Form to Caroline Rasmussen, Nutrient Management Spear Program, 325 Morrison Hall, Cornell University For further information, contact Caroline Rasmussen (cnr2@cornell.edu or ) or Quirine Ketterings (qmk2@cornell.edu or ). Disclaimer This fact sheet reflects the current (and past) authors best effort to interpret a complex body of scientific research, and to translate this into practical management options. Following the guidance provided in this fact sheet does not assure compliance with any applicable law, rule, regulation or standard, or the achievement of particular discharge levels from agricultural land. Figure 2: Nutrient Balance Mass program Menu. Input buttons are on the left, export buttons on the right. Click on the Contact button and enter the contact information from the completed Data Input Form into the appropriate fields. Click Next to go to the next input screen, Farm Crop Production. In the Farm Crop Production Screen enter the appropriate crop production information from the Data Input Form. Remember to enter crop and pasture production on rented as well as owned land. Nutrient For Management more information Spear Program Nutrient Management Spear Program Caroline Rasmussen, Sarah Moss, Patty Ristow, Quirine Ketterings 2010 Field Crops Extension 2 College of Agriculture and Life Sciences
36 Cornell Nutrient Management Spear Program Mass Nutrient Balance Calculator Input Sheet N, P and K imports and exports, 1/1/2010 to 12/31/2010 Producer Contact Information Data Collection Producer name By Farm name Address City, state, zip Balance year 2010 Phone Farm Information Total farm acres All tillable owned and rented crop and pasture acres Legume acres (perennial and annual) >10% legume Acres receiving manure (crop and pasture) Primary Secondary Watershed Have you completed a Cornell Dairy Farm Business Summary (DFBS) for the balance year? Have you completed a Farm Credit Business Summary for the balance year? Are you a Certified Organic producer? Intensive Grazing (grazed at least 3 months/yr, moved to new pen every 3 days or more)? Do you have a Comprehensive Nutrient Management Plan (CNMP) for the balance year? Do you have a Cornell Cropware plan for the balance year? y / n y / n y / n y / n y / n y / n Average number and weight of farm livestock Animal Group Number Milking and Dry Cows Heifers > 1 year Heifers 6 mon-1 year Calves < 6 mon Bulls & Steers Other Livestock Weight (lbs/head)
37 FARM CROP PRODUCTION: Inventory (tons) Crop Name % Legume Acres Manure Applied CP (%DM) y/n y/n y/n y/n y/n y/n y/n y/n y/n y/n y/n y/n * Crop type = forage, grain or bedding P (%DM) K (%DM) Crop Type* %DM Yield (t/a) Beginning year Ending year IMPORTS Feeds (purchased) Tons /year % DM CP (%DM) P (%DM) K (%DM) Feed Type* % forage (if TMR) Beg. year (as fed tons) Inventory Ending year (as fed tons) * Feed type = Grain, Forage or TMR.
38 Purchased fertilizers Tons/year % N % P 2 O 5 % K 2 O Comment Purchased animals Type* Description Number Weight/hd (lbs) * Type = Dairy, Beef, Swine, Poultry, Goats, Sheep, Horses Bedding and miscellaneous imports Tons/year % DM N (%DM) P (%DM) K (%DM) EXPORTS Milk sold (lbs/year) Milk Protein (%) Animals Sold Type* Description Number Weight/hd (lbs) * Type = Dairy, Beef, Swine, Poultry, Goats, Sheep, Horses
39 Crops Sold Tons/year %DM CP (%DM) P (%DM) K (%DM) Feed Type* TMR * Feed type = Grain, Forage or TMR. % forage Manure, compost and other exports Tons/year % solids N (% wet) P (% wet) K (% wet)
40 INTRODUCTION Cornell Nutrient Management Spear Program Mass Nutrient Balance Input Form Instructions March 7, 2011 The purpose of this input form is to collect the necessary data for developing a whole farm mass nutrient balance. This form can be used to develop a mass nutrient balance for any type of livestock operation (dairy, swine, poultry, etc.), or for non-livestock farms. For non-livestock farms, ignore all questions concerning animals. Send completed from to: Caroline Rasmussen, 325 Morrison Hall, Cornell University, Ithaca NY FAX: Attn: Caroline Rasmussen. cnr2@cornell.edu. FARM CHARACTERISTICS Producer Contact Information: Record the producer contact information, including address, phone and (if available). Data Collection: Enter the name and address of the CCE or agency professional collecting the data (if applicable). Enter data for the calendar year January 1, 2010 to December 31, Watershed: Enter the watershed where most of the farm owned and rented land is located in the Primary box (see the map below). If the farm is in two watersheds, enter the watershed that has the smaller farm area in the Secondary box. Farm Information Total farm acres: Enter the total owned and rented farm acres (including buildings and woodlands). All legume and non-legume tillable crop and pasture acres: Enter the total number of crop and potentially tillable pasture acres owned and rented. Legume acres (perennial and annual) >10% legume: Enter all crop and tillable pasture acres, both annual and perennial that have more than 10% legume plant content. Acres receiving manure (crop and pasture): Enter the total number of acres owned and rented that receive manure either by mechanical spreading and/or animal grazing.
41 Enter yes or no to the questions concerning the Cornell Dairy Farm Business Summary, the Farm Credit Business Summary, organic certification, intensive grazing, having a Comprehensive Nutrient Management Plan (CNMP) and having a Cornell Cropware Plan. Animal Information Enter the average number and weight per head of animals on the farm during the balance year. On dairy and beef farms, group all mature cows (milking and dry) on the first line. These are cows that have freshened one or more times. This information is used to calculate total animal units (AU). An animal unit is equal to 1,000 lbs live weight. The total animal units are the combined weight (lbs) of all animals divided by 1,000. FARM CROP PRODUCTION Record all crop and pasture production. Include crops grown for feed and for off-farm sale. Enter the percent legume in the stand. If a legume % greater than 0 is entered, check the box if manure was also spread (mechanically or by grazing livestock) on the same acreage. Enter the number of acres, the crude protein (CP), phosphorus (P) and potassium (K) content of the harvested crop (% dry matter). Select forage, grain or Bedding to describe the harvested crop. If you choose to enter the yield and inventory balances as dry matter, you can enter 100% in the DM% cell. If you will enter the yield per acre and inventories in as-fed tons, enter the harvested crop dry matter content as a percentage. If there is a change in the beginning and ending calendar year inventory of a crop produced for feed or sale, record the beginning and ending year inventory. Enter the average yield in tons (dry matter or as-fed, as selected in the previous column) per acre. If you enter the yield on a dry matter basis, also enter beginning and ending year inventories on a dry mater basis. If you entered the yield on an as-fed basis, enter the inventory on the same as-fed basis. If crop production records are not available, the quantity harvested can be estimated as shown below. Keep in mind, the shrink_fraction is the percent shrink entered as a fraction. All other inputs are in tons. Quantity harvested = [Beginning_inventory + (daily_feed_out * days_since_harvest) current_inventory] * [1 + shrink_fraction) Harvested Yield = Quantity harvested / Acres harvested NUTRIENT IMPORTS Feeds Purchased: Record the type of feed, tons purchased per year, and the percentages of dry matter, crude protein, P, and K. Select the feed type: Grain, Forage or TMR. The "% forage" is only entered when TMR is selected. If there is a change in the beginning and ending calendar year purchased feed inventory, record the beginning and ending year inventory in tons as-fed. Purchased fertilizers: Record the fertilizer type, tons purchased per year, and the percentages of N, P 2 O 5, and K 2 O. Purchased animals: Record the number of adults and young stock purchased, and the average weight per head in lbs. Bedding and miscellaneous imports: Record the number of tons, percent dry matter, N, P and K (% dry matter) for all bedding material purchased or other miscellaneous imports. Do not enter farm produced bedding. NUTRIENT EXPORTS Milk sold: Enter the annual total amount of milk sold (in lbs) and the average percent milk protein, as reported on the milk check. Animals exported: Enter the number and average live weight per head of all animals sold or exported from the farm.
42 Crops sold: Enter the type of crop sold, its quantity, and the percentages of dry matter, crude protein, P (% dry matter) and K (% dry matter). If a total mixed ration is sold, enter the proportion of the mix which is forage. Manure, compost and other exports: Record any other significant products that were sold or given away, such as manure, compost, etc. Enter the quantity, and % solids. Enter the N, P and K on a wet basis as this is the format that compost and manure analysis is commonly reported.
Northern NY Agricultural Development Program Project Report
 Northern NY Agricultural Development Program 2006-2007 Project Report Nutrient Accounting for NNY Dairy Farms: Basis for Environmentally Sound Nutrient Management Project Leader(s): Dr. Quirine M. Ketterings,
MANURE VALUE, COST AND TIME MANAGEMENT
 MANURE VALUE, COST AND TIME MANAGEMENT TUTORIAL WORKBOOK- Teaching Guide Caroline Rasmussen, Patty Ristow, Margaret Dunn, Quirine Ketterings, Tim Shepherd, Karl Czymmek NOVEMBER 2010 Nutrient Management
STATE, REGIONAL AND FARM-SCALE NUTRIENT BALANCES: TOOLS FOR ENHANCED EFFICIENCY OF WHOLE-FARM NUTRIENT USE
 STATE, REGIONAL AND FARM-SCALE NUTRIENT BALANCES: TOOLS FOR ENHANCED EFFICIENCY OF WHOLE-FARM NUTRIENT USE Quirine M. Ketterings 1, Karl J. Czymmek 1,2, Patty Ristow 1, Caroline Rasmussen 1, Sheryl N.
WHOLE-FARM NUTRIENT MASS BALANCE BENCHMARKS FOR NEW YORK DAIRIES. Department of Animal Science Cornell University
 WHOLE-FARM NUTRIENT MASS BALANCE BENCHMARKS FOR NEW YORK DAIRIES S. Cela, Q. M. Ketterings, K.J. Czymmek,2, M. Soberon, and C. Rasmussen Nutrient Management Spear Program and 2 PRO-DAIRY Department of
Getting Started with the Animal Agriculture Beef Demonstration Project
 Getting Started with the Animal Agriculture Beef Demonstration Project How to use the Demo Projects- Each demo project has been selected to help users see how COMET-Farm works and how to navigate the data
NITROGEN MANAGEMENT EVALUATION TOOL USER S MANUAL Patty Ristow, Quirine M. Ketterings, Karl Czymmek
 NITROGEN MANAGEMENT EVALUATION TOOL USER S MANUAL Patty Ristow, Quirine M. Ketterings, Karl Czymmek FEBRUARY 2011 Nutrient Management Spear Program Collaboration among the Cornell University Department
How to Complete the Grazing Manure Calculator Worksheet
 Purpose: This procedure describes how to complete the optional Grazing Group Manure Calculator in the Nutrient Management Plan (NMP) spreadsheet. This worksheet will calculate the amount of uncollected
Creating nutrient sustainability indicators for dairies nationwide
 Creating nutrient sustainability indicators for dairies nationwide Mart Ros, Karl Czymmek, Quirine Ketterings Nutrient Management Spear Program and PRO DAIRY Department of Animal Science Cornell University
PROJECTING CASH FLOWS ON DAIRY FARMS
 January 2002 E.B. 2002-04 PROJECTING CASH FLOWS ON DAIRY FARMS By Eddy L. LaDue Agricultural Finance and Management at Cornell Cornell Program on Agricultural and Small Business Finance Department of Applied
Livestock and Poultry Environmental Learning Center Webcast Series June 20, From: G. Albrecht P. Ristow
 Nutrient Management Practices for Small Livestock Farms Dr. Michael L. Westendorf Extension Specialist Rutgers University Fred Kelly New Jersey USDA-Natural Resources Conservation Service Basic Nutrient
Economics 330 Fall 2005 Exam 1. Strategic Planning and Budgeting
 Economics 330 Fall 2005 Exam 1 K E Y Strategic Planning and Budgeting Circle the letter of the best answer. You may put a square around the letter of your second choice. If your second choice is right,
Manure Management Plan Nutrient Balance Worksheet User Guide Completing Nutrient Balance Worksheets for Manure Management Plans
 Manure Management Plan Nutrient Balance Worksheet User Guide Completing Nutrient Balance Worksheets for Manure Management Plans The Manure Management Plan (MMP) must include manure application rates for
102 - PHOSPHORUS ON THE FARM FROM FEED GRAINS AND BY- PRODUCTS - by Mike Gamroth and Troy Downing, Oregon State University
 WIN 2 ME Western Integrated Nutrition and Nutrient Management Feed Management Education for the Agri-Professional 102 - PHOSPHORUS ON THE FARM FROM FEED GRAINS AND BY- PRODUCTS - by Mike Gamroth and Troy
Dry Matter Intake and Manure Production for Management Intensively Grazed Dairy Cattle
 Understanding Nutrient & Sediment Loss at Breneman Farms - 7 Introduction Dry Matter Intake and Manure Production for Management Intensively Grazed Dairy Cattle Fall 2009 Kevan Klingberg, Dennis Frame,
Cash Flow and Enterprise Information - step two for your 2016 farm analysis
 1 of 24 Name Address County Phone Email Year Born Year Started Farming Cash Flow and Enterprise Information - step two for your 2016 farm analysis Now that you have a beginning and an ending balance sheet,
An Economic Comparison of Organic and Conventional Dairy Production, and Estimations on the Cost of Transitioning to Organic Production
 An Economic Comparison of Organic and Conventional Dairy Production, and Estimations on the Cost of Transitioning to Organic Production Produced by: the Northeast Organic Farming Association of Vermont
CALS Integrated Nutrient Management for Dairy and Livestock Farms PWT
 CALS Integrated Nutrient Management for Dairy and Livestock Farms PWT Campus Co-chairs: Larry Chase (Danny Fox) Professor Dept. of Animal Science Quirine Ketterings Assistant Professor Dept. of Crop and
EXTENSION Know how. Know now.
 EXTENSION Know how. Know now. Manure Nutrient and Land Requirement Estimator Spreadsheet Instructions Version 1.0 This spreadsheet estimates a) excretion of nutrients and solids based upon ASAE Standard
Ranch Calculator (RanchCalc)
") Oklahoma Cooperative Extension Service Current Report CR-3252 0609 Oklahoma Cooperative Extension Fact Sheets are also available on our website at: facts.okstate.edu Ranch Calculator (RanchCalc) Damona
Oklahoma Cooperative Extension Service Current Report CR-3252 0609 Oklahoma Cooperative Extension Fact Sheets are also available on our website at: facts.okstate.edu Ranch Calculator (RanchCalc) Damona
Effects on Manure P and P Cycles
 Phosphorus Feeding Strategies for Dairy: Effects on Manure P and P Cycles J. Mark Powell 1 and John Peters 2 1 USDA-Agricultural Research Service, Dairy Forage Research Center; 2 Director, Soil and Forage
Dairy Replacement Programs: Costs & Analysis 3 rd Quarter 2012
 February 2014 EB 2014-02 Dairy Replacement Programs: Costs & Analysis 3 rd Quarter 2012 Jason Karszes PRO-DAIRY Department of Animal Science Charles H. Dyson School of Applied Economics and Management
New York P Index Survey: What Caused Impressive Improvements in the NYS P Balance?
 New York P Index Survey: What Caused Impressive Improvements in the NYS P Balance? Quirine Ketterings 1 and Karl Czymmek 1,2 1 Nutrient Management Spear Program, 2 PRODAIRY, Department of Animal Science,
Grass-fed and Organic Beef: Production Costs and Breakeven Market Prices, 2008 and 2009
 AS 658 ASL R2684 2012 Grass-fed and Organic Beef: Production Costs and Breakeven Market Prices, 2008 and 2009 Denise Schwab Iowa State University Margaret Smith Iowa State University H. Joe Sellers Iowa
The Vermont Dairy Farm Sustainability Project, Inc.
 The Vermont Dairy Farm Sustainability Project, Inc. The Vermont Dairy Farm Sustainability Project A Collaboration to Improve Dairy Farm Nutrient Balance Greg Weber, Project Coordinator, 2001-2003 Bill
Chapter 7. Dairy -- Farm Management Wayne A. Knoblauch, Professor George J. Conneman, Professor Emeritus Cathryn Dymond, Extension Support Specialist
 Chapter 7. Dairy -- Farm Management Wayne A. Knoblauch, Professor George J. Conneman, Professor Emeritus Cathryn Dymond, Extension Support Specialist Herd Size Comparisons The 171 New York dairy farms
Section 5: Production Management
 Introduction Lessons included the Production Management section of the elearning tool: Lesson 1: Market Steer Management...94 Lesson 2: Herd Sire Management...96 Lesson 3: Cow & Heifer Management...98
Annual Summary Data Kentucky Beef Farms 2013
 Cooperative Extension Service, University of Kentucky College of Agriculture, Food and Environment. Agricultural Economics - Extension No. 2014-04 Kentucky Farm Business Management Program Annual Summary
Cow-Calf Ranch Input Worksheet- Unit Cost of Production Workshop Users Guide
 Cow-Calf Ranch Input Worksheet- Unit Cost of Production Workshop Users Guide Introduction and Background To guide ranchers in assessing their business profitability, the BC Ministry of Agriculture is hosting
TIMELY INFORMATION. DAERS 08-4 August Making Adjustments To The Cattle Herd Due To Higher Production Costs
 AG ECONOMIC SERIES TIMELY INFORMATION Agriculture & Natural Resources DAERS 08-4 August 2008 Making Adjustments To The Cattle Herd Due To Higher Production Costs J. Walter Prevatt, Ph.D. Auburn University
DEP Manure Management Manual COMPLETING A MANURE MANAGEMENT PLAN PART 3
 DEP Manure Management Manual COMPLETING A MANURE MANAGEMENT PLAN PART 3 Manure Management Plan Summary (p.6) This section of the plan must list manure application rates by crop group Summarized on the
Annual Summary Data Kentucky Beef Farms
 Cooperative Extension Service, University of Kentucky College of Agriculture, Food and Environment. Agricultural Economics - Extension No. 2013-13 Kentucky Farm Business Management Program Annual Summary
GUIDE TO ASSEMBLING DATA FOR COW-CALF
 GUIDE TO ASSEMBLING DATA FOR COW-CALF SPA-38 STANDARDIZED PERFORMANCE ANALYSIS* Revised 1-25-06 DATA NEEDED Assembling necessary data for the Cow-Calf Standardized Performance Analysis (SPA) is the most
OSU CowCulator. A Tool for Evaluating Beef Cow Diets. Instructions for Use 1. Oregon State University. Beef Cattle Sciences. Introduction BEEF108
 Oregon State University OSU CowCulator BEEF108 A Tool for Evaluating Beef Cow Diets Beef Cattle Sciences Instructions for Use 1 D. W. Bohnert 2 The following instructions are for a modified version of
DAIRY Feed Management Plan Checklist
 DAIRY Feed Plan Checklist Feeding management is one of six components of a Comprehensive Nutrient Plan (CNMP) as defined by the Natural Resource Conservation Service. Feeding management as part of a CNMP
Sand (%) Silt (%) Clay (%)
 Silt (%) Clay (%)") Farmer name Farm Code Farm herd number Data year Annual rainfall (mm) N deposition (kg/ha) Longitude: Latitude: Dairy system characterization Calving pattern Milk produced All year round Manufacturing
Farmer name Farm Code Farm herd number Data year Annual rainfall (mm) N deposition (kg/ha) Longitude: Latitude: Dairy system characterization Calving pattern Milk produced All year round Manufacturing
Nutrient Management Strategies for Dairy-Based Agriculture
 Nutrient Management Strategies for Dairy-Based Agriculture Meeting Production and Environmental Challenges through a Variety of Technical Applications Quirine Ketterings and Karl Czymmek Nutrient Management
How to complete a Double Crop in NMP Appendix 4 Input
 Purpose: This procedure describes how to complete a Double Crop in Appendix 4 Input. If you have not yet completed a field in Appendix 4 Input and need help then please refer to the guidance document:
Survey of Cover Crop Use on New York Dairy Farms
 Survey of Cover Crop Use on New York Dairy Farms Emmaline Long 1, Quirine Ketterings 1, and Karl Czymmek 1,2 1 Nutrient Management Spear Program, and 2 PRODAIRY, Department of Animal Science, Cornell University
PROJECTED COSTS AND RETURNS FOR BEEF CATTLE, DAIRY PRODUCTION, SWINE PRODUCTION AND FORAGE CROPS IN LOUISIANA, 1997
 January 1997 A.E.A. Information Series No. 150 PROJECTED COSTS AND RETURNS FOR BEEF CATTLE, DAIRY PRODUCTION, SWINE PRODUCTION AND FORAGE CROPS IN LOUISIANA, 1997 by Robert W. Boucher Jeffrey M. Gillespie
Dairy Feed: a new cash crop. Mike Rankin Crops and Soils Agent University of Wisconsin-Extension Fond du Lac County
 Dairy Feed: a new cash crop Mike Rankin Crops and Soils Agent University of Wisconsin-Extension Fond du Lac County Cash Cropping Milk Growing or selling corn silage and/or alfalfa to dairy farms vs. selling
Economic Impact of Swine Operations. User Guide. National Pork Board
 Economic Impact of Swine Operations User Guide National Pork Board Table of Contents Economic Impact of Swine Operations... 3 Overview...3 How to use... 3 How to use guide...3 General tips...3 Instructions...
June Area: Sections G K
 NASS Survey Training June Area: Sections G K Livestock United States Department of Agriculture National Agricultural Statistics Service SECTION G Hogs and Pigs Provides data that is combined with the June
ALBERTA FARM FERTILIZER INFORMATION AND RECOMMENDATION MANAGER VERSION 2 TUTORIAL
 ALBERTA FARM FERTILIZER INFORMATION AND RECOMMENDATION MANAGER VERSION 2 TUTORIAL Table of Contents 1. Downloading the software... 2 2. Entering your information... 2 Getting started... 2 Producer/Farm
Precision Nitrogen Management of Corn
 Precision Nitrogen Management of Corn Adaptive N management: Fine-tuning Nitrogen Management for Corn Field by field, year by year Quirine M. Ketterings, Patty Ristow, and Karl Czymmek Cornell University
How to Complete the NMP Appendix 4 Input Worksheet (Appendix 4 Crop & Manure Management, Appendix 5 P Index, Winter Manure Application Matrix)
") Purpose: This procedure describes the process to complete the App Input, (Appendix 4 Crop & Manure Management), Worksheet. All of the field or Crop Management Unit, (CMU), information is entered in one
Purpose: This procedure describes the process to complete the App Input, (Appendix 4 Crop & Manure Management), Worksheet. All of the field or Crop Management Unit, (CMU), information is entered in one
Meat Animal Project Records
 Meat Animal Project Records DC-019 Meat Animal Project Records Duplicate this record for each species Page 1 Juniors Seniors (Grades 4-8) (Grade 9+) Complete pages: 1,2,3,9 & 10 Complete pages: 1-10 (comment
Strategies for Dairying Success in the Future
 Strategies for Dairying Success in the Future Richard Waybright Mason Dixon Farms, Inc. Gettysburg, Pennsylvania 29 Steps to Successful Dairying 1. Set vision goals (at least ten years ahead/dream possible
Organic Manures and Fertilizers for Vegetable Crops
 Organic Manures and Fertilizers for Vegetable Crops Brent Rowell, Extension Vegetable Specialist and Robert Hadad Animal manures contribute more to the soil than just nitrogen, phosphorus, and potassium.
2-Whole Farm Nutrient Planning; Rick Koelsch-LPES Curriculum
 2-Whole Farm Nutrient Planning; Rick Koelsch-LPES Curriculum These lessons are optimized for web viewing and therefore may not have adequate resolution for quality printing. The LPES Curriculum CD available
Low Cost Rations for More Milk Dollars
 LO Series 104 - January 1968 Low Cost Rations for More Milk Dollars W. Ray Murley, Extension Dairy Specialist CJ D Adequate feeding of the dairy herd for optimum performance and economical production is
4-H Dairy Project Record Dairy Cow
 4-H Dairy Project Record Dairy Cow Name: Age as of Jan 1: Year in Project: This project is: Ownership Managerial Year in 4-H: Junior Ldr: Yes No Date this project started: Date project or project year
AGEC 641 Chapters 8 and 9 Homework Spring 2006
 AGEC 641 Chapters 8 and 9 Homework Spring 2006 1. Suppose that you are hired as the manager of Sam's Hog and Crop Conglomerate. Sam owns two crop farms and a hog operation. Sam wishes to maximize overall
NuMan Pro 4.2: Entering Organic Amendment Information on the Scenarios Page
 Agricultural Nutrient Management Program Department of Environmental Science and Technology 0116 Symons Hall 7998 Regents Dr. College Park, MD 20742 TEL 301-405-1319 FAX 301-314-7375 www.extension.umd.edu/anmp
Linking Crop Rotations & Feeding Programs
 Linking Crop Rotations & Feeding Programs Joe Lawrence, CCA Cornell University PRO DAIRY Many Ways to Feed Cows Must follow some basic rules Some strategies are more effective than others Balance Cow Health
Development of an Adaptive Management Approach for Nutrient Management in New York
 Manitoba Agronomist Conference Development of an Adaptive Management Approach for Nutrient Management in New York Quirine Ketterings and Karl Czymmek Nutrient Management Spear Program and PRODAIRY Department
Grazing Economics 101 Keys to Being a Profitable Forage Producer MODNR-SWCP Mark Kennedy and John Turner
 Grazing Economics 101 Keys to Being a Profitable Forage Producer MODNR-SWCP Mark Kennedy and John Turner Mostly stolen from Wesley Tucker University of Missouri Extension Specialist and Cow-Calf Producer
I N S T R U C T I O N S For Completion of the NOTICE OF INTENT TO OBTAIN PERMIT COVERAGE
 New York State Department of Environmental Conservation Division of Water Bureau of Water Permits, 4 th Floor 625 Broadway, Albany, New York 12233-3505 Phone: (518) 402-8111 FAX: (518) 402-9029 Website:
WHEN TO BUY; AND WHEN TO SELL A BUSHEL OF CORN.
 WHEN TO BUY; AND WHEN TO SELL A BUSHEL OF CORN. WHEN TO BUY; AND WHEN TO SELL A BUSHEL OP CORN. One of the greatest problems confronting the American people of to -day is the food supply. In the United
Calculating Dry Matter Intake from Pasture for Ruminants
 Calculating Dry Matter Intake from Pasture for Ruminants This resource is designed to help you calculate how much dry matter your animals get from pasture and demonstrate that you have a plan to comply
Hi, I m Damona Doye. Extension Economist and in this segment, I want to highlight a few tools that may be useful to you in better tracking your
 Hi, I m Damona Doye. Extension Economist and in this segment, I want to highlight a few tools that may be useful to you in better tracking your income and expenses, assets and liabilities as well as production
extension economics report
 extension economics report EER 210 JANUARY 2003 COW CALF - PLUS : A Computer Decision Tool for Cattlemen to Improve Production Decisions Wilder N. Ferreira / Extension Associate clemson university cooperative
NUTRIENT BUDGETING AND MANAGEMENT ON ORGANIC FARMS
 NUTRIENT BUDGETING AND MANAGEMENT ON ORGANIC FARMS James McDonnell, Organic Specialist, Teagasc, Oak Park, Carlow. Mark Plunkett, Soil & Plant Nutrient Specialist, Teagasc, Johnstown Castle, Wexford. Introduction
The Cattle Feeding Industry
 The Cattle Feeding Industry Slide 1 The Cattle Feeding Industry Douglas Raine FGBT Founder by David R. Hawkins Michigan State University Slide 2 History In colonial America, cattle were harvested for meat
Northern beef case study
 MLA Cost of Production This case study outlines how a northern beef producer would calculate their cost of production for beef, using the MLA Cost of Production calculator. The northern beef herd used
Kansas Farm Economy Update Land and Leasing
 Kansas Farm Economy Update Land and Leasing Mykel Taylor Kansas State University January 10, 2017 Net Farm and Ranch Income Returns over Total Costs ($/ac) $230,000 $180,000 $130,000 $80,000 $30,000 $(20,000)
Economics 230 Lab 4 Section 1 2 Due September 24 Fall 2010 WHOLE FARM BUDGET
 Economics 230 Name Lab 4 Section 1 2 Due September 24 Fall 2010 WHOLE FARM BUDGET The purpose of this lab is to (a) learn how to prepare a whole farm budget for a hypothetical farming situation, and use
PLANTING RATE OF SOME YIELD, QUALITY, AND COST CONSIDERATIONS // m K 5 ^ jqr\m?,r,d A R \ AGRICULTURAL EXPERIMENT STATION
 FORAGE RESEARCH REPORT No. 4 November 1966 x\ PLANTING RATE OF SOME YIELD, QUALITY, AND COST CONSIDERATIONS // Q> Q A L A S K A m K 5 ^ 1 jqr\m?,r,d A R \ U N IV t K O liy O r A L A b i^ -F A ir c ia f
FACTORS THAT AFFECT THE PRICE OF MANURE AS A FERTILIZER Ray Massey, Economist University of Missouri, Commercial Ag Program
 FACTORS THAT AFFECT THE PRICE OF MANURE AS A FERTILIZER Ray Massey, Economist University of Missouri, Commercial Ag Program This paper discusses the value of manure as a soil amendment/fertilizer source.
Carbon Credit Potential from Intensive Rotational Grazing under Carbon Credit. Certification Protocols
 Carbon Credit Potential from Intensive Rotational Grazing under Carbon Credit Certification Protocols Kurt Stephenson Dept of Ag & Applied Econ Virginia Tech Blacksburg, VA 24061 Email: Kurts@vt.edu Phone
Other Unique Components
 Other Unique Components Situation Overview: A. Please detail additional areas that were part of the farm s project. As part of the project, we needed to approximately double our herd size. We were blessed
Introduction Assignment
 Sustainable Resources 12: Agriculture Introduction Assignment Student Name Student No. Address Date Postal Code Based on the instructions provided by your school, complete the following Sustainable Resources
EC Estimating the Most Profitable Use of Center-Pivot Irrigation for a Ranch
 University of Nebraska - Lincoln DigitalCommons@University of Nebraska - Lincoln Historical Materials from University of Nebraska- Lincoln Extension Extension 1974 EC74-861 Estimating the Most Profitable
Capturing Manure s Value. March 2008
 Capturing Manure s Value March 2008 Outline What are the nutrients in manure worth? Where do you need these nutrients? How do you get the nutrients to where you want them? How do you determine nutrient
Farm Profile. Name: Mailing Address: Phone: Cell phone: County (or counties) in which you farm:
 in which you farm:") Farm Profile This profile will provide the basic information for understanding your farm operation and will give you a head start on pulling together the information you will need for applying to federal
Farm Profile This profile will provide the basic information for understanding your farm operation and will give you a head start on pulling together the information you will need for applying to federal
Managing For Today s Cattle Market And Beyond: A Comparative Analysis Of ND - Demo Cow Herd To North Dakota Database
 Managing For Today s Cattle Market And Beyond: A Comparative Analysis Of ND - Demo - 160 Cow Herd To North Dakota Database By Harlan Hughes Extension Livestock Economist Dept of Agricultural Economics
Livestock Enterprise. Budgets for Iowa 2016 File B1-21. Ag Decision Maker
 Livestock Enterprise Ag Decision Maker Budgets for Iowa 2016 File B1-21 This publication contains estimates of production costs for common livestock enterprises in Iowa. Estimates are intended to reflect
2018 UW Extension Cattle Feeders Workshops UW Extension Beef Decision Making Tools
 2018 UW Extension Cattle Feeders Workshops UW Extension Beef Decision Making Tools Presented by: Bill Halfman, UW Extension Agriculture Agent- Monroe County UW Extension has several spreadsheet tools that
TIMELY INFORMATION. Agriculture & Natural Resources AGRICULTURAL ECONOMICS AND RURAL SOCIOLOGY, AUBURN UNIVERSITY, AL
 AG ECONOMIC SERIES TIMELY INFORMATION Agriculture & Natural Resources AGRICULTURAL ECONOMICS AND RURAL SOCIOLOGY, AUBURN UNIVERSITY, AL 36849-5639 DAERS 08-5 September 2008 U. S. Beef Cattle Situation
Optimization of Whole Farm Nutrient Balance: N-CyCLE. Michel A. Wattiaux 1. 1 Department of Dairy Science, UW-Madison.
 Optimization of Whole Farm Nutrient Balance: N-CyCLE Michel A. Wattiaux 1 1 Department of Dairy Science, UW-Madison wattiaux@wisc.edu Background Planning nutrient management: What are the options for producers
Opportunities and Challenges for Cow/Calf Producers 1. Rick Rasby Extension Beef Specialist University of Nebraska
 Opportunities and Challenges for Cow/Calf Producers 1 Rick Rasby Extension Beef Specialist University of Nebraska Introduction The cow/calf enterprise has been a profitable enterprise over the last few
Short Forage What to Do? Options Available Using an Example Herd
 Short Forage What to Do? Options Available Using an Example Herd By: Donna Amaral-Phillips, Ph.D. With the dry conditions this past summer, several farmers have been left with tight or short forage supplies.
Benchmarking Your Herd s Economic Facts
 Managing for Today s Cattle Market and Beyond March 2002 Benchmarking s Economic Facts By Harlan Hughes, North Dakota State University Dwight Aakre, North Dakota State University Introduction Benchmarking
2014 Michigan Dairy Farm Business Analysis Summary. Eric Wittenberg And Christopher Wolf. Staff Paper December, 2015
 2014 Michigan Dairy Farm Business Analysis Summary Eric Wittenberg And Christopher Wolf Staff Paper 2015-08 December, 2015 Department of Agricultural, Food, and Resource Economics MICHIGAN STATE UNIVERSITY
Costs to Produce Milk in Illinois 2016
 Costs to Produce Milk in Illinois 2016 Costs to Produce Milk in Illinois 2016 University of Illinois Farm Business Management Resources FBM-0160 Brandy M. Krapf, Dwight D. Raab, and Bradley L. Zwilling
Managing stock surplus to the milking herd
 10 Managing stock surplus to the milking herd This chapter discusses the classes of stock on the dairy farm that are sold to generate income. The main points in this chapter Milking cows can be culled
Costs to Produce Milk in Illinois 2003
 Costs to Produce Milk in Illinois 2003 University of Illinois Farm Business Management Resources FBM-0160 Costs to Produce Milk in Illinois 2003 Dale H. Lattz Extension Specialist, Farm Management Department
Beef Cattle Handbook
 Beef Cattle Handbook BCH-5403 Product of Extension Beef Cattle Resource Committee Feeding The Beef Cow Herd Part II Managing the Feeding Program Rick Rasby, Extension Beef Specialist, University of Nebraska
What Hay Is Right For Your Livestock. Tom Gallagher Capital Area Agriculture Horticulture Program Livestock Specialist
 What Hay Is Right For Your Livestock Tom Gallagher Capital Area Agriculture Horticulture Program Livestock Specialist What Have We Learned So Far? Renovate fields Establish new stands Maintain existing
Chenango County 4-H Livestock Project Record
 Chenango County 4-H Livestock Project Record My project is: Check all that apply. Beef Dairy Goat Meat Goat Sheep Swine Market Beef Doe Kid Market Kid Market Lamb Market Hog Breeding Heifer Doe Flock Doe
2012 STATE FFA FARM BUSINESS MANAGEMENT TEST PART 2. Financial Statements (FINPACK Balance Sheets found in the resource information)
") 2012 STATE FFA FARM BUSINESS MANAGEMENT TEST PART 2 Financial Statements (FINPACK Balance Sheets found in the resource information) Please use the Market Value when making the calculations for the Zimmerman
2012 STATE FFA FARM BUSINESS MANAGEMENT TEST PART 2 Financial Statements (FINPACK Balance Sheets found in the resource information) Please use the Market Value when making the calculations for the Zimmerman
Livestock Enterprise. Budgets for Iowa 2017 File B1-21. Ag Decision Maker
 Livestock Enterprise Ag Decision Maker Budgets for Iowa 2017 File B1-21 This publication contains estimates of production costs for common livestock enterprises in Iowa. Estimates are intended to reflect
Investigating New Marketing Options to Increase Beef Production in Ontario
 DAIRY-BEEF PRODUCTION FACT SHEET Investigating New Marketing Options to Increase Beef Production in Ontario The Beef Farmers of Ontario (BFO) has investigated potential feeding strategies with Holstein
TIMELY INFORMATION Agriculture & Natural Resources
 AG ECONOMIC SERIES TIMELY INFORMATION Agriculture & Natural Resources DAERS 2010 4 September 2010 U. S. Beef Cattle Situation and Price Outlook Walt Prevatt, Ph.D. Extension Economist and Professor Auburn
The Beef Bonanza. Thursday, April 6:00 pm Concord United Methodist Church 8066 Old Linville Rd, Marion. just shooting the bull
 The Beef Bonanza just shooting the bull McDowell county center Spring 2017 Issue Inside This Issue Cattlemens Meeting Announcement 1 Spring Pastures and Grass Tetany 2-3 Chesnee Market Report 4 Cattlemen
2018 ROSS COUNTY LIVESTOCK RECORD This Record book will be a required part of Jr. Fair Livestock Project Completion
 2018 ROSS COUNTY LIVESTOCK RECORD This Record book will be a required part of Jr Fair Livestock Project Completion Market Beef Market Hogs Market Lambs Market Goats Pen of 3 Broilers (chickens) Pen of
Biosecurity plans, LPA requirements and BJD. John Bowman, Livestock Extension Officer, Gippsland
 Biosecurity plans, LPA requirements and BJD John Bowman, Livestock Extension Officer, Gippsland Before we start, Lets see what the MLA has to say on U-Tube about changes to LPA requirements. https://www.mla.com.au/meat-safety-and-traceability/red-meat-integrity-system/about-thelivestock-production-assurance-program/lpa-learning/
SECTION II THEORETICAL CAPACITY OF KINGS COUNTY TO HOST DAIRIES
 Public Hearing - Dairy Element SECTION II THEORETICAL CAPACITY OF KINGS COUNTY TO HOST DAIRIES A. Theoretical Capacity in Kings County for Dairies Dairies generate liquid and solid (dry) manure. This liquid
Skills, Competencies and Knowledge
 4. Skills, Competencies and Knowledge This section covers the abilities you developed or things you accomplished as a result of the training and experiences you received through your agricultural education
Copyright Wolf Track Software
 Copyright 2009. Wolf Track Software No part of this publication may be reproduced in any form, by Photostat, Microfilm, xerography, or any other means, which are now known, or to be invented, or incorporated
Agricultural Model Data Inputs and Assumptions: Presentation to the Water Quality GIT October, 2014
 Agricultural Model Data Inputs and Assumptions: Presentation to the Water Quality GIT October, 2014 Curtis Dell Chair, Agricultural Modeling Subcommittee USDA-ARS PSWMRU October 8, 2014 Precipitation Phase