Planting and Harvesting Crops
|
|
|
- Edward Sparks
- 6 years ago
- Views:
Transcription
1 Planting and Harvesting Crops Chesapeake Bay Program Agricultural Workgroup s Building a Better Bay Model Workshop 05/22/2013 Gary Shenk Chesapeake Bay Program s Integrated Analysis Coordinator Photos and graphics courtesy of USDA Image Gallery and CBP
2 Topics General review of Scenario Builder Placement of crops across the landscape Plant and Harvest Dates Exposed Soil and Plowing Effects Maximum uptake of nutrients by crops Nutrient application needs Application Timing Legume Fixation Manure and inorganic fertilizer

3 Chesapeake Bay Program Modeling Tools Review of SB


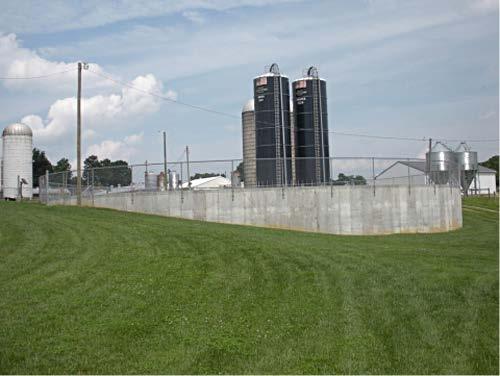
4 Scenario Builder Review of SB Manure storage practice Livestock BMPs Crops BMPs Pasture Fertilizer BMPs BMPs Image Credits Rebelwoodsranch.com Seaburst.com 4


5 Review of SB Scenario Builder Data Inputs and Outputs


6 Review of SB Digital Landscape Scenario Builder creates a digital landscape of land uses bases upon data from the Land Change Model and the USDA s Census of Agriculture. The new digital landscape is an aggregated representation of the county s land uses. Satellite Imagery Land Cover Digital Landscape
7 Review of SB Land-River Segments Land-River Segments Percent County Acres in LRSEG Land-River Segment ID Land Cover Group 1 agriculture 1.4% 2 agriculture 0.1% 3 agriculture 0.0% 4 agriculture 3.0% 5 agriculture 0.6% 6 agriculture 0.1% 7 agriculture 0.0% 8 agriculture 25.3% Percent Acres in LRSEG Each county is further broken down into modeling segments that contain sets of unique sub-watershed, political and hydrogeomorphic or climatic characteristics. The Land Change Model provides Scenario Builder the percent of a county s agricultural acres that exist within each LRSEG.

8 Review of SB Scenario Builder has 12 growth regions that inform plant and harvest dates for all crops based on freeze and frost data. State Agronomy Guides were used to determine growth regions. USDA 1990 Hardiness Zones were also used to determine growth regions.
9 Agricultural Land Uses Placement of crops Animal Feeding Operation Concentrated Animal Feeding Operations Alfalfa* High-Till without Manure* High-Till with Manure* Hay without Nutrients Hay with Nutrients* Low-Till with Manure* Pasture* Degraded Riparian Pasture Nursery * Also has nutrient management version Each crop in the Census of Agriculture maps to a land use. Crop Name Alfalfa Hay Harvested Area Corn for Grain Harvested Area Lettuce, All Harvested Area Land Use Alfalfa High-Till with Manure High-Till without Manure
10 Placement of crops Census of Agriculture Scenario Builder uses the Census of Agriculture s acres of crops (including fallow acres) to determine the total agricultural acres for each county. Total agricultural acres in each county are then placed in each LRSEG according to fractions from the Land Change Model. State County Name Crop Name DE Kent Corn for Grain Harvested Area 42,274 43,548 55,105 DE Kent Soybeans for beans Harvested Area 80,709 68,647 57,251 DE Kent Wheat for Grain Harvested Area 26,229 20,509 22,367
11 Corn, Soybeans and Wheat Harvested Acres Through Time Placement of crops Acres Harvested 4,000,000 3,500,000 3,000,000 2,500,000 2,000,000 1,500,000 1,000, , Corn Soybeans Wheat
12 Placement of crops Double Cropping Many agricultural acres produce more than one crop per year. Acres of Total Harvested Area reported by the Census of Agriculture should include double cropped acres. Scenario Builder breaks crops into those which are eligible for double cropping and those which are not Scenario Builder then breaks up the Total Harvested Area amongst cropped acres and double cropped acres.
13 Plant and Harvest Dates Plant and Harvest Dates Plant and harvest dates for crops inform timing of plant uptake, legume fixation and nutrient application. Data sources for plant and harvest dates include: Freeze/frost data from National Climatic Data Center Cooperative Extension factsheets Zadok s growth stages RUSLE 2 crop canopy estimates Somerset County, MD Crop Plant Date Harvest Date Corn for Grain 5/1 10/1 Soybeans 5/1 10/1 Tomatoes 7/1 9/1 Adams County, MD Crop Plant Date Harvest Date Corn for Grain 5/1 10/1 Soybeans 6/1 10/1 Tomatoes 6/1 10/1
14 Plant and Harvest Dates Hay, Alfalfa and Vegetables Scenario Builder currently uses only one date for planting and one for harvesting for each crop. Hay, alfalfa and most vegetables are harvested multiple times each year. First planting date and last harvest date are used for hay and alfalfa, while last planting data and last harvest date are used for vegetables.

15 Sediment Area Available to Raindrop Scenario Builder provides an aggregated area of land for each land use that is exposed and susceptible to raindrop erosion. Unexposed area is the greater of crop canopy cover crop residue cover Derived from RUSLE 2 for nearly 100 crop types. Erosion Exposed Soil

16 Plowing Effects Detached Sediment Along with the amount of land available to be eroded, Scenario Builder calculates the tons of sediment per acre that is detached by plowing. Detached sediment for plowing routines was informed by RUSLE 2.
17 Maximum Uptake Nutrient Uptake Scenario Builder defines nutrient uptake as all the nutrients removed from harvest AND from the roots and shoots of crops. Theoretical Nutrient Uptake values for each crop are calculated by combining Ag Census and literature. This theoretical uptake is transformed into Monthly Nutrient Uptake for each crop for each growing region based upon crop yield information and the number of growing degree days in each month.
18 Maximum Uptake Maximum Uptake Max Uptake for a crop is the 95 th percentile yield multiplied by the uptake per yield unit and adjusted downward 30% for typical maximum. Max uptake is a theoretical maximum that applies everywhere in the basin.
19 Local application Rates Application Rate States calculate best potential yield by crop and county DE: Average the highest 4 of the 7 Ag Census yields MD: Average the highest 60% of available Ag Census yields. NY, PA, WV Average highest 3 of last 5 Ag Census yields. The calculated value is limited to the 95 th percentile of all years and counties
20 Application Rate NM land Application Rate Maximum Application Rates were taken from state agronomy guides or nutrient management recommendations. The Maximum Application Rates are used where the Best Potential Yield is greater than the 95 th percentile of yields If the local yield is lower than the 95 th percentile by 20%, then the application is lower by the same percentage.
21 Non-Nutrient Management Application Rate Application Rate Non-Nutrient Management Application Rates are set between the maximum application rate and the local nutrient management rate: Non-nutrient management application rate = Maximum Application Rate ((1-fraction of Maximum Application Rate provided by organic nutrients) * 0.95 * (Maximum Application Rate - Nutrient Management Application Rate)) This means that Non-Nutrient Management Application Rates in counties with sufficient organic nutrients (manure and biosolids) to fulfill crop need will be higher than in counties without sufficient organic nutrients.
22 NM and nonnm applications Nutrient management land use Nutrient Management Adjusted for local conditions NM rate + 5% Toward Manure nonnm Non-Nutrient management land use Sliding scale Application Rate Maximum Application manure fertilizer manure fertilizer manure manure manure No manure some manure sufficient manure No manure some manure sufficient manure
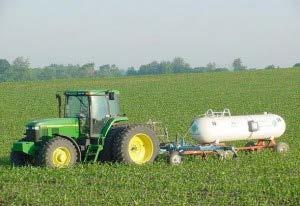
23 Nutrient Application Timing Application Timing Application timing is informed by Zadok s growth stages and state nutrient management guides. The following methods are used in special cases: If nutrient management guide recommends nutrients prior to planting, nutrients are applied 20 days before planting. If not specified, small grains, hay and pasture nutrients are applied 60 days after planting. If guides recommend application when vines start to run, nutrients are applied 60 days after planting. If guides recommend nutrients banded with planter, nutrients are applied 0 days after planting. If guides recommend nutrients broadcast and disked in, nutrients are applied 20 days before planting.
24 Legume Fixation Legumes Some crops fix nitrogen from the atmosphere. This nitrogen fixation is accounted for in Scenario Builder as a source that fulfills a crop s nitrogen need. Nitrogen Fixation for subset of PA crops Crop Nitrogen Fixation (Lbs/Acre/Year) Alfalfa Hay 240 Green Lima Beans 300 Soybeans 130 Vetch Seed 300
25 Organic vs. Inorganic Manure and Inorganic Fertilizer Scenario Builder applies both organic and inorganic nutrients to crops. Organic nutrients are estimated based upon animal populations, and are supplied to the crop through manure. Inorganic nutrients (fertilizers) are used in two ways: To fulfill a crop whose need MUST be filled by inorganic nutrients as defined by agronomy guides, and To fulfill the leftover crop need when all organic nutrients are applied.
26 Issues to Consider What data are available that could modify the Model s assumptions for nutrient needs, crop yields and uptake? What data are available from the fertilizer industry, state chemistry labs, or other sources that could inform the Model about fertilizer use across the watershed? Are there data available to reflect organic and inorganic nutrient use across crop types? e.g., Can we definitively say that a percent of cropland for X crop in Y county does NOT receive manure? What data are available that could inform how both organic and inorganic nutrients are transported throughout the watershed from sales or production sites to be used on individual farms?
Agricultural Model Data Inputs and Assumptions: Presentation to the Water Quality GIT October, 2014
 Agricultural Model Data Inputs and Assumptions: Presentation to the Water Quality GIT October, 2014 Curtis Dell Chair, Agricultural Modeling Subcommittee USDA-ARS PSWMRU October 8, 2014 Precipitation Phase
Nutrient Application Management November 20, 2014
 APPENDIX F: TECHNICAL REQUIREMENTS FOR TIER 1AND TIER 2 NUTRIENT APPLICATION MANAGEMENT BMPs TRACKING, REPORTING, DATA QUALITY, NEIEN, SCENARIO BUILDER, AND THE WATERSHED MODEL Background: In June 2013
Poultry in the Chesapeake Bay Program s Phase 6 Watershed Model
 Poultry in the Chesapeake Bay Program s Phase 6 Watershed Model Matt Johnston University of Maryland CBPO CBPO Non-Point Source Data Analyst Gary Shenk USGS CBPO Phase 6 Model Structure How much? Applied
Review of Fertilizer Spread Options for Phase 6
 Review of Fertilizer Spread Options for Phase 6 Curtis Dell, USDA-ARS-PSWMRU Chair of AMS Matt Johnston, UMD CBPO Non-Point Source Data Analyst 1 Phase 6 Model Structure Phase 6 Average Load + Inputs *
APPENDIX F: TECHNICAL REQUIREMENTS FOR ENTERING TIER 1AND TIER 2 NUTRIENT MANAGEMENT BMPs INTO SCENARIO BUILDER AND THE WATERSHED MODELS
 APPENDIX F: TECHNICAL REQUIREMENTS FOR ENTERING TIER 1AND TIER 2 NUTRIENT MANAGEMENT BMPs INTO SCENARIO BUILDER AND THE WATERSHED MODELS Background: In June 2013 the Water Quality Goal Implementation Team
CAST Pass Through Factors and Deliverd Loads for New Wastewater Sources in Phase 6 Model
 CAST Pass Through Factors and Deliverd Loads for New Wastewater Sources in Phase 6 Model A Presentation to the CBP Wastewater Workgroup July 11, 2017 Ning Zhou, CBPO New Wastewater Sources in CAST For
Review of Management Scenarios for the Chesapeake Bay Program s Phase 6 Watershed Model. David T. Lightle Erosion Model Consultant December 17, 2016
 Review of Management Scenarios for the Chesapeake Bay Program s Phase 6 Watershed Model David T. Lightle Erosion Model Consultant December 17, 2016 Resources Used Resources provided consisted of a limited
Modeling the Urban Stormwater (and the rest of the watershed) Katherine Antos, Coordinator Water Quality Team U.S. EPA Chesapeake Bay Program Office
 Katherine Antos, Coordinator Water Quality Team U.S. EPA Chesapeake Bay Program Office") Modeling the Urban Stormwater (and the rest of the watershed) Katherine Antos, Coordinator Water Quality Team U.S. EPA Chesapeake Bay Program Office May 13, 2010 Management Actions Chesapeake Bay Program
Modeling the Urban Stormwater (and the rest of the watershed) Katherine Antos, Coordinator Water Quality Team U.S. EPA Chesapeake Bay Program Office May 13, 2010 Management Actions Chesapeake Bay Program
Proposed Interim Application Reduction Efficiency
 Proposed Interim Application Reduction Efficiency 1 Terminology Historically, CBP has referred to application reduction as nutrient management Comprehensive nutrient management involves having the correct
Soils Characterize how legacy nutrients (especially legacy P) impact nutrient losses from agricultural lands. 59,60,61,62
 impact nutrient losses from agricultural lands. 59,60,61,62") s for Chesapeake Bay Program Partnership Phase 6.0 Models From Building a Better Bay Model: A for Partners, May 22-23, 2013 Prioritized by the Workgroup's Subcommittee on September 12, 2013 Task Task Line
s for Chesapeake Bay Program Partnership Phase 6.0 Models From Building a Better Bay Model: A for Partners, May 22-23, 2013 Prioritized by the Workgroup's Subcommittee on September 12, 2013 Task Task Line
USC BMP Definitions - Agricultural Best Management Practices (including NEIEN Code Id)
") USC BMP Definitions - Agricultural Best Management Practices (including NEIEN Code Id) Animal Waste Management Systems or Waste Storage Facility (840, 23) Practices designed for proper handling, storage,
USC BMP Definitions - Agricultural Best Management Practices (including NEIEN Code Id) Animal Waste Management Systems or Waste Storage Facility (840, 23) Practices designed for proper handling, storage,
E3 Model Scenario Purpose and Definitions
 E3 Model Scenario Purpose and Definitions Gary Shenk (USGS) Jeff Sweeney (EPA) Chesapeake Bay Program Office Water Quality GIT Meeting August 14, 2017 Documentation of E3 and Planning Targets Chesapeake
Chesapeake Bay Program Models:
 Chesapeake Bay Program Models: A Guide to Better Understanding Modeling and Decision Support Tool Forum Penn State Harrisburg August 1, 2011 1 Mark Dubin Agricultural Technical Coordinator University of
Integrating Agricultural Land Management into a Watershed Response Model
 Integrating Agricultural Land Management into a Watershed Response Model Adam Freihoefer, Tom Beneke, & Aaron Ruesch Wisconsin Department of Natural Resources NCASI Northern Region Meeting May 6, 2014
Integrating erosion and phosphorus runoff assessment with nutrient management planning in SnapPlus
 Integrating erosion and phosphorus runoff assessment with nutrient management planning in SnapPlus L Laura Ward Good Department of Soil Science University of Wisconsin-Madison What is nutrient management
We re looking for residue Have you seen any?
 We re looking for residue Have you seen any? Delaware s Cropland Transect Survey Marcia Fox & Tyler Monteith DNREC Watershed Assessment and Management Section Why residue? What is residue? Leftover crops
Chesapeake Bay Watershed Model Construction Land Use
 Chesapeake Bay Watershed Model Construction Land Use Guido Yactayo University of Maryland Center for Environmental Science U.S. EPA Chesapeake Bay Program Office Matt Johnston University of Maryland Department
PHASE 6 COVER CROPS EXPERT PANEL
 PHASE 6 COVER CROPS EXPERT PANEL APRIL 21, 2016 IDENTITY AND EXPERTISE OF PANEL MEMBERS Name Affiliation Role Ken Staver University of Maryland Panel Chair Charlie White Penn State University Panel Member
Nutrient Management Panel Phase 5 Report
 Nutrient Management Panel Phase 5 Report Agriculture and Watershed Technical Workgroup Discussion July 16, 2015 1 A Glimpse to How We Got Here Fall 2011 Ag Workgroup convenes the Phase 5 Nutrient Management
Assessing Benefits of Winter Crops
 Assessing Benefits of Winter Crops Winter Crops for Bioenergy Workshop March 29, 2011 Presentation for Penn State Bioenergy Short Course Series 2011 Dan Dostie, State Resource Conservationist, USDA NRCS,
Rapid National Model Assessments to Support US Conservation Policy Planning Mike White
 Rapid National Model Assessments to Support US Conservation Policy Planning Mike White USDA-ARS Grassland, Soil and Water Research Laboratory, Temple, TX 1 Topics Current National Assessments Future National
Snap Plus and P Index Update. Larry Bundy, Sue Porter, and Laura Ward Good Dept. of Soil Science, UW-Madison & WDATCP
 Snap Plus and P Index Update Larry Bundy, Sue Porter, and Laura Ward Good Dept. of Soil Science, UW-Madison & WDATCP SNAP-Plus Nutrient management planning software program Phosphorus Index Nutrient management
BMP Verification: What is it and How Will it Impact Pennsylvania?
 BMP Verification: What is it and How Will it Impact Pennsylvania? Chesapeake Bay Program Conservation District and Agency Staff Meeting March 13, 2017 + over 400 other unique practices approved by the
Conventional Tillage 0-15% Residue Reduced Tillage 15-30% Residue Mulch Tillage >30 % Residue Ridge Tillage >30 % Residue
 Recommendations for the Conservation Tillage Phase 6.0 Expert Panel Prepared for the Chesapeake Bay Program Partnership s Agriculture Workgroup by the Conservation Tillage Phase 6.0 Expert Panel Establishment
Iowa Nutrient Reduction Strategy: Background Information
 Iowa Nutrient Reduction Strategy: Background Information 2013 Iowa Water Conference Reid Christianson, P.E., Ph.D. Center for Watershed Protection Ellicott City, Maryland Project Components Project Goal
Chesapeake Assessment Scenario Tool CAST
 Chesapeake Assessment Scenario Tool CAST Olivia H. Devereux Interstate Commission on the Potomac River Basin 12/13/2011 GOALS FOR CAST Provide a mechanism for the states to get input and commitment from
Work-Load Issues Concerning the Use of RUSLE to Estimate Soil Losses in P Index Assessment Tools in the Mid-Atlantic Region
 March 29, 2005 MAWQP# 05-05 Work-Load Issues Concerning the Use of RUSLE to Estimate Soil Losses in P Index Assessment Tools in the Mid-Atlantic Region G.L. Mullins 1, F. J. Coale 2, T. Basden 3, D. Beegle
DRAFT Procedure used to estimate irrigation consumptive water use in the Susquehanna River Basin May 31, 2013
 DRAFT Procedure used to estimate irrigation consumptive water use in the Susquehanna River Basin May 31, 2013 1. Irrigated land, in acres, by crop was retrieved for each county in the basin using the United
Chesapeake Bay Program Watershed Modeling. Gary Shenk, Lewis Linker, Rich Batiuk Presentation to STAC 3/22/2011
 Chesapeake Bay Program Watershed Modeling Gary Shenk, Lewis Linker, Rich Batiuk Presentation to STAC 3/22/2011 1 Chesapeake Bay Partnership Models 2 Recent History of the Chesapeake Bay Program s Watershed
Erosion, Erosion, Everywhere
 Erosion, Erosion, Everywhere Main Objectives 1.Capable of describing the magnitude of accelerated soil erosion in the past and at the present. 2.Comprehend the mechanics and the factors influencing water
Membership-Phase 6 Cover Crop Panel
 Membership-Phase 6 Cover Crop Panel Name Affiliation Role Ken Staver University of Maryland Panel Chair Charlie White Penn State University Panel Member Jack Meisinger USDA Agriculture Research Service
Soil Quality, Nutrient Cycling and Soil Fertility. Ray Ward Ward Laboratories, Inc Kearney, NE
 Soil Quality, Nutrient Cycling and Soil Fertility Ray Ward Ward Laboratories, Inc Kearney, NE www.wardlab.com Purposes of Soil Quality Employ new & modified crop management systems Increase efficiency
Phase 6 Land Use. Peter Claggett, U.S. Geological Survey Quentin Stubbs, U.S. Geological Survey
 Phase 6 Land Use Peter Claggett, U.S. Geological Survey Quentin Stubbs, U.S. Geological Survey Building a 2012 Phase 6 Land Use Raster Database: Land Use Land Cover Two Primary Approaches Towards constructing
Nutrient Management in Crop Production
 Nutrient Management in Crop Production Dr. John E. Sawyer Associate Professor Soil Fertility Extension Specialist Focus On Agriculture Water Quality Hypoxia Pfiesteria piscicida Nitrate Tile Flow Sediment
Revised Universal Soil Loss Equation
 Revised Universal Soil Loss Equation April 2003 Sustainable Agriculture Resource Section AGDEX # 572/751 In April 2002, the Agricultural Crop Rotation Act (ACRA) was adopted to protect water and soil quality
Improved Simulation of Soil and. Manure Phosphorus Loss in SWAT
 Improved Simulation of Soil and Manure Phosphorus Loss in SWAT SWAT Conference October, 2015 at Purdue University Amy S. Collick, Pete J. Kleinman, Tamie Veith, Daren Harmel, Mike White, Pete Vadas, USDA-ARS
August 1994 Bulletin #XCM-175
 Best Management Practices For Phosphorus Fertilization August 1994 Bulletin #XCM-175 Principal author: In association with: Reagan M. Waskom Extension Water Quality Specialist Colorado State University
Cover Crops and Soil Health
 Cover Crops and Soil Health Sheboygan River Progressive Farmers Spring Field Day and Kickoff Event June 13, 2018 Second Look Holsteins Eden, WI Mike Ballweg Crops and Soils UW-Extension Sheboygan County
Agricultural Chemicals and Groundwater Protection
 Economic Considerations of Nutrient Management BMPs Concern about nutrients from fertilizers and manure degrading water supplies has resulted in a search for nutrient management approaches that protect
Watershed Model Structure. Dave Montali WV DEP Gary Shenk CBPO WQGIT 10/7/2014
 Watershed Model Structure Dave Montali WV DEP Gary Shenk CBPO WQGIT 10/7/2014 CREATE The Models REVIEW The Models USE The Models 2 A way to think about model updates Model Structure simulating the physical
Reporting of USDA Conservation Practices for Chesapeake Bay
 Reporting of USDA Conservation Practices for Chesapeake Bay Olivia H. Devereux, DEC, Inc. December 6, 2012 BMP Verification Review Panel with Dean Hively, USGS EGSC USGS Project Objectives To assist the
Objectives of the Study
 Integration of AGNPS, GIS, and Remote Sensing for Estimating Nonpoint Source Pollution in the Saginaw Bay, Michigan Chansheng He Department of Geograophy Western Michigan University Kalamazoo, MI 49008
Maryland Nutrient Management Program
 Maryland Nutrient Management Program Nutrient management planning plays a key role in reducing nutrients from agricultural non-point sources Maryland Nutrient Management Program (MNMP) was established
Part 1: Technical Requirements for Reporting and Crediting Manure Treatment BMPs without Monitoring Data
 Appendix A. Technical Requirements for the Reporting and Crediting of Manure Treatment Technologies in Scenario Builder and the Phase 6.0 Watershed Model Presented to the WTWG for Review and Approval:
The Phosphorus Management Tool
 The Phosphorus Management Tool Heather Hutchinson Nutrient Management Specialist June 18, 2013 Understanding Phosphorus Why are soils high in phosphorus? Why is phosphorus a problem? How is phosphorus
Agricultural Phosphorus Management
 Best Management Practices P Agricultural Phosphorus Management Bulletin XCM-175 Best Management Practices Principal authors: Troy Bauder Extension Water Quality Specialist Department of Soil and Crop Sciences
Degradation of the resource Fertility loss Organic matter Tilth degradation. Water quality Sediment Nutrients
 Near Blue River ca. 1980 Degradation of the resource Fertility loss Organic matter Tilth degradation Water quality Sediment Nutrients Program cost Cheaper to prevent Still expensive Long-term productivity
Cover crops- Potential impacts on soil fertility and water quality
 Cover crops- Potential impacts on soil fertility and water quality Eileen Kladivko and George Van Scoyoc Agronomy Dept., Purdue University Sources of information ATTRA (Appropriate Technology Transfer
Nutrient Management in Kentucky
 IP-71 Nutrient Management in Kentucky Nutrient Management Focus Group, Environmental and Natural Resource Issues Task Force AGRICULTURE & NATURAL RESOURCES FAMILY & CONSUMER SCIENCES 4-H/YOUTH DEVELOPMENT
DEP Manure Management Manual COMPLETING A MANURE MANAGEMENT PLAN PART 3
 DEP Manure Management Manual COMPLETING A MANURE MANAGEMENT PLAN PART 3 Manure Management Plan Summary (p.6) This section of the plan must list manure application rates by crop group Summarized on the
The Science of Integrated Crop Livestock Systems
 The Science of Integrated Crop Livestock Systems Alan J. Franzluebbers Ecologist TN MS AL GA MD VA NC SC FL Watkinsville GA Why? Production Farms operating on marginal profit Economic vulnerability with
Resource Conserving Crop Rotation & Alternative Livestock Watering System
 Ken Teske Pottawatomie County Resource Conserving Crop Rotation & Alternative Livestock Watering System Cooperator: Ken Teske 19900 Golden Belt Road Onaga, Ks. 66521 Water Quality Concerns: Run-off of
Field Layout / 2012 Crop Plan Field I: acres FSA Farm / Tract Numbers:
 Appendix : Farm Map and Rotation Plan, Courtesy of Vilicus Farms, Havre, MT (VB grower) Field Layout / 0 Crop Plan Field I:. acres FSA Farm / Tract Numbers: 8 80 Non-Organic Crops Pasture...9 W.9.8..9
Manure Management Facts Managing Manure within Tillage Systems and Crop Rotations
 Manure Management Facts Managing Manure within Tillage Systems and Crop Rotations January 2009 Introduction Manure is a valuable source of nutrients for crop production. Most crop rotations can be designed
Diversified crop rotations balance productivity, profitability, and environmental quality
 Diversified crop rotations balance productivity, profitability, and environmental quality Hanna Poffenbarger August 11, 2017 Prairie Lakes Conference Okoboji, IA 1 Special thanks to: M. Liebman C. Chase
Residue for Cover Crops in RUSLE2
 Residue for Cover Crops in RUSLE2 There have been numerous complaints that RUSLE2 soil loss predictions will increase when a no-till cover crop is added into the normal crop rotation. Logically, this should
Cover Crops 101: Advice for Growers
 Cover Crops 101: Advice for Growers Dr. Yvonne Lawley Department of Plant Science University of Manitoba yvonne.lawley@umanitoba.ca Cover Crop Paradigm Shifted Cover crops now conventional in North America
December 2002 Issue # PHOSPHORUS MANAGEMENT ON HIGH PHOSPHORUS SOILS. Angela Ebeling, Keith Kelling, and Larry Bundy 1/ Introduction
 December 2002 Issue #12 2002 PHOSPHORUS MANAGEMENT ON HIGH PHOSPHORUS SOILS Angela Ebeling, Keith Kelling, and Larry Bundy 1/ Introduction Soil phosphorus (P) is important for crop production. Phosphorus
Potential Process to Update Manure Generation Data for Phase 6 Model. April 19 th, 2018
 Potential Process to Update Generation Data for Phase 6 Model April 19 th, 2018 1.Define Crop Application Goal 2. Define Available to Crops 4. Define Inorganic Fertilizer Available to Crops Crop Application
Discovery Farms Minnesota N and P, what is happened in Farm Fields? Jerome Lensing January 9, 10, 11, 2018 AgVise Labs
 Discovery Farms Minnesota N and P, what is happened in Farm Fields? Jerome Lensing January 9, 10, 11, 2018 AgVise Labs Jerome.lensing@hotmail.com Discovery Farms is a farmer led water quality research
No-till, Nitrogen and Manure Management
 No-Till is here to Stay! No-till, Nitrogen and Manure Management Jeffrey Graybill, MS, CCA Penn State Extension Lancaster County, PA jgraybill@psu.edu 717-394-6851 It works! In 2009: 1.25 Million acres
SECTION 7. APPORTIONING DATA TO THE WATERSHED MODEL - HSPF SEGMENTATION AND LAND USE CLASSIFICATIONS
 SECTION 7. APPORTIONING DATA TO THE WATERSHED MODEL - HSPF SEGMENTATION AND LAND USE CLASSIFICATIONS The Scenario Builder model performs calculations at a county scale. Output may also be delivered at
NUTRIENT MANAGEMENT WHAT S DOABLE. John E. Sawyer Associate Professor Soil Fertility Extension Specialist Department of Agronomy Iowa State University
 NUTRIENT MANAGEMENT WHAT S DOABLE John E. Sawyer Associate Professor Soil Fertility Extension Specialist Department of Agronomy Iowa State University Successful production of agronomic crops requires careful
Starter Fertilizer for Corn in Vermont
 Starter Fertilizer for Corn in Vermont By Bill Jokela, Extension Soils Specialist, University of Vermont Extension The Basics of Starter Fertilizer What is starter fertilizer? Starter fertilizer refers
Phase 6 Approval Process
 Phase 6 Approval Process Background The Principal Staff Committee (PSC) of the Chesapeake Bay Program (CBP) directed development of the 2017 modeling tools in order to 1) help guide implementation of CBP
Nutrient Management Examination Competency Areas Individual Specialists
 Examination Competency Areas Individual Specialists The competency areas in this listing were developed according to the requirements of Pennsylvania s Specialist Certification Program. If a person understands
Restoring the Water-Quality Conditions in the Chesapeake Bay: What is working and what still needs to be done
 Restoring the Water-Quality Conditions in the Chesapeake Bay: What is working and what still needs to be done Scott Phillips, USGS Water-Quality Goal Team January 12, 2015 Many Contributors Authors: Christina
Cover Crops (Section 6.3)
") Cover Crops (Section 6.3) Conceptually they are meant to provide cover to prevent erosion during fallow periods between cash crops. They can provide a variety of benefits to the crop rotation. The intended
Cover Crops (Section 6.3) Conceptually they are meant to provide cover to prevent erosion during fallow periods between cash crops. They can provide a variety of benefits to the crop rotation. The intended
Managing nutrient needs in organic farming. Judith Nyiraneza
 Managing nutrient needs in organic farming Judith Nyiraneza Managing nutrient supply One of the main challenge facing the organic farmer: In short-term: supply sufficient nutrient to the crop to achieve
WQ221 Spreading Poultry Litter With Lab Analysis but Without Soil Tests...
 1 of 9 2/1/2010 11:26 AM University of Missouri Extension WQ221, Reviewed January 2009 Spreading Poultry Litter With Lab Analysis but Without Soil Tests Charles D. Fulhage and Donald L. Pfost Department
Annual Phosphorus Loss Estimator (APLE) Model Sensitivity Analysis. Guido Yactayo - UMCES
 Model Sensitivity Analysis. Guido Yactayo - UMCES") Annual Phosphorus Loss Estimator () Model Sensitivity Analysis Guido Yactayo - UMCES 4-22-5 Objectives To implement 2.4 in our suite of models To estimate model sensitivity to change in phosphorus inputs
Annual Phosphorus Loss Estimator () Model Sensitivity Analysis Guido Yactayo - UMCES 4-22-5 Objectives To implement 2.4 in our suite of models To estimate model sensitivity to change in phosphorus inputs
Cover crops and soil health. Erin Silva, Organic Production Specialist University of Wisconsin, Dept. of Plant Pathology
 Cover crops and soil health Erin Silva, Organic Production Specialist University of Wisconsin, Dept. of Plant Pathology Purposes of cover crops Reduce erosion from water and wind Increase soil organic
Greenhouse gases and agricultural: an introduction to the processes and tools to quantify them Richard T. Conant
 Greenhouse gases and agricultural: an introduction to the processes and tools to quantify them Richard T. Conant Natural Resource Ecology Laboratory Colorado State University Perturbation of Global Carbon
Act 38 Nutrient Balance Sheet Standard Format Word Version User Guide & Sample Nutrient Balance Sheet October 2017
 Act 38 Nutrient Balance Sheet Standard Format Word Version User Guide & Sample Nutrient Balance Sheet Pennsylvania Nutrient Management Program Pennsylvania's Nutrient Management Act (Act 38, 2005) Introduction
HOW CHANGES IN NUTRIENT MANAGEMENT REGULATIONS WILL AFFECT FORAGE PRODUCTION
 HOW CHANGES IN NUTRIENT MANAGEMENT REGULATIONS WILL AFFECT FORAGE PRODUCTION Dick Wolkowski and Larry Bundy Department of Soil Science University of Wisconsin What are the issues Forage producers typically
Intensification and nutrient management in dryland cropping systems. Jay B. Norton
 Intensification and nutrient management in dryland cropping systems Jay B. Norton Nutrient supply = yield potential f(available water). To increase yields must enhance: Nutrient supply to the crop Available
Agriculture Action Packet DRAFT Attachment # FARM MAP EXAMPLE DRAFT
 Attachment # FARM MAP EXAMPLE Attachment # Conservation Systems to Meet the PA E&S Guidelines to be Used as an Interim Guideline when a Plan Meeting Soil Loss (T) Cannot be Obtained Guiding Principles
IS FALL TILLAGE FOLLOWING SOYBEAN HARVEST NECESSARY? 1/
 IS FALL TILLAGE FOLLOWING SOYBEAN HARVEST NECESSARY? / Introduction As growers look for opportunities to enhance profit margins, the need for fall tillage following soybean harvest is questioned. Although
How much nitrogen is in a healthy Iowa soil from 0-45?
 How much nitrogen is in a healthy Iowa soil from 0-45? a. 0-100 lbs per acre c. 5000-7000 lbs per acre b. 2000-4000 lbs per acre d. 9000-11000 lbs per acre How much nitrogen is in a healthy Iowa soil from
SOLUTIONS. Developing Whole-Farm Nutrient Plans for Feedlots. For Open Feedlot Operators
 Developing Whole-Farm Nutrient Plans for Feedlots Iowa is a state with many farmer/feeders. Manure from feedlot cattle is a valuable source of fertilizer nutrients. However, as agriculture, as a whole,
Attachment # 1. Commonwealth of Pennsylvania. Pennsylvania Code. Title 25. Environmental Protection. Department of Environmental Protection
 Attachment # 1 Commonwealth of Pennsylvania Pennsylvania Code Title 25. Environmental Protection Department of Environmental Protection Chapter 102.4 1 Attachment #1 Pennsylvania Code, 102.4 Erosion and
Incorporating monitoring, modeling and trends analyses into management decisions: a Choptank River example
 Incorporating monitoring, modeling and trends analyses into management decisions: a Choptank River example Emily Trentacoste, PhD EPA Chesapeake Bay Program WQGIT Meeting 7/10/2017 DRAFT. DO NOT CITE OR
Phosphorus Dynamics and Mitigation in Soils
 Phosphorus Dynamics and Mitigation in Soils Umass Extension - Managing Phosphorus in Organic Residuals Applied to Soils: Composts, Biosolids, Manures and Others November 2, 2016 - Marlborough, MA Jennifer
Cover Crops and Soil Health Harvesting the Potential: Environmental Impacts of Cover Crops
 Cover Crops and Soil Health Harvesting the Potential: Environmental Impacts of Cover Crops February 18, 2014 Omaha, Nebraska The Role of Winter Cover Crops in the Restoration of Chesapeake Bay Ken Staver
MANURE MANAGEMENT IMPACTS ON PHOSPHORUS LOSS WITH SURFACE RUNOFF AND ON-FARM PHOSPHORUS INDEX IMPLEMENTATION. AN OVERVIEW OF ONGOING RESEARCH
 MANURE MANAGEMENT IMPACTS ON PHOSPHORUS LOSS WITH SURFACE RUNOFF AND ON-FARM PHOSPHORUS INDEX IMPLEMENTATION. AN OVERVIEW OF ONGOING RESEARCH Antonio P. Mallarino, professor Brett. L. Allen and Mazhar
United States Department of Agriculture (USDA) Highlights of various programs. Wetlands Reserve program (WRP)
 Highlights of various programs. Wetlands Reserve program (WRP)") Funding Sources: (USDA) United States Department of Agriculture The following is a listing of the various funding sources offered to farmers by the USDA. Each source shows the eligibility, what it will
Funding Sources: (USDA) United States Department of Agriculture The following is a listing of the various funding sources offered to farmers by the USDA. Each source shows the eligibility, what it will
Evaluation of Nutrient Use Efficiency Using County and Hydrologic Unit Nutrient Budgets for U.S. Cropland and Soil Test Summaries
 Evaluation of Nutrient Use Efficiency Using County and Hydrologic Unit Nutrient Budgets for U.S. Cropland and Soil Test Summaries ASA-CSSA-SSSA International Annual Meeting November 3, 2009 Paul E. Fixen,
Cover Crops Strategies After Short Season Crops
 Cover Crops Strategies After Short Season Crops Wisconsin Cover Crop Webinar Series January 31, 2018 Mike Ballweg, UW-Extension Crops and Soils Educator Sheboygan County Matt Ruark, UW-Madison, Soil Science
North Carolina State University. USDA, Agricultural Research Service Univ. MD Center for Environ. Science. Delaware Dep.
 Phase 6 Nutrient Management Expert Panel Name Frank Coale, chair Deanna Osmond Doug Beegle Jack Meisinger Tom Fisher Quirine Ketterings Affiliation University of Maryland North Carolina State University
Reducing Livestock s Winter-Feed Costs. Mark Landefeld Extension Educator, Agriculture & Natural Resources, Monroe County
 Reducing Livestock s Winter-Feed Costs Mark Landefeld Extension Educator, Agriculture & Natural Resources, Monroe County Dorn minnesota fuel cost estimator March 27, 2009 Table 1. Diesel fuel cost per
Unit E: Basic Principles of Soil Science. Lesson 8: Employing Conservation Tillage Practices
 Unit E: Basic Principles of Soil Science Lesson 8: Employing Conservation Tillage Practices 1 Terms Conservation tillage Continuous cropping Conventional tillage Crop rotation Double cropping Organic farming
1998 Missouri Crop Costs and 2000 Crop Cost of Production Estimates
 1998 Missouri Crop Costs and 2000 Crop Cost of Production Estimates Raymond E. Massey Crops Economist, Commercial Agriculture Program This report summarizes the enterprise records for the 1998 Management
AGRICULTURAL & APPLIED ECONOMICS
 University of Wisconsin-Madison February 2001 Staff Paper No. 439 A Study of Costs of Compliance Related to Non-Point Pollution: Rules for Wisconsin Crop Producers By T. Randall Fortenbery AGRICULTURAL
Livestock and Poultry Environmental Learning Center Webcast Series June 20, From: G. Albrecht P. Ristow
 Nutrient Management Practices for Small Livestock Farms Dr. Michael L. Westendorf Extension Specialist Rutgers University Fred Kelly New Jersey USDA-Natural Resources Conservation Service Basic Nutrient
Sector Load Growth Demonstration Technical Memorandum
 Sector Load Growth Demonstration Technical Memorandum VERSION 1.0 Point Source Load Sectors: MS4s, Construction, CAFOs, Municipal and Industrial WWTP, CSOs and Air Deposition and Emissions Subject to Federal
Using Cover Crops to Reduce Leaching. Losses of Nitrate
 Using Cover Crops to Reduce Leaching USDA-ARS National Laboratory for Agriculture and the Environment Ames, Iowa Tom Kaspar, Ben Knutson, Keith Kohler, Kent Heikens, Dan Jaynes, Tim Parkin, Tom Moorman,
EMERGENCY FORAGES: TARGETING GAPS IN THE GROWING SEASON. Nick Schneider 1/ Introduction
 EMERGENCY FORAGES: TARGETING GAPS IN THE GROWING SEASON Nick Schneider 1/ Introduction Drought experienced through much of Wisconsin during the summer has reduced the states dry alfalfa inventory by 32%
Natural Resources & Environmental Stewardship
 Natural Resources & Environmental Stewardship Fundamentals of Nutrient Management Melissa L. Wilson Department of Environmental Science & Technology Ag Nutrient Management Program University of Maryland,
Animal, Plant & Soil Science. D2-4 Conservation Tillage Practices
 Animal, Plant & Soil Science D2-4 Conservation Tillage Practices Interest Approach Ask students what challenges the first farmers faced as colonists moved across North America. Some of the challenges involved
Economics 330 Fall 2005 Exam 1. Strategic Planning and Budgeting
 Economics 330 Fall 2005 Exam 1 K E Y Strategic Planning and Budgeting Circle the letter of the best answer. You may put a square around the letter of your second choice. If your second choice is right,