Structural Transformation in Africa
|
|
|
- Abel Alexander
- 6 years ago
- Views:
Transcription
1 Policy Research Working Paper 7743 WPS7743 Structural Transformation in Africa A Historical View Maria Enache Ejaz Ghani Stephen O Connell Public Disclosure Authorized Public Disclosure Authorized Public Disclosure Authorized Public Disclosure Authorized Macroeconomics and Fiscal Management Global Practice Group July 2016
2 Policy Research Working Paper 7743 Abstract This paper presents evidence suggesting that the relationship between income and economic structure is shifting over time, with countries across the income distribution uniformly increasing the share of labor in service sectors and an increasingly less stark relationship between manufacturing intensity and gross value added per capita. The paper then assesses historical patterns of productivity convergence at a more detailed sector disaggregation than has been previously available. The analysis finds suggestive evidence that, at least in recent decades, convergent pressures in services industries are stronger than in manufacturing. Focusing on African economies, the paper presents a country-by-country historical analysis of structural change over the past four decades. Given the varied patterns and trends in structural change across African countries, it is difficult to characterize structural change from a single, continent-wide perspective. Some countries saw an early transition of labor out of agriculture, with manufacturing absorbing this labor in the decades prior to the 1990s, while another group of countries saw a later transition out of agriculture, where the services sector played a large role in labor reallocations in the 1990s and 2000s. Finally, the paper provides a country-by-country structural transformation scorecard to assess patterns of structural change in jobs and growth. This paper is a product of the Macroeconomics and Fiscal Management Global Practice Group. It is part of a larger effort by the World Bank to provide open access to its research and make a contribution to development policy discussions around the world. Policy Research Working Papers are also posted on the Web at The authors may be contacted at The Policy Research Working Paper Series disseminates the findings of work in progress to encourage the exchange of ideas about development issues. An objective of the series is to get the findings out quickly, even if the presentations are less than fully polished. The papers carry the names of the authors and should be cited accordingly. The findings, interpretations, and conclusions expressed in this paper are entirely those of the authors. They do not necessarily represent the views of the International Bank for Reconstruction and Development/World Bank and its affiliated organizations, or those of the Executive Directors of the World Bank or the governments they represent. Produced by the Research Support Team
3 Structural Transformation in Africa: A Historical View Maria Enache, Ejaz Ghani, and Stephen O Connell Keywords: Africa, Growth, Jobs, Structural Transformation. Contact information. Enache: World Bank, mariavenache@gmail.com. Ghani: World Bank; eghani@worldbank.org. O Connell: City University of New York; soconnell@gradcenter.cuny.edu.
4 Introduction A new and a more optimistic narrative on Africa s growth and structural transformation has emerged from a series of high level reports the 2014 African Transformation Report (ACET 2014), the African Union s Agenda 2063 (AU 2015), the African Development Bank s (ADB 2015), the UN Economic Commission for Africa s 2013 report (UNECA 2013), UNCTAD s 2012 report on structural transformation (UNCTAD 2012), multiple recent IMF papers (IMF 2013, among others), which point to the fact that Africa s recent progress is not based solely on natural resources (McKinsey Global Institute 2010). A recent report by the World Bank on economic transformation and poverty reduction in Africa found that the region s economies are developing in unexpected ways. The region is largely bypassing industrialization as a major driver of growth and jobs (World Bank 2014). The demographic dividend will make the region s labor force much larger and better than that of any nation, including China or India, if the young children in Africa could be better educated than in the past (Fine and Lund, 2012; The Economist April 2016). Africa s recent economic performance has vastly improved: its annual growth rate approached 3% in per capita terms after Rodrik (2014) claims this growth is not just driven by investment, but also by total factor productivity growth seen for the first time since the 1970s. While there was growth during the 2000s, the economic decline prior to this decade was so profound that many countries have yet to catch up to post-independence income levels. The historical empirical reality shows that with the exception of the European periphery and East Asia, convergence has been the exception rather than the norm. Growth theory has adapted to empirical realities by differentiating between conditional and unconditional convergence: growth in developing countries is dependent on overcoming several obstacles or country characteristics, such as weak institutions, poor infrastructure, disadvantageous geography and inadequate economic policies. Consequently, Rodrik (2014) concludes that developing countries converge to rich country income levels conditional on these problems being overcome. An ongoing debate is whether improvements in growth fundamentals can be expected to improve economic stability. Multiple studies have shown the relationship between good policy and economic growth is not particularly strong, though Acemoglu, Gallego, and Robinson (2014) suggest that differences in institution quality account for 75% of the variation in income levels around the world. This latter work points to a long run effect in levels, rather than an insight into short- or medium- term growth rates. 2
5 It is now well-established that the modern organized manufacturing sector exhibits unconditional convergence, contrary to other economic sectors (Rodrik 2014); that is, manufacturing industries converge to the global productivity frontier regardless of the condition of growth fundamentals. The question is whether Africa can generate a growth miracle based on the manufacturing industry. In a model that incorporates this unconditional convergence, structural change the shift of labor from low productivity industries to high productivity industries- plays an essential role. The level of employment shares across sectors in developing countries conditional on income level shows that African countries fit into a global pattern: shares of employment in the different sectors are what one would expect them to be. So just like elsewhere, structural change in sub-saharan Africa has been through a decline in the share of labor employment in agriculture, the least productive sector in sub- Saharan economies. Unlike other developing countries, African countries (generally) have not seen a significant increase in the share of labor force employment in manufacturing instead, the shift in employment share has been towards the services sector. Thus African structural change is unlike the pattern exhibited by Asian and European industrializers: labor is currently largely shifting towards the services industry, which historically has been less productive than manufacturing in other countries. Additionally, the manufacturing sector is dominated by informal firms, which are less productive than the formal organized firms required for unconditional convergence. Rodrik (2014) notes that African countries are de-industrializing much faster than Asian and European countries did in the past. African countries thus need to assess what type of growth model is both suitable and feasible. 1 1 Other literature has investigated the consumption side of African growth in recent decades. Using the Demographic and Health Survey (DHS) data, Young (2012) shows that since 1990, real material consumption in Sub-Saharan Africa has been rising at a rate of 3.4 to 3.7 percent per year. This is 3 to 4 times higher than the number usually reported by international data sources like the Penn World Tables (PWT) and the UN: percent. Non-African developing countries in the DHS sample exhibit a growth rate of 3.8 percent. When the data are examined by product group, Young (2012) finds greater Sub-Saharan growth in durable goods (5.6 percent) but lower growth in housing (1.8 percent). Although various sources claim Sub-Saharan Africa is growing at less than half the pace of other developing countries, DHS data suggest African growth is easily comparable to that of other economies. McMillan and Harttgen (2014) explore the reason behind the African growth and fill in some of the explanatory gaps in Young (2012). The African miracle can be traced to a decline in the share of the labor force that engages in agriculture. The paper links improvements in living standards found by Young (2012) to sectoral changes: between 2000 and 2010 the share of the labor force employed in agriculture in sub-saharan Africa declined by approximately 10 percentage points. With this came a 2-percentage point increase in manufacturing employment and 8-percentage point increase in services. Between 2000 and 2010, structural change contributed 1 percentage point to labor productivity growth. Essentially the shift of employment from agriculture to more productive sectors explains some of the growth in real consumption documented by Young (2012). 3
6 A Historical Lens Using a recently available data set from the Groeningen Growth and Development Centre s 10-sector database (hereafter GGDC data ) that provides employment and value added for ten disaggregated product sectors for a large set of countries historically, we begin the paper with high-level analyses investigating cross-country trends in sectoral productivity convergence and how the relationship between levels of development and economic structure has changed over time. The GGDC data provides a long-run, internationally comparable dataset on sectoral productivity performance in Africa, Asia, and Latin America. Variables covered in the data set are annual series of value added, output deflators, and persons employed for 10 broad sectors (Timmer, de Vries and de Vries 2014). These ten sectors comprise agriculture, mining, utilities, construction, manufacturing, wholesale and retail trade, FIRE industries, transport, government services, and other services (restaurants, hospitality, etc.). Among Sub-Saharan African countries, it contains data from Ethiopia, Botswana, Ghana, Kenya, Malawi, Mauritius, Nigeria, Senegal, South Africa, Tanzania and Zambia. These data allow a more nuanced look at the role of specific sectors in structural change, particularly separating construction and mining from manufacturing aggregates, and FIRE industries, government services, transport, and utilities from services aggregates, allowing greater specificity in understanding which sectors are drivers of structural change. Many of the countries in the recent release have reliable data going back to the 1970s or earlier, so we are able to build a long historical quantitative view of structural change. This, in turn, allows us to place economies current and recent trends in comparative historical context. Changing Relationship between Income and Economic Structure Figures 1 and 2 use the GGDC data to investigate the cross-sectional relationship between country income levels and economic structure (as embodied by the share of employment in the focal sector). As can be seen clearly, there is a clear trend in the changing nature of the relationship between productivity levels and economic structure for both manufacturing and the largest services subsector, wholesale & retail trade. At the beginning of the study period in the early 1970s, the relationship between the manufacturing labor share and income was far steeper than it is today, having followed a progressive erosion of the initial strength of this correlation over the past four decades. 4
7 Figure 1: The changing relationship between economic structure and income: manufacturing Figure 2: The changing relationship between economic structure and income: traditional services 5
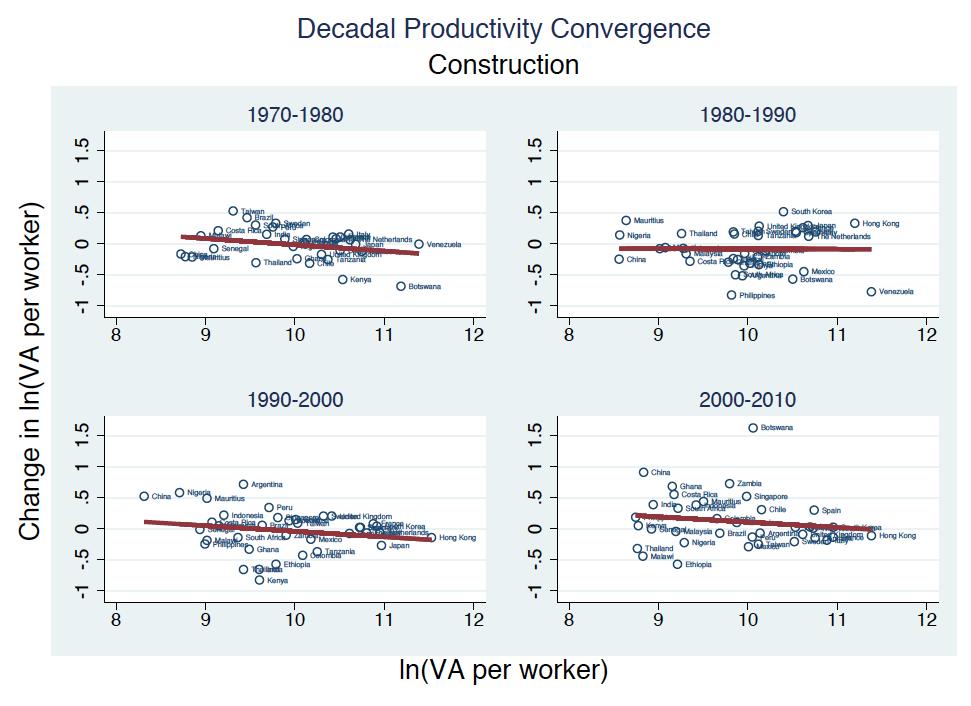
8 Over the same period, traditional services industries have increased their employment share across all income levels. In contrast to manufacturing, the relationship between income level and employment in the sector has not shown a distinct trend in changes in its slope over time. Figures 3 and 4 use sectoral productivity figures to investigate trends in unconditional convergence across countries over the past four decades. Although these data are available only for a subsample of economies, we find several trends: while convergence in manufacturing was a clear and strong trend some decades ago, it may no longer be as strong in recent decades, recent trends in convergence suggest that (traditional) services show more evidence of convergent pressures than manufacturing, modern services (particularly FIRE industries), but also the catch-all of other services (including primarily traditional hospitality/restaurants industries), show stronger convergence in recent decades than traditional trade services. 6


9 Figure 3: Patterns of convergence across decades, manufacturing and wholesale/retail trade This analysis suggests that if countries wish to benefit from growth convergence in the present day, the opportunity to do so likely exists more among service sectors, whereas in the past this opportunity was 7


10 found in the manufacturing sector. Figure 3 shows how these convergent pressures are even stronger in other sectors of services, including the FIRE industries and other services such as hospitality and tourism. Figure 4: Patterns of convergence across decades, FIRE industries and Other services, 1970 to 2010 African economies do not appear to be following the experience of East Asian countries in their historical patterns of structural change. Most obviously, East Asian countries have shown consistently higher 8
11 productivity growth than would be predicted by global growth convergence trends. This is not broadly the case for African countries in any time period or sector, with within-sector productivity growth across sectors showing no pattern of countries either consistently outperforming or underperforming predicted levels of convergence. The next section investigates trends in changes in economic structure for African countries in recent decades to understand whether their growth patterns have benefitted from convergent pressures in manufacturing in past decades, or in services in more recent decades, or neither. Appendix B contains further comparisons of African sectoral convergence to other countries for which the data are available. Structural Change in African Economies Using the same GGDC data, we adopt the framework of McMillan and Rodrik (2012) to show the pace, intensity, and consistency of structural change in African countries over four decades dating back to the 1970s. These analyses plot, for a given time period, the sector-level change in aggregate labor share on the horizontal axis with the within-country, relative productivity level of the sector on the vertical axis. These graphics show visually the pattern of structural change for each decade for the countries for which data are available. We are thus able to assess and characterize historical structural change on three dimensions: pace (given by the relative length of the fitted line), intensity (given by the slope of the fitted line), and consistency (comparing pace and intensity across decades). These analyses identify two broad growth patterns among African countries for which there are data: Pattern 1 Early transition of labor out of agriculture Pace of structural change slows in the 1990s/2000s Wholesale & retail trade is not the main labor absorbing sector in the 2000s Countries: Botswana, Nigeria, South Africa, Mauritius, the Arab Republic of Egypt Pattern 2 Late transition of labor out of agriculture, if at all Pace of structural change doesn t slow markedly in 1990s/2000s Wholesale & retail trade is the main sector absorbing labor in the 2000s Countries: Zambia, Tanzania, Ethiopia, Senegal, Malawi, Ghana, Kenya As an example, Figure 5 shows the historical patterns of structural change in a country following each pattern: Botswana (pattern 1) and Ethiopia (pattern 2). Pattern I Early Reformers 9
12 The first categorization of Pattern I countries largely refers to the timing of the transition of labor out of agriculture. Pattern I countries had an early shift of labor out of the agriculture sector 1970s/1980s. The pace of structural change in Pattern I countries slows down in the 1990s and 2000s. The faster the structural change, the faster the decline in the share of agriculture in the overall labor force. The intensity of structural change, given by the slope of the line, fluctuates by decade. While there is no straightforward pattern, in the 1990s the intensity declines for all countries in this group. 10
13 Figure 5: Pattern 1 and 2 economies Economic transformation is historically associated with an exodus of labor out of the agriculture sector into more productive sectors, which has typically meant manufacturing in the past. This analysis shows 11
14 this is not what is happening in many African countries. Most countries have seen rapid labor migration out of agriculture into more traditional services sector. The Pattern I countries exhibit a shift of labor towards a mixture of sectors, one of which is the wholesale & retail trade sector, although this sector is not the main sectoral destination for labor in the latter period of the 2000s for Pattern 1 economies. Figure 6 Once stuctural change begins, its consistency in subsequent decades does not necessarily follow. Nigeria exhibits a shift out of agriculture labor early in the 1970s, but by the 1990s, agriculture re-aborbs a share of labor of a similar magnitude. Overall, the countries show growth-enhancing structural change, where there is a positive correlation between the direction of labor shifts and sectoral productivity, with minor changes in pace and intensity. 12
15 Figure 7 South Africa s intensity of change decreases in the most recent two decades, with betas of 9.25 and 11.3 for the 1990s and 2000s, respectively. In the 1970s and 1980s, the intensity was an average of Botswana s intensity decreases in the latter decades as well, with a simultaneous slowdown in pace. Nigeria swings upward and downward in intensity over the course of four decades. 13
16 Figure 8 We incorporated WDI indicators for international trade and the pace of urbanization as well as a measure of conflict intensity from the Uppsala Conflict Data Program. The Pattern I countries either consistently have low trade and urbanization levels throughout the four decades we observe, or they display declines. The one exception to this trend is Botswana, which experienced increases in urbanization growth rates in the 1990s and 2000s. Conflict intensity consistenly declines in all countries for which we have data. In unreported econometric estimates, however, multiple correlations between these indicators and measures of the pace and intensity of decadal structural change are not statistically meaningful. Pattern II Late Reformers Pattern II consists of countries that had a late shift of labor out of the agricultural sector, if at all, including Zambia, Tanzania, Ethiopia, Senegal, Malawi, Ghana, and Kenya. The pace of structural change among this set of countries does not slow down in the 1990s and 2000s, although over time its intensity fluctuates substantially. For example, Kenya s intensity of structural change decreases consistently from the 1970s to the 2000s, which can be seen clearly in Figure 9. Zambia, on the other hand, exhibits a drastic increase in structural change intensity in the 2000s. 14
17 Figure 9 The wholesale retail & trade sector is highly absorbent of labor in these countries with varying levels of productivity. Ghana, Kenya, and Senegal exhibit low productivity in the retaile trade sector, while Tanzania, Ethiopia, Malawi, and Zambia have a relatively productive trade sector in the 2000s. Consistency Senegal and Malawi show strong growth-enhancing structural change consistently over the most recent two decades, particularly. Like several other countries, the sector experiencing the largest employment gain in recent decades is wholesale retail & trade. Figure 10 15
18 Zambia displays negative structural change in the 1980s and 1990s, with high shares of labor going into agriculture as a consequence of policies surrounding import liberalization. With time, the employment Figure 11 adjusts and starts to shift away from low-productivity sectors like agriculture. The consistency and trend of structural change is interrupted by specific country policies and governance. Trade, urbanization and conflict follow the same trend as the countries in Pattern I did. Trade and urbanization decline throughout the four decades for six of the countries, the exception being Ghana, while conflict intensity declines in the 1990s and 2000s in all but Senegal. What is striking in the graphs described is the predominance of the wholesale retail & trade sector. While the WRT sector is not the main absorber of labor after 2000 for Pattern I countries, it is still one of the largest sectors. A majority of jobs are being provided by the traditional services industry across the African countries, implying that globalization and local circumstances or policies have pushed structural change in this direction. 16
19 Furthermore, the countries grouped in Pattern II are broken down into two separate categories: a. Countries with low productivity wholesale & retail trade sector (Kenya, Ghana, Senegal) b. Countries with high productivity wholesale & retail trade sector (Tanzania, Zambia, Ethiopia, Malawi) Figure 12 Looking ahead: Which non-african countries fit similar patterns? We look to see which other countries have historical patterns of structural change that are similar to those of the two groups of African countries. Only a few economies seem to fit the criteria of patterns 1 & 2 defined above. Those of pattern 1 the early movers out of agriculture, which saw a relative slowdown in the pace of change in recent decades, include Mexico and Taiwan, China, as seen below in Figure 13. Figure 13 There are also two countries that fit pattern 2 well, with later transitions out of agriculture and transitional trade services absorbing much of this labor. These include Thailand and India, seen in Figure
20 Figure 14 These analyses suggest similarities between the two groups of African economies with at least some recent experiences with structural change in other well-performing economies. Structural Transformation Scorecard What kind of structural transformation contributes most to rapid and sustained growth? We examine this question using a scorecard approach to assess the impact of structural transformation in Africa. We use five criteria to give a scorecard (see Amirapu and Subramanian, 2015): 1) high productivity, 2) dynamic productivity growth via reallocation into a sector with domestic and international convergence, 3) expansion of the sector in its use of inputs, 4) comparative advantage via resource requirements of the sector and resource endowments of the country, and 5) exportability. A detailed country level score card on structural transformation can be seen in Appendix C. Our analysis points to two sectors among African economies that share at least some of these characteristics. The first is wholesale and retail trade services, which has high productivity and many countries are already experiencing as a destination for excess labor being shed from agriculture, although it lacks some aspects of tradability. Another sector, having high productivity and convergent pressures, but which African countries are not yet seeing absorb much labor, is the construction sector. Both sectors, however, suffer from a lack of tradability and exportability. Modern services, such as those in the FIRE industries, are both tradeable and exportable, although the share of these industries is still quite small in many African countries and has yet to be seen absorbing any substantial share of labor. In contrast to the experience of India, which has seen an expansion of both modern services and construction sectors, most African countries have yet to capitalize on these waiting sectors as potential drivers of structural change. 18
21 So as to allow for individual-country analysis to provide more nuanced conclusions than the above, in the Annex C we provide summary indicators by country underlying these major patterns of structural change, including a few additional countries for comparison (Brazil, China, India, and Mexico). This allows the ability to compare changes in employment shares, output growth rates, and labor productivity across sectors for a particular focal economy. For example, South Africa does not particularly follow the above trends; while the country has absorbed a substantial amount of labor into wholesale and retail trade, construction has not done so; instead, there were greater shifts into higher productivity sectors (FIRE industries and the public sector). We provide this rubric mainly in order to allow for additional nuance to be available for country-by-country assessment of the broad patterns described above. Conclusion We present a country-by-country historical analysis of structural change in Africa over the past four decades. Given the varied patterns and trends in structural change across African countries, we find it difficult to speak of structural change from a single, continent-wide perspective. We do, however, find two general patterns of structural change. First, the early reformers saw an early transition of labor out of agriculture, with manufacturing absorbing this labor in decades prior to the 1990s. Second, the later reformers, saw a later transition out of agriculture, where labor being shed from agriculture in the 1990s and 2000s appears to largely have been absorbed in the services sector. 19
22 References Acemoglu, Daron, Francisco A. Gallego and James A. Robinson Institutions, Human Capital and Development. Annual Reviews of Economics 6: ACET African Transformation Report: Growth with Depth. Available at: accessed June 26, ADB AfDB Group's Long Term Strategy. Available at: accessed June 26, Amirapu, Amrit and Arvind Subramanian Manufacturing or Services? An Indian Illustration of a Development Dilemma. CGD Working Paper 409. AU Agenda 2063 Vision and Priorities. Available at: accessed June 26, Fine, and Susan Lund Jobs: The next piece of Africa s growth jigsaw. VoxEU.org, available at: Accessed 12 April IMF Jobs and Growth: Analytical and Operational Considerations for the Fund. Available at: accessed June 26, McKinsey Global Institute Lions on the Move The Progress and Potential of African Economies. Available at: Accessed: 25 April McMillan, Margaret S, and Kenneth Harttgen What is driving the African Growth Miracle? National Bureau of Economic Research (NBER) Working Paper No McMillian, Margaret and Dani Rodrik Globalization, Structural Change, and Growth, with an Update on Africa. World Development Vol. 63, pp Rodrik, Dani An African Growth Miracle? National Bureau of Economic Research (NBER) Working Paper No Timmer, M.P., G.J. de Vries, and K. de Vries (2014). Patterns of Structural Change in Developing Countries, GGDC research memorandum 149. UNCTAD Economic Development in Africa: Structural Transformation and Sustainable Development in Africa. Available at: accessed June 26, UNECA Economic Report on Africa Available at: accessed June 26, World Bank, 2014, Africa s Pulse: Decades of Sustained Growth is Transforming Africa s Economies. World Bank. Washington, DC. Available at: Accessed 25 April Young, Alwyn The African growth miracle, Journal of Political Economy 120(4):
23 21
24 Appendix A: Variables used & definitions WDI variables: Indicator Name Definition Original source Trade (% of GDP) Trade is the sum of exports and imports of goods and services measured as a share of World Bank national accounts data, and OECD National gross domestic product. Variable gives average decadal value per country. Accounts data files. Urbanization Average growth rate of urban population/total population by decade for each Fraction of the orginal variables in grey below. country. Conflict Average conflict intensity level by decade for each country. Intensity level is categorized into:no conflict, minor conflict or war. UCDP/PRIO Armed Conflict Dataset v a, Urban population Population, total Urban population refers to people living in urban areas as defined by national World Bank Staff estimates based on United Nations, statistical offices. It is calculated using World Bank population estimates and urban World Urbanization Prospects. ratios from the United Nations World Urbanization Prospects. Aggregation of urban and rural population may not add up to total population because of different country coverages. Total population is based on the de facto definition of population, which counts all residents regardless of legal status or citizenship except for refugees not permanently settled in the country of asylum, who are generally considered part of the population of their country of origin. The values shown are midyear estimates. (1) United Nations Population Division. World Population Prospects, (2) United Nations Statistical Division. Population and Vital Statistics Report (various years), (3) Census reports and other statistical publications from national statistical offices, (4) Eurostat: Demographic Statistics, (5) Secretariat of the Pacific Community: Statistics and Demography Programme, and (6) U.S. Census Bureau: International Database. Indicator definitions: Definitions for relative levels of country indicators of trade, urbanization, conflict Decade 1970s 1980s 1990s 2000s Years: Representation Low Med High Low Med High Low Med High Low Med High Trade (average level, in share of GDP) Urbanization (change in urbanization rate) Conflict (average level) Note: Each definition above provides the ranges of the observation values assigned to each category. Cutoffs based on terciles, except for conflict, where "low" is no conflict (no minor or major conflict for one country during that decade. 22
25 Appendix B: Supplementary Exhibits 23
26 24
27 25
28 26
29 27
30 28
31 29
32 Annex Data Sources Africa Sector Database (ASD)- University of Groningen World Development Indicators (WDI) - The World Bank Table of Contents I. Scorecard II. Convergence III. Peak growth Annex: Page 1
33 Part I. Scorecard Africa Sector Database Sector Description Agriculture Mining Manufacturing Utilities Construction Trade services Transport services Business services Government services Personal services Aggregate services Agriculture, Hunting and Forestry, Fishing Mining and Quarrying Manufacturing Electricity, Gas and Water supply Construction Wholesale and Retail trade; repair of motor vehicles, motorcycles and personal and household goods, Hotels and Restaurants Transport, Storage and Communications Financial Intermediation, Real Estate, Renting and Business Activities Public Administration and Defense, Education, Health and Social work Other Community, Social and Personal service activities, Activities of Private Households Trade services & Transport services & Business services Key : Gross value added at constant local prices (millions), Value added in constant prices is calculated from estimated series of nominal data and price deflators, and rebased to express values in 2005 prices. : The ratio of persons employed in sector to total persons employed, is defined as all persons engaged, aged 15 : The ratio of output to number of persons engaged in sector, Aggregate Services: Wholesale and Retail trade; repair of motor vehicles, motorcycles and personal and household goods, Hotels and Restaurants; Change (1970s-2000s) Average employment share in the 2000s minus average employment share in 1970s. Growth (1970s to 2000s) (Average employment share in the 2000s - average employment share in 1970s) / average employment share in the 1970s Annex: Page 2
34 Africa Gross value added - Local Currency - (millions) (1970) Change (1970s-2000s) Growth (1970s to 2000s) Ratio of to number of persons engaged Agriculture % 5.76% 70.30% % -5.84% % 3.76% Mining % 1.40% 1.38% -0.72% -0.05% % -0.76% Manufacturing % 3.22% 6.13% 0.50% 1.24% % -1.74% Utilities % 3.18% 0.22% 0.05% 0.01% % 0.06% Construction % 8.79% 1.64% 0.93% 0.96% % 0.88% Trade services % 6.67% 9.66% 5.37% 1.92% % 2.26% Transport services % 6.82% 1.60% 0.95% 0.46% % 1.76% Business services % 7.86% 0.57% 1.85% 1.02% % -0.74% Government services % 4.20% 3.78% 1.96% 0.40% % 0.53% Personal services % 4.91% 4.71% 0.46% -0.12% % 2.19% Aggregate Services % 6.19% 20.34% 10.60% 3.68% % 1.90% *Includes Botswana, Ethiopia, Ghana, Kenya, Malawi, Mauritius, Nigeria, Senegal, Zambia, Tanzania, South Africa Annex: Page 3
35 Botswana Gross value added - Local Currency - (millions) (1970) Change (1970s-2000s) Growth (1970s to 2000s) Ratio of to number of persons engaged Agriculture % 4.93% 81.20% % -0.22% % 3.83% Mining % -2.30% 1.84% 0.13% -0.48% % -1.26% Manufacturing % 4.42% 1.47% 5.01% 0.05% % 3.18% Utilities % 0.57% 0.25% 0.34% -0.13% % 1.51% Construction % 5.27% 2.24% 0.46% -6.46% % 17.63% Trade services % 7.98% 1.36% 17.92% 8.57% % 0.69% Transport services % 6.51% 1.05% 2.09% 0.70% % 2.72% Business services % 4.85% 1.12% 5.88% 2.16% % -0.07% Government services % 3.27% 4.91% 11.92% -2.94% % 3.78% Personal services % 9.47% 4.56% -0.64% -1.23% % 11.25% Aggregate Services % 6.03% 13.00% 37.16% 7.25% % 3.23% Annex: Page 4
36 Egypt Gross value added - Local Currency - (millions) (1970) Change (1970s-2000s) Growth (1970s to 2000s) Ratio of to number of persons engaged Agriculture % 3.21% 53.92% % -6.01% % 1.68% Mining % 5.74% 0.23% -0.13% -0.13% % 10.38% Manufacturing % 4.09% 14.18% -3.08% -0.09% % 0.24% Utilities % 5.06% 0.62% 0.67% -0.03% % 1.35% Construction % 7.77% 2.84% 9.83% 2.81% % 1.13% Trade services % 6.61% 7.60% 6.20% 2.78% % 0.29% Transport services % 10.89% 2.33% 6.93% 3.71% % 1.39% Business services % 2.04% 0.89% 2.27% -0.74% % 0.28% Government services % 3.48% 17.40% 8.65% -2.29% % 0.41% Personal services % 9.38% Aggregate Services % 6.24% 28.21% 24.04% 3.45% % 1.53% Annex: Page 5
37 Mauritius Gross value added - Local Currency - (millions) (1970) Change (1970s-2000s) Growth (1970s to 2000s) Ratio of to number of persons engaged Agriculture % 0.32% 37.30% % -4.27% % 3.94% Mining % % 0.07% 0.11% -0.11% % -7.76% Manufacturing % 1.56% 10.61% 8.49% -9.68% % 4.61% Utilities % 3.54% 1.64% -0.62% 0.20% % 0.15% Construction % 6.34% 7.80% 2.17% 0.62% % 4.47% Trade services % 4.05% 7.70% 13.80% 3.86% % 0.86% Transport services % 7.43% 5.81% 2.46% 1.60% % 3.96% Business services % 4.61% 1.12% 8.43% 4.94% % -3.84% Government services % 4.29% 12.08% 4.40% 2.04% % 1.76% Personal services % 7.16% 15.85% -9.10% 0.79% % 4.64% Aggregate Services % 5.10% 42.57% 19.98% 13.23% % 1.47% Annex: Page 6
38 Nigeria Gross value added - Local Currency - (millions) (1970) Change (1970s-2000s) Growth (1970s to 2000s) Ratio of to number of persons engaged Agriculture % 10.40% 64.78% -4.12% -3.03% % 7.96% Mining % 1.52% 0.15% 0.09% 0.16% % % Manufacturing % 8.74% 7.01% -2.83% 1.08% % 2.71% Utilities % 8.59% 0.15% 0.08% -0.05% % 7.80% Construction % 9.16% 1.00% 0.61% 0.91% % -2.24% Trade services % 13.01% 15.32% 1.60% -1.96% % 11.18% Transport services % 18.95% 1.32% 1.73% 0.89% % 11.84% Business services % 10.92% 0.26% 2.49% 2.12% % -6.88% Government services % 6.26% 4.71% -0.39% 0.11% % 3.14% Personal services % 9.88% 5.31% 0.75% -0.23% % 7.32% Aggregate Services % 12.60% 26.91% 6.19% 0.93% % 9.26% Annex: Page 7
39 South Africa Gross value added - Local Currency - (millions) (1970) Change (1970s-2000s) Growth (1970s to 2000s) Ratio of to number of persons engaged Agriculture % 1.84% 34.72% % -3.63% % 3.14% Mining % 0.01% 8.80% -6.72% -1.40% % 4.34% Manufacturing % 2.40% 13.33% -1.43% -1.73% % 2.87% Utilities % 1.84% 0.65% -0.03% 0.07% % -0.24% Construction % 8.14% 5.81% 1.44% 2.22% % 3.33% Trade services % 3.35% 13.49% 6.53% -0.71% % 2.79% Transport services % 4.99% 4.40% 0.89% -0.05% % 4.15% Business services % 8.65% 2.48% 8.85% 3.76% % 3.44% Government services % 2.66% 5.80% 9.67% 0.86% % 1.17% Personal services % 3.16% 10.52% 0.48% 0.61% % 1.66% Aggregate Services % 4.59% 36.69% 26.43% 4.47% % 2.90% Annex: Page 8
40 Ethiopia Gross value added - Local Currency - (millions) (1970) Change (1970s-2000s) Growth (1970s to 2000s) Ratio of to number of persons engaged Agriculture % 6.68% 92.49% % -9.77% % 4.35% Mining % 8.69% 0.01% 0.46% 0.22% % -1.45% Manufacturing % 7.42% 1.87% 4.37% 3.10% % -3.10% Utilities % 6.66% 0.04% 0.06% 0.02% % 0.70% Construction % 11.98% 0.30% 1.72% 1.50% % -5.59% Trade services % 10.92% 2.63% 7.58% 5.47% % -0.75% Transport services % 10.77% 0.34% 0.17% 0.14% % 3.49% Business services % 12.20% 0.11% 0.33% 0.29% % -2.72% Government services % 7.33% 1.12% 1.37% -0.73% % 6.41% Personal services % 6.51% 1.08% 1.28% -0.25% % 3.97% Aggregate Services % 9.71% 5.28% 10.73% 4.93% % 2.18% Annex: Page 9
41 Ghana Gross value added - Local Currency - (millions) (1970) Change (1970s-2000s) Growth (1970s to 2000s) Ratio of to number of persons engaged Agriculture % 4.80% 57.04% % % % 4.10% Mining % 6.36% 0.99% 0.11% -0.68% % 8.05% Manufacturing % 3.54% 12.08% -1.28% 0.20% % 0.08% Utilities % 6.71% 0.39% 0.00% 0.05% % 2.01% Construction % 11.01% 2.40% 0.66% 0.13% % 7.04% Trade services % 6.28% 13.83% 10.50% 7.31% % -0.69% Transport services % 6.72% 2.72% 0.82% 0.64% % 1.29% Business services % 6.07% 0.30% 2.01% 0.87% % -2.02% Government services % 6.60% 7.02% -0.43% 1.38% % 0.83% Personal services % 6.37% 3.22% 3.09% 2.17% % -1.26% Aggregate Services % 6.48% 27.10% 15.99% 12.38% % -0.33% Annex: Page 10
42 Kenya Gross value added - Local Currency - (millions) (1970) Change (1970s-2000s) Growth (1970s to 2000s) Ratio of to number of persons engaged Agriculture % 2.27% 81.02% % -7.76% % 0.95% Mining % 4.08% 0.12% 0.48% 0.12% % -0.96% Manufacturing % 3.85% 3.79% 8.97% 2.72% % -1.40% Utilities % 5.96% 0.13% 0.06% -0.08% % 6.60% Construction % 5.32% 0.85% 1.98% 0.50% % 0.47% Trade services % 5.66% 5.04% 11.39% 4.17% % -0.22% Transport services % 8.36% 1.39% 2.04% -0.20% % 5.98% Business services % 3.76% 0.85% 0.36% -0.43% % 4.00% Government services % 2.09% 3.41% 2.65% -0.44% % -0.02% Personal services % 2.82% 3.41% 4.77% 1.40% % -1.86% Aggregate Services % 4.58% 14.09% 21.21% 4.50% % 0.33% Annex: Page 11
43 Malawi Gross value added - Local Currency - (millions) (1970) Change (1970s-2000s) Growth (1970s to 2000s) Ratio of to number of persons engaged Agriculture % 2.37% 86.71% % % % 1.57% Mining % 20.21% 0.20% -0.08% 0.08% % 6.12% Manufacturing % 5.90% 3.06% 1.37% 1.76% % -2.40% Utilities % 6.51% 0.22% 0.11% 0.14% % -2.44% Construction % 7.57% 2.04% 2.50% 2.62% % -4.34% Trade services % 6.79% 1.94% 11.05% 7.01% % -4.21% Transport services % 9.80% 0.92% 1.32% 1.46% % -4.25% Business services % 6.18% 0.15% 0.58% 0.03% % 2.45% Government services % 1.20% 2.84% 4.35% 2.74% % -6.51% Personal services % 5.92% 1.91% 0.34% 1.33% % -6.06% Aggregate Services % 5.90% 7.77% 17.63% 12.56% % -4.12% Annex: Page 12
44 Senegal Gross value added - Local Currency - (millions) (1970) Change (1970s-2000s) Growth (1970s to 2000s) Ratio of to number of persons engaged Agriculture % 2.44% 73.28% % -6.79% % 0.70% Mining % 3.20% 0.21% 0.02% 0.10% % -5.27% Manufacturing % 2.87% 5.64% 4.26% 1.92% % -2.26% Utilities % 5.78% 0.34% -0.30% -0.14% % 19.08% Construction % 6.09% 1.26% 2.52% 0.99% % -0.06% Trade services % 2.72% 7.28% 13.79% 2.73% % -1.65% Transport services % 11.04% 1.81% 1.61% 1.42% % 2.17% Business services % 5.74% 0.19% 0.32% 0.14% % -0.70% Government services % 3.48% 5.02% 0.15% 0.33% % -0.20% Personal services % 3.01% 4.97% -0.54% -0.70% % 1.48% Aggregate Services % 4.92% 19.27% 15.34% 3.93% % 0.63% Annex: Page 13
45 Tanzania Gross value added - Local Currency - (millions) (1970) Change (1970s-2000s) Growth (1970s to 2000s) Ratio of to number of persons engaged Agriculture % 4.28% 91.37% % % % 2.12% Mining % 11.10% 0.10% 0.69% 0.28% % 2.48% Manufacturing % 8.34% 1.72% 1.52% 1.57% % -2.18% Utilities % 6.56% 0.10% 0.35% 0.21% % -3.51% Construction % 10.33% 0.62% 0.76% 0.56% % 0.98% Trade services % 7.57% 1.95% 7.83% 3.02% % -0.01% Transport services % 8.90% 0.88% 1.03% 1.15% % -4.17% Business services % 7.07% 0.14% 0.52% 0.46% % -8.28% Government services % 8.01% 1.96% 6.28% 4.74% % -4.37% Personal services % 2.94% 1.16% 0.73% -0.15% % 0.06% Aggregate Services % 7.79% 6.09% 16.39% 9.21% % -1.38% Annex: Page 14
46 Zambia Gross value added - Local Currency - (millions) (1970) Change (1970s-2000s) Growth (1970s to 2000s) Ratio of to number of persons engaged Agriculture % -1.58% 62.72% 9.52% 0.64% % -4.40% Mining % 20.30% 3.93% -1.48% 1.15% % 9.75% Manufacturing % 5.16% 3.05% 0.26% 0.55% % 0.38% Utilities % 1.98% 0.59% -0.33% -0.13% % 3.10% Construction % 11.66% 3.92% -2.48% 0.13% % 7.52% Trade services % 7.17% 4.05% 6.50% 3.78% % -0.34% Transport services % 17.01% 2.67% -0.69% 0.08% % 13.31% Business services % 5.73% 1.35% -0.25% 0.07% % 2.15% Government services % 12.03% Personal services % 11.83% 17.71% % -6.27% % 16.19% Aggregate Services % 9.60% 25.79% -5.50% -2.35% % 7.72% Annex: Page 15
47 Morocco Gross value added - Local Currency - (millions) (1970) Change (1970s-2000s) Growth (1970s to 2000s) Ratio of to number of persons engaged Agriculture % 7.30% 55.23% % 7.89% % -0.57% Mining % 3.68% 1.74% -1.44% -0.35% % 6.47% Manufacturing % 2.64% 11.37% 1.16% -4.64% % 0.70% Utilities % 6.37% 0.32% 0.05% -0.18% % 5.16% Construction % 6.70% 4.57% 6.40% 0.92% % 0.55% Trade services % 3.33% 9.15% 7.27% -1.36% % -0.99% Transport services % 7.64% 3.36% 0.65% -0.49% % 3.52% Business services % 5.39% 0.64% 1.16% 0.24% % -1.23% Government services % 3.91% 13.62% 4.99% -2.02% % -0.20% Personal services % 4.71% Aggregate Services % 4.77% 26.77% 14.07% -3.64% % 0.44% Annex: Page 16
48 Argentina Gross value added - Local Currency - (millions) (1970) Change (1970s-2000s) Growth (1970s to 2000s) Ratio of to number of persons engaged Agriculture % 3.19% 17.90% % -2.22% % 3.22% Mining % 0.47% 0.50% 0.13% 0.32% % -8.95% Manufacturing % 4.41% 23.50% % -0.28% % 1.72% Utilities % 3.73% 1.20% -0.48% -0.22% % 3.55% Construction % 5.29% 8.50% -0.92% 1.98% % -0.72% Trade services % 4.29% 17.60% 3.45% -0.08% % 1.40% Transport services % 7.75% 7.20% -1.22% -1.14% % 6.56% Business services % 2.50% 3.34% 6.55% 1.16% % -1.61% Government services % 3.04% 13.52% 10.73% 0.87% % -0.22% Personal services % 3.81% 6.74% 4.53% -0.38% % 1.23% Aggregate Services % 4.39% 48.40% 24.05% 0.42% % 1.40% Annex: Page 17
49 Brazil Gross value added - Local Currency - (millions) (1970) Change (1970s-2000s) Growth (1970s to 2000s) Ratio of to number of persons engaged Agriculture % 3.98% 49.02% % -5.60% % 4.48% Mining % 5.31% 0.44% -0.14% 0.01% % 2.54% Manufacturing % 2.39% 13.30% -1.19% 0.09% % -0.13% Utilities % 3.37% 1.27% -0.87% -0.03% % 1.66% Construction % 2.81% 6.32% 1.21% 0.78% % -0.74% Trade services % 4.03% 9.53% 11.37% 1.20% % 0.95% Transport services % 0.90% 3.17% 1.55% 0.31% % -2.16% Business services % 5.56% 5.25% 5.81% 2.09% % 0.90% Government services % 2.73% 5.84% 6.27% 0.13% % 0.17% Personal services % 3.44% 5.87% 8.31% 1.03% % 0.21% Aggregate Services % 3.56% 29.65% 33.31% 4.76% % 0.29% Annex: Page 18
50 China Gross value added - Local Currency - (millions) (1970) Change (1970s-2000s) Growth (1970s to 2000s) Ratio of to number of persons engaged Agriculture % 4.14% 80.77% % % % 6.83% Mining % 11.83% 1.07% 0.21% 0.06% % 10.74% Manufacturing % 11.23% 7.78% 11.39% 4.65% % 7.59% Utilities % 11.88% 0.14% 0.35% 0.05% % 10.12% Construction % 12.39% 1.22% 6.53% 1.44% % 9.50% Trade services % 12.19% 2.34% 7.34% 1.87% % 9.22% Transport services % 10.86% 1.54% 2.47% 0.62% % 8.41% Business services % 11.75% 0.65% 0.78% 0.31% % 8.44% Government services % 11.54% 3.29% 2.46% 0.82% % 9.24% Personal services % 12.45% 1.20% 12.54% 3.48% % 8.62% Aggregate Services % 11.69% 9.01% 25.59% 7.10% % 8.56% Annex: Page 19
51 Thailand Gross value added - Local Currency - (millions) (1970) Change (1970s-2000s) Growth (1970s to 2000s) Ratio of to number of persons engaged Agriculture % 2.10% 77.93% % % % 3.02% Mining % 4.64% 0.33% -0.22% -0.01% % 4.21% Manufacturing % 5.50% 5.36% 8.72% 0.52% % 3.58% Utilities % 5.32% 0.14% 0.14% -0.07% % 6.09% Construction % 2.95% 1.21% 4.98% 2.31% % -3.17% Trade services % 2.92% 7.97% 15.42% 4.95% % -0.97% Transport services % 4.01% 1.70% 1.22% 0.03% % 2.39% Business services % 7.97% 0.77% 2.21% 0.62% % 3.93% Government services % 5.17% 3.39% 5.65% 1.39% % 1.92% Personal services % 3.19% 1.20% 1.55% 0.51% % -0.35% Aggregate Services % 3.58% 15.03% 26.05% 7.50% % 0.03% Annex: Page 20
52 India Gross value added - Local Currency - (millions) (1970) Change (1970s-2000s) Growth (1970s to 2000s) Ratio of to number of persons engaged Agriculture % 3.16% 71.97% % -4.98% % 2.86% Mining % 4.88% 0.51% -0.02% -0.05% % 4.75% Manufacturing % 7.44% 9.44% 2.15% 0.23% % 5.99% Utilities % 5.95% 0.29% -0.04% 0.00% % 4.93% Construction % 9.56% 1.37% 5.79% 2.41% % 3.94% Trade services % 8.98% 5.02% 6.54% 1.40% % 6.35% Transport services % 9.99% 2.42% 2.38% 1.03% % 6.14% Business services % 11.19% 0.47% 1.76% 0.95% % 3.99% Government services % 6.35% 5.78% -1.64% -0.73% % 6.86% Personal services % 6.99% 2.73% 0.38% -0.25% % 6.57% Aggregate Services % 8.82% 16.41% 9.43% 2.40% % 6.52% Annex: Page 21
53 Mexico Gross value added - Local Currency - (millions) (1970) Change (1970s-2000s) Growth (1970s to 2000s) Ratio of to number of persons engaged Agriculture % 2.07% 41.73% % -1.96% % 0.99% Mining % 0.24% 1.18% -0.79% -0.06% % -0.76% Manufacturing % -0.07% 17.98% -2.33% -3.97% % -0.15% Utilities % 3.22% 0.43% -0.11% -0.14% % 4.64% Construction % 1.28% 4.66% 5.15% 1.65% % -2.87% Trade services % 1.91% 11.91% 10.24% 0.35% % -0.61% Transport services % 3.70% 3.24% 1.46% -0.50% % 2.33% Business services % 5.00% 1.64% 5.93% 2.46% % -1.38% Government services % 0.50% 10.69% 4.65% 1.71% % -2.98% Personal services % 1.24% 6.54% 3.18% 0.46% % -1.58% Aggregate Services % 2.47% 34.02% 25.46% 4.48% % -0.69% Annex: Page 22
54 Bolivia Gross value added - Local Currency - (millions) (1970) Change (1970s-2000s) Growth (1970s to 2000s) Ratio of to number of persons engaged Agriculture % 2.63% 61.50% % % % 5.24% Mining % 6.36% 3.18% -2.35% -1.45% % 14.10% Manufacturing % 4.04% 9.26% 4.14% 2.66% % -1.29% Utilities % 3.68% 0.10% 0.14% -0.16% % 5.76% Construction % 3.73% 3.88% 5.72% 0.48% % 0.11% Trade services % 3.10% 5.47% 14.35% 1.36% % -0.69% Transport services % 4.31% 2.89% 4.50% 2.28% % -2.47% Business services % 1.57% 0.48% 6.63% 3.10% % -6.95% Government services Personal services % 3.44% 13.24% 10.21% 5.19% % -2.13% Aggregate Services % 3.28% 22.08% 35.68% 11.93% % -2.10% Annex: Page 23
55 Chile Gross value added - Local Currency - (millions) (1970) Change (1970s-2000s) Growth (1970s to 2000s) Ratio of to number of persons engaged Agriculture % 5.92% 26.47% % -1.27% % 4.82% Mining % 3.71% 2.92% -0.08% 1.34% % -4.99% Manufacturing % 4.06% 20.15% % -3.56% % 4.87% Utilities % -3.19% 0.78% 0.13% 0.24% % -8.31% Construction % 6.08% 5.84% 2.68% 0.38% % 3.10% Trade services % 4.44% 11.00% 16.60% 6.00% % -0.49% Transport services % 5.79% 6.03% 0.35% -0.97% % 4.77% Business services % 4.90% 2.67% 8.61% 0.60% % 1.88% Government services Personal services % 3.84% 24.14% -0.03% -2.76% % 2.50% Aggregate Services % 4.63% 43.84% 25.54% 2.87% % 1.73% Annex: Page 24
56 Colombia Gross value added - Local Currency - (millions) (1970) Change (1970s-2000s) Growth (1970s to 2000s) Ratio of to number of persons engaged Agriculture % 2.13% 40.30% % -5.95% % 2.03% Mining % 2.99% 0.85% 1.58% 1.03% % -5.28% Manufacturing % 3.51% 14.25% -3.00% -0.25% % 0.80% Utilities % 2.85% 0.38% -0.10% -0.09% % 2.70% Construction % 7.59% 4.44% 2.26% 1.65% % 1.63% Trade services % 4.40% 12.18% 16.57% 3.55% % 0.12% Transport services % 5.52% 4.06% 2.40% 1.76% % -0.68% Business services % 5.64% 5.62% 3.00% 2.69% % -1.11% Government services Personal services % 3.36% 17.93% -1.03% -4.40% % 2.79% Aggregate Services % 4.43% 39.78% 20.94% 3.61% % 0.86% Annex: Page 25
57 Costa Rica Gross value added - Local Currency - (millions) (1970) Change (1970s-2000s) Growth (1970s to 2000s) Ratio of to number of persons engaged Agriculture % 2.83% 41.72% % -4.60% % 2.59% Mining % 1.50% 0.29% -0.13% 0.02% % -2.78% Manufacturing % 2.97% 13.29% -0.90% -4.41% % 3.09% Utilities % 3.89% 1.07% 1.40% 1.00% % -4.22% Construction % 6.70% 6.45% -1.29% -1.11% % 5.65% Trade services % 2.73% 10.46% 13.30% 2.39% % -1.29% Transport services % 9.40% 4.10% 2.54% 1.00% % 4.52% Business services % 8.49% 2.29% 8.63% 3.80% % 0.94% Government services % 2.91% 13.48% 2.12% 1.18% % -0.84% Personal services % 3.87% 6.85% 1.21% 0.73% % -0.08% Aggregate Services % 4.87% 37.17% 27.80% 9.10% % 0.32% Annex: Page 26
58 Japan Gross value added - Local Currency - (millions) (1970) Change (1970s-2000s) Growth (1970s to 2000s) Ratio of to number of persons engaged Agriculture % -1.11% 18.84% % -1.01% % 1.95% Mining % % 0.50% -0.42% -0.05% % -4.79% Manufacturing % 0.20% 24.36% -9.81% -4.31% % 4.04% Utilities % 1.44% 0.49% 0.26% 0.07% % 1.60% Construction % -2.38% 7.70% 0.72% -1.37% % 0.27% Trade services % -1.19% 20.82% 1.49% -1.82% % 0.76% Transport services % 0.63% 5.46% 0.63% 0.14% % 1.57% Business services % 0.81% 7.04% 7.43% 1.83% % 0.63% Government services % 1.87% 11.83% 9.17% 5.79% % -0.20% Personal services % -0.01% 2.95% 4.47% 0.74% % 0.10% Aggregate Services % 0.45% 48.11% 23.18% 6.68% % 0.63% Annex: Page 27
59 Peru Gross value added - Local Currency - (millions) (1970) Change (1970s-2000s) Growth (1970s to 2000s) Ratio of to number of persons engaged Agriculture % 3.68% 46.02% % -5.74% % 3.67% Mining % 5.25% 1.44% -0.19% 0.32% % -0.12% Manufacturing % 5.74% 13.61% -4.75% -2.56% % 6.00% Utilities % 5.26% 0.19% 0.21% 0.12% % -0.73% Construction % 8.77% 4.12% 3.13% 3.82% % -1.35% Trade services % 5.95% 9.01% 15.93% 3.23% % 2.12% Transport services % 6.71% 3.93% 5.48% 2.15% % 1.63% Business services % 6.46% 4.13% 3.01% 0.62% % 3.11% Government services Personal services % 4.65% 17.54% 0.78% -1.96% % 3.33% Aggregate Services % 5.77% 34.62% 25.20% 4.04% % 2.66% Annex: Page 28
60 Singapore Gross value added - Local Currency - (millions) (1970) Change (1970s-2000s) Growth (1970s to 2000s) Ratio of to number of persons engaged Agriculture % 0.04% 3.46% -3.16% 0.05% % -5.40% Mining % 0.04% 0.34% -0.31% -0.01% % 0.22% Manufacturing % 3.70% 21.98% -4.17% -2.92% % 1.41% Utilities % 3.98% 1.17% -0.67% 0.09% % -1.76% Construction % 7.79% 6.62% 4.70% -1.76% % 5.34% Trade services % -0.53% 23.49% 1.16% 5.52% % -6.59% Transport services % 5.00% 12.14% 0.46% 1.49% % -0.13% Business services % 6.42% 3.55% 17.64% 7.23% % -1.69% Government services Personal services % 4.59% 27.25% % -9.70% % 7.05% Aggregate Services % 3.20% 66.43% 3.61% 4.55% % -1.26% Annex: Page 29
61 South Korea Gross value added - Local Currency - (millions) (1970) Change (1970s-2000s) Growth (1970s to 2000s) Ratio of to number of persons engaged Agriculture % 1.19% 49.05% % -3.71% % 4.37% Mining % -1.19% 1.08% -1.01% -0.01% % -0.97% Manufacturing % 5.25% 13.64% 4.56% -2.11% % 5.14% Utilities % 5.64% 0.24% 0.07% 0.01% % 4.14% Construction % 2.04% 3.01% 4.93% 0.46% % 0.23% Trade services % 2.45% 15.31% 8.50% -3.40% % 2.59% Transport services % 4.23% 3.59% 2.88% 0.51% % 2.15% Business services % 2.44% 1.30% 12.76% 4.07% % -2.17% Government services Personal services % 3.27% 12.79% 9.45% 4.19% % -0.06% Aggregate Services % 3.05% 32.98% 33.59% 5.36% % 0.97% Annex: Page 30
62 Taiwan Gross value added - Local Currency - (millions) (1970) Change (1970s-2000s) Growth (1970s to 2000s) Ratio of to number of persons engaged Agriculture % -0.73% 35.27% % -2.45% % 2.24% Mining % 9.11% 1.52% -1.48% -0.08% % 20.72% Manufacturing % 1.47% 20.20% 7.07% -0.47% % 0.75% Utilities % -6.68% 0.36% 0.07% 0.05% % -8.76% Construction % -2.89% 4.85% 2.75% -1.06% % -2.49% Trade services % 3.76% 15.21% 8.37% -0.20% % 2.92% Transport services % 1.98% 5.48% -0.84% -0.49% % 2.09% Business services % 6.59% 1.53% 8.61% 2.30% % 2.97% Government services % 1.68% 10.35% 2.94% 2.38% % -1.19% Personal services % 4.54% 5.24% 2.53% 0.02% % 3.59% Aggregate Services % 3.58% 37.81% 21.62% 4.00% % 1.95% Annex: Page 31
63 United States of America Gross value added - Local Currency - (millions) (1970) Change (1970s-2000s) Growth (1970s to 2000s) Ratio of to number of persons engaged Agriculture % 3.45% 3.23% -1.77% -0.12% % 4.52% Mining % 2.46% 0.74% -0.24% 0.11% % 0.16% Manufacturing % -0.39% 22.16% % -4.04% % 3.71% Utilities % -1.03% 0.67% -0.29% -0.02% % -0.20% Construction % -5.28% 5.33% -0.28% -0.74% % -3.78% Trade services % 1.15% 20.97% 3.04% 0.27% % 1.24% Transport services % 1.22% 6.00% -1.57% -0.41% % 2.34% Business services % 1.61% 9.20% 8.85% -0.19% % 1.93% Government services % 1.99% 26.41% 4.57% 4.83% % 0.49% Personal services % 0.18% 5.30% 1.18% 0.32% % -0.13% Aggregate Services % 1.52% 67.88% 16.07% 4.82% % 1.13% Annex: Page 32
64 Venezuela Gross value added - Local Currency - (millions) (1970) Change (1970s-2000s) Growth (1970s to 2000s) Ratio of to number of persons engaged Agriculture % 2.27% 25.87% % -1.61% % 0.36% Mining % -1.11% 1.53% 1.71% 1.53% % % Manufacturing % 0.76% 14.61% -4.86% -1.98% % -0.91% Utilities % 3.60% 1.24% -0.66% -0.21% % 3.12% Construction % 4.34% 6.01% 2.44% 0.41% % 0.22% Trade services % 4.50% 13.84% 9.51% -2.34% % 1.85% Transport services % 8.17% 4.58% 6.39% 2.83% % 1.35% Business services % 6.16% 4.54% 2.77% 0.78% % 1.33% Government services Personal services % 4.86% 27.78% -0.48% 0.57% % 1.01% Aggregate Services % 5.50% 50.74% 18.19% 1.85% % 1.57% Annex: Page 33
65 Part II. Convergence Annex: Page 34
66 Annex: Page 35
67 Annex: Page 36
68 Annex: Page 37
69 Annex: Page 38
70 Annex: Page 39
71 Annex: Page 40
72 Annex: Page 41
73 Annex: Page 42
74 Annex: Page 43
75 Part III. Peak Growth Annex: Page 44

76 Peak Growth *Services include: Wholesale and Retail trade; repair of motor vehicles, motorcycles and personal and household goods, Hotels and Restaurants Transport, Storage and Communications Financial Intermediation, Real Estate, Renting and Business Activities [Africa Sector Database - University of Groningen] Annex: Page 45
Convergence or Divergence: Discussing Structural Transformation in Africa
 Convergence or Divergence: Discussing Structural Transformation in Africa 2 Amadou Sy Senior Fellow, Africa Growth Initiative, The Brookings Institution Africa s Convergence 3 Outline 1. Economic growth:
Growth and Structural Transformation. Ejaz Ghani December 11, 2015 Presentation at National Academies of Sciences, Engineering, and Medicine
 Growth and Structural Transformation Ejaz Ghani December 11, 2015 Presentation at National Academies of Sciences, Engineering, and Medicine An outline. Has the relationship between income and economic
Three African Futures. John Page The Brookings Institution University of Nevada at Las Vegas 7 April 2014
 Three African Futures John Page The Brookings Institution University of Nevada at Las Vegas 7 April 2014 The Next Frontier? Africa has become the new frontier market Africa is the world s fastest-growing
Global Poverty: Recent Trends and Prospects for the Future Will We Achieve to Eradicate Extreme Poverty by 2030?
 Global Poverty: Recent Trends and Prospects for the Future Will We Achieve to Eradicate Extreme Poverty by 2030? Prof. Dr. Michael Grimm University of Passau, Erasmus University Rotterdam, RWI Essen, IZA
HAS SUSTAINED GROWTH DECOUPLED FROM INDUSTRIALIZATION? Dani Rodrik February 2014
 HAS SUSTAINED GROWTH DECOUPLED FROM INDUSTRIALIZATION? Dani Rodrik February 2014 Recent growth performance in the developing world Growth performance of country groups since 1980 10.0% 1980-1990 8.0% 1990-2000
LABOUR PRODUCTIVITY DEVELOPMENTS IN THE EURO AREA: AGGREGATE TRENDS AND SECTORAL PATTERNS
 ARTICLES LABOUR PRODUCTIVITY DEVELOPMENTS IN THE EURO AREA: AGGREGATE TRENDS AND SECTORAL PATTERNS This article reviews the trends in aggregate labour productivity in the euro area since the early 1980s
Beyond Manufacturing: Structural Change in Africa Reconsidered
 Beyond Manufacturing: Structural Change in Africa Reconsidered John Page The Brookings Institution, IGC and UNU-WIDER Governor s Lecture Bank of Uganda Kampala, 21 September 2018 Rediscovering Structural
Industrial Convergence in East Asia. July 1, Akira Kohsaka. Jun-ichi Shinkai
 OSIPP Discussion Paper : DP-2018-E-009 Industrial Convergence in East Asia July 1, 2018 Akira Kohsaka Professor Emeritus, Osaka School of International Public Policy Osaka University Jun-ichi Shinkai Lecturer,
Sectoral economic growth and structural transformation in Ethiopia
 Sectoral economic growth and structural transformation in Ethiopia Tadele Ferede (PhD) Department of Economics Addis Ababa University October 3, 2015 1 Outline 1 Introduction 2 Structural transformation
Gross Domestic Product of Georgia in 2010
 Gross Domestic Product of Georgia in 2010 The real growth of Gross Domestic Product (GDP) of Georgia in 2010 amounted to 6.4 percent and deflator grew by 8.7 percent year-on-year. In the same period the
AFRICA * Íñigo Verduzco-Gallo Senior Research Analyst, IFPRI. This Version: March 2013
 GLOBALIZATION, STRUCTURAL CHANGE, AND PRODUCTIVITY GROWTH, WITH AN UPDATE ON AFRICA * Margaret McMillan Senior Research Fellow, IFPRI Associate Professor of Economics, Tufts University Dani Rodrik Professor
African growth: facts and issues
 African growth: facts and issues 2009 IPD Africa Task force meeting Pretoria, July 9-10, 2009 François-Xavier Bellocq, Pierre Jacquet, Laurent Muresianu Preliminary Outline 1960-2000 : a few stylized facts
Africa s Evolving Employment Trends: Implications for Economic Transformation
 Africa s Evolving Employment Trends: Implications for Economic Transformation Dr. Felix Kwame Yeboah Michigan State University Prof. Thomas S. Jayne Michigan State University ABSTRACT Using nationally
Social Accounting Matrix and global databases
 Social Accounting Matrix and global databases Organized by Economics and Social Commission for Western Asia (September 29, 2017) Beirut Presented by: Yves Surry: Professor at the Swedish University of
Structural Transformation in Africa: Static Gains, Dynamic Losses. Gaaitzen de Vries (University of Groningen, Netherlands)
") Structural Transformation in Africa: Static Gains, Dynamic Losses Gaaitzen de Vries (University of Groningen, Netherlands) Marcel Timmer (University of Groningen, Netherlands) Klaas de Vries (The Conference
Structural Transformation in Africa: Static Gains, Dynamic Losses Gaaitzen de Vries (University of Groningen, Netherlands) Marcel Timmer (University of Groningen, Netherlands) Klaas de Vries (The Conference
Inflation. Global inflation eased substantially during the second half of 2011 and into 2012.
 Inflation Global inflation eased substantially during the second half of 11 and into 1. Developing country inflation, which averaged 7. percent in 11 eased to a percent annualized rate in the three months
INVESTMENT OPPORTUNITIES AND BUSINESS IN
 INVESTMENT OPPORTUNITIES AND BUSINESS IN THE AFRICAN CONTINENT World Services Group Spier Hotel, Stellenbosch, South Africa 13 October 2016 Dr Iraj Abedian PAN-AFRICAN INVESTMENT & RESEARCH SERVICES Outline
The State of Food Insecurity in the World 2010 Technical notes
 The State of Food Insecurity in the World 2010 Technical notes The aim of these technical notes is to provide an overview of the methodology adopted to produce the undernourishment estimates presented
Statistical Methods and Empirical Research on Consumer Services in Beijing
 Proceedings 59th ISI World Statistics Congress, 25-30 August 2013, Hong Kong (Session CPS028) p.4135 Statistical Methods and Empirical Research on Consumer Services in Beijing Xu Yan Beijing Municipal
Structure and Performance of the Services Sector in Transition Economies
 Public Disclosure Authorized Public Disclosure Authorized Public Disclosure Authorized Public Disclosure Authorized Policy Research Working Paper 4357 Structure and Performance of the Services Sector in
NBER WORKING PAPER SERIES WHAT IS DRIVING THE AFRICAN GROWTH MIRACLE? Margaret S. McMillan Kenneth Harttgen
 NBER WORKING PAPER SERIES WHAT IS DRIVING THE AFRICAN GROWTH MIRACLE? Margaret S. McMillan Kenneth Harttgen Working Paper 20077 http://www.nber.org/papers/w20077 NATIONAL BUREAU OF ECONOMIC RESEARCH 1050
Africa 2015 Prospects, Challenges and Opportunities. Haleh Bridi Director of External Relations and Partnership Africa Region, World Bank
 Africa 2015 Prospects, Challenges and Opportunities Haleh Bridi Director of External Relations and Partnership Africa Region, World Bank Africa continues to grow Despite a weak global economy, growth in
2017 Economic Report on Africa. Urbanization and Industrialization for Africa s Transformation
 2017 Economic Report on Africa Urbanization and Industrialization for Africa s Transformation SIDE EVENT Tenth Joint Annual Meetings of the African Union Specialized Technical Committee on Finance, Monetary
Global Economic Prospects, 2007
 Global Economic Prospects, 2007 Managing the Next Wave of Globalization Richard Newfarmer and Paul Brenton World Bank February, 2007 Strong growth in developing economies 7.0 Real GDP annual percent change
Service Sector: The Source of Output and Employment Growth in Ethiopia
 Academic Journal of Economic Studies Vol. 2, No.4, December 2016, pp. 139 156 ISSN 2393-4913, ISSN On-line 2457-5836 Service Sector: The Source of Output and Employment Growth in Ethiopia Zelalem Ejigu
IDC s role in boosting private investment in Energy Infrastructure
 Day Month Year IDC s role in boosting private investment in Energy Infrastructure Lindi Toyi PPP SBU Head : Industrial Development Corporation NEPAD-OECD AFRICA INVESTMENT INITIATIVE 11-12 November 2009
Structural transformation and the post development agenda for LDCs
 Structural transformation and the post- 2015 development agenda for LDCs UNCTAD Trade and Development Board Geneva, 10 December 2014 Dr Dirk Willem te Velde Overseas Development Institute Overview 3 issues
Global and Regional Food Consumer Price Inflation Monitoring
 Global and Regional Food Consumer Price Inflation Monitoring July 2014 Issue 5 Global Overview Global food consumer inflation in March and April 2014 has stabilized in the range of 5.0-5.5% (yearover-year),
Note: Proportion of the population aged from 15 to 65 in the total population. Source: United Nations Population Prospects
 Chapter 4 Challenge of exploring the new frontier of emerging countries [The key point of Part II, Chapter 4] In Asian emerging countries, especially China, the working-age population is starting to decline.
Challenges of Service-led Economic Development in India
 2012 2 nd International Conference on Economics, Trade and Development IPEDR vol.36 (2012) (2012) IACSIT Press, Singapore Challenges of Service-led Economic Development in India 1 Bharti Singh 1 + Institute
IMF MACRO CONFERENCE RODRIK PRESENTATION
 IMF MACRO CONFERENCE Before this panel, we were talking with Mike Spence, and he said he was glad we were having this session on growth. Of course, it s not as if the crisis completely eradicated the field.
Globalization, Structural Change, and Productivity Growth
 IFPRI Discussion Paper 01160 February 2012 Globalization, Structural Change, and Productivity Growth Margaret McMillan Dani Rodrik Development Strategy and Governance Division INTERNATIONAL FOOD POLICY
ECON 450 Development Economics
 ECON 450 Development Economics Agricultural Transformation and Rural Development University of Illinois at Urbana-Champaign Summer 2017 Outline Peasant Agriculture in Africa 1 The Structure of Agrarian
Workshop on trade in services negotiations in the CFTA
 Workshop on trade in services negotiations in the CFTA The role of services in Africa s economic transformation and trade Ottavia Pesce Economist, Regional Integration and Trade Division United Nations
UNMISTAKABLE SIGNS OF AGRI-FOOD SYSTEMS TRANSFORMATION INAFRICA
 UNMISTAKABLE SIGNS OF AGRI-FOOD SYSTEMS TRANSFORMATION INAFRICA T.S. Jayne and Holger Kray Seminar at Agricultural Working Group meeting 9 April 2018 Dar es Salaam, Tanzania 7 UNMISTAKABLE SIGNS OF AGRI-FOOD
The Performances and Challenges of Growth and Transformation Plan I in Ethiopia: the Case of Economic Growth and Social Development, Part I
 The Performances and Challenges of Growth and Transformation Plan I in Ethiopia: the Case of Economic Growth and Social Development, Part I By Teshome Adugna (PhD) 1 1. Introduction September 27, 2015
The Real Economy. Chapter-2
 2.1 The Bangladesh economy experienced an impressive growth in FY18, underpinned by strong domestic and external demand, as reflected in buoyant public and private investment and consumption, driven by
NBER WORKING PAPER SERIES THE RECENT GROWTH BOOM IN DEVELOPING ECONOMIES: A STRUCTURAL CHANGE PERSPECTIVE. Xinshen Diao Margaret McMillan Dani Rodrik
 NBER WORKING PAPER SERIES THE RECENT GROWTH BOOM IN DEVELOPING ECONOMIES: A STRUCTURAL CHANGE PERSPECTIVE Xinshen Diao Margaret McMillan Dani Rodrik Working Paper 23132 http://www.nber.org/papers/w23132
Boosting economic dynamics and job growth: The potential of industrial policies. Setting the scene: New industrial policies for catching up
 Boosting economic dynamics and job growth: The potential of industrial policies Joint workshop of the Friedrich Ebert Foundation and ILO 4-5 March 2013 The Jiva Hill Hotel, Crozet, France Setting the scene:
Development Dimensions of Food Security
 Development Dimensions of Food Security Philip Abbott Department of Agricultural Economics, Purdue University, West Lafayette, IN, USA Presented to the OECD Global Forum on Agriculture Paris, June 29 30,
Productivity Growth in India under Different Policy regimes: India KLEMS Research Team
 Productivity Growth in India under Different Policy regimes: 1980-2012 India KLEMS Research Team 3 rd world KLEMS Conference 19-20 May 2014 Tokyo, Japan Does Policy Regimes matter? Post independence and
Structural Transformation, Biased Technical Change and Labor Demand in Viet Nam
 Structural Transformation, Biased Technical Change and Labor Demand in Viet Nam by Phil Abbott, Ce Wu and Finn Tarp Second 2013 Asian Development Review Conference Manilla, 1-2 August 2013 Background and
Technical Cooperation Group on the SDG 4 - Education 2030 indicators (TCG) Terms of Reference (Draft)
 Terms of Reference (Draft)") Technical Cooperation Group on the SDG 4 - Education 2030 indicators (TCG) Terms of Reference (Draft) Montreal, Canada September, 2017 2 TCG: Terms of Reference (Draft) 1. Background With the adoption
Technical Cooperation Group on the SDG 4 - Education 2030 indicators (TCG) Terms of Reference (Draft) Montreal, Canada September, 2017 2 TCG: Terms of Reference (Draft) 1. Background With the adoption
Enhancing Productivity Growth. Philippe Aghion
 Enhancing Productivity Growth Philippe Aghion Basic questions How to enhance productivity growth in advanced and in emerging market economies? Schumpeterian growth theory Long-run growth driven by innovations
A rapier not a blunderbuss: Why the EU must do better in supporting African job creation
 E T TG European Think Tanks Group A rapier not a blunderbuss: Why the EU must do better in supporting African job creation Tilman Altenburg, San Bilal, Giulia Maci and Dirk Willem te Velde Key messages:
Country paper: Bangladesh
 UN Workshop on International Economic and Social Classifications 24-27 November, 2008 Bangkok, Thailand. Country paper: Bangladesh Md. Nurul Islam, Director Bangladesh Bureau of Statistics (BBS): Bangladesh
TRANSFORMING AFRICA: FROM NATURAL RESOURCE DEPENDENCE TO SUSTAINABLE GROWTH AND DEVELOPMENT. What Can Research Do?
 TRANSFORMING AFRICA: FROM NATURAL RESOURCE DEPENDENCE TO SUSTAINABLE GROWTH AND DEVELOPMENT What Can Research Do? Ernest Aryeetey University of Ghana and Brookings Institution 1 Outline Introduction: The
Agricultural Policies for Poverty Reduction. Jonathan Brooks OECD Trade and Agriculture Chatham House Friday 2 nd March 2012
 Agricultural Policies for Poverty Reduction Jonathan Brooks OECD Trade and Agriculture Chatham House Friday 2 nd March 2012 Contributors: Phil Abbott, Purdue University Jonathan Brooks, OECD Katia Covarrubias,
Learning to Compete Accelerating Industrial Development in Africa
 Learning to Compete Accelerating Industrial Development in Africa A COLLABORATIVE RESEARCH PROGRAM OF THE AFRICAN DEVELOPMENT BANK, THE BROOKINGS INSTITUTION, AND THE UNU WORLD INSTITUTE OF DEVELOPMENT
TRADE AND DEVELOPMENT REPORT, 2016
 UNITED NATIONS CONFERENCE ON TRADE AND DEVELOPMENT GENEVA TRADE AND DEVELOPMENT REPORT, 216 Structural transformation for inclusive and sustained growth Chapter III THE CATCH-UP CHALLENGE: INDUSTRIALIZATION
AFRICA REGIONAL INTEGRATION CONSULTATION ON STATUS AND EMERGING WORLD BANK GROUP PRIORITIES
 AFRICA REGIONAL INTEGRATION CONSULTATION ON STATUS AND EMERGING WORLD BANK GROUP PRIORITIES PURPOSE OF THE CONSULTATION Discuss the case for and status of integration in Africa; Provide an update on World
L. Colin Xu. Presentation for Managing Risk for Development
 Determinants of job growth, job quality, and their mechanisms: The Role of Business environment L. Colin Xu Presentation for Managing Risk for Development Basic framework to think about enterprises and
Measuring Value in Global Value Chains
 GLOBAL COMMODITIES FORUM 7-8 April 2014 Measuring Value in Global Value Chains by Ms. Rashmi Banga UNCTAD The views expressed are those of the author and do not necessarily reflect the views of UNCTAD.
I ntroduction. Job Creation and Poverty Reduction: Lessons from Ghana. Researcher. Francis Teal
 14 Job Creation and Poverty Reduction: Lessons from Ghana Researcher Francis Teal This policy brief seeks to explain the mechanism by which poverty was reduced in Ghana over the period from 1991/92 to
From Theory to Practice: Exploring Sustainable Solutions to Africa s Developmental Challenges
 From Theory to Practice: Exploring Sustainable Solutions to Africa s Developmental Challenges F. Kwame Yeboah, Assistant Professor Thomas S. Jayne, University Foundation Professor Michigan State University!!!!!!
Introduction. Structure and future development of the service sector in Bangladesh
 EJSM Vol. 20, 4/2016, ISSN: 2450-8535 www.wnus.edu.pl/ejsm DOI: 10.18276/ejsm.2016.20-06 49 55 Structure and future development of the service sector in Bangladesh Shakila Salam Bangladesh Agricultural
TD/B/EX(65)/3. United Nations Conference on Trade and Development. Report of the Trade and Development Board on its sixty-fifth executive session
/3. United Nations Conference on Trade and Development. Report of the Trade and Development Board on its sixty-fifth executive session") United Nations United Nations Conference on Trade and Development Distr.: General 11 September 2017 Original: English TD/B/EX(65)/3 Trade and Development Board Sixty-fifth executive session Geneva, 17
United Nations United Nations Conference on Trade and Development Distr.: General 11 September 2017 Original: English TD/B/EX(65)/3 Trade and Development Board Sixty-fifth executive session Geneva, 17
Dual Economy Approach, Structural Change and the role of Industrial Policy
 Dual Economy Approach, Structural Change and the role of Industrial Policy Antonio Angelino Development Economics and Emerging Markets University of Ferrara How do we explain economic growth? Two different
SERVICES IN INDUSTRIAL VALUE CHAINS
 8 SERVICES IN INDUSTRIAL VALUE CHAINS Services value-added, across all world economies, accounted for 29% of global gross exports in 29, according to research by ESCAP (214). In addition, there has been
Africa is rebounding from the global economic crisis UN Report
 Africa is rebounding from the global economic crisis UN Report Investments in infrastructure, agricultural productivity growth and foreign investment underpinned strong domestic demand Addis Ababa, 18
Results.
 Results Maps of production, consumption and production surplus of bovine meat in 2 are shown in Figure 1 for Africa, along with the growth in demand from 2 to 23. The full collection of maps is freely
UNITED NATIONS ECONOMIC COMMISSION FOR AFRICA. Meeting of African Ministers responsible for Energy. Meeting of Experts. Statement
 UNITED NATIONS ECONOMIC COMMISSION FOR AFRICA Meeting of African Ministers responsible for Energy Meeting of Experts Statement By Joseph Atta-Mensah Director, Regional Integration, Infrastructure and Trade
Trade and Employment in the Global Crisis
 Trade and Employment in the Global Crisis Launch June 21, 2010 Marion Jansen (and Erik von Uexkull) ILO Employment Sector / Trade and Employment Program http://www.ilo.org/trade It s a long way from Wall
The changing global economic landscape: Boosting productivity to meet the middle income challenge
 The changing global economic landscape: Boosting productivity to meet the middle income challenge Carl J. Dahlman Presentation in Berlin October 9, Outline A. Shifting global economic landscape B. The
How do we ensure food for the future?
 How do we ensure food for the future? Trends and opportunities in policy, demography and productivity William A. Masters www.agecon.purdue.edu/staff/masters wmasters@purdue.edu ADA Food & Nutrition Conference
Industrialise Africa
 Industrialise Africa Industrialise Africa is one of five accelerators of the African Development Bank. The others are Feed Africa, Light Up and Power Africa, Integrate Africa, and Improve the Quality
Communications Note *
 Communications Note * Energy Efficiency Indicators and the Design and Progress Monitoring of National and Sector Energy Efficiency Strategies in Developing Countries Background The International Roundtable
Construction Services: Contribution to Sustainable Development and Issues on Trade in Services. Emily MBURU DITC-UNCTAD
 Construction Services: Contribution to Sustainable Development and Issues on Trade in Services Emily MBURU DITC-UNCTAD Content of the Presentation Scope of construction services Market trends and characteristics
Skills development in the informal sector. Arvil V. Adams
 Skills development in the informal sector Arvil V. Adams Initial observations The informal sector plays a predominant role in job and national wealth creation in developing countries worldwide, but particularly
SOUTH AFRICA ITALY SUMMIT 014
 SOUTH AFRICA ITALY SUMMIT 014 SOUTH AFRICA AND ITALY RELATIONS IN THE CURRENT GEOPOLITICAL AND ECONOMIC SCENARIO PROFESSOR MTHULI NCUBE BLAVATNIK SCHOOL OF GOVERNMENT UNIVERSITY OF OXFORD OCTOBER 2, 2014
More than nine billion people to feed in 2050
 More than nine billion people to feed in 2050 Douglas Southgate, Professor Emeritus southgate.1@osu.edu U.S. Animal Agriculture s Future Role in World Food Production Global Trends in the Food Economy
Chapter 16 The Labor Market Effects of International Trade and Production Sharing
 Chapter 16 The Labor Market Effects of International Trade and Production Sharing Summary Freeing up resources so that they can be used more productively in other industries is the logic behind international
BROILER PRODUCTION AND TRADE POULTRY AFRICA. Kevin Lovell. 5 October Feeding Africa - Our time is now
 BROILER PRODUCTION AND TRADE POULTRY AFRICA Kevin Lovell 5 October 2017 Feeding Africa - Our time is now Why produce in Africa? 2 Before looking at dynamics of production and trade we should consider the
Market situation. Projection highlights CEREALS
 3. COMMODITY SNAPSHOTS Market situation CEREALS Global supplies of major cereals continued to exceed overall demand, leading to a significant build-up of inventories and much lower prices on international
AGOA s Final Frontier: Removing US Farm Trade Barriers
 CGD NOTES AGOA s Final Frontier: Removing US Farm Trade Barriers 7/23/14 (http://dev.cgdev.org/publication/agoa%e2%80%99s-final-frontier-removing-us-farm-trade-barriers) Kimberly Ann Elliott If the African
Increasing synergies among relevant stakeholders for the success of DD initiatives in East and Southern Africa Eliya Msiyaphazi Zulu, AFIDEP
 Increasing synergies among relevant stakeholders for the success of DD initiatives in East and Southern Africa Eliya Msiyaphazi Zulu, AFIDEP Pre-Conference Workshop on The Demographic Dividend Monday,
Key Trends in Policies and Investments for Agri-Food Transformation
 Key Trends in Policies and Investments for Agri-Food Transformation Harare, Zimbabwe June 14, 2018 Holger A. Kray Head, Africa Agriculture Policy Unit hkray@worldbank.org 1 Challenges & Enablers to Agri-Food
Jobs Supported by Goods Exports 2016
 Jobs Supported by Goods Exports 2016 In 2016 South Africa exported over R1 trillion worth of goods to the world, and this supported about 1 million jobs, accounting for 6.6 per cent of total employment,
Distortions to Agricultural Incentives Project lead by Kym Anderson. Signe Nelgen University of Adelaide
 Distortions to Agricultural Incentives Project lead by Kym Anderson Signe Nelgen University of Adelaide Workshop on Meeting Food Security Goals with Good Policy, Medan, Indonesia, 26-27 June 2013 Outline
And the problem areas are Asia and Sub- Saharan Africa
 The International Communities Millennium development goal # 1: halving poverty and hunger by 2015, will not be met The Impact on Developing Country Agriculture of the Global Economic Downturn and the OECD
Beyond balanced growth: The effect of human capital on economic growth reconsidered
 Beyond balanced growth 11 PartA Beyond balanced growth: The effect of human capital on economic growth reconsidered Uwe Sunde and Thomas Vischer Abstract: Human capital plays a central role in theoretical
EXECUTIVE SUMMARY. Figure 2 Shares of Natural Wealth in Low-Income Countries, Figure 1 Shares of Total Wealth in Low-Income Countries, 2000
 With this volume, Where Is the Wealth of Nations? the World Bank publishes what could be termed the millennium capital assessment: monetary estimates of the range of assets produced, natural, and intangible
39 Side-events. Employment and agricultural value chains. 17 th October pm Lebanon room
 39 Side-events Employment and agricultural value chains 17 th October 2012 6pm Lebanon room Chair Nicolas Bricas (Cirad) Introduction Mathilde Douillet (FARM) Employment and agriculture: what is the challenge?
PLENARY PANEL 1. A brief on the. African Union Commodities Strategy and Industrialization
 PLENARY PANEL 1 A brief on the African Union Commodities Strategy and Industrialization [Type here] The African Union Commodities Strategy and Industrialization 1. Africa has about 12 per cent of the world
Productivity and Competitiveness as determinants of Growth: Empirical Evidence from a Small Island Economy Mauritius
 Bank of Mauritius Productivity and Competitiveness as determinants of Growth: Empirical Evidence from a Small Island Economy Mauritius Dr. Ashwin Madhou Chief- Economic Analysis Division Bank of Mauritius
Annual GDP by production approach in current and constant prices: main issues 1
 Annual GDP by production approach in current and constant prices: main issues 1 Introduction This paper continues the series dedicated to extending the contents of the Handbook Essential SNA: Building
Africa s Unfolding Diet Transformation: Implications for Agrifood System Employment
 Journal of Agribusiness in Developing and Emerging Economies, 5(1), May, 2015. Africa s Unfolding Diet Transformation: Implications for Agrifood System Employment Tschirley, D., J. Snyder, M. Dolislager,
DANI RODRIK: THE FUTURE OF ECONOMIC TRANSFORMATION IN DEVELOPING COUNTRIES
 DANI RODRIK: THE FUTURE OF ECONOMIC TRANSFORMATION IN DEVELOPING COUNTRIES Event Report Leah Worrall Overseas Development Institute, London 23 June 2015 Stephany Griffith-Jones (Financial Markets Director,
Trading patterns: Global and regional perspectives
 Chapter V Trading patterns: Global and regional perspectives World merchandise trade in value terms fell by 3 per cent in 2016 following a 13 per cent slump recorded in 2015, with trade growth remaining
The East Asian Economic Crisis: It's not All Bad News
 Purdue University Purdue e-pubs GTAP Working Papers Agricultural Economics 1-1-1999 The East Asian Economic Crisis: It's not All Bad News Elena Ianchovichina World Bank Thomas Hertel Purdue University
10 ECB HOW HAVE GLOBAL VALUE CHAINS AFFECTED WORLD TRADE PATTERNS?
 Box 1 HOW HAVE GLOBAL VALUE CHAINS AFFECTED WORLD TRADE PATTERNS? In recent decades, global trade has undergone profound changes. Relative to global output, trade has risen sharply and cross-country linkages
Light Manufacturing in Africa. GRIPS PRESENTATION Hinh T. Dinh The World Bank March 7, 2014
 Light Manufacturing in Africa GRIPS PRESENTATION Hinh T. Dinh The World Bank March 7, 2014 Outline Why industrialization Scope of study Approach Main findings The six major constraints Illustration with
MINING AND THE ECONOMY OF SIERRA LEONE
 MINING AND THE ECONOMY OF SIERRA LEONE Prof. John C. Anyanwu* Lead Research Economist Development Research Department African Development Bank 4th West & Central Africa Mining Summit, 26th - 27th September
ISBN
 EVALUATING THE IMPACT OF THE LOGISTICS INDUSTRY TO GDP: THE THAI EXPERIENCE ABSTRACT Ruth Banomyong Dept. of International Business, Logistics & Transport Faculty of Commerce & Accountancy, Thammasat University,
Outline. Overview and Purpose. World Population. Indicators of Consumer Behavior The Market Basket Energy Transportation Travel Purchasing Power
 1 Outline Overview and Purpose World Population Indicators of Consumer Behavior The Market Basket Energy Transportation Travel Purchasing Power Conclusion 2 Market Basket: Overview The Market Basket is
KENYA AS A SERVICES HUB
 KENYA AS A SERVICES HUB The Role of Services in Economic Transformation Dirk Willem te Velde, Judith Tyson, Anupam Khanna April 2015 Concept note for Nairobi workshop, Kenya, 28 April 2015 Background information
China: growth, urbanisation and mineral resource demand
 : growth, urbanisation and mineral resource demand Jin Liu and Tony McDonald 1 Over recent decades, has experienced rapid economic growth and a related sharp increase in its rate of urbanisation. The speed
THE ANIMAL FEED TO POULTRY VALUE CHAIN IN ZAMBIA
 THE ANIMAL FEED TO POULTRY VALUE CHAIN IN ZAMBIA By Paul Samboko, Olipa Zulu-Mbata and Antony Chapoto Presented at the UNU-WIDER and the National Treasury Conference on Growth and development policy new
THE CHALLENGE OF PRODUCTIVITY GROWTH. Dani Rodrik FUNIDES August 2016
 THE CHALLENGE OF PRODUCTIVITY GROWTH Dani Rodrik FUNIDES August 2016 Growth of per-capita GDP Since 1990 Over the long term 1400 1600 1800 2000 2200 average annual growth rate = 2.3% 1990 1995 2000 2005