To what extent will climate and land use change affect EU-28 agriculture? A computable general equilibrium analysis
|
|
|
- Reynard Harvey
- 6 years ago
- Views:
Transcription
1 To what extent will climate and land use change affect EU-28 agriculture? A computable general equilibrium analysis Martina Sartori Ca Foscari University, Venice Joint study with Davide Geneletti, Stefano Schiavo and Rocco Scolozzi University of Trento
2 Motivation EU is one of the largest producers of agricultural goods à 10% of world output, 13% of global cereal production (EUROSTAT, 2015) Agricultural output is highly affected by climate change and land use change (IPCC, 2014; Bindi and Olesen, 2011) High uncertainty about the interactions in the climate-land-food system In addition, local demography and local economy act as exogenous drivers in combination with EU common agricultural policy Most existing research Focus on direct climate impacts on crop yields and agricultural output only (e.g., Jones and Thornton, 2003; Hertel et al., 2010; Ciscar et al., 2011; Lavalle et al., 2010) Study other regions (Schlenker et al., 2005; Deschênes and Greenstone, 2007;) Employ other techniques (van Passel et al., 2016)
3 The goal We simulate the structural joint consequences of both climate change and land use change on agriculture in the European Union, at the year 2050 First novelty: the combination of different modeling frameworks, each delivering key inputs for and output of the analysis Second novelty: the counterfactual simulations are conducted on a 2050 baseline, where the economic structure of the EU28 is consistent with the population and Gross Domestic Product (GDP) levels projected under the Middle of the Road Shared Socioeconomic Pathway, SSP2
4 Data sources and models GTAP CGE model EU28 countries, Rest of Europe and Rest of the World 4 agricultural sectors: Rice, Wheat, Cereals and Other crops Temperature projections: GAEZ dataset, HadleyCM3 GCM model, B2 SRES scenario Land-use change projections: LUISA Territorial Modeling platform (Land-Use-based Integrated Sustainability Assessment, Baranzelli et al., 2014, maintained by the JRC) Population and GDP projections: SSP2 (Kriegler et al., 2012; KC and Lutz, 2014; O Neill et al., 2017) from IIASA and OECD


5 Modeling strategy 2050 SSP2 scenario: GDP and Population projections CGE model baseline economic scenario at 2050 Impact of Climate Change (CC) Impact of Climate Change and Land Use Change (CCLU) % var. in agric. productivity and land availability CGE model Impact of Land Use Change (LU) Impact on agriculture
6 1. Climate change impact on agriculture The impact of climate change on agricultural productivity is estimated by applying the methodology proposed by Roson and Sartori (2016) Two damage functions relate increase in average temperature to agricultural productivity: One function estimates sectoral productivity variations in the yields of rice, wheat and maize only (IPCC 2014) à applied to Rice, Wheat and the broader category Cereals a second function estimates productivity changes of the aggregated agricultural sector, elaborating on Cline (2007) à applied to an aggregated residual category Other Crops


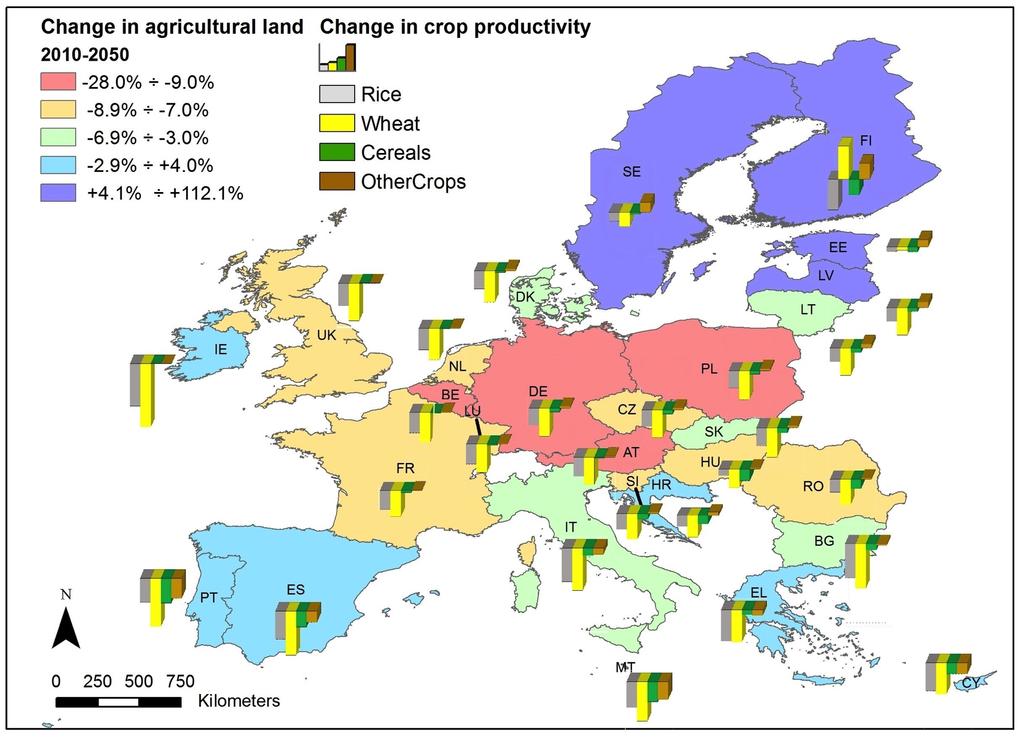
7 Predicted variations in average temperature The largest absolute increases will likely be experienced by Northern-Eastern countries (Finland, Sweden, Estonia, Hungary, Latvia, Lithuania) Among the smallest increases there are some Mediterranean and central Europe countries (Greece, Cyprus, Austria and Luxembourg)
8
9 1. Climate change impact on agricultural productivity - results Wheat is the most affected crop, with a predicted average decrease of -6.5%, followed by rice (-3.9%) and cereals (-1.2%) The impact on the residual sector other crops is negative for all the countries located in the South, whereas for the remaining countries the impact is small or even positive (0.3% on average) Warmer temperatures turn out to be beneficial especially in the northern countries (Finland, Sweden) and for residual crops category On average, the most affected countries are those located in Central and Eastern Europe, characterized by a continental climate and for which larger rises in mean temperature are predicted
10 2. Land-use change impact on agriculture Here land-use change means more or less land available for crops cultivation ( changes in the type of crops cultivated!) e.g. less land for agriculture means more land for urban, industrial and other uses The LUISA platform integrates a suite of models, considering the demand and supply of resources and socio-economic activities and infrastructures, and merges both top-down and bottom-up dynamics to simulate land use changes These estimates are available only in terms of generic agriculture land-use class (i.e., are applied uniformly to each crop category)
11 Actual and estimated changes in agricultural land (km 2, from LUISA platform) - results Largest absolute reductions occur in central Europe (Poland, France and Germany) A larger availability is predicted for North-Eastern countries and (surprisingly) for some Southern economies as well (such as Cyprus, Greece, Portugal and Spain)
12
13 80 60 Wheat CC LU UK Sweden Spain Slovenia Slovakia Romania Portugal Poland Netherlands Malta Luxembourg Lithuania Latvia Land Use Change LU Italy Ireland Hungary Greece Germany France Finland Climate change CC Estonia Denmark Czech Rep. Cyprus Croatia Bulgaria 5 Belgium Austria % variations % changes in agricultural output (crop yields) by country RICE Climate Change and Land Use Change CCLU Rice CCLU
14 8 6 Cereals CC LU UK Sweden LU Spain Slovenia CC Slovakia Romania Wheat Portugal Poland Netherlands Malta Luxembourg Lithuania Latvia Italy Ireland Hungary Greece Germany France Finland Estonia Denmark Czech Rep. Cyprus Croatia Bulgaria Belgium Austria % variations % changes in agricultural output (crop yields) by country WHEAT UK Sweden Spain Slovenia Slovakia Romania Portugal Poland Netherlands Malta Luxembourg Lithuania Latvia Italy Ireland Hungary Greece Germany France Finland Estonia Denmark Czech Rep. Cyprus Croatia Bulgaria Belgium Austria CCLU CCLU
15 UK Sweden LU Spain Slovenia Slovakia CC Romania Portugal Cereals Poland Netherlands Malta Luxembourg Lithuania Latvia Italy Ireland Hungary Greece Germany France Finland Estonia Denmark Czech Rep. Cyprus Croatia Bulgaria Belgium Austria % variations % changes in agricultural output (crop yields) by country CEREALS UK Sweden Spain Slovenia Slovakia Romania Portugal Poland Netherlands Malta Luxembourg Lithuania Latvia Italy Ireland Hungary Greece Germany France Finland Estonia Denmark Czech Rep. Cyprus Croatia Bulgaria Belgium Austria CCLU
16 % changes in agricultural output (crop yields) by country OTHER CROPS 20 Other Crops CC LU CCLU 15 % variations Austria Belgium Bulgaria Croatia Cyprus Czech Rep. Denmark Estonia Finland France Germany Greece Hungary Ireland Italy Latvia Lithuania Luxembourg Malta Netherlands Poland Portugal Romania Slovakia Slovenia Spain Sweden UK
17 Absolute change in agricultural output by crop (M$) CCLU scenario Rice Wheat Cereals OtherCrops TOT Tot prod. in the baseline % Austria % Belgium % Bulgaria % CroaBa % Cyprus % CzechRep % Denmark % Estonia % Finland % France % Germany % Greece % Hungary % Ireland % Italy % Latvia % Lithuania % Luxembourg % Malta % Netherlands % Poland % Portugal % Romania % Slovakia % Slovenia % Spain % Sweden % UK %
18 Impact on agriculture summing up The overall impact on crop yield may vary substantially across countries -38% in Luxembourg (driven by land-use change), +65% in Finland (driven by climate change) Climate change drives the results in some countries, land-use change in others The expected variations in the yield of the various crop categories (with the exception of rice) are qualitatively similar within the same country with some exceptions agricultural production in Sweden, Finland and Estonia is expected to grow, regardless the crop type under consideration; the reverse holds true for Hungary, Germany, Spain, Slovenia, UK and Belgium In Italy, France and Cyprus changes in crop productivity are positive for some product categories and negative for others
19 Impact on agriculture summing up Consistently with the literature (e.g., Alexandrov et al., 2002; Ewert et al., 2005; Audsley et al., 2006; Olesen et al., 2007; Richter and Semenov, 2005): climate-related increases in crop yields are expected above all in northern European countries Unlike other studies: among the countries expected to suffer the largest reductions in wheat and cereals yields we find non-mediterranean countries (Germany, Poland, Hungary, Belgium and Luxembourg) The negative impact is often driven by changes in land use, indeed these countries are likely to experience the largest percentage reductions in land available for agriculture

20 % variations in national income 0,15 CC LU CCLU % variations 0,10 0,05 0,00 0,05 0,10 0,15 0,20 Austria Belgium Bulgaria Croatia Cyprus Czech Rep. Denmark Estonia Finland France Germany Greece Hungary Ireland Italy Latvia Lithuania Luxembourg Malta Netherlands Poland Portugal Romania Slovakia Slovenia Spain Sweden UK
21 Take Home Messages - 1 Climate and land-use change are likely to affect agricultural systems very differently across Europe Northern countries are expected to benefit from climate change impacts, whereas other areas in Europe will suffer negative consequences in terms of reduced agricultural output, real income and welfare The most vulnerable region will not be the Mediterranean Europe, but central Europe: Poland, Romania, Bulgaria, Hungary à negative impacts are majorly driven by land use change Southern Europe is negatively affected, and impacts are driven by climate change Small impacts on national income à These outcomes may exacerbate existing regional difference across EU28 countries
22 Take Home Messages - 2 Adaptation strategies could, at a cost, effectively curb some negative effects of climate change or exploit positive effects, thus reducing regional disparities In our simulation exercises we deliberately abstract from any adaptation/mitigation policy In this respect, improving the understanding of the potential effects of climate change on crop yields is central to design appropriate adaptation strategies, and current European agricultural policies need to be reformed in a way that encourage flexible land use and crop production
23 Thank you Martina Sartori
CAP CONTEXT INDICATORS
 CAP CONTEXT INDICATORS 2014-2020 24. AGRICULTURAL TRAINING OF FARM MANAGERS 2017 update CONTEXT INDICATOR 24: AGRICULTURAL TRAINING OF FARM MANAGERS Learning by doing is still the main form of for the
To what extent will climate and land use change affect EU-28 agriculture? A computable general equilibrium analysis
 To what extent will climate and land use change affect EU-28 agriculture? A computable general equilibrium analysis SIS Working Paper N o 2017 2 September 2017 Martina SARTORI IEFE Davide GENELETTI University
Energy demand dynamics and infrastructure development plans in the EU. October 10 th, 2012 Jonas Akelis, Managing Partner - Baltics
 Energy demand dynamics and infrastructure development plans in the EU October 10 th, 2012 Jonas Akelis, Managing Partner - Baltics Forecasted energy demand dynamics of EU-11 will be significantly higher
ODYSSEE-MURE, a decision support tool for energy efficiency policy evaluation. Recent energy efficiency trends in the EU
 ODYSSEE-MURE, a decision support tool for energy efficiency policy evaluation Recent energy efficiency trends in the EU Didier Bosseboeuf, ADEME, project coordinator Bruno Lapillonne, Karine Pollier; Enerdata
The need for better statistics for climate change policies
 The need for better statistics for climate change policies Jacqueline McGlade Greenhouse gas emission data: more timely and more spatial data needed EEA annual report on GHG trends and projections in Europe
Eurostat current work on resource-efficient circular economy Renato Marra Campanale
 Eurostat current work on resource-efficient circular economy Renato Marra Campanale Renato.Marra-Campanale@ec.europa.eu Eurostat Unit E2 'Environmental statistics and accounts; sustainable development'
Emissions Trading System (ETS): The UK needs to deliver its share of the total EU ETS emissions reduction of 21% by 2020, compared to 2005;
: The UK needs to deliver its share of the total EU ETS emissions reduction of 21% by 2020, compared to 2005;") Emissions Trading System (ETS): The UK needs to deliver its share of the total EU ETS emissions reduction of 21% by 2020, compared to 2005; Non-ETS emissions: The Effort Sharing Decision sets a target
Emissions Trading System (ETS): The UK needs to deliver its share of the total EU ETS emissions reduction of 21% by 2020, compared to 2005; Non-ETS emissions: The Effort Sharing Decision sets a target
CAP CONTEXT INDICATORS
 CAP CONTEXT INDICATORS 2014-2020 44. ENERGY USE IN AGRICULTURE, FORESTRY AND THE FOOD INDUSTRY 2017 update BE BG CZ DK DE EE IE EL ES FR HR IT CY LV LT LU HU MT NL AT PL PT RO SI SK FI SE UK CONTEXT INDICATOR
TRENDS IN THE EU AGRICULTURAL LAND WITHIN
 JRC Policy Insights OCTOBER 2018 TRENDS IN THE EU AGRICULTURAL LAND WITHIN 2015-2030 In 2015 agricultural land is estimated to cover 42% of all EU land area. The arable land accounts for the largest share
Over the whole year 2011, GDP increased by 1.4% in the euro area and by 1.5% in the EU27, compared with +1.9% and +2.0% respectively in 2010.
 35/2012-6 March 2012 Second estimates for the fourth quarter of Euro area and EU27 down by 0.3% +0.7% and +0.9% respectively compared with the fourth quarter of 2010 decreased by 0.3% in both the euro
ESF Ex-Post evaluation
 ESF 2007-2013 Ex-Post evaluation Fields marked with * are mandatory. Open public consultation Questionnaire Please consult the background document as it provides useful information on the European Social
How to secure Europe s competitiveness in terms of energy and raw materials? The answer, my friend, is blowing in the wind
 How to secure Europe s competitiveness in terms of energy and raw materials? The answer, my friend, is blowing in the wind Iván Pineda Head of Policy Analysis, EWEA PolyTalk 2014, Brussels Around 600 members
10. Demand (light road freight veh shares)
") . Demand (light road freight veh shares) Overview Target The view is intended to calculate the share of light vehicles in total road freight vehicles. The light road freight vehicles are those belonging
. Demand (light road freight veh shares) Overview Target The view is intended to calculate the share of light vehicles in total road freight vehicles. The light road freight vehicles are those belonging
EU Climate and Energy Policy Framework: EU Renewable Energy Policies
 EU Climate and Energy Policy Framework: EU Renewable Energy Policies Buenos Aires 26-27 May 2015 Dr Stefan Agne European Commission DG Climate Action Energy 1 EU Climate and Energy Policy Framework 2 Agreed
Crop production - Coarse grains
 PART 1 Crop production - Coarse grains Coarse grains are cereal grains other than wheat and rice that include maize (corn in the United States), barley, sorghum, rye, and oats. The global demand for these
EUROPE S ENERGY PORTAL
 EUROPE S ENERGY PORTAL METHODOLOGY GAS & ELECTRICTY PRICES Collect Analyze Report EUROPEAN UNION END-USERS Description of the process leading to the determination of end-user prices for natural gas and
CAP CONTEXT INDICATORS
 CAP CONTEXT INDICATORS 2014-2020 33. FARMING INTENSITY 2017 update CONTEXT INDICATOR 33: FARMING INTENSITY Intensification is an important restructuring process that has characterised European agriculture
ENERGY PRIORITIES FOR EUROPE
 ENERGY PRIORITIES FOR EUROPE Presentation of J.M. Barroso, President of the European Commission, to the European Council of 4 February 2011 Contents 1 I. Why energy policy matters II. Why we need to act
Environmental impact assessment of CAP greening measures using CAPRI model
 Environmental impact assessment of CAP greening measures using CAPRI model JM Terres, C. Bulgheroni, A. Leip, ML Paracchini 19 th MARS conference Vilnius Plenary session: Environmental aspects of the CAP
EUROPEAN COUNCIL Brussels, 31 May 2013 (OR. en)
") EUROPEAN COUNCIL Brussels, 31 May 2013 (OR. en) Interinstitutional File: 2013/0900 (NLE) EUCO 110/13 INST 234 POLG 69 OC 295 LEGAL ACTS Subject: DRAFT EUROPEAN COUNCIL DECISION establishing the composition
EUROPEAN COUNCIL Brussels, 31 May 2013 (OR. en) Interinstitutional File: 2013/0900 (NLE) EUCO 110/13 INST 234 POLG 69 OC 295 LEGAL ACTS Subject: DRAFT EUROPEAN COUNCIL DECISION establishing the composition
REVIEW OF ECONOMIC GROWTH FACTORS OF RURAL AREAS IN THE EUROPEAN UNION
 244 REVIEW OF ECONOMIC GROWTH FACTORS OF RURAL AREAS IN THE EUROPEAN UNION Mirela Adriana Rusali PhD, Scientific Researcher II, Institute of Agricultural Economics The Romanian Academy Abstract: Growth
3. Future wood demand for energy
 UNECE/FAO Workshop on wood resource balances Part II: Future wood resource availability and demands presented by Sebastian Hetsch University of Hamburg Centre of Wood Science Udo Mantau Florian Steierer
RENEWABLE H&C: BREAK-THROUGH NEEDS?
 RENEWABLE H&C: BREAK-THROUGH NEEDS? Tobias Fleiter, Jan Steinbach, Fraunhofer ISI Brussels, 2017/10/17, EUFORES Based on 3 EU H&C projects Mapping and analyses of the H/C fuel deployment EC tender study
Wind energy in Europe markets
 Wind energy in Europe markets Turkish Wind Energy Congress (TWEC 2012), 7 November 2012, Istanbul Christian Kjaer CEO European Wind Energy Association (EWEA) More than 600 members from almost 60 countries
The Innovation Union Scoreboard: Monitoring the innovation performance of the 27 EU Member States
 MEMO/12/74 Brussels, 7 February 2012 The Innovation Union Scoreboard: Monitoring the innovation performance of the 27 EU Member States This MEMO provides an overview of the research and innovation performance
Trends and drivers in greenhouse gas emissions in the EU in 2016
 EU greenhouse gas inventory Trends and drivers in greenhouse gas emissions in the EU in 2016 Official data for 2016 confirm the longterm reduction in greenhouse gas emissions across Europe. This briefing
CAP CONTEXT INDICATORS
 CAP CONTEXT INDICATORS 2014-2020 40. WATER QUALITY 2017 update CONTEXT INDICATOR 40: WATER QUALITY Water quality is assessed through the Gross Nutrient Balance and nitrates in freshwater The nitrogen surplus
FRAMEWORK CONVENTION ON CLIMATE CHANGE - Secretariat CONVENTION - CADRE SUR LES CHANGEMENTS CLIMATIQUES - Secrétariat KEY GHG DATA
 UNITED NATIONS NATIONS UNIES FRAMEWORK CONVENTION ON CLIMATE CHANGE - Secretariat CONVENTION - CADRE SUR LES CHANGEMENTS CLIMATIQUES - Secrétariat KEY GHG DATA Greenhouse Gas Emissions Data for 1990 2003
AMBITION OF RENEWABLE ENERGY TARGETS FOR THE EU IN 2030
 AMBITION OF RENEWABLE ENERGY TARGETS FOR THE EU IN CONCLUSIONS FROM THE REPORT BENCHMARKS FOR A MORE AMBITIOUS EU RENEWABLES TARGET COMMISSIONED BY EREF CORINNA KLESSMANN 17 OCTOBER 2017 1 / ECOFYS, A
E U R O P E A N U N I O N
 May 2018 Statistical Factsheet E U R O P E A N U N I O N CONTENTS Key figures EU-28 1. POPULATION & ECONOMY 2. FINANCIAL ASPECTS 3. ECONOMIC ACCOUNTS 4. AGRICULTURAL TRADE 5. FARM STRUCTURE 1 2-5 6-8 9-16
Vulnerability to Drought in Europe
 11 de Waterforum: Waterschaarste en droogte, de nieuwe realiteit Friday, 26 September 2014 Vulnerability to Drought in Europe Wouter Vanneuville project manager Water & Vulnerability, EEA The EEA eea.europa.eu
Alternative Waste Management can reduce Greenhouse Gas emissions
 Alternative Waste Management can reduce Greenhouse Gas emissions Experiences from Germany and the European Union Marlene Sieck Federal Environment Agency Germany Federal Environment Agency Division III
Better Waste Management Can Avoid GHG Emissions Significantly
 GMI MSW Subcommittee Meeting March 2013 Better Waste Management Can Avoid GHG Emissions Significantly Marlene Sieck Federal Environment Agency GERMANY 1 Federal Environment Agency Waste Technology Waste
Sea freight data indicate weak import demand both in US and EU27. Data on inland road and rail freight indicate weak domestic activity
 Statistics Brief Global Trade and Transport July 2013 Global Freight Volumes Indicate Increasing Dependency on -led Growth The latest update of global freight data collected by the International Transport
International Indexes of Consumer Prices,
 International Indexes of Consumer Prices, July International Labor Comparisons Table of Contents Highlights... 1 Monthly Charts.. Monthly Tables... Annual Charts..... 5 Annual Tables.. 7 Technical Notes..
Options for structural measures in the EU ETS
 CEPS Carbon Market Forum 23 April 2013, Brussels Options for structural measures in the EU ETS Stefan P. Schleicher Wegener Center for Climate and Global Change University of Graz A B B C C D E F F G G
Photo: Thinkstock. Wind in power 2010 European statistics. February The European Wind energy association
 Photo: Thinkstock Wind in power 21 European statistics February 211 1 WIND IN POWER: 21 EUROPEAN STATISTICS Contents Executive summary 21 annual installations Wind map 21 Wind power capacity installations
Indicator Fact Sheet (WQ01c) Water exploitation index
 Water exploitation index") Indicator Fact Sheet (WQ01c) Water exploitation index Authors: Conchita Marcuello and Concha Lallana, CEDEX EEA project manager: Niels Thyssen version 01.10.03 Key message 18% of Europe s population live
Indicator Fact Sheet (WQ01c) Water exploitation index Authors: Conchita Marcuello and Concha Lallana, CEDEX EEA project manager: Niels Thyssen version 01.10.03 Key message 18% of Europe s population live
CAP CONTEXT INDICATORS
 CAP CONTEXT INDICATORS 2014-2020 45. EMISSIONS FROM AGRICULTURE 2017 update CONTEXT INDICATOR 45: EMISSIONS FROM AGRICULTURE 1. GHG emissions from agriculture GHG emissions from agriculture represent 9.8%
PATTERNS OF THE AGRICULTURAL INCOME AND IMPACT OF STRUCTURAL CHANGES POST-ENLARGEMENT AMONG EU STATES
 CES Working Papers Volume VII, Issue 2A PATTERNS OF THE AGRICULTURAL INCOME AND IMPACT OF STRUCTURAL CHANGES POST-ENLARGEMENT AMONG EU STATES Mirela-Adriana RUSALI * Abstract: The article presents the
Tier 1 estimation of GHG emissions from organic soils in Cropland Management (CM) and Grazing Land Management (GM) at EU level
 and Grazing Land Management (GM) at EU level") Tier 1 estimation of GHG emissions from organic soils in Cropland Management (CM) and Grazing Land Management (GM) at EU level Simone Rossi, Roland Hiederer, Giacomo Grassi, Raul Abad Viñas Joint Research
Tier 1 estimation of GHG emissions from organic soils in Cropland Management (CM) and Grazing Land Management (GM) at EU level Simone Rossi, Roland Hiederer, Giacomo Grassi, Raul Abad Viñas Joint Research
Brief on agricultural biomass production 1
 Brief on agricultural biomass production 1 Key messages 1. The total annual agricultural biomass production in the European Union is estimated at 956 million tonnes (Mt) per year. 54% are primary products
Joint owner of the research company Profu Research leader of the waste management group at Chalmers University of Technology , Ph.D
 Joint owner of the research company Profu Research leader of the waste management group at Chalmers University of Technology 1993-2005, Ph.D. 1993. Profu Profu was established 1987 and has since then been
Example of using detailed statistics: The case of poplar markets in EU
 Example of using detailed statistics: The case of poplar markets in EU Arvydas Lebedys FAO Forestry Officer (Statistics) Eurostat Forestry Statistics Working Group Meeting, Luxembourg, 16-17 November 2011
(c) The terms of the agreement are set out in the Annex to this Note Verbale.
 The terms of the agreement are set out in the Annex to this Note Verbale.") Note Verbale No EDD/2018/001 Her Britannic Majesty's Foreign and Commonwealth Office presents its compliments to the Secretariat of the United Nations Framework Convention on Climate Change and has the
Note Verbale No EDD/2018/001 Her Britannic Majesty's Foreign and Commonwealth Office presents its compliments to the Secretariat of the United Nations Framework Convention on Climate Change and has the
Energy Mapping in Heat Roadmap Europe
 Energy Mapping in Heat Roadmap Europe Susana Paardekooper, Aalborg University 13 June 2017 District Energy in Chile Who are we? Energy planning: Highly renewable energy systems with radical technological
Antitrust: Car price report shows price differentials for new cars in EU narrowing in 2010
 EUROPEAN COMMISSION - PRESS RELEASE Antitrust: Car price report shows price differentials for new cars in EU narrowing in 2010 Brussels, 26 July 2011 - The European Commission s latest car price report
Performance of Rural Development Programmes of the period - Your Voice
 Performance of Rural Development Programmes of the 2007-2013 period - Your Voice Fields marked with * are mandatory. Introduction The Commission will use the information gathered through this survey together
Photo: Karpov. Wind in power 2009 European statistics. February 2010 THE EUROPEAN WIND ENERGY ASSOCIATION
 Photo: Karpov Wind in power 29 European statistics February 21 1 WIND IN POWER: 29 EUROPEAN STATISTICS Contents Executive summary 29 annual installations Wind map 29 Wind installations 29 Power capacity
ION RALUCA, ANDREEA NOVAC CORNELIA, MIHAELA NOVAC OVIDIU, CONSTANTIN
 ACTA CAROLUS ROBERTUS 4 (2) Summary ROMANIAN AGRICULTURE ANALYSIS OF VEGETAL SECTOR ION RALUCA, ANDREEA NOVAC CORNELIA, MIHAELA NOVAC OVIDIU, CONSTANTIN The paper analyzes the main changes and trends in
ANALYSIS OF E-GOVERNMENT IN THE MEMBER STATES EUROPEAN UNION AND CANDIDATE
 ANALYSIS OF E-GOVERNMENT IN THE MEMBER STATES EUROPEAN UNION AND CANDIDATE COUNTRIES Mary Violeta Bar Ph. D Student University of Craiova Faculty of Economics and Business Administration Craiova, Romania
.eu brand awareness. Domain names have a high awareness. About 81% of the European Internet population has heard of domain names.
 .eu brand awareness Domain names have a high awareness. About 81% of the European Internet population has heard of domain names. More than half of the European Internet population knows of the existence
Council of the European Union Brussels, 10 November 2016 (OR. en)
") Conseil UE Council of the European Union Brussels, 10 November 2016 (OR. en) Interinstitutional File: 2016/0186 (COD) 13660/16 LIMITE NOTE CULT 101 AELE 77 EEE 41 CODEC 1506 From: Permanent Representatives
Conseil UE Council of the European Union Brussels, 10 November 2016 (OR. en) Interinstitutional File: 2016/0186 (COD) 13660/16 LIMITE NOTE CULT 101 AELE 77 EEE 41 CODEC 1506 From: Permanent Representatives
Environmental statistics in Europe Facts and figures on the environment: from environmental taxes to water resources
 STAT/10/189 10 December 2010 Environmental statistics in Europe Facts and figures on the environment: from environmental taxes to water resources What share of fresh water resources is being abstracted
EU Agricultural Economic Briefs
 EU Agricultural Economic Briefs Structural development in EU agriculture Brief N 3 September 2011 While structural development in agriculture is typically described as a change in the number and size of
The Cancun Agreements: Land use, land-use change and forestry
 Decision 2/CMP.6 The Cancun Agreements: Land use, land-use change and forestry The Conference of the Parties serving as the meeting of the Parties to the Kyoto Protocol, Affirming that the implementation
Public consultation on enhanced cooperation between Public Employment Services (PES)
") Public consultation on enhanced cooperation between Public Employment Services (PES) Fields marked with * are mandatory. Introduction The European Network of Public Employment Services (PES Network) was
Public consultation on enhanced cooperation between Public Employment Services (PES) Fields marked with * are mandatory. Introduction The European Network of Public Employment Services (PES Network) was
Quality of life indicators - natural and living environment
 Quality of life indicators - natural and living environment Statistics Explained Data from January 2018. Most recent data: Further Eurostat information, Main tables and Database. Planned update: January
Small Business and Job Creation in EU
 Small Business and Job Creation in EU MFC Webinar Session 27th September 2016 Justyna Pytkowska Research Manager Microfinance Centre (MFC) This meeting has received financial support from the European
This document is a preview generated by EVS
 TECHNICAL SPECIFICATION SPÉCIFICATION TECHNIQUE TECHNISCHE SPEZIFIKATION CEN/TS 16555-1 July 2013 ICS 03.100.50; 03.100.40 English Version Innovation Management - Part 1: Innovation Management System Management
COMMISSION STAFF WORKING DOCUMENT. Review of greening after one year
 EUROPEAN COMMISSION Brussels, 22.6.2016 SWD(2016) 218 final PART 3/6 COMMISSION STAFF WORKING DOCUMENT Review of greening after one year EN EN Annex 2 Initial results of the implementation of green direct
FORECASTING LABOUR PRODUCTIVITY IN THE EUROPEAN UNION MEMBER STATES: IS LABOUR PRODUCTIVITY CHANGING AS EXPECTED?
 Interdisciplinary Description of Complex Systems 16(3-B), 504-523, 2018 FORECASTING LABOUR PRODUCTIVITY IN THE EUROPEAN UNION MEMBER STATES: IS LABOUR PRODUCTIVITY CHANGING AS EXPECTED? Berislav Žmuk*,
EU Construction & Demolition Waste Management Protocol Dublin, 22 June 2017
 EU Construction & Demolition Waste Management Protocol Dublin, 22 June 2017 EUROPEAN COMMISSION - DG GROWTH - Unit C.1 Clean technologies & products - Vincent Basuyau - vincent.basuyau@ec.europa.eu Resource
Submission by Hungary and the European Commission on behalf of the European Union and its Member States
 Submission by Hungary and the European Commission on behalf of the European Union and its Member States Budapest, 17 May 2011 Subject: Submission of information on forest management reference levels by
Approximated greenhouse gas emissions in 2016
 Approximated greenhouse gas emissions Approximated greenhouse gas emissions in 2016 This briefing presents early approximated (proxy) estimates of greenhouse gas (GHG) emissions for 2016 in the European
WATER AS A SCARCE. Manuel Sapiano Regulation Unit Malta Resources Authority
 WATER AS A SCARCE NATIONAL RESOURCE Manuel Sapiano Regulation Unit Malta Resources Authority Introduction (1) WATER SCARCITY a situation where insufficient water resources are available to satisfy long-term
Impact of partial decoupling on prices, production and farm revenues in the EU
 Impact of partial decoupling on prices, production and farm revenues in the EU Alan Renwick, Cesar Revoredo-Giha, Andrew Barnes, Steven Thomson (SAC) Torbjorn Jansson (SLU) Gerald Schwarz (vti) Presentation
PPI Training. MODULE 2 The need to innovate in municipal waste management. PPI training Location of the training Date of the training.
 PPI Training MODULE 2 The need to innovate in municipal waste management PPI training Location of the training Date of the training Contents Status quo Waste management in Europe Drivers for innovation
Resource efficiency and waste
 Municipal Municipal management across European See also: Country profiles on municipal management 1. Introduction Over the last two decades, European have increasingly shifted their focus with regard to
COMMISSION STAFF WORKING DOCUMENT Accompanying the document
 EUROPEAN COMMISSION Brussels, 14.12.2017 SWD(2017) 445 final PART 2/2 COMMISSION STAFF WORKING DOCUMENT Accompanying the document REPORT FROM THE COMMISSION TO THE EUROPEAN PARLIAMENT, THE COUNCIL, THE
Phasing out nuclear power in Europe Rolf Golombek, Finn Roar Aune and Hilde Hallre Le Tissier 39th IAEE International Conference Bergen, June 2016
 Oslo Centre of Research on Environmentally friendly Energy Phasing out nuclear power in Europe Rolf Golombek, Finn Roar Aune and Hilde Hallre Le Tissier 39th IAEE International Conference Bergen, June
European information on climate change impacts, vulnerability and adaptation
 André Jol, EEA Head of Group Climate change impacts, vulnerability impacts, vulnerability and adaptation Conference: Adaptation to climate change: what is the situation in Belgium? Brussels, 23 November
COST meeting Zagreb, 25th February 2016
 COST 1104 Sustainable production of high-quality cherries for the European market COST meeting Zagreb, 25th February 2016 Mario Njavro University of Zagreb Faculty of Agriculture Department of Management
Environmental Best Practices, It Begins with Us: Business, Local Governments and International Community Should Work Together
 Environmental Best Practices, It Begins with Us: Business, Local Governments and International Community Should Work Together Jung Wan Lee, PhD Boston University, United States Objectives of the Paper
Figures of Catalonia Generalitat de Catalunya Government of Catalonia
 www.idescat.cat Figures of Generalitat de Catalunya Government of POPULATION POPULATION STRUCTURE 5-9 % 0-4 % 5 4 3 2 1 0 0 1 2 3 4 5 Population (1 000) (1) 7 434 46 508 507 417 men 49.1 49.3 48.8 women
Flash Eurobarometer 426. SMEs, Resource Efficiency and Green Markets
 SMEs, Resource Efficiency and Green Markets Fieldwork Publication December 2015 Survey requested by the European Commission, Directorate-General for Internal Market, Industry, Entrepreneurship and SMEs
Table 1. Labour productivity indicators * EU EU ,1 106,0 105,
 LABOUR PRODUCTIVITY DISPARITIES IN THE EUROPEAN UNION Goschin Zizi Academy of Economic Studies, 15-17 Calea Dorobantilor, Bucharest, Phone: 0765505869, E-mail: zizigoschin@yahoo.com Danciu Aniela Academy
International trade related air freight volumes move back above the precrisis level of June 2008 both in the EU area and in the Unites States;
 Statistics Brief Global Trade and Transport October 2017 Air freight volumes increase since the second quarter of 2016 The latest update of global freight data collected by the International Transport
EU Construction & Demolition Waste Management Protocol Bucharest 17 October 2017
 EU Construction & Demolition Waste Management Protocol Bucharest 17 October 2017 European Commission - DG Research & Innovation - Unit I2 Eco-innovation Challenges for Construction and Demolition Waste
UTILITIES: HOW THE EU DIRECTIVE IS IMPLEMENTED AND HOW IT WORKS IN EU MEMBER STATES
 A joint initiative of the OECD and the European Union, principally financed by the EU VIth IPA REGIONAL PUBLIC PROCUREMENT CONFERENCE UTILITIES: HOW THE EU DIRECTIVE IS IMPLEMENTED AND HOW IT WORKS IN
Energy Efficiency and Policies in Tertiary Sector (Estonia) INGE ROOS, PhD Tallinn University of Technology Department of Energy Technology
 INGE ROOS, PhD Tallinn University of Technology Department of Energy Technology") Energy Efficiency and Policies in Tertiary Sector (Estonia) INGE ROOS, PhD Tallinn University of Technology Department of Energy Technology Final energy consumption by economic activity in Estonia 2000:
Energy Efficiency and Policies in Tertiary Sector (Estonia) INGE ROOS, PhD Tallinn University of Technology Department of Energy Technology Final energy consumption by economic activity in Estonia 2000:
EUROPEAN POLICIES TO PROMOTE ENERGY CROPS
 EUROPEAN POLICIES TO PROMOTE ENERGY CROPS Hilkka Summa European Commission DG Agriculture and Rural Development Outline 1) EU policy for renewable energy 2) Energy crops production and land use 3) The
to ensure that the public is properly informed about the state of the environment.
 Contribution ID: 3d857566-b12a-41a3-b91d-7d9a03167ba4 Date: 20/10/2017 16:24:00 Public consultation to support the evaluation of the European Environment Agency (EEA) and its European Environment Information
Energy policy choices of Poland. Marek Wąsiński The Polish Institute of International Affairs Paris, 27 September 2016
 Energy policy choices of Poland Marek Wąsiński The Polish Institute of International Affairs Paris, 27 September 2016 Main Principles of Polish Energy Policy Energy independence Stable and price-efficient
Energy security indices
 Energy security indices in Europe Economic Challenges for Energy Workshop Beatriz Muñoz Delgado UNED 1 Contents 1. Energy security: Conceptual review 2. Energy security quantification 3. REACCESS project
ANNEXES. to the. Proposal for a REGULATION OF THE EUROPEAN PARLIAMENT AND OF THE COUNCIL
 EUROPEAN COMMISSION Brussels, 20.7.2016 COM(2016) 479 final ANNEXES 1 to 6 ANNEXES to the Proposal for a REGULATION OF THE EUROPEAN PARLIAMENT AND OF THE COUNCIL on the inclusion of greenhouse gas emissions
The new Energy Policy. Jean-Arnold Vinois Head of Unit Energy Policy and Security of Supply Directorate General for Energy and Transport
 The new Energy Policy Jean-Arnold Vinois Head of Unit Energy Policy and Security of Supply Directorate General for Energy and Transport 1 The 3 challenges Sustainable Development Competitiveness FULLY
How effective will the EU s largest post-2020 climate tool be?
 Understanding the Climate Action Regulation How effective will the EU s largest post-2020 climate tool be? Carbon Market Watch Policy Brief, April 2018 Introduction The Climate Action Regulation (CAR),
Munkaanyag
 TECHNICAL SPECIFICATION SPÉCIFICATION TECHNIQUE TECHNISCHE SPEZIFIKATION CEN/TS 16555-2 December 2014 ICS 03.100.50; 03.100.40 English Version Innovation management - Part 2: Strategic intelligence management
Integrated assessment of air pollution and greenhouse gases mitigation in Europe
 See discussions, stats, and author profiles for this publication at: https://www.researchgate.net/publication/230709458 Integrated assessment of air pollution and greenhouse gases mitigation in Europe
The European Approach to Decrease Energy Consumption in Buildings Towards ZEB (Zero Energy Buildings)
") The European Approach to Decrease Energy Consumption in Buildings Towards ZEB (Zero Energy Buildings) Professor Bjarne W. Olesen, Ph.d., Dr.h.c., R. Centre for Indoor Environment and Energy Technical University
The European Approach to Decrease Energy Consumption in Buildings Towards ZEB (Zero Energy Buildings) Professor Bjarne W. Olesen, Ph.d., Dr.h.c., R. Centre for Indoor Environment and Energy Technical University
PRICE SETTING IN THE ELECTRICITY MARKETS WITHIN THE EU SINGLE MARKET
 PRICE SETTING IN THE ELECTRICITY MARKETS WITHIN THE EU SINGLE MARKET A report to the Committee on Industry, Research and Energy of the European Parliament February, 2006 Outline Characteristics of the
The European Commission s science and knowledge service. Scene-setter on jobs and growth in EU agri-food sector. Joint Research Centre
 The European Commission s science and knowledge service Joint Research Centre Scene-setter on jobs and growth in EU agri-food sector Emanuele Ferrari Alfredo J. Mainar Causapé With contributions from T.
The Fourth Community Innovation Survey (CIS IV)
") The Fourth Community Innovation Survey (CIS IV) THE HARMONISED SURVEY QUESTIONNAIRE The Fourth Community Innovation Survey (Final Version: October 20 2004) This survey collects information about product
The Fourth Community Innovation Survey (CIS IV) THE HARMONISED SURVEY QUESTIONNAIRE The Fourth Community Innovation Survey (Final Version: October 20 2004) This survey collects information about product
Energy efficiency trends in EU industry
 Energy efficiency trends in EU industry Odyssee-Mure webinar series on Energy Efficiency organised by Leonardo ENERGY Bruno Lapillonne, Karine Pollier, Laura Sudries, Enerdata 16 November 2016 The webinar
The Role of Aviation in International Relations and Regional Cooperation
 REGIONAL SEMINAR SATISFYING INCREASED DEMAND FOR CAPACITY WHILE MAINTAINING SAFETY SPECIAL CHALLENGES FOR E. MEDITERRANEAN AND M.EAST REGIONS CLEOPATRA HOTEL NICOSIA - CYPRUS - 13 APRIL 2018 The Role of
State of play of energy efficiency investment and financing scheme Czech Republic
 State of play of energy efficiency investment and financing scheme Czech Republic Vladimír Sochor Director of Department on Energy Efficiency and Savings Ministry of Industry and Trade Financing Energy
High-Level Public Administration Conference For a Business-Friendly Public Administration Brussels, 29 October 2013
 European Institute of Public Administration - Institut européen d administration publique High-Level Public Administration Conference For a Business-Friendly Public Administration Brussels, 29 October
Sectoral Profile - Industry
 Sectoral Profile - Industry Energy consumption Energy consumption trends in EU There is a regular decrease in energy consumption since 2003, although there was growth in industrial activity from 2003 to
Indicator Fact Sheet (WQ1) Water exploitation index
 Water exploitation index") Indicator Fact Sheet (WQ1) Water exploitation index Authors: Concha Lallana and Conchita Marcuello (CEDEX) EEA project manager: Niels Thyssen Indicator code / ID WQ1 Analysis made on (Assessment date)
Indicator Fact Sheet (WQ1) Water exploitation index Authors: Concha Lallana and Conchita Marcuello (CEDEX) EEA project manager: Niels Thyssen Indicator code / ID WQ1 Analysis made on (Assessment date)