WFP in Bangladesh 2011 in Review
|
|
|
- Donald Hill
- 6 years ago
- Views:
Transcription

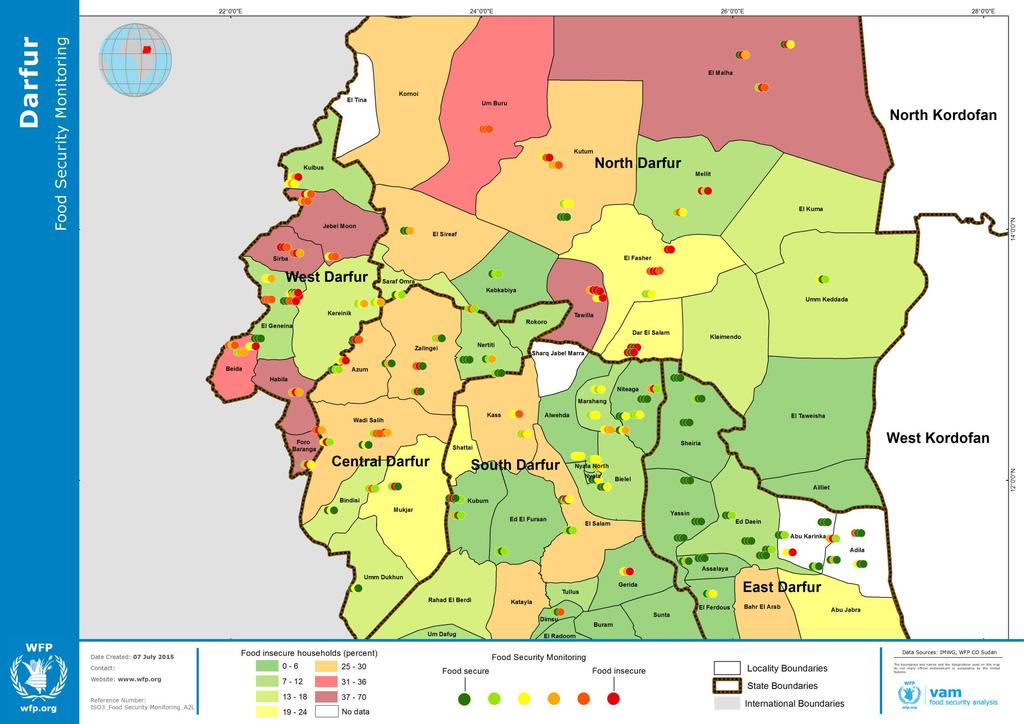
1 Fighting Fighting Hunger Hunger Worldwide Worldwide WFP in Bangladesh 2011 in Review West Darfur, Sudan Food Security Monitoring, ruary
2 FEBRUARY Executive Summary The overall food security situation deteriorated for households in surveyed IDP camps between ember and ruary. Surveyed households in resident communities experienced a similar deterioration, while the sampled households in Mixed communities improved. A Description of the Sample Data collection was carried out in collaboration with the West Darfur State Ministry of Agriculture (SMoA). The data Thirty-nine percent of surveyed households in IDP collection of the ruary round of the communities were food insecure, compared to 27 percent of food security monitoring was delayed due households in Residents and Mixed communities. to operational challenges (it took place in March and April ). This time of the Household food consumption improved moderately among year was the beginning of the lean season. surveyed households in IDP communities and Mixed A total of 618 households from 25 communities from ember to ruary. locations in West Darfur were Surveyed households in Resident communities experienced interviewed. a moderate deterioration over the same period. Approximately 60 percent of households in Resident and Mixed communities exhibited acceptable food consumption, while the corresponding percentage was slightly lower for IDPs (56 percent). The cost of the local food basket (LFB) was considerably lower in ruary (SDG 4.94/person/day) compared to ember (SDG 6.51/person/day). Despite the recent price decrease, the average sorghum prices in Geneina market were slightly higher than the same period last year, and more than 75 percent higher than the five-year average. Sorghum prices had decreased steadily since their peak in July. The decrease of the cost of the LFB did not result in improving purchasing power. In fact, among sampled households in IDP and Resident communities, purchasing power had deteriorated steadily from ember to ruary. Mixed communities also saw their purchasing power deteriorate over this period, but the decline stabilized and a minor improvement was seen from ember to ruary. Purchasing power was similar for the three community types, with approximately 80 percent of households being unable to afford the local food basket. Crop production, wage labour and small business were the main livelihoods among the surveyed households. No major changes was seen in the livelihood patterns of the population between ember and ruary, except that among IDP communities the proportion of households engaged in small business decreased and the proportion of households engaged in wage labour increased. The sex of the head of the household continued to be an important predictor of food security status: 50 percent of the male headed households were food secure compared to only 34 percent among female headed households. Page 2
3 FEBRUARY Livelihoods Crop production continued to be the predominant livelihood in Resident and Mixed communities, constituting the most important livelihood for 46 and 32 percent of households, respectively. Crop production was still only of minor importance to IDP communities despite the prolonged period of displacement for most of this population. Not having access to farming lands was the leading factor behind IDPs being less likely to engage in crop production. Rather, IDPs tended to rely on wage labour and small business to a higher degree than Residents and Mixed communities. Livelihoods 10 8% 17% 11% 8% 4% 7% 8% 5% 1 7% 3% 4% 9% 1 12% 6% 7% 8% 8% 8% 5% 4% 7% 7% 15% 7% 1 19% 15% 18% 14% 19% 15% 18% 14% 21% 13% 4 22% 22% 18% 6% 15% 15% 22% 19% 5% 19% 53% 6% 22% 31% 18% 37% 42% 51% 32% 43% 46% 34% 24% 27% 32% 17% 9% 7% 4% 8% Other Transfers Salaried work Business Wage labour Livestock Crops Markets and Prices The average sorghum prices in Geneina market were slightly higher than the same period last year and more than 75 percent above the five-year average. Following a normal seasonal trend, the sorghum prices decreased from SDG 8 (per kora, or 3.5 kg) in ember to SDG 7.2 in ruary, mainly because of increased supply in the market as a result of the good harvest. The decreasing trend in prices also extended to other foods as discussed in the next chapter. Page 3
4 SDG/3 KG FEBRUARY Sorghum price in Geneina (3 week moving average) Jan Mar Apr Jun Jul Aug Sep Oct Dec Purchasing Power 5 year average year_ year The price of a local food basket was used as a benchmark against which to compare household income, for determining the level of purchasing power. The price of the local food basket (LFB) in ruary SDG 4.94 (per person/day) was considerably lower than in ember (SDG 6.51). The decline in the price of the LFB may have been caused by a decrease in demand, due to a decrease in the level of income. The decrease in the cost of the LFB did not result in a strengthening of purchasing power, as incomes decreased. As indicated in the chart below, more than three quarters of households, across the community types, cannot afford the cost of one LFB. Purchasing power was found to be similar across the three community types. The Local Food Basket (LFB) The LFB consisted of the following food items: cereals (sorghum), milk, dry vegetables, cooking oil, goat meat, cow meat, onions and sugar. The amount of each food item was computed so as to minimize the cost of the basket, while meeting the minimum requirements of 2,100 kilocalories per person per day. Households were classified as having poor purchasing power (households that could not afford the cost of one LFB), borderline purchasing power (households that could afford between one and two baskets) and acceptable purchasing power (households that could afford more than two baskets). Page 4
5 FEBRUARY Purchasing power 10 7% 27% 19% 8% 3% 16% 24% 18% 14% 43% 46% 8 72% 72% 81% 85% 41% 48% 43% 13% 37% 6% 17% % 79% > 2 LFBs 1-2LFBs < 1 LFB Among IDP and Resident communities, households headed by females had moderately better purchasing power compared to households headed by men (the difference in the proportion of households that are below 1 LFB was 7 and 13 percentage points, respectively). In Mixed communities, 75 percent of male headed households was below the 1 LFB line, compared to 89 percent among female headed households. Household Expenditure The largest components of household total monthly food expenditure were meat (15 percent of total monthly household expenditures), dry vegetables (14 percent), sugar (13 percent), oil (12 percent) and cereals (9 percent). Spending three quarters of the total expenditure on food left households with less expenditure on non-food items which reduced their economic access to health care (from 10 percent of total expenditure in ember to 8 percent in ruary ) and education (from 5 to 2 percent). Breakdown of household expenditures House rent, 2% Transportation/comm unication, 1% Milling, 4% Construction, 1% Debts, 2% Social events, 2% Firewood/fuel, 2% Clothing, 2% Education, 2% Health care, 5% Agricultural inputs, 1% Food, 74% Cereals, 9% Oil, 12% Meat, 15% Pulses, 2% Sugar, 13% Dairy, 3% Dry vegetables, 14% Cooked food, 1% Other food items, 4% Page 5
6 FEBRUARY The expenditure on food as a percentage of total monthly expenditure was used as a proxy indicator of household economic stress: The higher a household s the share of food expenditure, the greater the likelihood of increased vulnerability to price and income shocks. A commonly used threshold for the share of food expenditure (above 65 percent) were used to identify households more exposed to economic vulnerability. The proportion of vulnerable IDP and Resident households increased substantially, to the point where 92 percent of IDP household spend more than 65 percent of their total expenditure on food. Surveyed households in Resident and Mixed communities exhibited a moderately lower level of stress, compared to IDPs, as a result of better access to more diversified income sources. Share of monthly expenditure for food 10 78% 92% 56% 74% 89% 72% More than 65% of expenditure 21% 15% 16% 3 26% 3 Household Food Consumption Household food consumption improved moderately among surveyed households in IDP communities and Mixed communities from The Food Consumption Score (FCS) ember to ruary. The Food consumption data was collected and analyzed using standard WFP methodology: the variety and frequency of proportion of households with acceptable food different foods consumed over a 7-day recall period was consumption increased from 48 to 65 percent recorded to calculate a weighted food consumption score among IDPs during this period, and from 53 to (FCS). Weights were based on the nutritional density of the 62 percent among Mixed communities. The improvement could be attributed to the decreased cost of food indicated in the foods. Using standard threshold, households were classified as having either poor, borderline or acceptable food consumption. discussion of the purchasing power, above. Surveyed households in Resident communities experienced a moderate deterioration over the same period. As in the previous round of monitoring, surveyed IDPs had worse food consumption than Residents and Mixed communities: Approximately 60 percent of households in Resident and Mixed communities were classified as having acceptable food consumption, while the corresponding percentage was slightly lower for IDPs (56 percent). Page 6
7 Proportion of households FEBRUARY Food consumption 10 68% 55% 48% 56% 68% 45% 68% 61% 63% 38% 53% 62% Acceptable 3 42% 43% 33% 52% 29% 38% 36% 57% 44% 37% Borderline Poor 2% 3% 2% 1% 3% 3% 2% 1% 5% 3% 1% The gender gap was found to be considerable, as households headed by men were more likely to have acceptable food consumption. The difference in the prevalence of acceptable food consumption between male and female headed households was 10, 18 and 23 percentage points for households in IDP, Resident and Mixed communities, respectively. Perceived Food Access Problems Households were asked if in the last seven days prior to the interview they experienced a situation where they did not have enough food (or money to buy food). If they experienced such situations, they were asked what strategies they employed to cope with their situation. The percentage of households who reported experiencing food access problems increased for households in the Resident category from 14 to 22 percent but remained largely unchanged for IDPs and Mixed communities compared to ember. Surprisingly, IDPs were the least likely to report food access problems, possibly as a result of the prolonged displacement normalizing a relatively food insecure situation. 10 Coping strategy 3% 3% 7% 4% 1% 4% 1% 3% 3% 14% 7% 8% 6% 5% 5% 3% 4% 8% 7% 4% 13% 1% 6% 6% 2% 6% 6% 12% 2 11% 16% 12% 11% 2 71% 63% 88% 88% 88% 85% 86% 78% 86% 73% 77% High coping Medium coping Low coping No food access problem Page 7
8 FEBRUARY Food Security The overall food security situation deteriorated for households in IDP camps from ember to ruary, mainly characterized by the expansion of the borderline category at the expense of food secure category; the proportion households classified as food secure shrank by 11 percentage points. More than one third of IDPs were considered food insecure. Food security deteriorated also for the Resident communities to the point that 27 percent of households were found to be food insecure. After an improvement in food security since ember, Mixed communities were the most food security community type, with 27 percent of households being food secure. Food security 10 59% 52% 3 28% 38% 12% 1 29% 42% 4 39% 19% 57% 38% 35% 34% 19% 52% 48% 49% 55% 33% 42% 5% 17% 17% 27% 15% 24% 34% 18% 27% 41% 46% 4 27% Food Secure Borderline Food Insecure Gender Analysis The sex of the head of the household continued to be an important predictor of food security status: male headed households tended to be more food secure than female headed households, as 50 percent of the male headed households were food secure compared to 34 percent of the female headed households. The difference between the two groups was especially pronounced in Resident and Mixed communities where the spread was 12 and 24 percentage points, respectively. Page 8
9 FEBRUARY Food security, by gender of households heads 10 18% 21% 2 14% 44% 35% 56% 34% 46% 1 46% 38% 44% 36% 44% 24% 2 Male Female Male Female Male Female IDPs Resident Mixed Food insecure Borderline Food secure Additionally, the higher the educational level of the head of the household, the more food secure the household tended to be. The prevalence of food security was 37 among households whose heads were illiterate, compared to 43 percent for those that had completed primary education, and 57 percent among those that had completed secondary education. Food security was also linked to household assets ownership: It was found that 53 percent of households who owned mobile phones were food secure compared to only 27 percent of those who did not own one. Households with few (1-3) members were found to be more food secure than larger households (4 and above). Child Nutrition The mid-upper arm circumference (MUAC) was measured on 694 children aged 6 59 months and classified as very low (below 115 mm, a proxy indicator for severe acute malnutrition), moderately low (between 115 and 125mm, a proxy indicator for moderate acute malnutrition) and normal (above 125 mm). Children in IDP households had better MUAC measurements compared to the previous two FSMS rounds and to other community groups: the prevalence of normal MUAC had increased from ember to in ruary, from 85 to 93 percent. The trend was the reverse for Mixed and Resident communities. No statistical relationship was found between the results of MUAC measurement and household food security, nor with household food consumption score. The sample size for Residents was too small to be reported on for ruary. Page 9
10 Proportion of children (6-59 months) FEBRUARY 10 Child mid-upper arm circumference (6-59 months) 10 92% 85% 93% 96% 89% 92% 87% 93% 96% 89% 8% 5% 3% 7% 1% 6% 7% 9% 4% 3% 1% 7% 4% 7% 1% 3% 8% 4% IDPs Mixed Resident > 125 mm > mm <= 115 mm Page 10
11
Highlights FOOD SECURITY MONITORING SYSTEM RED SEA STATE MAY 2015
 Fighting Fighting Hunger Hunger Worldwide Red Sea State, Sudan Food Security Monitoring, May 2015 Highlights Data collection was carried during May 2015 which represented the beginning of the summer harvest
WFP in Bangladesh 2011 in Review
 Fighting Fighting Hunger Hunger Worldwide Worldwide WFP in Bangladesh 2011 in Review North Darfur, Sudan Food Security Monitoring, ruary FEBRUARY Executive Summary Fighting between government forces and
FOOD SECURITY MONITORING SYSTEM KASSALA STATE DECEMBER 2015
 Fighting Fighting Hunger Hunger Worldwide Worldwide DECEMBER Kassala, Sudan Food Security Monitoring, December DECEMBER Executive Summary The food security situation was found to have deteriorated compared
Fighting Hunger Worldwide
 Fighting Hunger Worldwide South Kordofan, Sudan Food Security Monitoring, December 2015 Executive Summary The food security situation deteriorated among sampled households from May 2014 to November 2015.
SUDAN: Blue Nile State
 Fighting Hunger Worldwide BULLETIN December 2014 SUDAN: Blue Nile State Food Security Monitoring WFP established the Blue Nile Food Security Monitoring System (FSMS) in March 2014, aiming to better understand
On average, households spend 62 percent of their income on food, which is a slight increase compared to November 2010 (57 percent).
.") WFP Food Security Monitoring System (FSMS) Round 9 (February 2011) North Darfur State Main Findings The proportion of food secure households in the IDP category has increased compared to February 2010.
WFP Food Security Monitoring System (FSMS) Round 9 (February 2011) North Darfur State Main Findings The proportion of food secure households in the IDP category has increased compared to February 2010.
Main Findings. WFP Food Security Monitoring System (FSMS) Kassala State. Round 3 (February 2011)
 Kassala State. Round 3 (February 2011)") WFP Security Monitoring System (FSMS) Round 3 (February 011) Kassala State Main Findings All of the 16 planned sentinel sites were covered in February 011. Data collection was carried out in mid February
WFP Security Monitoring System (FSMS) Round 3 (February 011) Kassala State Main Findings All of the 16 planned sentinel sites were covered in February 011. Data collection was carried out in mid February
DARFUR FOOD SECURITY MONITORING
 DARFUR FOOD SECURITY MONITORING WEST DARFUR ROUND 6 May 2010 Highlights The sixth round was carried out at the beginning of the lean season when household food stocks are thought to be depleted and market
FOOD SECURITY MONITORING, TAJIKISTAN
 Fighting Hunger Worldwide BULLETIN July 2017 ISSUE 19 Tajikistan Food Security Monitoring FOOD SECURITY MONITORING, TAJIKISTAN July 2017 - ISSUE 19 Fighting Hunger Worldwide BULLETIN July 2017 ISSUE 19
Eastern and Southern Sudan
 Eastern and Southern Sudan Food Security Monitoring, November % of surveyed IDPS and refugees were food insecure in East- and Southern Sudan % of South Sudanese in White Nile, South Kordofan, and Blue
South Sudan Food Security Monitoring A collaborative activity of FSTS, SSRRC, MAF, MoH, FAO, WFP, UNICEF and UNHCR. Round 10, June 2013
 South Sudan Food Security Monitoring Highlights The food security situation is currently showing improvement compared to the same period in 2012. Current findings show that about 8 percent and 34 percent
Mobile Vulnerability Analysis & Mapping (mvam) Karamoja Region Early Warning Bulletin January Outlook for February to March 2018
 Karamoja Region Early Warning Bulletin January Outlook for February to March 2018") Fighting Hunger Worldwide WFP Uganda mvam January 2018 ISSUE #11 Mobile Vulnerability Analysis & Mapping (mvam) Karamoja Region Early Warning Bulletin January 2018 Key Highlights The proportion of households
Fighting Hunger Worldwide WFP Uganda mvam January 2018 ISSUE #11 Mobile Vulnerability Analysis & Mapping (mvam) Karamoja Region Early Warning Bulletin January 2018 Key Highlights The proportion of households
Main Findings. Key Definitions RWANDA FOOD AND NUTRITION SECURITY MONITORING SYSTEM (FNSMS)
") RWANDA M I N A G R I I n s i d e t h i s i s s u e : Main Findings 1 Key Definitions 1 Food security situation aligned to seasonal patterns Chronic malnutrition remains high among children under 5 Poor
RWANDA M I N A G R I I n s i d e t h i s i s s u e : Main Findings 1 Key Definitions 1 Food security situation aligned to seasonal patterns Chronic malnutrition remains high among children under 5 Poor
Kenya Food Security and Outcome monitoring (FSOM) Consolidated report SEPTEMBER 2014
 Consolidated report SEPTEMBER 2014") Methodology 115 sentinel sites were randomly selected, covering all 9 major livelihood zones and the two refugees camps. 10 locations per livelihood are visited three times a year (May, September and December)
Methodology 115 sentinel sites were randomly selected, covering all 9 major livelihood zones and the two refugees camps. 10 locations per livelihood are visited three times a year (May, September and December)
Early warning and Acute food insecurity analysis: introduction to CH process
 Famine Early Warning Systems Network Early warning and Acute food insecurity analysis: introduction to CH process Nigeria CH Foundational Training Overview What is early warning? Some concepts Guiding
NEPAL. mvam Food Security Monitoring Survey. Mountain Districts of Provinces 6 (Karnali) and 7 of Nepal. Household characteristics
 and 7 of Nepal. Household characteristics") NEPAL mvam Bulletin #3: April 2018 mvam Food Security Monitoring Survey Mountain Districts of Provinces 6 (Karnali) and 7 of The eight mountain districts of Provinces 6 (Karnali) and 7 are some of the
NEPAL mvam Bulletin #3: April 2018 mvam Food Security Monitoring Survey Mountain Districts of Provinces 6 (Karnali) and 7 of The eight mountain districts of Provinces 6 (Karnali) and 7 are some of the
Mobile Vulnerability Analysis & Mapping (mvam) Karamoja Region Early Warning Bulletin November Outlook for December 2017 and January 2018
 Karamoja Region Early Warning Bulletin November Outlook for December 2017 and January 2018") Fighting Hunger Worldwide mvam November 2017 ISSUE #10 WFP Uganda Mobile Vulnerability Analysis & Mapping (mvam) Karamoja Region Early Warning Bulletin November 2017 Key Highlights Following the September-to-October
Fighting Hunger Worldwide mvam November 2017 ISSUE #10 WFP Uganda Mobile Vulnerability Analysis & Mapping (mvam) Karamoja Region Early Warning Bulletin November 2017 Key Highlights Following the September-to-October
OFFICE OF THE PRESIDENT SPECIAL PROGRAMMES ARID LANDS RESOURCE MANAGEMENT PROJECT II
 OFFICE OF THE PRESIDENT SPECIAL PROGRAMMES ARID LANDS RESOURCE MANAGEMENT PROJECT II DROUGHT MONTHLY BULLETIN FOR MARCH 27 WEST POKOT DISTRICT WARNING STAGES Livelihood Zone Warning stage Trend Agro pastoral
Severe Weather and Other Shocks Are we Doing Enough to Mitigate Risks for Nutrition? Mike Manske, USAID Office of Food for Peace,
 Severe Weather and Other Shocks Are we Doing Enough to Mitigate Risks for Nutrition? Mike Manske, USAID Office of Food for Peace, mmanske@usaid.gov Definitions Disaster risk is the potential loss expressed
National Drought Management Authority MERU COUNTY DROUGHT EARLY WARNING BULLETIN FOR JULY 2017
 National Drought Management Authority MERU COUNTY DROUGHT EARLY WARNING BULLETIN FOR JULY 2017 JULY EW PHASE Drought Situation & EW Phase Classification Biophysical Indicators July remained generally cold
INTEGRATED FOOD SECURITY PHASE CLASSIFICATION
 INTEGRATED FOOD SECURITY PHASE CLASSIFICATION THE REPUBLIC OF SOUTH SUDAN September 2015 Food Security and Nutrition Analysis - KEY MESSAGES An estimated 3.9 million people (3.1 million in Crisis and 800,000
Kenya Food Security and Outcome monitoring (FSOM) Consolidated report December 2015
 Consolidated report December 2015") Methodology 115 sentinel sites were randomly selected, covering all 9 major livelihood zones and the two refugees camps. 10 locations per livelihood are visited three times a year (May, September and December)
Methodology 115 sentinel sites were randomly selected, covering all 9 major livelihood zones and the two refugees camps. 10 locations per livelihood are visited three times a year (May, September and December)
Kenya Food Security and Outcome monitoring (FSOM) Consolidated report December 2013
 Consolidated report December 2013") Methodology 113 sentinel sites were randomly selected, covering all 9 major livelihood zones, 2 refugees camps and 4 HIV/ AIDS project areas. 10 locations per livelihood are visited three times a year
Methodology 113 sentinel sites were randomly selected, covering all 9 major livelihood zones, 2 refugees camps and 4 HIV/ AIDS project areas. 10 locations per livelihood are visited three times a year
Mobile Vulnerability Analysis & Mapping (mvam) Karamoja Region Early Warning Bulletin August 2016
 Karamoja Region Early Warning Bulletin August 2016") Fighting Hunger Worldwide mvam August 2016 ISSUE 2 WFP Uganda Mobile Vulnerability Analysis & Mapping (mvam) Karamoja Region Early Warning Bulletin August 2016 Key Highlights Overview There is a continuous
Fighting Hunger Worldwide mvam August 2016 ISSUE 2 WFP Uganda Mobile Vulnerability Analysis & Mapping (mvam) Karamoja Region Early Warning Bulletin August 2016 Key Highlights Overview There is a continuous
Mobile Vulnerability Analysis & Mapping (mvam) Karamoja Region Early Warning Bulletin September Overview Key Highlights
 Karamoja Region Early Warning Bulletin September Overview Key Highlights") Fighting Hunger Worldwide mvam September 2016 ISSUE #3 WFP Uganda Mobile Vulnerability Analysis & Mapping (mvam) Karamoja Region Early Warning Bulletin September 2016 Overview Key Highlights WFP Uganda
Fighting Hunger Worldwide mvam September 2016 ISSUE #3 WFP Uganda Mobile Vulnerability Analysis & Mapping (mvam) Karamoja Region Early Warning Bulletin September 2016 Overview Key Highlights WFP Uganda
MYANMAR. Planting Period Highlights FOOD SECURITY MONITORING BULLETIN FSIN INFORMATION MAY 2012
 FOOD SECURITY MONITORING BULLETIN FSIN FOOD SECURITY INFORMATION N E T W O R K MAY 2012 MYANMAR Planting Period Highlights Stocks from the 2011 monsoon and the 2012 winter crop and summer paddy harvests
Syrian Arab Republic Crop and Food Security Assessment Mission
 Wo r k i n g t o g e t h e r t o s a v e l i v e s a n d l i v e l i h o o d s Syrian Arab Republic Crop and Food Security Assessment Mission May 2017 Methodology Meetings in Damascus Ministries Agriculture
Kenya Food Security and Outcome monitoring Consolidated report MAY 2013
 Highlight Consolidated report MAY 2013 Methodology 113 sentinel sites were randomly selected, covering all 9 major livelihood zones, 2 refugees camps and 4 HIV/ AIDS project areas. 10 locations per livelihood
WFP Uganda. Mobile Vulnerability Analysis & Mapping (mvam) Karamoja Region Early Warning Bulletin May Overview
 Karamoja Region Early Warning Bulletin May Overview") Fighting Hunger Worldwide mvam May 2017 ISSUE #7 WFP Uganda Mobile Vulnerability Analysis & Mapping (mvam) Karamoja Region Early Warning Bulletin May 2017 Overview Key Highlights The proportion of households
Fighting Hunger Worldwide mvam May 2017 ISSUE #7 WFP Uganda Mobile Vulnerability Analysis & Mapping (mvam) Karamoja Region Early Warning Bulletin May 2017 Overview Key Highlights The proportion of households
Abyei Food Security and Nutrition Assessment Report January 2015
 Abyei Food Security and Nutrition Assessment Report A collaborative activity of RRC, Agriculture Department, MoH, FAO, WFP, UNICEF, UNHCR, Mercy Corps, ACAD, Goal. Highlights Overall, 3 of households in
South Sudan MONTHLY MARKET PRICE MONITORING BULLETIN
 OCTOBER 208 HIGHLIGHTS Currency Exchange Rate: In September 208, the average exchange rate in the parallel market in Juba was SSP 25, compared to the highest ever of SSP 30 in June 208. The rate in the
OFFICE OF THE PRIME MINISTER MINISTRY OF STATE FOR THE DEVELOPMENT OF NORTHERN KENYA AND OTHER ARID LANDS ARID LANDS RESOURCE MANAGEMENT PROJECT II
 OFFICE OF THE PRIME MINISTER MINISTRY OF STATE FOR THE DEVELOPMENT OF NORTHERN KENYA AND OTHER ARID LANDS ARID LANDS RESOURCE MANAGEMENT PROJECT II DROUGHT MONITORING BULLETIN, APRIL 2010 KILIFI/KALOLENI/GANZE
Kenya Food Security and Outcome monitoring (FSOM) Consolidated report
 Consolidated report") Methodology 115 sentinel sites were randomly selected, covering all 8 major livelihood zones and 2 refugees camps. 10 locations per livelihood are visited three times a year (May, September and December).
Methodology 115 sentinel sites were randomly selected, covering all 8 major livelihood zones and 2 refugees camps. 10 locations per livelihood are visited three times a year (May, September and December).
National Drought Management Authority
 National Drought Management Authority KAJIADO COUNTY DROUGHT MONITORING AND EARLY WARNING SEPTEMBER 2018 SEPTEMBER EW PHASE Drought Situation & EW Phase Classification Biophysical Indicators Vegetation
National Drought Management Authority MANDERA COUNTY
 National Drought Management Authority MANDERA COUNTY DROUGHT EARLY WARNING BULLETIN FOR AUGUST 2015 AUGUST EW PHASE Early Warning Phase Classification LIVELIHOOD ZONE EW PHASE TRENDS Agropastoral ALERT
Harmonized Food Security and Nutrition Assessments in Emergency Situations A Case of South Sudan
 Harmonized Food Security and Nutrition Assessments in Emergency Situations A Case of South Sudan Presentation by KIROSS TEFERA ABEBE UNICEF South Sudan Contributors Ismail Kassim, Nicholas Kerandi, James
National Drought Management Authority (Nyeri) COUNTY DROUGHT EARLY WARNING BULLETIN FOR DECEMBER 2018
 COUNTY DROUGHT EARLY WARNING BULLETIN FOR DECEMBER 2018") National Drought Management Authority (Nyeri) COUNTY DROUGHT EARLY WARNING BULLETIN FOR DECEMBER 2018 DECEMBER 2018 EWS PHASE Drought Situation & EW Phase Classification Biophysical Indicators The month
National Drought Management Authority (Nyeri) COUNTY DROUGHT EARLY WARNING BULLETIN FOR DECEMBER 2018 DECEMBER 2018 EWS PHASE Drought Situation & EW Phase Classification Biophysical Indicators The month
SOUTH SUDAN MONTHLY MARKET PRICE MONITORING
 April 1 2017 HIGHLIGHTS In February 2017, overall inflation and food inflation rates in South Sudan stood at 425.9 percent and at 480.5 percent respectively. The costs of cereals and bread increased by
Agustinho da Costa Ximenes National Consultant for Food Security Ministry Of Agriculture and Fisheries Timor Leste
 Agustinho da Costa Ximenes National Consultant for Food Security Ministry Of Agriculture and Fisheries Timor Leste INTRODUCTION The country has an area of 14,609 square kilometers, It is divided in thirteen
Appendix C IPC Analysis Templates Part 1: Analysis of Current or Imminent Phase and Early Warning. Time Period of Analysis: Jan June 2010
 Appendix C IPC Analysis Templates Part 1: Analysis of Current or Imminent Phase and Early Warning Area of Analysis (Region, District, Livelihood Zone) Bari region, Pastoral Livelihood Zones: (Golis/Gagaab,
Food Security and Nutrition Monitoring Bulletin
 South Sudan Food Security and Nutrition Monitoring Bulletin Round 20 Photo: WFP/Lara Atanasijevic December 2017 Data collected in July-August 2017 This is an output from collaborative activity of WFP,
National Drought Management Authority NAROK COUNTY DROUGHT EARLY WARNING BULLETIN FOR DECEMBER 2017
 National Drought Management Authority NAROK COUNTY DROUGHT EARLY WARNING BULLETIN FOR DECEMBER 2017 DECEMBER EW PHASE Drought Situation & EW Phase Classification Biophysical Indicators Rainfall: Below
MALAWI mvam Bulletin #14: February 2017
 Maize prices fall as the harvest starts in the southern region - Key points: National negative coping levels remain stable since December 2016 Slight reduction in coping among worse-off households Poorer
Acute Food Insecurity Situation Overview
 (Sudan) Current - map Key Outcomes for the Worst affected Area Republic of Sudan Integrated Food Security Phase Classification (IPC) Acute Food Insecurity Situation Overview Food consumption: South Kordofan:
FSNMS Bulletin for Fourth Quarter 2009
 Ministry of Food and Agriculture (MoFA) World Food Programme Northern Ghana Food Security & Nutrition Monitoring System FSNMS Bulletin for Fourth Quarter 2009 1.0. REGIONAL HIGHLIGHTS 1.1. Northern Region
National Drought Management Authority MANDERA COUNTY DROUGHT EARLY WARNING BULLETIN FOR SEPTEMBER 2017
 National Drought Management Authority MANDERA COUNTY DROUGHT EARLY WARNING BULLETIN FOR SEPTEMBER 2017 SEPTEMBER EW PHASE Drought Situation & EW Phase Classification Biophysical Indicators One-day Rainfall
Trade and Market Bulletin
 Trade and Market Bulletin Central Darfur Darfur Development and Reconstruction Agency Headlines C ereal prices stabilised this quarter compared to the previous quarter (September-November 2013). However,
BUDGET REVISION NUMBER 1 TO SUDAN EMERGENCY OPERATION
 BUDGET REVISION NUMBER 1 TO SUDAN EMERGENCY OPERATION Sudan 200151 - Food Assistance to Vulnerable Populations Affected by Conflict and Natural Disasters Cost (United States dollars) Present budget Change
National Drought Management Authority LAMU COUNTY DROUGHT EARLY WARNING BULLETIN FOR JANUARY 2016
 National Drought Management Authority LAMU COUNTY DROUGHT EARLY WARNING BULLETIN FOR JANUARY 2016 January EW PHASE Early Warning Phase Classification Drought Situation & EW Phase Classification Biophysical
WFP MONTHLY MARKET UPDATE
 WFP MONTHLY MARKET UPDATE SUDAN, Highlights During the last three months the trend of sorghum, millet and sesame prices in Gadarif Auction Market 1 showed a remarkable increase, from December 217 to the
WAJIR COUNTY DROUGHT EARLY WARNING BULLETIN FOR AUGUST
 National Drought Management Authority WAJIR COUNTY DROUGHT EARLY WARNING BULLETIN FOR AUGUST 218 AUGUST EW PHASE 218 Drought Situation & EW Phase Classification Biophysical Indicators Rainfall Report The
Hiran Region. Post Gu August 18th Food Security and Nutrition Analysis Unit Somalia Information for Better Livelihoods
 Post Gu 2010 Food Security and Nutrition Analysis Unit Somalia Information for Better Livelihoods August 18th 2010 Hiran Region Swiss Agency for Development and Cooperation SDC EUROPEAN COMMISSION Gu 2010
NATIONAL DROUGHT MANAGEMENT AUTHORITY MANDERA COUNTY DROUGHT EARLY WARNING BULLETIN FOR MAY 2015
 NATIONAL DROUGHT MANAGEMENT AUTHORITY MANDERA COUNTY DROUGHT EARLY WARNING BULLETIN FOR MAY 2015 MAY EW PHASE Early Warning Phase Classification LIVELIHOOD ZONE EW PHASE TRENDS Agropastoral Normal Normal
Key Statistics: Monthly Update January 2014
 A briefing for members on the latest agricultural statistics and economic indicators from NFU Economics. In this issue Farm Business Income Pigs Cost of Production Milk Production Beef and Veal Production
An Analysis of the Food Security Situation in Selected Areas across Kokang
 An Analysis of the Food Security Situation in Selected Areas across Kokang Vulnerability Analysis & Mapping Unit (VAM) May 2010 ACKNOWLEDGEMENTS This report is the outcome of a collaborative process and
NIGERIA. Highlights. Borno and Yobe States Market Monitoring Report
 Fighting Hunger Worldwide IGERIA Borno and Yobe States Monitoring Report July 217-ISSUE 6 Highlights The continuing stability in the value of the aira against major foreign currencies over the past four
TOWARDS IMPROVED FOOD & NUTRITION SECURITY AMONG REFUGEE HOUSEHOLDS
 TOWARDS IMPROVED FOOD & NUTRITION SECURITY AMONG REFUGEE HOUSEHOLDS A Comparative analysis of the effectiveness of food assistance modalities in refugee settlements February 2016 WFP Uganda, Analysis Monitoring
ZIMBABWE mvam Bulletin #11: June 2017
 Humanitarian assistance is scaled back as food security improves Key points: Beneficiary households relying on food assistance were using negative coping strategies more frequently than non-beneficiary
K E Y H I G H L I G H T S & R E C O M M E N D A T I O N S
 RAPID APPRAISAL GUER Nyirol county (Bieh state), Jonglei April 05, 2018 K E Y H I G H L I G H T S & R E C O M M E N D A T I O N S Overall situation of food security, nutrition, WASH, and health was reported
National Drought Management Authority EMBU COUNTY
 National Drought Management Authority EMBU COUNTY EARLY WARNING BULLETIN FOR EMBU 215 AUGUST EW PHASE Early Warning Phase Classification Drought Situation & EW Phase Classification Biophysical Indicators
MALAWI mvam Bulletin #12: December 2016
 Food security improves as humanitarian assistance reaches 97 percent of vulnerable population Key points: Negative coping levels reduce across Malawi but remain high for households headed by women Maize
WAJIR COUNTY DROUGHT EARLY WARNING BULLETIN FOR JULY 2017
 National Drought Management Authority WAJIR COUNTY DROUGHT EARLY WARNING BULLETIN FOR JULY 2017 JULY EW PHASE 2017 Drought Situation & EW Phase Classification Biophysical Indicators Generally the county
ZIMBABWE mvam Bulletin #4: November 2016
 Food security stabilizes thanks to humanitarian assistance Key points: Household food security stabilized for the first time in three months, thanks to increased humanitarian support to food-insecure households
Food Security Cluster Post Deyr 2012/13 Results
 Information for Better Livelihoods Food Security Cluster Post Deyr 212/13 Results March 14th, 213 Technical Partner Donors EUROPEAN COMMISSION Swiss Agency for Development and Cooperation SDC CLIMATE FORECAST
The dangers of rapid assessment
 The dangers of rapid assessment By Steve Collins Dr. Steve Collins is a Nutrition Consultant working for Valid International. He undertook this assignment on the request of Save the Children UK and visited
Trade and Market Bulletin
 Trade and Market Bulletin West Darfur Darfur Development and Reconstruction Agency Headlines: D uring this quarter of December 2013 to February 2014, cereal prices have risen. For example, in Kereinik
Journal of Innovation & Development Strategy (JIDS)
") Reprint ISSN 1997-2571(Web Version) Journal of Innovation & Development Strategy (JIDS) (J. Innov. Dev. Strategy) Volume: 8 Issue: 2 August 2014 J. Innov. Dev. Strategy 8(2): 10-14 (August 2014) FOOD SECURITY
Reprint ISSN 1997-2571(Web Version) Journal of Innovation & Development Strategy (JIDS) (J. Innov. Dev. Strategy) Volume: 8 Issue: 2 August 2014 J. Innov. Dev. Strategy 8(2): 10-14 (August 2014) FOOD SECURITY
UGANDA. Highlights. Monthly Market Monitor. Fighting Hunger Worldwide. Markets Monitored & Analyzed by WFP Unit
 Fighting Hunger Worldwide BULLETIN August 2014 ISSUE 6 UGANDA Monthly Market Monitor The Uganda Market Price Update is produced by the Analysis, Monitoring and Evaluation (AME) Unit of the World Food Programme
UGANDA. Highlights. Monthly Market Monitor. Fighting Hunger Worldwide. Markets Monitored & Analyzed by WFP Unit
 Fighting Hunger Worldwide BULLETIN May 2014 ISSUE 3 UGANDA Monthly Market Monitor The Uganda Market price Update is produced by the Assessments, Monitoring and Evaluation (AME) Unit of the World Food Programme
YEMEN MONTHLY MARKET WATCH FEBRUARY 2014
 Highlights The results of the market monitoring for February 2014 show that food commodities are available in all markets and that retail prices have declined slightly compared with January. Moreover,
Impact of Conflicts on Role of Rural women s Household in Food Security (West Darfur Returnee s Area, Sudan)
") Quest Journals Journal of Research in Humanities and Social Science Volume 4 ~ Issue 11 (2016) pp: 89-93 ISSN(Online) : 2321-9467 www.questjournals.org Research Paper Impact of Conflicts on Role of Rural
Quest Journals Journal of Research in Humanities and Social Science Volume 4 ~ Issue 11 (2016) pp: 89-93 ISSN(Online) : 2321-9467 www.questjournals.org Research Paper Impact of Conflicts on Role of Rural
NORTHERN GHANA FOOD SECURITY
 NORTHERN GHANA FOOD SECURITY AND NUTRITION MONITORING SYSTEM MONTHLY BULLETIN April 2012 Regional Highlights Northern region Food security conditions in the region are increasingly constrained by decreasing
FOOD SECURITY STATUS FOR DROUGHT AFFECTED COUNTRIES Horn of Africa. 1 September 2017
 FOOD SECURITY STATUS FOR DROUGHT AFFECTED COUNTRIES Horn of Africa 1 tember 2017 Millions Food Security Trends South Sudan and Somalia 6.00 5.00 4.00 3.00 2.00 1.00 0.00 Food insecure population in South
YEMEN MONTHLY MARKET WATCH JUNE 2012
 Highlights In May 2012, the country general inflation was 11.24% and food inflation stood at 10.53%, based on 12 months moving average. Between January and June 2012, the average wholesale price of 50
National Drought Management Authority GARISSA COUNTY
 National Drought Management Authority GARISSA COUNTY DROUGHT EARLY WARNING BULLETIN FOR JANUARY 215 Drought early warning Flag- Phase Alarm Drought Situation & EW Phase Classification Biophysical Indicators
South Sudan Food Security Updates
 South Sudan Food Security Updates July 2012 Food Security and Livelihoods Cluster Overall Security Situation Security situation remained relatively calm in most parts of the country. However, displaced
Woking. q business confidence report
 Woking q1 business confidence report Woking q1 report headlines saw a new record in company registrations in Woking when compared to any previous. was a record quarter for company registrations in Woking
Trade and Market Bulletin
 Trade and Market Bulletin West Darfur Darfur Development and Reconstruction Agency Headlines: The Jebel Amir conflict impacted trade and markets in a number of ways: some trade routes from Saraf Omra closed,
Pakistan Food Security Bulletin Issue 6 (January June 2017) August, 2017
 August, 2017") Issue 6 (January June 2017) August, 2017 The Pakistan Food Security Bulletin is produced by the Vulnerability Analysis and Mapping (VAM) Unit of the World Food Programme as a contribution to periodic food
Issue 6 (January June 2017) August, 2017 The Pakistan Food Security Bulletin is produced by the Vulnerability Analysis and Mapping (VAM) Unit of the World Food Programme as a contribution to periodic food
Acute Food Insecurity Situation in Sindh
 Acute Food Insecurity Situation in Sindh Results of IPC Food Insecurity Analysis for Jamshoro, Sanghar, Umerkot and Tharparkar Districts of Sindh IPC Global Partners With the support of OBJECTIVES OF IPC
National Drought Management Authority MANDERA COUNTY DROUGHT EARLY WARNING BULLETIN FOR AUGUST 2016
 National Drought Management Authority MANDERA COUNTY DROUGHT EARLY WARNING BULLETIN FOR AUGUST 2016 Drought Situation & EW Phase Classification Biophysical Indicators No rains were received in the entire
FOOD SECURITY Chapter Seven
 NRVA 2011/12 MAIN REPORT FOOD SECURITY Chapter Seven 27 January 2014 FOR EXECUTIVE SUMMARY OF NRVA 2011/12 MAIN REPORT Final, 27 January 2014 Food security NRVA 2011-12 analysis indicates that around 30.1
SYRIA Food insecurity remains high as prices increase
 mvam SYRIA Food insecurity remains high as prices increase Fighting Hunger Worldwide KEY MESSAGES: In Rural Damascus, households in hard-to-reach and besieged areas were 3 times more likely to report poor
YEMEN MONTHLY MARKET WATCH October 2014
 Highlights The overall market monitoring information in October 2014 shows that food has been available in all markets except in some areas where localized conflicts intensified. Wholesale and retail food
Budget Increases to Protracted Relief and Recovery Operations Madagascar
 Executive Board Second Regular Session Rome, 14 18 November 2016 Distribution: General Date: 2 November 2016 Original: English Agenda Item 8 WFP/EB.2/2016/8-C/5 Projects for Executive Board Approval For
Acute food security outcomes are likely to improve with prospects of an average 2018/19 harvest
 Acute food security outcomes are likely to improve with prospects of an average 2018/19 harvest KEY MESSAGES Minimal (IPC Phase 1) outcomes are present in most northern areas, while humanitarian food assistance
Namibia Food & Nutrition Security Monitoring
 Namibia Food & Nutrition Security Monitoring Bulletin No: 2 NOVEMBER 214 Highlights Food Security Trends & Vulnerability Food Market - Omusati (Photo/WFP) FNSM Sentinel Site Maps Normal to above normal
2017 Somalia Post Gu Seasonal Food Security and Nutrition Assessment: Key Findings
 Information for Better Livelihoods 2017 Somalia Post Gu Seasonal Food Security and Nutrition Assessment: Key Findings 5 September 2017, Nairobi Technical Partners FSNAU Funding Agencies Highlights The
FEWS NET Scenario Development for Food Security Early Warning January 2018
 FEWS NET Guidance Document Series The Famine Early Warning Systems Network (FEWS NET) developed this series to provide guidance on scenario development the core methodology used by FEWS NET to make food
Interviewers Training on the mainstreaming of «households incomes» in the monitoring of urban vulnerability
 PROGRAMME D APPUI A LA SECURITE ALIMENTAIRE ET NUTRITIONNELLE EN AFRIQUE DE L OUEST (PASANAO) Interviewers Training on the mainstreaming of «households incomes» in the monitoring of urban vulnerability
Cadre Harmonisé for Identifying Risk Areas and Vulnerable Populations in Sixteen (16) States of Nigeria
 States of Nigeria") Nigeria Cadre Harmonisé for Identifying Risk Areas and Vulnerable Populations in Sixteen (16) States of Nigeria Results of Analysis of Current (October December 2016) and Projected (June August 2017) Situations
Nigeria Cadre Harmonisé for Identifying Risk Areas and Vulnerable Populations in Sixteen (16) States of Nigeria Results of Analysis of Current (October December 2016) and Projected (June August 2017) Situations
FOOD SECURITY AND LIVELIHOOD DIVERSIFICATION PROJECT. Duration: 36 Months, ( )
") FOOD SECURITY AND LIVELIHOOD DIVERSIFICATION PROJECT Duration: 36 Months, (2010-2013) Project Overview/Description Objective: Improved food security and nutritional status, in particular for most vulnerable
FOOD SECURITY AND LIVELIHOOD DIVERSIFICATION PROJECT Duration: 36 Months, (2010-2013) Project Overview/Description Objective: Improved food security and nutritional status, in particular for most vulnerable
CAMBODIA HIGHLIGHTS. 12.7% year on year. Overview This. 22.5% higher. than in May Thai A1 Super. respectively. The. Index. not seen. in 2011.
 CAMBODIA FOOD PRICE AND WAGE BULLETIN RBwtiþb½Rt témøgahar nigr)ak; kqñülenakm
Sentinel Surveillance Report Garissa & Mandera March 2009
 Sentinel Surveillance Report & Mandera March 2009 SUMMARY OF KEY FINDINGS All three sentinel sites in Greater Mandera District were above 2 GAM in March, according to both the LQAS decision rule and the
Project-Level Early Warning Interest Group Meeting Agenda: 2 June 2016
 Project-Level Early Warning Interest Group Meeting Agenda: 2 June 2016 Welcome and introductions (~ 5 mins) Presentation: Early Warning in Ebola Contexts: Approaches, Lessons, and Next Steps in West Africa
Main findings. Food Consumption: globally satisfactory except in the Lake Chad basin and in certain pockets of Niger, Mali and Senegal.
 Cadre Harmonisé analysis and identification of zones at risk and food insecure populations in the Sahel and in West Africa Regional analysis of acute food insecurity Current Situation (March-May 2017)
YEMEN MONTHLY MARKET WATCH MAY 2014
 Highlights The overall market monitoring information in May 2014 indicates that with the exception of areas directly affected by conflict, the supply of essential food commodities has been normal in most
National Drought Management Authority NAROK COUNTY DROUGHT EARLY WARNING BULLETIN FOR APRIL 2017
 National Drought Management Authority NAROK COUNTY DROUGHT EARLY WARNING BULLETIN FOR APRIL 2017 APRIL EW PHASE Drought Situation & EW Phase Classification Biophysical Indicators Rainfall: Most parts of
NEPAL Flood August 2017
 NEPAL Flood August 2017 Food security impact of the flood: VERSION 1 Date released: 21 August 2017 Nepal was hit by the worst rains in 15 years that started on 11 August 2017. It caused severe flooding
Gedo Region. Post Gu August Information for Better Livelihoods. Technical Partner. Donors EUROPEAN COMMISSION
 Post Gu 2012 Information for Better Livelihoods 22 August 2012 Gedo Region Technical Partner Donors EUROPEAN COMMISSION Swiss Agency for Development and CooperaDon SDC Gu 2012 Seasonal Assessment Coverage