Monsanto Learning Center at Gothenburg, NE 2013 Demonstration Reports
|
|
|
- Stuart Hamilton
- 6 years ago
- Views:
Transcription


1 Monsanto Learning Center at Gothenburg, NE 213 Demonstration Reports
2 MONSANTO the Follow us! Scan the codes below to visit our website, and follow us on Facebook and Twitter for information and resources all year. Website: Facebook: Page 2 / 213 Demo Report
 during the growing season.")
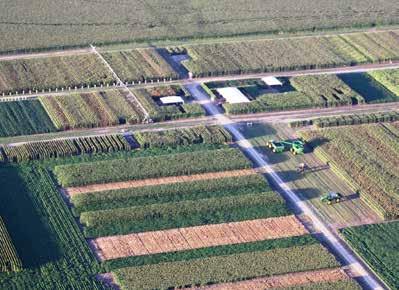
3 Welcome to the 213 Demonstration Reports from your Learning Center in Gothenburg, NE. Last season proved to be an improvement over 212 in terms of drought conditions with over twice the amount of rainfall (16 inches) during the growing season. Not everyone in the region shared that good fortune, but we hope to see continuing improvement in 214. Throughout the year we hosted over 4,5 guests from 24 countries who experienced our demonstrations. This was a year of discovery for us and provided great insight into corn water use-efficiency, the importance of timing soybean irrigation, and so much more. To access the information contained in the guide just use the QR code on the left with your mobile device or use this address: There, you will also discover information not contained in the guide due to space, but it is data that was too important to keep to ourselves. If you have any questions feel free to contact me at mark.reiman@monsanto.com. As always we welcome and look forward to your visit in 214. The Learning Center Team is gearing up for another successful season with demonstrations that will be valuable your operation. To schedule a visit with a group of any size please contact Khris Jinks (khris.a.jinks@monsanto.com) or Jessi Korinek (jessica.korinek@monsanto.com) at (38) We d enjoy the opportunity to show you around the field and the classroom if you are in the area. Thanks, The Gothenburg Learning Center Team Monsanto Learning Center at Gothenburg, NE / Page 3
4 MONSANTO the Table of Contents High Yield Management Strategies in Corn...5 Monsanto s Commitment to Sustainable Yield Rainout Shelter: A Tool for Understanding the Link between Soil Water, Irrigation, and Corn Yield Effect of N Rate and Application Timing on Corn Yield Investigating Planting Date Strategies in Corn Skip Row Configurations in Dryland Corn Effect of Corn Density on Yield Dryland Corn Response to Planting Date Irrigation Management and Planting Density Effects on Corn Yields Effect of Planting Date on Soybean Row Spacing in Soybean Production Soybean Yield Response to Final Irrigation Soybean Product Response to Irrigation Quantity and Strategy Page 4 / 213 Demo Report


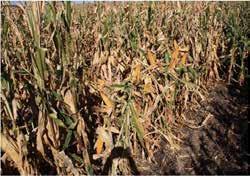
5 High Yield Management Strategies in Corn Background As growers continue to try to achieve a target corn yield average of 3 bu/acre, many management practices are employed. Corn products vary in their response to these different management practices. Previous studies have evaluated corn product response to management practices including tillage, crop rotation, irrigation, and row spacing. The purpose of this demonstration trial was to evaluate corn product response to the management practices of soil fertility, plant population, and fungicide use. Study Guidelines Eight corn products with relative maturities (RM) ranging from 12 to 115 days were chosen for this demonstration. Corn was planted on April 27, 213, at a planting population of 4, seeds per acre in 3-inch rows. Standard agronomic practices and weed control for the area were implemented. The field had been in soybeans the previous year and strip tillage was performed in the spring. Fertility consisted of a split application of nitrogen (1 lbs pre-plant, 8 lbs at V5) and 6 lbs phosphorus. Headline AMP was applied at 6 oz/acre at VT. Irrigation was provided as needed with a total of 5.8 inches of water applied for the year. The trial consisted of four replications; plots were four rows by 2 ft long with the middle two rows harvested for data. Results Numerous individual plots yielded over 3 bu/acre, although no corn products achieved an average yield of 3 bu/acre. Environmental conditions such as extremely hot weather during pollination and cloudy weather late in the season led to aborted kernels at the ear tip (Figure 1). Trial average for all products was bu/acre. Highest yielding product average was bu/acre for 115 RM A. Yields among corn products were highly variable (Figure 2). Results from this study further emphasize that when selecting corn products, it is important to consider a variety of management practices and be open to changing tactics in order to help maximize yield potential. Legal The information discussed in this report is from a single site, four replicate demonstration. This informational piece is designed to report the results of this demonstration and is not intended to infer any confirmed trends. Please use this information accordingly. Individual results may vary, and performance may vary from location to location and from year to year. This result may not be an indicator of results you may obtain as local growing, soil and weather conditions may vary. Growers should evaluate data from multiple locations and years whenever possible. ALWAYS READ AND FOLLOW PESTICIDE LABEL DIRECTIONS. Leaf Design is a registered trademark of Monsanto Company. All other trademarks are the property of their respective owners. 213 Monsanto Company MEA Figure RM corn with aborted kernels at ear tip Figure 2. Minimum, maximum, and average yield of corn products by relative maturity. Figure RM corn. Max Min Ave. Monsanto Learning Center at Gothenburg, NE / Page 5
6 MONSANTO the Monsanto s Commitment to Sustainable Yield Background Monsanto Company has implemented a Sustainable Yield Initiative (SYI), a commitment which includes helping growers double yield of corn, soybean, and cotton by 23, as compared to a base year of 2. As part of an agronomic system, numerous variables work together to help increase and/or protect yield potential. Moving into the future, continued improvements in agricultural practices will be needed to manage inputs while still maximizing crop outputs. A comparison of agricultural practices from 2, 21, and 213 indicate that advancements in germplasm, traits, planting populations, and agronomics can help increase final yield through increasing and/or protecting yield potential. Study Guidelines In an effort to evaluate systems-based agriculture through choices in genetics, traits, and agronomic practices under dryland and irrigated conditions, a trial was conducted in 213 at the Monsanto Learning Center at Gothenburg, NE. This study compared the yield results of dryland and irrigated corn and soybean grown under agricultural practices used in 2, 21, and 213. Corn Four systems representing various advancements in crop germplasm and agronomic management practices were evaluated for their effect on yield potential of dryland and irrigated corn. Each system added one or more advancements over the previous system. Refer to Tables 1 and 2 for a detailed summary of the treatments. The year 2 system was the most basic and used dated germplasm common in 2, and conventional tillage and fertility. A planting population of 3, seeds per acre was used for irrigated corn and 18, seeds per acre for dryland corn. The modern system, year 21, used corn products developed using more sophisticated technologies and better agronomic practices such as no-till, increased seeding rates, reduced fertilizer inputs, and standard weed control with Roundup agricultural herbicides. Year 213A and 213B systems utilized the most current technologies and management practices. Fourteen different corn products containing multiple value added traits for advanced performance were used in these trials. Management improvements included strip-tillage, even higher seeding rates, a split application of nitrogen, and a foliar fungicide application. Year 213A and 213B treatments differed by inputs of nitrogen and phosphorus. Year 213A and 213B treatments were replicated twice. All other treatments had no replicates. Soybean Four systems representing various advancements in crop germplasm and agronomic management practices were evaluated for their effect on yield potential of dryland and irrigated soybean. Table 1. Dryland Corn Treatments System Name *Split application of nitrogen: first application at planting and remainder applied when corn reached V6 growth stage **Phosphorus (1-34-) applied at planting *** Headline AMP applied at a rate of 1 oz/acre at the VT stage Value Added Traits: VT3 = YieldGard VT Triple, GENVT3P = Genuity VT Triple PRO, GENDGVT2PRIB = Genuity DroughtGard Hybrids with VT Double PRO RIB Complete corn blend Additional Study Guideline Information: Year 21 and year 213 treatments used standard weed control which included Roundup agricultural herbicides; Dryland corn trials did not receive additional irrigation. Page 6 / 213 Demo Report Traits Row Spacing (inches) Tillage Seeding Rate (seeds/acre) Year 2 Conventional 3 Conventional 18, Year 21 VT3 3 No-Till 22, Year 213A Year 213B GENDGVT2PRIB GENVT3P GENDGVT2PRIB GENVT3P N Applied (lbs)* 2 at planting 18 at planting P Applied (lbs)** Fungicide Applied*** 6 No 6 No 3 Strip-Till 28, Split 1/5 6 Yes 3 Strip-Till 28, Split 75/25 4 Yes
7 Monsanto s Commitment to Sustainable Yield Table 2. Irrigated Corn Treatments System Traits Name Row Spacing (inches) Tillage Seeding Rate (seeds/acre) Year 2 Conventional 3 Conventional 3, Year 21 VT3 3 No-Till 32, Year 213A Year 213B GENSSRIB GENVT3P GENSSRIB GENVT3P 3 Strip-Till 4, N Applied (lbs)* 2 at planting 18 at planting Split 1/8 P Applied (lbs)** Fungicide Applied*** 6 No 6 No 6 Yes 3 Strip-Till 4, Split 8/52 4 Yes *Split application of nitrogen: first application at planting and remainder applied when corn reached V6 growth stage **Phosphorus (1-34-) applied at planting *** Headline AMP applied at a rate of 1 oz/acre at the VT stage Value Added Traits: VT3 = YieldGard VT Triple, GENSSRIB = Genuity SmartStax RIB Complete corn blend, GENVT3P = Genuity VT Triple PRO Additional Study Guideline Information: Year 21 and year 213 treatments used standard weed control which included Roundup agricultural herbicides; An additional 5.8 inches of irrigation was added to all irrigated corn trials. Table 3 provides a detailed summary of the treatments. Year 2 and 21 systems were planted on May 23, 213, representing a traditional planting date. Year 213A and 213B systems were planted on May 3, 213, representing a trend toward earlier soybean planting dates in recent years. The year 2 system used dated germplasm, drill planting, conventional tillage and a Table 3. Dryland and Irrigated Soybean Treatments seeding rate of 22, seeds per acre. The year 21 treatment used more advanced germplasm, 3-inch rows with no tillage, and a decreased seeding rate to reduce competition for resources. The year 213A and 213B treatments, representing the most advanced management decisions, used germplasm containing the most current technologies, further decreased seeding rates, a late addition of nitrogen, an insecticide application applied at planting, System Name Traits Planting Date Row Spacing (inches) Tillage Seeding Rate (seeds/acre) N Applied (lbs) P Applied (lbs)* Fungicide and Insecticide Applied** Year 2 RR/SR May 23, 213 Drill Conventional 22, 6 No Year 21 RR May 23, No-Till 18, 6 No Year 213A Year 213B GENRR2Y May 3, No-Till 14, 4 late 6 Yes GENRR2Y May 3, 213 Twin Rows No-Till 14, 4 late 4 Yes *Phosphorus (1-34-) applied at planting ** Headline applied at a rate of 6 oz/acre Value Added Traits: RR/SR = stacked Roundup Ready and SR, RR = Roundup Ready, GENRR2Y = Genuity Roundup Ready 2 Yield SR = Sulfonylurea Ready (Sulfonylurea-based Herbicide Tolerance) Additional Study Guideline Information: Standard weed control was used for the year 2 and 21 treatments. Standard weed control + residual was used for the year 213A and 213B treatments; An additional 5.8 inches of irrigation was added to all irrigated soybean trials. Dryland soybean trials did not receive additional irrigation. Monsanto Learning Center at Gothenburg, NE / Page 7
8 MONSANTO Page 8 / 213 Demo Report the Monsanto s Commitment to Sustainable Yield and a foliar fungicide application. Year 213A and 213B treatments differed in row configuration (3-inch rows versus twin rows, respectively) (Figure 5) and in phosphorus input. The same planter was used across all treatments, with the exception of the twin-row soybean treatments. There were no replicates in the soybean trials. Results - Corn Yields from dryland and irrigated corn increased as production systems became more fine tuned, suggesting that advanced corn products are capable of achieving greater yield potential when grown in higher population densities with less input of resources. Dryland corn had the greatest yield response in this trial (Figure 1). Yield increases of 62 and 54 bu/acre were obtained between the year 2 and 21 treatments and the 21 and 213A treatments, respectively. 25 Yield (Bu/Acre) Figure 1. Dryland Corn Yields Yield (Bu/Acre) Figure 2. Irrigated Corn Yields A 213B System Year A 213B System Year Both dryland and irrigated corn yielded slightly higher in the year 213B treatments (lower N and P inputs) but these results were likely due to conditions in the field and not to the treatment. Results - Soybean Substantial improvements in yield were obtained in both dryland and irrigated soybean in the year 21 treatment. For dryland soybean, yield response was similar in year 21, year 213A and year 213B treatments. There seemed to be no effect on yield with variations in row configuration, seeding rate, fertility, and pest and disease control. Yields were also maintained with further improvements in germplasm and an earlier planting date. For irrigated soybean, a slight yield increase was seen between year 21 and year 213 treatments. Yield (Bu/Acre) A 213B Figure 3. Dryland Soybean Yields Yield (Bu/Acre) Figure 4. Irrigated Soybean Yields System Year A 213B System Year

9 Monsanto s Commitment to Sustainable Yield Year 2 - drill Year 21-3-inch Year 213A - 3-inch The twin row configuration used in the year 213B treatment did not improve yield response over the traditional 3-inch row configuration used in the year 213A treatment in dryland or irrigated soybeans. Conclusions Results from this study help exhibit a look at the future to determine how higher yielding corn and soybean products, biotech traits, optimal row spacing and seeding rates, fungicide use, and weed management strategies show promise in helping to maximize yield potential while conserving our natural resources. In the future, it will be important to continue to use products suited for a particular growing region and biotech traits that help protect yield potential, but it will also be important to utilize best agronomic practices such as row-spacing, fertility management, and irrigation management. Legal The information discussed in this report is from a single site with four replications The information discussed in this report is from a single site, non-replicated demonstration. This informational piece is designed to report the results of this demonstration and is not intended to infer any confirmed trends. Please use this information accordingly. Monsanto Company is a member of Excellence Through Stewardship (ETS). Monsanto products are commercialized in accordance with ETS Product Launch Stewardship Guidance, and in compliance with Monsanto s Policy for Commercialization of Biotechnology-Derived Plant Products in Commodity Crops. This product has been approved for import into key export markets with functioning regulatory systems. Any crop or material produced from this product can only be exported to, or used, processed or sold in countries where all necessary regulatory approvals have been granted. It is a violation of national and international law to move material containing biotech traits across boundaries into nations where import is not permitted. Growers should talk to their grain handler or product purchaser to confirm their buying position for this product. Excellence Through Stewardship is a registered trademark of Biotechnology Industry Organization. B.t. products may not yet be registered in all states. Check with your Monsanto representative for the registration status in your state. IMPORTANT IRM INFORMATION: Genuity RIB Complete corn blend products do not require the planting of a structured refuge except in the Cotton-Growing Area where corn earworm is a significant pest. Genuity SmartStax RIB Complete and Genuity VT Double PRO RIB Complete corn are blended seed corn products. See the IRM/Grower Guide for additional information. Always read and follow IRM requirements. Individual results may vary, and performance may vary from location to location and from year to year. This result may not be an indicator of results you may obtain as local growing, soil and weather conditions may vary. Growers should evaluate data from multiple locations and years whenever possible. ALWAYS READ AND FOLLOW PESTICIDE LABEL DIRECTIONS. Roundup Ready crops contain genes that confer tolerance to glyphosate, the active ingredient in Roundup brand agricultural herbicides. Roundup brand agricultural herbicides will kill crops that are not tolerant to glyphosate. DroughtGard, Genuity, RIB Complete, Roundup Ready 2 Technology and Design, Roundup Ready 2 Yield, Roundup Ready, Roundup, SmartStax, VT Double PRO, VT Triple PRO and YieldGard VT Triple are trademarks of Monsanto Technology LLC. Leaf Design is a registered trademark of Monsanto Company. LibertyLink and the Water Droplet Design is a registered trademark of Bayer. Herculex is a registered trademark of Dow AgroSciences LLC. Headline AMP and Headline are registered trademarks of BASF Corporation. Respect the Refuge and Corn Design and Respect the Refuge are registered trademarks of National Corn Growers Association. All other trademarks are the property of their respective owners. 213 Monsanto Company CAM. Year 213B - twin-row Figure 5. Soybean row configurations Monsanto Learning Center at Gothenburg, NE / Page 9

10 MONSANTO the Two Genuity DroughtGard Hybrids of 11 and 111 days relative maturity (RM) were planted on May 24th in 3-inch rows at 21, seeds/acre. Each plot consisted of 4 rows, where only the 2 center rows were harvested for data. Plots were harvested on October 1th. Page 1 / 213 Demo Report Rainout Shelter: A Tool for Understanding the Link between Soil Water, Irrigation, and Corn Yield Background Several studies have evaluated corn yield response to water applied. However, such field studies have been conducted in open fields with little or no control over environmental factors such as precipitation. The rainout shelter (ROS) provides a unique opportunity to remove precipitation as a variable and to carefully manage water inputs to study the soil-water-plant relationship that leads to yield response. A previous corn study in the ROS focused on water stress at various growth stages and compared the wateruse efficiency of a Genuity DroughtGard Hybrids product against a drought-tolerant check that was not a DroughtGard Hybrids product. The DroughtGard Hybrids product used water more efficiently than the check when exposed to drought stress at the various growth stages evaluated. The objective of this study was to evaluate corn yield response to water stress and different levels of irrigation. Determining water use efficiency and the amount of irrigation required to obtain the first bushel of corn grain is still uncertain and greatly depends on the product, timing of water application, soil plant-available water, and other environmental conditions. Questions being asked: At what level of irrigation or available water does the corn plant produce the first bushel of grain per acre? What is the water use efficiency at various levels of irrigation? Do products of different relative maturities affect water use and efficiency? Materials and Methods Rainout shelter The ROS is a metal building that moves on rails to enclose the plot area when it detects a raindrop (Figure 1). The plot area consists of 36 irrigation zones (individual research plots), each measuring 2 feet in length by 1 feet in width. Each irrigation zone is surrounded by a 6-foot deep soil moisture barrier and individualized drip irrigation system. Agronomics Figure 1. Rainout shelter on September 9, 213. Management Nitrogen fertilizer was hand-applied at a rate of 2 lb/acre 1 lb N/acre (Urea) broadcasted before planting 1 lb N/acre (UAN) side-dressed on July 19th (between V1 and V16 growth stages) Standard weed management across the trial maintained a weedfree environment. Water use treatments Six water use treatments by product were randomly allocated to the irrigation zones. Water use treatments were 6, 8, 1, 12, 18, and 24 inches of water, where each treatment consisted of water applied through irrigation plus plant-available water in the soil. The trial was set up in a completely randomized design and replicated three times. The irrigation management throughout the growing season depended on the treatment. Periodic irrigation events were proportional to the treatment applied and somewhat evenly distributed across the growth stages (Figure 2). Soil water measurements In order to determine the total water used by the crop, volumetric water content (inches/foot) was measured at each foot increment down to a depth of 6 feet using a neutron probe moisture meter. Soil water content was monitored before planting, during the growing season, and at harvest through a 2 inch diameter aluminum pipe (access tube) installed into the soil in each irrigation zone.

11 Rainout Shelter: A Tool for Understanding the Link between Soil Water, Irrigation, and Corn Yield 25 VE VE V5 V11 VT R1 R5 V5 V9 V15 R1 R5 Irrigation (inches) VE V5 V7 V12 R1 R May 31-May 7-Jun 14-Jun 21-Jun 28-Jun 5-Jul 12-Jul 19-Jul Date 24 inches 18 inches 12 inches 1 inches 8 inches 6 inches Growth stages 24 inches Growth stages 1 inches Growth stages 6 inches Figure 2. Cumulative irrigation for all treatments and growth stages associated with the 6, 1, and 24 inch treatments. 26-Jul 2-Aug 9-Aug 16-Aug 23-Aug 3-Aug 6-Sep 13-Sep 2-Sep 27-Sep Soil water measurements started on June 1th and ended on October 1th. The change in available water content was then estimated by depth using the final measurement minus the initial measurement. Average and marginal water use efficiency (WUE) Average and marginal WUE were calculated using either water applied through irrigation or estimates of water used by the crop. For example: Average WUE used = Yield/water used Marginal WUE used = Yield gain/additional inches of water used Results Irrigation management and growth stages Timing of irrigation played an important role in the results obtained (Figure 2). Controlled irrigation allowed corn plants to survive during the growing season even in the 6 inch treatment. In uncontrolled conditions, the erratic distribution of rainfall events would have prevented a corn plant that only received 6 inches of rainfall from completing its development cycle. Despite timely irrigation management, slow rates of vegetative growth were observed as water availability decreased. For example on July 16th, growth stages were V7, V9, and V11 for the 6, 1, and 24 inch treatments, respectively. Monsanto Learning Center at Gothenburg, NE / Page 11


12 MONSANTO the Rainout Shelter: A Tool for Understanding the Link between Soil Water, Irrigation, and Corn Yield 11 Day RM 111 Day RM 6 inches 8 inches 6 inches 8 inches 1 inches 12 inches 1 inches 12 inches 18 inches 24 inches 18 inches 24 inches Figure 3. Differences in corn plant growth at each treatment level for both RM on September 9, 213. Page 12 / 213 Demo Report
13 Rainout Shelter: A Tool for Understanding the Link between Soil Water, Irrigation, and Corn Yield Corn yields Corn grain yields progressively increased along with increases in irrigation for both products (Table 1, Figures 4 and 5). Corn was not expected to yield in the 6 and 8 inch treatments based on previous knowledge. The 6 inch treatment yielded 59 and 69 bu/ acre on average for the 11 and 111 RM products, respectively. The 8 inch treatment yielded 69 and 72 bu/acre on average for the 11 and 111 RM products, respectively. Corn yields between products were very similar at each treatment level. The largest differences in yield between products were observed in the 6 inch and 18 inch treatments, where the 111 RM product yielded 1 and 14 bu/acre more than the 11 RM product, respectively. Soil water profiles Soil water distribution in the soil profile was different between products (Figures 6-7). For both products, the change in plantavailable water (final initial measurement) showed that water was mainly obtained from the upper 2 feet of the soil profile in the 6, 8, 1, and 12 inch treatments. Additionally, it seems that the longer-season product may have obtained water between the 3 and 6-ft soil depths mainly at the 6 and 8 inch treatments. On the other hand, there was water accumulation to a depth of 4 feet under both products in the 18 inch treatment. In the 24 inch treatment, however, the amount of water remaining in the soil profile under the 11 RM product was larger than under the 111 RM product. In the treatment using full irrigation, there was a surplus of 2.4 inches of water remaining in the soil profile under the 11 RM product compared to the 111 RM. In other words, for every additional day in RM, the corn crop used on average ~.24 inches of water per day. Water use efficiency (WUE) Average WUE used (bu/acre per inch of water used) was variable across treatments, ranging between 1 and 12 for both the 11 and 111 RM products (Figure 4). The largest estimates of WUE were observed up to the 12 inch treatment and slightly declined at the 18 and 24 inch treatments for both products. On the other hand, the marginal WUE (yield gain per additional inch of water) was the largest between the 8 to 1 inch and 1 to 12 inch treatments for both products (Table 1). Table 1. Water use treatments, corn yields, and water use efficiency (WUE) for both products. Water WUE Marginal WUE Product Treatment Applied Used Yield Applied Used Applied Used RM inches bu/acre bu/inch/acre Monsanto Learning Center at Gothenburg, NE / Page 13


 6 8 1 12")
 11")


 by products at")


14 MONSANTO the Rainout Shelter: A Tool for Understanding the Link between Soil Water, Irrigation, and Corn Yield WUE (bu/acre/inch) Water use treatment (inches) 11 RM 111 RM 11 RM WUE used 111 RM WUE used Figure 4. Corn yields and average water use efficiency (WUE) by products at each treatment level. 11 Day RM 111 Day RM 6 inches 8 inches 6 inches 8 inches 1 inches 12 inches 1 inches 12 inches 18 inches 24 inches 18 inches 24 inches Figure 5. Ear sizes by water use treatment and RM on October 9, 213. Page 14 / 213 Demo Report
15 Rainout Shelter: A Tool for Understanding the Link between Soil Water, Irrigation, and Corn Yield Therefore, the largest marginal returns will be obtained in these situations. In other words, in a water-limited situation our results suggest that investing up to 12 inches of water will provide the highest profitability. Key Messages While grain yields of 59 and 69 bu/acre were obtained with 6 inches of water used, it must be noted that the irrigation strategy likely played a more important role in yield formation than the total quantity of water used. WUE and marginal WUE were both optimized at the 12 inch treatment, and slightly declined for the 18 and 24 inch treatments. Corn products of 111 RM used 2.4 inches of water more than the 11 RM products as estimated by water left in the soil profile. However, estimates of WUE were similar for both products. Legal The information discussed in this report is from a single site, 3 replicate demonstration. This informational piece is designed to report the results of this demonstration and is not intended to infer any confirmed trends. Please use this information accordingly. Monsanto Company is a member of Excellence Through Stewardship (ETS). Monsanto products are commercialized in accordance with ETS Product Launch Stewardship Guidance, and in compliance with Monsanto s Policy for Commercialization of Biotechnology-Derived Plant Products in Commodity Crops. This product has been approved for import into key export markets with functioning regulatory systems. Any crop or material produced from this product can only be exported to, or used, processed or sold in countries where all necessary regulatory approvals have been granted. It is a violation of national and international law to move material containing biotech traits across boundaries into nations where import is not permitted. Growers should talk to their grain handler or product purchaser to confirm their buying position for this product. Excellence Through Stewardship is a registered trademark of Biotechnology Industry Organization. Individual results may vary, and performance may vary from location to location and from year to year. This result may not be an indicator of results you may obtain as local growing, soil and weather conditions may vary. Growers should evaluate data from multiple locations and years whenever possible. ALWAYS READ AND FOLLOW PESTICIDE LABEL DIRECTIONS. DroughtGard and Genuity are trademarks of Monsanto Technology LLC. Leaf Design is a registered trademark of Monsanto Company. 213 Monsanto Company JMG Soil depth (ft) Figure 6. Change in available soil water content at each treatment level for 11 RM product. Soil depth (ft) Change in available water (inches/ft) 11 RM Change in available water (inches/ft) 111 RM Figure 7. Change in available soil water content at each treatment level for 111 RM product. Monsanto Learning Center at Gothenburg, NE / Page 15
16 MONSANTO the Effect of N Rate and Application Timing on Corn Yield One of the most important and costly inputs in corn production is nitrogen (N) fertilizer. Previous studies conducted at the Monsanto Learning Center in Gothenburg, NE have shown that split applications of N resulted in higher yield potential and increased net profit in both conventional and strip-till systems. Furthermore, additional N applications (6 lb per acre) near the VT growth stage resulted in improved yields in 21. However, results from a study conducted in 212 did not show consistent results across N rates applied. Much uncertainty still exists regarding optimum N rates and split applications under the farm conditions at Gothenburg, NE. In 213, a corn demonstration trial was conducted to evaluate the yield response of corn to different N rates and split applications. Study Guidelines Two corn products with 11 day relative maturity (RM) were chosen for this demonstration. Corn was planted on April 22 in 3-inch rows at 35, seeds per acre into soybean residue. The study consisted of five N rates (, 6, 12, 18, and 24 lbs N per acre) where N was applied at 3 different timings. Timing A: All N applied pre-plant. Timing B: Half of total N applied pre-plant and remainder in a sidedress application at the V6 growth stage. Timing C: Half of total N applied pre-plant, 1 /4 applied at the V6 growth stage, and remaining 1 /4 applied at the V17 growth stage. Strip tillage was performed and no other nutrient was applied. All plots were harvested October 1. Standard weed control was used to maintain a weed-free environment. The demo was set up in a split-split plot design in which the N rate served as the main plot, application timing served as the subplot, and corn products as the sub-subplot. Within the subplots, both corn products were randomly distributed across the field and replicated five times. Results Corn yields responded to N additions, reaching maximum value at the 12 lbs N/acre rate (Table 1). Higher applications did not provide a yield advantage as compared to the 12 lb N/acre rate. There was a corn product specific response to N applied (Table 1). While nitrogen use efficiency (NUE) was the largest for the 6 lb per acre N rate (averaged across application timings), yields were not optimized until 12 lb N per acre was applied (Figure 1). Overall, Product A showed a higher NUE than Product B even when no N was applied as shown by the difference in yield (Figure 1). Tissue tests revealed Product A had lower N concentrations than Product B. Product A was able to utilize N more efficiently than Product B. The effects of timing or split N application were not consistent across N application rates or corn products (Figure 2). Pre-plant N applications resulted in the highest yields for Product A at 12 and 24 lbs N per acre. N application split three ways yielded the lowest within the same N application rates. N release from the previous soybean crop tissue may be responsible for yields obtained at the lb N per acre rate, and for the lack of response to N rates greater than 12 lb N per acre (Figure 2). Legal The information discussed in this report is from a single site, 5 replicate demonstration. This informational piece is designed to report the results of this demonstration and is not intended to infer any confirmed trends. Please use this information accordingly. Individual results may vary, and performance may vary from location to location and from year to year. This result may not be an indicator of results you may obtain as local growing, soil and weather conditions may vary. Growers should evaluate data from multiple locations and years whenever possible. ALWAYS READ AND FOLLOW PESTICIDE LABEL DIRECTIONS. Leaf Design is a registered trademark of Monsanto Company. All other trademarks are the property of their respective owners. 213 Monsanto Company. AMH Page 16 / 213 Demo Report
17 Effect of N Rate and Application Timing on Corn Yield Table 1. Average corn yield and nitrogen use efficiency (NUE) by total N applied and corn product. Product A Product B N Rate (lb N/acre) Yield (bu/acre) NUE (bu/lb N) Yield (bu/acre) NUE (bu/lb N) N rate (lb N/acre) Yield Prouct A Yield Product B NUE Product A NUE Product B Figure 1. Average corn yield and N use efficiency (NUE) by total N applied and corn product NUE (bu/lb N) Monsanto Learning Center at Gothenburg, NE / Page 17
18 MONSANTO the Effect of N Rate and Application Timing on Corn Yield PRE 3PRE 3PRE 12PRE 6PRE 6PRE 18PRE 9PRE 9PRE 24PRE 12PRE 12PRE 3V6 15V6 6V6 3V6 9V6 45V6 12V6 6V6 15V17 3V17 45V17 6V N rate (lb/acre) Product A Product B Figure 2. Effect of nutrient addition and plant population on average yield of three corn products in 213. lbs N pre-plant 6 lbs N pre-plant 12 lbs N pre-plant 18 lbs N pre-plant 24 lbs N pre-plant Figure 3. Differences in Product A corn ear sizes at pre-plant N application timing. Page 18 / 213 Demo Report
19 Investigating Planting Date Strategies in Corn Study Guidelines A corn demonstration study was conducted on irrigated ground at the Monsanto Learning Center at Gothenburg, Nebraska to evaluate the potential yield response of different relative maturity (RM) corn products to different planting dates in an effort to reduce the risk associated with extreme heat at pollination. In general, corn planted from mid-april through early May in south central Nebraska typically produces higher yields by taking advantage of the longer grower season. In regards to this generality and the effort to reduce pollination risk, two questions were identified: 1. Do earlier planting dates produce a positive yield response? 2. How well do different product RMs respond to a range of planting dates? To investigate the questions, three different corn products with RMs of 12, 18, and 113 were planted and three planting dates were utilized. Relative Maturity Planted treatments included: 1. Ideal Planting Date 2. Planting date vs. Pollination 3. Extended Pollination 4. Syncing Pollination The ideal planting date is a typical planting date for south central Nebraska. The planting date vs. pollination treatment, which used the same 113 RM product, was designed to make evaluations on the speed of pollination compared to each of the planting dates. For the extended pollination treatment, a strategy not commonly used by farmers, the 12 RM product was planted on April 26, the 18 RM product on May 11, and the 113 RM product on May 23 to observe the time spread of pollination. The synching pollination treatment, a strategy commonly used by farmers, involved the planting of the 113 RM product on April 26, the 18 RM product on May 11, and the 12 RM product on May 23 to observe the time spread of pollination. 4/26 5/6 5/16 5/26 6/5 6/15 6/25 7/5 7/15 7/25 Ideal Planting Date Extended Pollination Figure 1.Days to pollination for different planting dates and product RM. Planting Date vs. Pollination Syncing Pollination Monsanto Learning Center at Gothenburg, NE / Page 19
20 MONSANTO the Investigating Planting Date Strategies in Corn Results and Conclusions The days to 5% pollination for the ideal planting date treatment was the same for the 18 and 113 RM products and about two days earlier for the 12 RM product (Figure 1). The days to 5% pollination for the planting date vs. pollination treatment had a variance of 1 days between the April 26 and May 23 planting dates respectively. The May 11 planting date had a 5% pollination date 5 days later and 5 days earlier than the early and late planting dates respectively (Figure 1). The days to 5% pollination for the extended pollination treatment ranged over a period of about 1 days. The 113 RM product planted on May 23 flowered the latest and the 12 RM product planted on April 26 flowered the earliest (Figure 1). The days to 5% pollination for the synching pollination treatment resulted in about a 5 day variance between the earliest to flower 113 RM product planted on April 26 and the latest to flower, the 18 RM product planted on May 11 (Figure 1). The highest yields from the 12 RM product came from later plantings while the highest for the 18 RM and 113 RM came from early to mid planting dates (Figures 2-4). The 113 RM product was the highest yielding product across the three planting dates; the 12 RM increased and the 18 RM decreased with later planting respectively (Figures 2-4). Average yield for the three products was nearly equal for the April 26 and May 11 planting dates. Slightly less for the May 23 planting date (Figure 5). Planting Date Relative Maturity (RM) / / / Figure 2. Yields by planting date and relative maturity. Yield (Bu/Acre) /26/213 5/11/213 5/23/ RM 18 RM 113 RM Figure 3. Product RM response to planting date. Yield (Bu/Acre) Page 2 / 213 Demo Report 19 4/26/213 5/11/213 5/23/ RM 18 RM 113 RM Figure 4. Product response to planting date.

21 Investigating Planting Date Strategies in Corn Summary Results in 213 show that planting corn from late April into the first week of May yielded the highest of all RM products evaluated in this study. The 113 RM product yielded the highest regardless of planting date. The 12 RM product generated a positive yield response to later planting dates, as mid-may was found to be the ideal time for planting. Legal The information discussed in this report is from a single site, nonreplicated demonstration. This informational piece is designed to report the results of this demonstration and is not intended to infer any confirmed trends. Please use this information accordingly. Individual results may vary, and performance may vary from location to location and from year to year. This result may not be an indicator of results you may obtain as local growing, soil and weather conditions may vary. Growers should evaluate data from multiple locations and years whenever possible. ALWAYS READ AND FOLLOW PESTICIDE LABEL DIRECTIONS. Leaf Design is a registered trademark of Monsanto Company. All other trademarks are the property of their respective owners. 213 Monsanto Company LGM Yield (Bu/Acre) /24 4/28 5/2 5/6 5/1 5/14 5/18 5/22 Figure 5. Overall yield response to planting date. Figure 6. Representative ear samples from the 113 RM product from each planting date. Monsanto Learning Center at Gothenburg, NE / Page 21
22 MONSANTO the Skip Row Configurations in Dryland Corn Background During dry conditions, skip row configurations may be beneficial as corn roots can grow into moist soils under rows left fallow at planting. Moisture in fallow rows may be further conserved by standing crop residue. Skip row configurations would typically be targeted towards a 1 bushel and less yield environment that is prone to dry conditions. A critical component when using skip row configurations is weed control, as canopy cover does not shade most of the ground surface, and corn yield potential could be at risk if weeds are allowed to compete with corn for water and resources. A corn demonstration trial was conducted at the Monsanto Learning Center at Gothenburg, NE investigating skip row configurations in corn as a method to conserve soil moisture under dryland conditions. Goals of this trial were to: Evaluate yield benefits of skip row configurations compared to traditional row configurations under dryland conditions. Determine if certain skip row configurations are more beneficial to use, and identify the most beneficial configuration. Materials and Methods Two corn products were planted: 18 RM (Fixed-ear product) 115 RM (Flex-ear product) Corn was planted into no-till wheat stubble plots, and plots received approximately 18 inches of rainfall throughout the growing season. Standard corn weed control was used across the trial. In-row populations differed; however, overall populations remained 22, plants/acre for each treatment. Key Messages Due to above average rainfall, skip row configurations offered no yield benefit over standard row spacings (all rows planted in 3-inch and 3-inch Twin) except in the case of the 18 RM corn product in the P2S1 and TP2S1 configurations. Other skip row studies that experienced abnormally wet growing seasons have also found yield potential was favored by planting more rows. 1 When evaluating skip rows only, it is evident that P2S1 and TP2S1 produced a greater yield response over the other row configurations. The 18 RM fixed-ear corn product had greater yields at the P2S1 and TP2S1 configurations compared to the standard 3-inch and twin row spacings, respectively. Under the yield conditions, it was surprising the 18 RM product would perform better at these configurations compared to conventional row-spacings. Further, this earlier-maturing corn product out-yielded the fuller maturity (115 RM) corn product in these row configurations. This finding is supported by other skip row planting studies that demonstrate later maturing corn products had significantly greater yields compared to shorter maturing corn products. 1 Based on averages from most of the row configurations, the fuller maturity (115 RM) flex-ear product had higher yields than the earlier (18 RM) fixed-ear product. In comparing 3-inch skip row configurations to the twin skip row configurations, twin skip row configurations (except the TP2S2 configuration) had equal or higher yields than the 3-inch skip rows. Rows Left Fallow Row Configuration Plant Population (plants/acre) Planted Row Population (plants/acre) Every row planted 3 and Twin Row 3 22, 22, One row fallow Plant 2, Skip 1; Twin Row Plant 2, Skip 1 Two rows fallow Plant 1, Skip 1; Plant 2, Skip 2; Twin Row Plant 1, Skip 1; Twin Row Plant 2, Skip 2 22, 33, 22, 44, Page 22 / 213 Demo Report


23 Skip Row Configurations in Dryland Corn 3-inch Spacing All Rows Planted 3-inch Spacing Plant 1, Skip 1 (P1S1) Sources & Legal 1 Lungren, N. et. al. 21. Corn response to skip-row planting configuration in North Dakota. ASA-CSSA-SSSA Annual Meeting Abstracts. (verified 11/16/213). The information discussed in this report is from a single site, non-replicated demonstration. This informational piece is designed to report the results of this demonstration and is not intended to infer any confirmed trends. Please use this information accordingly. For more information regarding the intellectual property protection for the seed products identified in this publication, please see www. asgrowanddekalb.com. Individual results may vary, and performance may vary from location to location and from year to year. This result may not be an indicator of results you may obtain as local growing, soil and weather conditions may vary. Growers should evaluate data from multiple locations and years whenever possible. Asgrow is a registered trademark of Monsanto Technology LLC. Leaf Design is a registered trademark of Monsanto Company. Channel is a registered trademark of Channel Bio, LLC. Always read and follow grain marketing and all other stewardship practices and pesticide label directions. 213 Monsanto Company KY 3-inch Spacing Plant 2, Skip 1 (P2S1) 3-inch Spacing Plant 2, Skip 2 (P2S2) Monsanto Learning Center at Gothenburg, NE / Page 23


 Page")
24 MONSANTO the Skip Row Configurations in Dryland Corn Twin 3-inch Spacing All rows Planted Twin 3-inch Spacing Plant 1, Skip 1 (TP1S1) Twin 3-inch Spacing Plant 2, Skip 1 (TP2S1) Twin 3-inch Spacing Plant 2, Skip 2 (TP2S2) Page 24 / 213 Demo Report
25 Skip Row Configurations in Dryland Corn " P1S1 P2S1 P2S2 Twin TP1S1 TP2S1 TP2S2 Figure 1. Corn Yield Response to Row Configuration 3" Twin Row Configuration " P1S1 P2S1 P2S2 Twin TP1S1 TP2S1 TP2S2 3" Twin Row Spacing Configuration 115 RM product 18 RM product Figure 2. Yield Response of Two Corn Products to Row Spacing Configuration Monsanto Learning Center at Gothenburg, NE / Page 25
26 MONSANTO the Effect of Corn Density on Yield Study Guidelines Fourteen corn products Relative maturities (RM) ranging from 12 to 115 RM Plant densities ranging from 24, to 48, plants/acre Planted on April 22, 213 Four replications, 2-row plots Corn/soybean rotation with spring strip-tillage Standard irrigated corn production practices Harvested September 3, 213 Results < 19 RM Despite differences in yield levels, yields were maximized at similar plant densities across corn products RM Corn products evaluated in the RM range performed somewhat consistently in regards to the density at which yields were maximized RM Across 3 corn products, yields were still climbing, despite the increase in density to 48, plants/acre. When evaluated by RM group, longer season RM s maximized yield at greater plant densities. Summary Comments Optimum plant density depends on variables such as moisture availability, soil fertility, and the specific corn product planted. Individual corn products respond differently to changes in plant density. In 213, several corn products were still increasing yield at 48, plants/acre. In this study, individual corn products with a lower RM would maximize yield at a lower plant density. Page 26 / 213 Demo Report Yield (Bu/Acre) Yield (Bu/Acre) , 3, 36, 42, 48, Plant Density (Plants/Acre) Figure to 19 RM corn product response to plant density. 24, 3, 36, 42, 48, Plant Density (Plants/Acre) Figure to 112 RM corn product response to plant density. 12 RM 18 RM A 18 RM B 19 RM A 19 RM B 11 RM 111 RM A 111 RM B 112 RM A 112 RM B
27 Effect of Corn Density on Yield Yield (Bu/Acre) RM 115 RM A 115 RM B , 3, 36, 42, 48, Plant Density (Plants/Acre) Figure to 115 RM corn product response to plant density. 3 Yield (Bu/Acre) <19 RM RM <19 RM RM RM Poly. (<19 RM) RM Poly. ( RM) Poly. ( RM) , 3, 36, 42, 48, Plant Density (Plants/Acre) Figure 4. Response to plant density by relative maturity groups. Monsanto Learning Center at Gothenburg, NE / Page 27


28 MONSANTO the Effect of Corn Density on Yield Figure 5A. Ear size at 24, plants/acre. Figure 5B. Ear size at 48, plants/acre. Legal The information discussed in this report is from a single site, replicated demonstration. This informational piece is designed to report the results of this demonstration and is not intended to infer any confirmed trends. Please use this information accordingly. Individual results may vary, and performance may vary from location to location and from year to year. This result may not be an indicator of results you may obtain as local growing, soil and weather conditions may vary. Growers should evaluate data from multiple locations and years whenever possible. Leaf Design is a registered trademark of Monsanto Company. 213 Monsanto Company. Figure 6. Ear size comparison at various plant densities for a 19 RM corn product. Figure 7. Ear size comparison at various plant densities for a 115 RM corn product. Page 28 / 213 Demo Report
29 Dryland Corn Response to Planting Date Study Purpose To evaluate the potential impact of planting date on yield response of different relative maturity (RM) corn products in an effort to minimize the risk associated with heat and drought stress at pollination. Corn planted from mid-april through early May in south central Nebraska typically produces higher yields by taking advantage of the longer growing season. Questions associated with the trial include: 1) Do earlier planting dates produce a positive yield response under dryland conditions? 2) How well do different product RMs respond to a range of planting dates? Study Guidelines Corn products evaluated in the trial included: - 97 RM, 1 RM, 112 RM, and 114 RM Genuity DroughtGard Hybrids with VT Double PRO RIB Complete corn blends - 19 RM Genuity VT Double PRO RIB Complete corn blend - Competitive corn product with similar insect protection traits. Trial was planted no-till into wheat stubble. No irrigation; approximately 18 inches of rainfall. Each seed product was replicated three times and randomized within each planting date in plots 43 feet long. Results Unseasonably cool temperatures in late April and timely rains surrounding the June 3rd planting date likely led to the unusual occurrence of the later-planted corn out-yielding the earlier planting dates (Figures 1 and 3). In this study, the highest overall yields were provided by the 112 and 114 RM products at and 216. bu/acre respectively (Figures 1 and 2). However, the early maturing 97 RM product, planted June 3, produced 29.5 bu/acre. Products with an RM >15 produced more grain at each planting date (Figure 4). Summary Rainfall totals throughout the 213 growing season surpassed 18 inches. Dryland yields were exceptional due to above average rainfall and the study being located on wheat stubble, which helped conserve soil moisture throughout the growing season. Unseasonably cool temperatures in late April and timely rains during the pollination time frame for the 15 RM and longer maturity corn products planted May 16 and June 3 and the 15 RM and shorter maturity corn products planted June 3, likely led to the later planted corn out-producing earlier plantings. Plantings earlier than May 16 were likely affected by stressful pollination conditions in mid-july. Research through the years supports early planting to help avoid stress effects at pollination. Planting Date Corn Product Relative Maturity (RM) 97* 1* * 114* 111 Competitive Product 4/29/ /16/ /3/ *Genuity DroughtGard Hybrids Products Figure 1. Average yield (bu/acre) of products by relative maturity and planting date Monsanto Learning Center at Gothenburg, NE / Page 29
30 MONSANTO the Dryland Corn Response to Planting Date Comp Comp Comp 4/29/213 5/16/213 6/3/213 Figure 2. Average Yield Response of Products of Varying Relative Maturity to Delayed Planting A two year study conducted in north central Kansas showed a 3% yield decrease when planting was delayed from early April until early May in 1993 and a decrease of 51% when delayed from early May to early June in A 1996 Nebraska study noted yield reductions of 19% and 32 to 53% when planting was delayed until late May and early June, respectively. 1 This single season study demonstrated that higher yields can be possible with later planting dates if stress occurs early in the season and is followed by favorable conditions at pollination. Under dryland conditions, a range of planting dates may be a consideration to help reduce the potential for yield loss associated with heat and drought. Page 3 / 213 Demo Report Sources and Legal 1 Sindelar, A. J., et al. Corn Response to Delayed Planting in the Central Great Plains. Agronomy Journal. 12 no 2 Mr/Ap 21 p The information discussed in this report is from a single site, non-replicated demonstration. This informational piece is designed to report the results of this demonstration and is not intended to infer any confirmed trends. Please use this information accordingly. Monsanto Company is a member of Excellence Through Stewardship (ETS). Monsanto products are commercialized in accordance with ETS Product Launch Stewardship Guidance, and in compliance with Monsanto s Policy for Commercialization of Biotechnology-Derived Plant Products in Commodity Crops. This product has been approved for import into key export markets with functioning regulatory systems. Any crop or material produced from this product can only be exported to, or used, processed or sold in countries where all necessary regulatory approvals have been granted. It is a violation of national and international law to move material containing biotech traits across boundaries into nations where import is not permitted. Growers should talk to their grain handler or product purchaser to confirm their buying position for this product.
31 Dryland Corn Response to Planting Date /29/213 5/16/213 6/3/213 Figure 3. Average Yield by Planting Date <15 >15 <15 >15 <15 >15 4/29/213 5/16/213 6/3/213 Figure 4. Average Yield Response to Planting Date by Relative Maturity Group (< 15 and > 15 RM) Excellence Through Stewardship is a registered trademark of Biotechnology Industry Organization. B.t. products may not yet be registered in all states. Check with your Monsanto representative for the registration status in your state. IMPORTANT IRM INFORMATION: Genuity RIB Complete corn blend products do not require the planting of a structured refuge except in the Cotton-Growing Area where corn earworm is a significant pest. Genuity VT Double PRO RIB Complete corn is a blended seed corn product. See the IRM/Grower Guide for additional information. Always read and follow IRM requirements. Individual results may vary, and performance may vary from location to location and from year to year. This result may not be an indicator of results you may obtain as local growing, soil and weather conditions may vary. Growers should evaluate data from multiple locations and years whenever possible. ALWAYS READ AND FOLLOW PESTICIDE LABEL DIRECTIONS. Roundup Ready crops contain genes that confer tolerance to glyphosate, the active ingredient in Roundup brand agricultural herbicides. Roundup brand agricultural herbicides will kill crops that are not tolerant to glyphosate. DroughtGard, Genuity, RIB Complete, Roundup Ready 2 Technology and Design, Roundup Ready, Roundup and VT Double PRO are registered trademarks of Monsanto Technology LLC. Leaf Design is a registered trademark of Monsanto Company. All other trademarks are the property of their respective owners. 213 Monsanto Company LGM Monsanto Learning Center at Gothenburg, NE / Page 31
32 MONSANTO the Irrigation Management and Planting Density Effects on Corn Yields Background The efficient use of irrigation water is becoming increasingly important in arid and semi-arid regions with limited water resources. Water is important for plant growth and development; however, too little or too much water from rainfall or irrigation can limit yield potential. Water use by the plant is evaluated based on evapotranspiration (ET) rate, which is water removal by soil evaporation (E) and by plant transpiration (T). Determination of the right irrigation level as affected by planting density can result in an efficient use of labor, land, and water resources. Previous studies have looked at the effects of different irrigation levels on corn yield planted at a constant population. A study conducted in 21 showed that some corn products yielded the highest at the 5% irrigation level, while others responded to the 1% treatment. In a study in 211, irrigating at 1% ET provided maximum yield when averaged across products. Additionally, there was a difference in product response to different levels of irrigation. A replicated demonstration trial was conducted at the Monsanto Learning Center in Gothenburg, NE in 213 to evaluate corn products response to different levels of irrigation at various plant densities. This study can help answer the following questions being asked by growers and agronomist: Is there a hybrid specific yield response to water applied and planting density? How does water stress impacts corn yields at various plant densities? How do Monsanto corn products differ in their response to irrigation and planting density from competitors? Study Guidelines Five corn products of relative maturities ranging from 11 to 115 days were used in this trial. Three Monsanto products (111 to 115 RM) were compared to two competitor products (11 and 111 RM). Corn products were planted on 4/29/213 in 3-inch rows into soybean residue. Plot size was 2 feet by 4 rows. Corn was harvested on 1/17/213. Irrigation treatments were 1 inch per week through irrigation or rainfall, 5%, 75%, and 1% of ET. Irrigation was applied through a subsurface drip tape located 12 inches below the soil surface. Timing of Irrigation throughout the growing season was based on the treatment. For example, corn plants at the 5% and 75% ET were stressed early during the vegetative growth. Planting densities were 24,, 3,, and 36, seeds per acre. The experimental design was a split-split plot in which the irrigation treatment served as the main plot, planting density served as the subplot, and corn products served as the sub-subplot. Each main plot (irrigation level) was replicated four times and products were randomly distributed within the subplots. Soil was strip-tilled before planting and fertilized with 6 and 22 lb phosphorus and nitrogen per acre, respectively. Standard weed control was used to maintain a weed-free environment. Table 1. Water applied through irrigation, total water input, and average corn yields by treatment. Treatment (ET) Irrigation Irrigation + Rainfall Inches inch % ET % ET % ET Page 32 / 213 Demo Report
33 Irrigation Management and Planting Density Effects on Corn Yields Results Overall, corn yields increased as irrigation levels increased (Table 1). The 5% ET treatment produced the lowest yield, which may be due to early season water stress. On the other hand, corn plants that received 1 inch of water per week were not stressed early in the season and the rainfall during the reproductive stages resulted in a significant yield advantage over the 5% ET treatment. On an average, yields of Monsanto corn products were higher than those of the competitors. Monsanto products yielded at least 24 bu/acre over the competitors at the same relative maturity 3 (Figure 1). Additionally, at each irrigation level and planting density, Monsanto corn products outperformed those of the competitor (Table 2). Across all irrigation treatments, corn yields were the lowest at the 24, planting density (Figure 2). In contrast, the highest yields were obtained at the 3, density for the 5%, 75%, and 1% ET treatments. Additionally, the yield gap between 24, and 3, planting densities progressively increased as irrigation levels increased from the 5% to 1% ET. There was not an appreciable yield response at the 36, seeds/acre Monsanto Competitors Relative Maturity Products Figure 1. Average yield of corn products by relative maturity " 5% 75% 1% Irrigation Treatment (% ET) 24, 3, 36, Figure 2. Average corn yield response to irrigation level and planting density. Table 2. Yield of corn products by relative maturity (RM) at different irrigation levels and planting densities. RM 1 inch 5% ET 75% ET 1% ET 24K** 3K 36K 24K 3K 36K 24K 3K 36K 24K 3K 36K *C C *Competitor corn product; ** 1,. Monsanto Learning Center at Gothenburg, NE / Page 33
34 MONSANTO the Irrigation Management and Planting Density Effects on Corn Yields Key Messages In general, corn products used in this trial responded positively to a planting density increase from 24, to 3, seeds/ acre across all irrigation levels (Figure 3). In contrast, some products had a negative response or did not respond to an increase in planting density from 3, and 36, seeds/acre for the 5%, 75%, and 1% ET. A yield response to the highest planting density at irrigation levels of 5% and 75% ET was not expected. However, corn yields did not respond to the highest planting density at the full water level (1% ET), which suggests that water or some other resources may have been a limiting factor at 36, seeds/acre. Legal The information discussed in this report is from a single site with four replications demonstration. This informational piece is designed to report the results of this demonstration and is not intended to infer any confirmed trends. Please use this information accordingly. Individual results may vary, and performance may vary from location to location and from year to year. This result may not be an indicator of results you may obtain as local growing, soil and weather conditions may vary. Growers should evaluate data from multiple locations and years whenever possible. Leaf Design is a registered trademark of Monsanto Company. All other trademarks are the property of their respective owners. 213 Monsanto Company SMK inch 75% ET K 3K 36K Planting Density (seeds/acre) % ET K 3K 36K 1% ET Planting Density (seeds/acre) Planting Density (seeds/acre) Planting Density (seeds/acre) C 11C Figure 3. Average and product specific yield response to planting density. Page 34 / 213 Demo Report 24K 3K 36K 1 24K 3K 36K

 and 1% ET (right) at 3, planting density.")


35 Irrigation Management and Planting Density Effects on Corn Yields Figure 4. Monsanto and competitor corn products with 111 RM at 5% ET (left) and 1% ET (right) at 3, planting density. Monsanto 223 bu/acre Monsanto 242 bu/acre Competitor 191 bu/acre Competitor 23 bu/acre Figure 5. Monsanto corn products at 5% ET (left) and 1% ET (right) at 3, planting density. 114 RM 246 bu/acre 114 RM 289 bu/acre 115 RM 238 bu/acre 115 RM 261 bu/acre Figure 6. Competitor corn products at 5% ET (left) and 1% ET (right) at 3, planting density. 111 RM 191 bu/acre 111 RM 23 bu/acre 11 RM 161 bu/acre 11 RM 192 bu/acre Monsanto Learning Center at Gothenburg, NE / Page 35
36 MONSANTO the Effect of Planting Date on Soybean Background One key factor to help maximize soybean yield potential is the planting date. In Gothenburg, yields have historically decreased as the planting date is delayed beyond May 1th. Maximizing soybean yield with the same inputs is a key to profitability and sustainability. A trial was conducted at the Monsanto Learning Center at Gothenburg, NE to investigate how planting soybean after May 1th impacts overall yield potential. The trial also examined whether products with different maturities generate different yield responses to a range of planting dates. Study Guidelines The typical soybean relative maturity ranges from 2.4 to 3.2 in the area. Three products were used: 2.3 Maturity 2.7 Maturity 3.4 Maturity Four different planting dates were investigated: May 4 May 11 May 16 June 3 Soybean was planted in a rotation following corn. Standard agronomic practices for the area were followed and irrigation was provided as needed (1.5 inches). Seed treatments were used on all soybean products to help encourage uniform emergence in cool and wet early conditions and help maintain yield potential. Results Soybean yields have historically decreased in Gothenburg when planted after May 1th; the trend in this study follows suit (Figure 1). Average /1 5/6 5/11 5/16 5/21 5/26 5/31 6/5 Planting Date Figure 1. Overall yield response by planting date. Different products generated varied yield responses across planting dates, with the 2.7 maturity producing the greatest overall yield (Figure 2) /4/213 5/11/213 5/16/213 6/3/213 Planting Date 2.3 Maturity 2.7 Maturity 3.4 Maturity Figure 2. Yield response by product. Page 36 / 213 Demo Report

 the first of May led to delayed emergence of the first planting date, though its impact was likely minimal on yield.")

37 Effect of Planting Date on Soybean Differences in leaf senescence were noticed as early as the first week of September in the soybean planted May 4 (Figure 3). Key Messages When evaluating all products together, around May 1th still appears to be the cutoff date in Gothenburg after which soybean yields appear to decrease as planting is delayed. Of the maturities evaluated, the product with a 2.7 maturity rating was recognized as having the greatest overall yield in Gothenburg in 213. Snowfall accumulation accompanied by unseasonably cool temperatures (< 5 F) the first of May led to delayed emergence of the first planting date, though its impact was likely minimal on yield. Legal The information discussed in this report is from a single site, non-replicated demonstration. This informational piece is designed to report the results of this demonstration and is not intended to infer any confirmed trends. Please use this information accordingly. Individual results may vary, and performance may vary from location to location and from year to year. This result may not be an indicator of results you may obtain as local growing, soil and weather conditions may vary. Growers should evaluate data from multiple locations and years whenever possible. ALWAYS READ AND FOLLOW PESTICIDE LABEL DIRECTIONS. Leaf Design is a registered trademark of Monsanto Company. 213 Monsanto Company JMG 2.3 Maturity 2.7 Maturity 3.4 Maturity Figure 3. Photos of soybean planted May 4 taken on September 4. Monsanto Learning Center at Gothenburg, NE / Page 37


38 MONSANTO the Row Spacing in Soybean Production Background Optimum genetics, good agronomic practices and favorable environmental conditions are necessary to help increase yield potential. Proper row spacing is an important agronomic practice when it comes to maximizing soybean yield potential. Past information from the Monsanto Learning Center at Gothenburg, NE suggests that row spacing less than 3 inches can lead to a yield advantage. Twin row configurations have shown to have several benefits including maximizing light interception, greater plant growth and development and an increase of water and nutrient uptake. Study Guidelines Will narrow row spacing provide a yield benefit over wider row configurations? Will different maturity soybean products provide different yield responses to different row spacing s? Materials and Methods Two soybean products were tested. One product with a 2.4 relative maturity (RM) and a second product with a 3.3 RM were used. The normal RM for Gothenburg is around Soybean products were planted into wheat stubble. Standard soybean weed control was practiced. The experiment was grown on irrigated and dryland. The irrigated ground received 4 inches of irrigation. Rainfall totaled 18 inches throughout the growing season. Results Under irrigated conditions, the 15-inch rows produced the greatest yields on average, followed by the twin 3-inch rows and drill 7.5- inch rows. Under dryland conditions, twin 3-inch rows produced the greatest yields on average, followed by 15-inch rows and drill 7.5-inch rows. The overall row spacing response showed that the twin 3-inch Are there any differences between irrigated and dry land, as they are typically different yielding environments, likely changing every year especially with dryland? rows produced the greatest yields on average, followed by 15-inch rows and drill 7.5-inch rows. These numbers are averaged across the varieties tested. Drill 7.5-inch Rows 15-inch Rows Twin 3-inch Rows June 24, 213 June 24, 213 June 24, 213 July 16, 213 Figure 1. Drill 7.5-inch rows Page 38 / 213 Demo Report July 16, 213 Figure inch rows July 16, 213 Figure 3. Twin 3-inch rows
39 Row Spacing in Soybean Production Key Messages The overall row spacing response showed that the twin 3 inch rows preformed best on average. Under irrigated conditions, the 15-inch rows produced the greatest yields on average Under dryland conditions, twin 3-inch rows produced the greatest yields on average Drill (7.5-inch) rows generated the lowest yields under both irrigated and dryland conditions. The results in this trial demonstrate variability in yield levels across different spacing s, and these results can change on a year to year basis. Legal The information discussed in this report is from a single site, non-replicated demonstration. This informational piece is designed to report the results of this demonstration and is not intended to infer any confirmed trends. Please use this information accordingly. For more information regarding the intellectual property protection for the seed products identified in this publication, please see Individual results may vary, and performance may vary from location to location and from year to year. This result may not be an indicator of results you may obtain as local growing, soil and weather conditions may vary. Growers should evaluate data from multiple locations and years whenever possible. Leaf Design is a registered trademark of Monsanto Company. Always read and follow grain marketing and all other stewardship practices and pesticide label directions. 213 Monsanto Company KY Figure 4. Irrigated Row Spacing Figure 5. Dryland Row Spacing Drill 7.5 inch 15 inch Twin 3 inch 2.4 RM 3.3RM Drill 7.5 inch 15 inch Twin 3 inch 2.4 RM 3.3 RM Drill 7.5 inch 15 inch Twin 3 inch Irrigated Dryland Figure 6. Row Spacing Response Monsanto Learning Center at Gothenburg, NE / Page 39


40 MONSANTO Page 4 / 213 Demo Report the Soybean Yield Response to Final Irrigation Background Past studies conducted at the Monsanto Learning Center at Gothenburg, NE have focused on soybean yield response to different irrigation rates throughout the growing season. Overall, additional irrigation improved yield compared to dryland conditions, up to a certain point. In one study, higher yields were obtained when 5% of the recommended irrigation was provided than when 1% of the recommended irrigation was provided for most of the soybean products tested. In another study, no yield difference was noted with irrigation inputs above 1% of the recommended rate. The last few irrigations of the season require some of the most important management decisions of the year as an unneeded irrigation may waste one to three inches of water and two to five gallons of diesel fuel per acre. To date, little research has been done at the Monsanto Learning Center at Gothenburg, NE regarding yield response of soybean products to final irrigation inputs at the R5 growth stage (when seed enlargement begins) and beyond. Objectives To determine soybean yield response to: an additional 2 inches of final irrigation, a normal irrigation regime, and 2 inches less than normal irrigation level at the end of the season. To determine the net return of different end-ofseason irrigation strategies. Study Guidelines Five soybean products of relative maturity (RM) ranging from 2.7 to 3.3 were used. The treatments consisted of three final irrigation rates applied after the R5 growth stage: 2 inches less than normal (irrigation until mid-r5), normal irrigation (irrigation until mid-r6), and 2 inches more than normal (irrigation until mid-r7) (Table 1). The experiment was set up in a split-plot design in which irrigation treatment served as the main plot and soybean product as the subplot. Each experimental plot measured 125 feet by 4 rows and was replicated twice for each product used. Treatments were randomized along the linear irrigation system. All soybean products were planted within each plot on May 13th, 213 in a planting density of 14, seeds per acre in 3-inch rows on corn residue. Strip tillage was performed and 6 lb of phosphorus per acre was applied. Standard weed control was used to maintain a weed-free environment. All plots were harvested on October 13th, 213. Table 1. Irrigation treatments. Treatment -2 inches Normal +2 inches Total Water Applied Through Irrigation (inches) Figure 1a. -2 inches final irrigation treatment. Image taken 9/4/213 Figure 1b. Normal irrigation treatment. Image taken 9/4/213 Figure 1c. +2 inches final irrigation treatment. Image taken 9/4/213
41 Soybean Yield Response to Final Irrigation Table 2: Cost analysis of final irrigation treatment levels. *Means with the same lowercase letter are not significantly different. Treatment Seed (cost/acre) Average Yield* (bu/acre) Gross Return (cost/acre) Water Applied (inches) Total Irrigation Cost Net Return (cost/acre) -2 inches (b) $747 7 $67 $616 Normal (b) $811 9 $87 $66 +2 inches (a) $ $17 $774 Results This study showed a direct, positive relationship between additional water applied and yield response (Figures 1a-c and Table 2). Soybean products irrigated with +2 inches of final irrigation treatment yielded significantly more than the normal irrigation and -2 inches treatments (Figure 2). Overall, total water input was not a limiting factor (precipitation plus irrigation was 22 inches across irrigation treatments) (Figure 3) however, the amount of rainfall during the R5-R6 growth stages was limited as hot and dry conditions prevailed. Because irrigation amounts were consistent across all plots up until the final irrigation treatment, it is presumed that the +2 inches irrigation treatment resulted in the yield increases of 15 and 1 bushels per acre over the -2 inches treatment and normal treatment, respectively. Net return was not negatively affected by the additional irrigation as it remained at approximately 82% of gross return for all treatments. Yield losses occurred across all soybean products with reduced irrigation after the R5 growth stage (Figure 4). Water stress conditions appeared to negatively affect longer season soybean more than short season soybean because they were likely affected at earlier reproductive stages and continued to be stressed until the end of the growing season Key Messages inches Normal +2 inches Figure 2: Yield response to irrigation treatments Overall, additional final irrigation after the R5 growth stage increased yield response for all soybean products. Net return was not negatively affected by the additional two inches of irrigation as it remained at approximately 82% of gross return for all treatments. As expected, reducing the amount of water applied during the seed enlargement stage is not a recommended practice and will likely result in yield losses. Monsanto Learning Center at Gothenburg, NE / Page 41
42 MONSANTO the Soybean Yield Response to Final Irrigation 18 Arrowsmark where supplemental irrigation was discontinued 16 VE V V5 R1 R3 R3.5 R5 R6 R7 R /13 5/2 5/27 6/3 6/1 6/17 6/24 7/1 7/8 7/15 7/22 7/29 8/5 8/12 8/19 8/26 9/2 Inches 9/9 9/16 9/23 9/3 Cumulative Rainfall -2 Inches Normal +2 Inches Figure 3: 213 rainfall and irrigation data Soybean Products -2 inches Normal +2 inches Figure 4: Yield response to irrigation treatments by product maturity Sources & Legal Irrigation effect on soybean yield Monsanto Gothenburg Learning Center Demonstration Report. Irrigation evaluations in soybean Monsanto Gothenburg Learning Center Demonstration Report. The information discussed in this report is from a single site, with two replications demonstration. This informational piece is designed to report the results of this demonstration and is not intended to infer any confirmed trends. Please use this information accordingly. Individual results may vary, and performance may vary from location to location and from year to year. This result may not be an indicator of results you may obtain as local growing, soil and weather conditions may vary. Growers should evaluate data from multiple locations and years whenever possible. Leaf Design is a registered trademark of Monsanto Company. 213 Monsanto Company CAM. Page 42 / 213 Demo Report
43 Soybean Product Response to Irrigation Quantity and Strategy Background Proper irrigation management, based on product-specific response, is a critical component for optimizing soybean productivity and profitability. A demonstration trial was conducted to evaluate the response of soybean products to different irrigation amounts based on evapotranspiration (ET), determine strategy that can provide the best use of limited irrigation water, and assess the level of irrigation that can result in the maximum return in water investment. Study Guidelines Soybean products with maturity groups ranging from 2.1 to 3.3 were planted on 5/1/213 at 14, seeds/acre in 3-inch rows on corn residue. Plot size: 2 feet x 4 rows. Approximately 19 inches of precipitation occurred from April through October, which resulted in a total water input of at least 22 inches. A dryland check plot with the same soybean products was compared to irrigated plots. The 5 and 75% treatments were applied as a strategy of withholding water until later growth stages (Figure 1). Delaying irrigation in the 5 and 75% treatments stressed the plants early but provided more water to the crop during the seed fill stage. Irrigation was initiated in the 1 and 125% treatments near the R1 growth stage (Figure 1) when SoyWater, an irrigation scheduling program, indicated water was needed. Table 1. Irrigation Treatments Used in a Demonstration Trial Conducted at Gothenburg Monsanto Learning Center, NE in 213. % ET Applied Water (inches) Dryland Plots were strip-tilled and 6 lb of phosphorus/acre was applied. A standard weed control program was used. Experimental design was a split-plot with irrigation treatments as main plot, soybean products as subplot, and each treatment was replicated four times. A 3 foot buffer zone was left between the treatments to prevent lateral water movement across treatments. Plots harvested: 1/13/213. Results Across maturity groups, maximum average yield of 89 bu/acre was produced in the 75% ET treatment while minimum average yield was recorded at the 5% ET. There was no significant yield difference between 75 and 1% ET treatments (Table 2). Figure 2 shows that across maturity groups, maximum average water use efficiency (WUE) occurred at 5% with 3.6 bu/inch total water, while WUE decreased with additional water. Regardless of the maturity group, the largest marginal return was for the 5% followed by the 75% water regime. Due to lack of positive yield response at 1 and 125% ET, there was no economical benefit for additional water (Figure 3). Within the maturity groups, soybean products in the 2.7 group had the largest response to water application and overall mean yield (Figure 4). These results indicate that planting products in the 2.7 maturity group may result in higher yield potential. Key Messages Generally, there was a positive yield response to water applications with maximum average yield at 75% ET, while yield at 125% was reduced, compared to the maximum. Similar results have been obtained in previous years. In 21, 8 out of 12 soybean products produced the highest yields at the 5% irrigation level, and in a 211 study 8 out of 11 products yielded more at the 5% irrigation level versus the full irrigation treatment. Only in an extremely dry 212, the 1 and 125% irrigation levels produced the highest yield. Planting soybean products in the 2.7 maturity group may result in higher yield potential in this location. Monsanto Learning Center at Gothenburg, NE / Page 43
44 MONSANTO the Soybean Product Response to Irrigation Quantity and Strategy Excessive water, beyond 75% ET, can lead to potential yield reduction and reduced net profitability. Yield reduction at 125% ET might be due to nutrient leaching, plant lodging, and anaerobic conditions that can cause root rots and leaf diseases. Irrigation trial results are not consistent from year to year: 212 trial showed no yield difference between 1 and 125% water treatments, while the 213 trial showed higher yield at 1 than 125% ET. In general, withholding the water early (5 and 75% ET) and applying it during the most critical growth stages provided the best return on water investment. This irrigation strategy can certainly be the most appropriate in a water-limited situation. 18 Legal The information discussed in this report is from a single site with four replications demonstration. This informational piece is designed to report the results of this demonstration and is not intended to infer any confirmed trends. Please use this information accordingly. Individual results may vary, and performance may vary from location to location and from year to year. This result may not be an indicator of results you may obtain as local growing, soil and weather conditions may vary. Growers should evaluate data from multiple locations and years whenever possible. Leaf Design is a registered trademark of Monsanto Company. All other trademarks are the property of their respective owners. 213 Monsanto Company SMK 16 VE V V5 R1 R3 R3.5 R5 R6 R7 R Inches Inches /1 5/17 5/24 5/31 6/7 6/14 6/21 6/28 7/5 7/12 7/19 7/26 8/2 8/9 8/16 8/23 8/3 9/6 9/13 9/2 9/27 Date Cumulative rainfall 5% 75% 1% 125% Figure 1. Irrigation scheduling for the 5, 75, 1, and 125% of ET treatments and soybean growth stages. Page 44 / 213 Demo Report
45 Soybean Product Response to Irrigation Quantity and Strategy Table 2. Yields and Cost Analysis of Irrigation Treatments. Water Regime (% ET) Irrigation (inches) Irrigation + Rain (inches) Yield (bu/acre) Avg WUE* (bu/inch) Marginal WUE** (bu/inch) Marginal Return ($/inch) Dryland *Average Water Use Efficiency = Yield/(irrigation + rain); **Marginal Water Use Efficiency = Change in yield/change in water applied Yield Water use efficiency Dryland 5% 75% 1% 125% Water Regime (% ET) Water Use Efficiency (bu/inch) Figure 2. Yield Response to Irrigation and Average Water Use Efficiency (WUE). Monsanto Learning Center at Gothenburg, NE / Page 45
46 MONSANTO the Soybean Product Response to Irrigation Quantity and Strategy Marginal return $47 Yield $25 Figure 3. Yield Response to Inches of Water Applied and Marginal Return. -$18 -$ Water Applied (inches) Marginal Return ($/inch) % 75% 1% 125% Figure 4. Yield Response to Irrigation Treatments by Soybean Maturity Group. Page 46 / 213 Demo Report Soybean Maturity Group
47 Notes Monsanto Learning Center at Gothenburg, NE / Page 47

 537-45 www.")
48 the MONSANTO Monsanto Learning Center Hwy 47 Gothenburg, NE (38)
 of 2.1, 2.4, 2.7, 2.")
49 MONSANTO the Irrigation Management in Soybeans 213 Demonstration Report Monsanto Learning Center at Gothenburg, NE % 13.75" 5% 11.75" 6% 1." UE 9." UL 6.5" Precipitation and Irrigation Total OE 13." OL 14.75" Figure 2. Yield response of five Genuity Roundup Ready 2 Yield soybean products with relative maturity (RM) of 2.1, 2.4, 2.7, 2.9, and 3.3 to timing and amount of irrigation in replicated demonstration trial conducted in 213 at Gothenburg Learning Center, Gothenburg, NE. Legal: The information discussed in this report is from a single site, three replications demonstration. This informational piece is designed to report the results of this demonstration and is not intended to infer any confirmed trends. Please use this information accordingly. Monsanto Company is a member of Excellence Through Stewardship (ETS). Monsanto products are commercialized in accordance with ETS Product Launch Stewardship Guidance, and in compliance with Monsanto s Policy for Commercialization of Biotechnology-Derived Plant Products in Commodity Crops. This product has been approved for import into key export markets with functioning regulatory systems. Any crop or material produced from this product can only be exported to, or used, processed or sold in countries where all necessary regulatory approvals have been granted. It is a violation of national and international law to move material containing biotech traits across boundaries into nations where import is not permitted. Growers should talk to their grain handler or product purchaser to confirm their buying position for this product. Excellence Through Stewardship is a registered trademark of Biotechnology Industry Organization. Individual results may vary, and performance may vary from location to location and from year to year. This result may not be an indicator of results you may obtain as local growing, soil and weather conditions may vary. Growers should evaluate data from multiple locations and years whenever possible. ALWAYS READ AND FOLLOW PESTICIDE LABEL DIRECTIONS. Roundup Ready crops contain genes that confer tolerance to glyphosate, the active ingredient in Roundup brand agricultural herbicides. Roundup brand agricultural herbicides will kill crops that are not tolerant to glyphosate. Genuity, Roundup Ready 2 Yield, Roundup Ready and Roundup are registered trademarks of Monsanto Technology LLC. Leaf Design is a registered trademark of Monsanto Company. All other trademarks are the property of their respective owners. 214 Monsanto Company SMK
Rainout Shelter: A Tool for Understanding the Link between Soil Water, Irrigation, and Corn Yield
 Monsanto Learning Center at Gonburg, NE Rainout Shelter: A Tool for Understanding Link between Soil Water, Background Several studies have evaluated corn yield response to water applied. However, such
Response of DEKALB Brand Corn Products to Row Configuration and Population
 Response of DEKALB Brand Corn Products to Row Configuration and Population 2014 Learning Center Demo Report Monsanto Learning Center at Scott, MS Demo Report Title Study Guidelines A corn demonstration
MONSANTO LEARNING CENTER AT GOTHENBURG, NE 2017 DEMONSTRATION REPORTS
 MONSANTO LEARNING CENTER AT GOTHENBURG, NE 2017 DEMONSTRATION REPORTS Demonstration Report MONSANTO LEARNING CENTER AT GOTHENBURG, NE Stay in touch. We d love to host you for a visit and share knowledge
Effects of Corn Population
 Effects of Corn Population Dave Heimkes 30-inch row spacing Twin-row spacing Skip-row 2-1-2 or 2-2-2 arrangement Plant Population Through the Years Corn populations have been steadily increasing over the
Results from the Rainout Shelter
 The Rainout Shelter (ROS) was built to help precisely control and monitor the amount and timing of water on an outdoor research plot. In the ROS, relationships between plants, water, and soils can be studied
Monsanto Learning Center at Scott, Mississippi
 Monsanto Learning Center at Scott, Mississippi 2013 Demonstration Report Dear Learning Center Visitor, Hello from the Monsanto Learning Center at Scott, Mississippi. I want to thank you for your interest
CORN ROOTWORM PROTECTION MANAGEMENT
 orn rootworm (RW) is one of the most difficult pests to control and can cause substantial annual crop losses. Typically, management practices may include crop rotation and planting corn traits targeting
EVALUATION OF COVER CROP TERMINATION METHODS IN CORN PRODUCTION
 EVALUATION OF COVER CROP TERMINATION METHODS IN CORN PRODUCTION TRIAL OVERVIEW In sustainable farm operations, cover cropping is an effective system to manage soil health, biodiversity, weeds, erosion,
Monsanto Learning Center at Gothenburg, NE Demonstration Reports
 Monsanto Learning Center at Gothenburg, NE 2016 Demonstration Reports Demonstration Report MONSANTO LEARNING CENTER AT GOTHENBURG, NE Welcome... to the 2016 Demonstration Reports from your Learning Center
Illinois. Indiana. Seedsmanship At Work Channel Corn Performance Summaries from F.I.R.S.T
 Channel Seed sources the highest-performing genetics globally, and tests them locally to allow Channel Seedsman to make the best recommendations on your fields. Below is the 2013 corn top performance summary
MONSANTO LEARNING CENTER AT MONMOUTH, IL 2017 DEMONSTRATION REPORTS
 MONSANTO LEARNING CENTER AT MONMOUTH, IL 2017 DEMONSTRATION REPORTS Demonstration Report MONSANTO LEARNING CENTER AT MONMOUTH, IL Thank you for visiting the Monsanto Learning Center at Monmouth, IL this
Wensink Premium Seed Corn
 Wensink Premium Seed Corn All the Performance at Half the Price 2019 Fall Seed Corn Program 11/2/18 Early Order Seed Corn Program has begun and will end January 4, 2019. We have six new hybrids this year,
Response of 4 Asgrow Brand Soybean Products to Common Planting Errors
 Response of 4 Asgrow Brand Soybean Products to Common Planting Errors 2016 Learning Center Demo Report Monsanto Learning Center at Scott, MS BACKGROUND Growers often express concern about planting mistakes
MONSANTO LEARNING CENTER AT SCOTT, MISSISSIPPI 2016 DEMONSTRATION REPORTS
 MONSANTO LEARNING CENTER AT SCOTT, MISSISSIPPI 2016 DEMONSTRATION REPORTS Dear Learning Center Visitor, Hello from the Monsanto Learning Center at Scott, Mississippi. I want to thank you for your patronage
Alfalfa. Roundup Ready Alfalfa. Channel 2014 Seed Guide 47
 I ve used Channel seed for four or five years now. My Seedsman always evaluates my fields and helps me determine which products are suited for my particular ground. He comes down once or twice a month
 FORAGES AND SMALL SEED PRODUCTS 4 STAR SEED COMPANY offers an extensive lineup of alfalfas and other forages, including a wide variety of pasture grasses, cover crops and turf grasses. Consult your 4 Star
COMMITTED TO HELP YOU GROW.
 OUR PROMISE COMMITTED TO HELP YOU GROW. Axis Seed is the fastest-growing independent seed company in the U.S. because of our unique business model. Through our locally owned Independent Regional Companies
Yield(Bu/A) CHANNEL VT2PRIB $ VT2PRIB CHANNEL VT2PRIB $ VT2PRIB
 CHANNEL VT2PRIB $ VT2PRIB CHANNEL VT2PRIB $ VT2PRIB") Travis Wiemann Brand Entry Number Product Yield(Bu/A) Gross Income($) Trait Harvest Moisture(%) Relative Maturity CHANNEL 1 185-15VT2PRIB 204.35 $745.89 VT2PRIB 17.5 85 Harvest Population CHANNEL 2 186-31VT2PRIB
Travis Wiemann Brand Entry Number Product Yield(Bu/A) Gross Income($) Trait Harvest Moisture(%) Relative Maturity CHANNEL 1 185-15VT2PRIB 204.35 $745.89 VT2PRIB 17.5 85 Harvest Population CHANNEL 2 186-31VT2PRIB
Response of Deltapine Cotton Varieties to Different PGR Regimes
 Response of Deltapine Cotton Varieties to Different PGR Regimes 216 Learning Center Demo Report Monsanto Learning Center at Scott, MS BACKGROUND Cotton varieties respond differently to plant growth regulator
Monsanto Learning Center at Gothenburg, Nebraska 2014 Demonstration Reports
 Monsanto Learning Center at Gothenburg, Nebraska 2014 Demonstration Reports MONSANTO the LEARNING CENTER Follow us! Scan the codes below to visit our website, and follow us on Facebook and Twitter for
SOUTHERN STATES HYBRID SEED CORN
 Southern States has corn hybrids with the built-in convenience of trait combinations to fit your needs. A key part of producing a profitable corn program is to select the right hybrids for your growing
Monsanto Learning Center at Gothenburg, NE 2015 Demonstration Reports
 Monsanto Learning Center at Gothenburg, NE 2015 Demonstration Reports Follow us! Scan the codes below to visit our website, and follow us on Facebook and Twitter for information and resources all year.
AGRONOMIC TRAITS OUTSTANDING PERFORMANCE IN TAYLOR SELECT RESEARCH WITH STRONG SOUTHERN MOVEMENT (#1 IN IN DAY MATURITY)
") 2019 PRODUCT GUIDE CORN HYBRIDS 8801 VT2Pro RIB TALL, FLEX EARED HYBRID WITH OUTSTANDING HEAT AND DROUGHT STRESS TOLERANCE MAINTAINS EAR HEIGHT UNDER SEVERE STRESS VERY GOOD STALK AND ROOT STRENGTH, LATE
2019 PRODUCT GUIDE CORN HYBRIDS 8801 VT2Pro RIB TALL, FLEX EARED HYBRID WITH OUTSTANDING HEAT AND DROUGHT STRESS TOLERANCE MAINTAINS EAR HEIGHT UNDER SEVERE STRESS VERY GOOD STALK AND ROOT STRENGTH, LATE
Soybean Response to Seeding Rates in 30-Inch Row Spacing
 Background Choosing the optimal soybean seeding rate can improve profitability in soybean production. Many recent studies on soybean seeding rates in the High Plains suggest that higher seeding rates may
OUR STORY. Working with Axis is unlike your relationship with any other company, and it won t take long to see why.
 OUR STORY Axis Seed is the fastest-growing independent seed company in the U.S., thanks to our unique business model. Through locally owned Independent Regional Companies (IRCs), you have access to the
SILAGE AND GRAZING CORN
 SILAGE AND GRAZING CORN BrettYoung is pleased to bring the Elite brand of corn hybrids to Western Canada. Selected for the undeniable advantages it provides for ruminant feeding, Elite HTE (High Total
CONVENTIONAL, STRIP, AND NO TILLAGE CORN PRODUCTION UNDER DIFFERENT IRRIGATION CAPACITIES
 CONVENTIONAL, STRIP, AND NO TILLAGE CORN PRODUCTION UNDER DIFFERENT IRRIGATION CAPACITIES Dr. Freddie Lamm Research Irrigation Engineer Email: flamm@ksu.edu Dr. Rob Aiken Research Crop Scientist Email:
DELIVERING A SYSTEM FOR HIGHER YIELD IN CANOLA
 DELIVERING A SYSTEM FOR HIGHER YIELD IN CANOLA System of Solutions Come Together in Our Pipeline Development Process Monsanto s R&D Pipeline Designed to Address Farmers Challenges Increase Yield Impact
Evaluation of DEKALB Corn Products Planted in Different Row Configurations
 Evaluation of DEKALB Corn Products Planted in Different Row Configurations 216 Learning Center Demo Report Monsanto Learning Center at Scott, MS BACKGROUND A demonstration was established to compare the
Monsanto Learning Center at Monmouth, IL Demonstration Reports
 Monsanto Learning Center at Monmouth, IL 2016 Demonstration Reports Demonstration Report MONSANTO LEARNING CENTER AT MONMOUTH, IL Thank you for visiting the Monsanto Learning Center at Monmouth, IL this
Chan Mazour Manager, Monsanto Learning Center, Gothenburg, NE. The Gothenburg Learning Center Team. Monsanto Technology Development
 Hello from a relatively warm and dry Gothenburg, Nebraska, we have finalized our results from the 2011 season. This book contains results from the demonstration plots that were in the field at Gothenburg
Field Research Book 2018 Edition
 Field Research Book 2018 Edition 4D6N18778 Contact your local representative for more information or visit cropscience.bayer.com @Bayer4Crops Welcome to the first edition of the Field Research Book provided
Acceleron Seed Treatment Products
 Acceleron Seed Treatment Products Acceleron Soybean Seed Treatment Products 2011 Soybean Seed Treatment Options Acceleron Seed Treatment Products: Two Offers Disease Protection & Plant Health Insect &
Evaluations of the FLEX Characteristics of Three DEKALB Brand Corn Products
 Evaluations of the FLEX Characteristics of Three DEKALB Brand Corn Products 2016 Learning Center Demo Report Monsanto Learning Center at Scott, MS BACKGROUND Study Background: Corn products can vary in
Corn Response to Timing of Water Application
 Background Due to declining groundwater levels in Ogallala Aquifer, primary source of irrigation water for much of Great Plains, farmers in this region are facing reduced pumping capacities and restrictions
Response of DEKALB Brand Corn Products to Planting Population and Nitrogen Fertility
 Response of DEKALB Brand Corn Products to Planting Population and Nitrogen Fertility 2017 Learning Center Demo Report Monsanto Learning Center at Scott, MS BACKGROUND This trial was conducted to measure
Page Title SEED (7333) MIDLANDGENETICS.COM PRODUCT GUIDE BUILT BY FAMILY. BACKED BY PERFORMANCE. TITLE. Rating Scale: 1-5, 1 = Best
 MIDLANDGENETICS.COM PRODUCT GUIDE BUILT BY FAMILY. BACKED BY PERFORMANCE. TITLE. Rating Scale: 1-5, 1 = Best") 800.819.SEED (7333) MIDLANDGENETICS.COM 2 019 PRODUCT GUIDE BUILT BY FAMILY. BACKED BY PERFORMANCE. Page Title TITLE Rating Scale: 1-5, 1 = Best 1 Built by Family Our family has been immersed in the seed
800.819.SEED (7333) MIDLANDGENETICS.COM 2 019 PRODUCT GUIDE BUILT BY FAMILY. BACKED BY PERFORMANCE. Page Title TITLE Rating Scale: 1-5, 1 = Best 1 Built by Family Our family has been immersed in the seed
2013 SOYBEANS Individual Plot Yield Report
 JOE GARLAND WASHINGTON COURTHOUSE, Ohio Fayette COUNTY Planted: 05/16/2013 Tillage: REDUCED Harvested: 10/28/2013 Row Width: 30 In. Irrigation: No 1 ASGROW AG2933 GENRR2Y 2.9 61.60 13.70 739.20 2 ASGROW
Corn Yield Response to Relative Maturity and Plant Population
 Background Corn product selection is normally within the relative maturity (RM) for the geographic location. This is due to the duration of the growing season which affects the growing degree units (GDUs)
It s the customer service and the consistent
 It s the customer service and the consistent results we ve seen from seed in yield and performance that have made the difference in our fields. Our Channel Seedsman has worked really hard for me, giving
2011 SSF and Acceleron Webinar
 FOLLOW ON-SCREEN PROMPTS TO CALL IN Both Phone and CPU Speaker Options Available 2011 SSF and Acceleron Webinar Including: Maximizing Seed Service Fees 2011 Monsanto Trait Bag and Tag Labeling Acceleron
freedom to choose proven to perform 2017 product guide
 freedom to choose proven to perform 2017 product guide Front row: Clyde Sylvester, Jay Ronnebaum, Wes Sylvester, Brenda Farrar, Angela Sylvester, Jake Sylvester, Glen Pyle, Sandy Sylvester, Kay Selman,
MONSANTO COMPANY. University Startups Conference Virginia Ursin PhD Prospecting Lead, Monsanto Strategy
 MONSANTO COMPANY University Startups Conference 2013 Virginia Ursin PhD Prospecting Lead, Monsanto Strategy virginia.ursin@monsanto.com partnering@monsanto.com Our Products And Innovation Providing Tools
quarryseed.com
 quarryseed.com 1-888-274-9243 Quarry Seed is Western Canada s premier seed distributor focusing on exclusive soybean genetics as well as added value crop inputs. We offer the best varieties in the industry
Soil Amendment and Foliar Application Trial 2016 Full Report
 Soil Amendment and Foliar Application Trial 216 Full Report Overview: This report summarizes Ohio State Soil Fertility Lab s efforts of a third party evaluation of proprietary soil amendments and foliar
Tillage and Irrigation Capacity Effects on Corn Production
 An ASABE Meeting Presentation Paper Number: 072283 Tillage and Irrigation Capacity Effects on Corn Production Freddie R. Lamm, Professor and Research Irrigation Engineer KSU Northwest Research-Extension
2019 SEED GUIDE. An American Family Owned Seed Company
 2019 SEED GUIDE An American Family Owned Seed Company RIBBON Technology in agriculture is changing at a rapid pace. Agriculture is quickly catching up to other industries in terms of the technological
Pioneer TRIALS Reporting Location Summary Report. 10/24/2018 Page 1 of 5. North BBH PKP Xtend SB RM OFGB _0013 Soybeans Corn
 Sales Agency : Gerner Ag, IncBP Name : Geffre; ThomasBP Id : 1010108716 Trial Location : Lat :nulllong: nullstate :NDPostal Code :58040 Trial Type : Irrigation : Tillage : Weighing Device : [ ]Agronomic[
Insect Protection Technologies From Dow AgroSciences TECHNOLOGY USE AGREEMENT
 CORN PRODUCT USE GUIDE Refuge Advanced PowerCore TM TM TM CANADA EDITION This Product Use Guide (Guide) sets forth the requirements for growing corn hybrids with Bacillus thuringiensis (Bt) traits, including
2017 PLANTING GUIDE Example Guide
 2017 PLANTING GUIDE Example Guide TABLE OF CONTENTS 2 INTRODUCTION 3 Field 1 4 Field 2 6 LEGAL 7 3 DATE CREATED: January 18th, 2017 Add additional information for your farmer to include at the beginning
Replanting Options in DEKALB Brand Corn Products
 Replanting Options in DEKALB Brand Corn Products 2016 Learning Center Demo Report Monsanto Learning Center at Scott, MS BACKGROUND The 2016 planting season presented many challenges in establishing corn
Rick Mascagni and Kylie Cater
 Influence of Hybrid, Seeding Rate, and Nitrogen Fertilizer Rate on Yield Performance of Two Corn Hybrids Differing in Ear Flex Under Varying Soil Moisture Conditions on Mississippi River Soils Rick Mascagni
Roundup Ready Xtend Crop System Benefits and Weed Management Recommendations
 1 Roundup Ready Xtend Crop System Benefits and Weed Management Recommendations It s the System that Makes the Difference Key Reasons Demand for Roundup Ready Xtend Crop System Expected to More than Double
Quest for 300 Bushel Corn
 Quest for 300 Bushel Corn 9 billion people by 2050 requires a doubling of grain production including corn 300 bu corn produced each year in the U.S. National Corn Growers Contest Quest for 300 Bushel Corn
Roundup Ready Xtend Crop System Benefits and Weed Management Recommendations
 1 Roundup Ready Xtend Crop System Benefits and Weed Management Recommendations It s the System that Makes the Difference Key Reasons Demand for Roundup Ready Xtend Crop System Expected to More than Double
TABLE OF CONTENTS TECHNOLOGY PAGE 2 CORN PRODUCTS 3-19 CORN CHARACTERISTICS 21 REFUGE MAPS 22 ALFALFA PRODUCTS ALFALFA CHARACTERISTICS 29
 017 SEED GUIDE TABLE OF CONTENTS TECHNOLOGY PAGE CORN PRODUCTS - 19 CORN CHARACTERISTICS 1 REFUGE MAPS ALFALFA PRODUCTS 5-8 ALFALFA CHARACTERISTICS 9 LEGAL 0 1 017 Roth Seed Guide TECHNOLOGY RR Roundup
CLEAN FIELDS. BIG INCENTIVES. MADE SIMPLE.
 CLEAN FIELDS. BIG INCENTIVES. MADE SIMPLE. Earn big incentives with qualifying products from Roundup Ready PLUS Crop Management Solutions. OPEN FOR MORE INCENTIVES CLEAN & SIMPLE Roundup Ready PLUS Crop
Roundup Ready Xtend Crop System Benefits and Weed Management Recommendations
 1 Roundup Ready Xtend Crop System Benefits and Weed Management Recommendations It s the System that Makes the Difference Key Reasons Demand for Roundup Ready Xtend Crop System Expected to More than Double
Impact of Planting Date and Maturity Group Selection on Soybean Yield
 Date and Maturity Group Selection on Soybean Yield 2014 Learning Center Monsanto Learning Center at Scott, MS Background Nearly 25 years of research in Mississippi has demonstrated that soybean products
Roundup Ready Xtend Crop System Benefits and Weed Management Recommendations
 1 Roundup Ready Xtend Crop System Benefits and Weed Management Recommendations It s the System that Makes the Difference Key Reasons Demand for Roundup Ready Xtend Crop System Expected to More than Double
MONSANTO DOW AGROSCIENCES COLLABORATIVE AGREEMENT:
 MONSANTO DOW AGROSCIENCES COLLABORATIVE AGREEMENT: : NEW INDUSTRY-STANDARD STACKED-TRAIT PLATFORM Sept. 4, 2007 Forward-Looking Statements Certain statements contained in this presentation are "forward-looking
Nitrogen dynamics with a rye cover crop
 2017 Integrated Crop Management Conference - Iowa State University 161 Nitrogen dynamics with a rye cover crop John E. Sawyer, professor, Agronomy, Iowa State University; Swetabh Patel, graduate assistant,
Fertilizer Placement Options Demonstration
 Fertilizer Placement Options Demonstration -- UNL South Central Agricultural Laboratory -- Final Report, Jan. 21 Glen P. Slater Richard B. Ferguson Rationale Nebraska corn producers continually strive
Large Plot Evaluation of Asgrow Soybean Products SLC MS Learning Center Demo Report Monsanto Learning Center at Scott, MS
 Large Plot Evaluation of Asgrow Soybean Products SLC MS 2017 Learning Center Demo Report Monsanto Learning Center at Scott, MS BACKGROUND 14 Asgrow soybean brand products were planted at the Monsanto Learning
Maximizing the Value of Foliar Fungicides in Corn by Mark Jeschke, Agronomy Research Manager
 CROP INSIGHTS Summary Maximizing the Value of Foliar Fungicides in Corn by Mark Jeschke, Agronomy Research Manager Pioneer Hi-Bred has conducted extensive research to better understand the value of foliar
DuPont Pioneer North America Harvest Data
 DuPont Pioneer 2012 North America Harvest Data Regulation G The attached charts include company information that does not conform to generally accepted accounting principles (GAAP). Management believes
Fertilizer Management
 2 5 Section 5 Fertilizer Management Lloyd Murdock, John Grove, and Greg Schwab The most important first step in your fertilizer management program is to take a soil sample. Except for nitrogen (N), your
DELAWARE HYBRID FIELD CORN PERFORMANCE TRIALS
 C O O P E R A T I V E B U L L E T I N # 1 4 2 DELAWARE HYBRID FIELD CORN PERFORMANCE TRIALS 29 University of Delaware College of Agriculture and Natural Resources Agricultural Experiment Station Cooperative
Illinois. Seedsmanship At Work Channel Corn Performance by County from F.I.R.S.T.
 2013 Channel Corn Channel Seed sources the highest-performing genetics globally, and tests them locally to allow Channel Seedsman to make the best recommendations on your fields. Below is the 2013 corn
Roundup Ready PLUS Crop Management Solutions A platform designed to provide you the tools for effective, economical and sustainable weed control.
 CROP MANAGEMENT SOLUTIONS 2018 REGIONAL GUIDE Roundup Ready PLUS Crop Management Solutions A platform designed to provide you the tools for effective, economical and sustainable weed control. EXPERT RECOMMENDATIONS
UNIVERSITY OF ILLINOIS AGRONOMY DAY. agronomyday.cropsci.illinois.edu
 UNIVERSITY OF ILLINOIS AGRONOMY DAY agronomyday.cropsci.illinois.edu AGRONOMY DAY MAP Tour B Drop Off B1 B2 B3 Tour D Handicap Parking Exhibitor Parking General Parking B4 Tour B Pick Up Lunch Pick Up
2016 Product Use Guide for Enlist Cotton
 2016 Product Use Guide for Enlist Cotton 1 WELCOME TO ENLIST AHEAD Start out right with the Enlist Ahead management resource Enlist Ahead is a management resource that helps you get the best results from
COTTON PRODUCT USE GUIDE
 COTTON PRODUCT USE GUIDE U.S. Edition WideStrike Insect Protection WideStrike 3 Insect Protection This Product Use Guide sets forth the requirements for growing cotton containing WideStrike Insect Protection
YES. Martz-Spears Seed CARROLL IL YES
 SM 4/26/2016 ot Tiled 35,500 CALL L Soil Texture CLAY LAM Corner Latitude Longitude SYBA 1st ow ront 42.058 89.802 Martz-Spears arms Center rive Lanark, L avid Minssen MAKT VLPMT 9/28/2016 MMM CPAT SGAT
Soil Amendment and Foliar Application Trial 2015 Full Report. Overview:
 Soil Amendment and Foliar Application Trial 215 Full Report Overview: In 215, the Soil Fertility Lab at Ohio State started offering a third party evaluation of proprietary soil amendments and foliar applications
Grow Your 2019 PRODUCT GUIDE
 Grow Your 2019 PRODUCT GUIDE Nothing HOLDS MORE PROMISE THAN A SEED. We built our business on a simple promise. 'We will sell no seed we wouldn t be happy to plant on our own farm.' That promise is: Powered
CORN INSECTICIDE SEED TREATMENT AND FOLIAR FUNGICIDE EFFECTS ON CORN RESPONSE TO FERTILIZER NITROGEN
 CORN IECTICIDE SEED TREATMENT AND FOLIAR FUNGICIDE EFFECTS ON CORN RESPOE TO FERTILIZER NITROGEN S. A. Ebelhar, C. D. Hart, and C. A. Bradley S. A. Ebelhar is an agronomist and C. D. Hart is a research
YieldGard VT Triple : the stacked hybrids with enhanced trait performance.
 YieldGard VT Triple YieldGard VT Triple : the stacked hybrids with enhanced trait performance. Yield Protection for Full Genetic Potential Improved Consistency Better Insect Protection Better Root Protection
On-Farm Evaluation of Twin-Row Corn in Southern Minnesota (2010 to 2012) Stahl, Lizabeth A.B. and Jeffrey A. Coulter
 Stahl, Lizabeth A.B. and Jeffrey A. Coulter") On-Farm Evaluation of Twin-Row Corn in Southern Minnesota (2010 to 2012) Stahl, Lizabeth A.B. and Jeffrey A. Coulter INTRODUCTION AND OBJECTIVES Growers are continually striving to increase corn yield
On-Farm Evaluation of Twin-Row Corn in Southern Minnesota (2010 to 2012) Stahl, Lizabeth A.B. and Jeffrey A. Coulter INTRODUCTION AND OBJECTIVES Growers are continually striving to increase corn yield
2011 Protocol for On-Farm Research Trials: Evaluating Early-Applied Foliar Fungicide to Corn
 -1-2011 Protocol for On-Farm Research Trials: Evaluating Early-Applied Foliar Fungicide to Corn Kiersten Wise (Dept. of Botany & Plant Pathology, kawise@purdue.edu) and RL (Bob) Nielsen (Dept. of Agronomy,
IRRIGATION CAPACITY AND PLANT POPULATION EFFECTS ON CORN PRODUCTION USING SDI
 IRRIGATION CAPACITY AND PLANT POPULATION EFFECTS ON CORN PRODUCTION USING SDI Freddie R. Lamm Professor & Research Irrigation Engineer K-State Research and Extension Northwest Research-Extension Center
Location Traits : (in) (bu/a 56#)
 (bu/a 56#)") Sales Agency : Peterson Seeds IncBP Name : Do Not Use NameBP Id : 17238602 Trial Location : Lat :nulllong: nullstate :SDPostal Code :57465 Trial Type : Irrigation : Tillage : Weighing Device : [ ]Agronomic[
Sales Agency : Peterson Seeds IncBP Name : Do Not Use NameBP Id : 17238602 Trial Location : Lat :nulllong: nullstate :SDPostal Code :57465 Trial Type : Irrigation : Tillage : Weighing Device : [ ]Agronomic[
Roundup Ready Xtend Crop System Benefits and Weed Management Recommendations
 1 Roundup Ready Xtend Crop System Benefits and Weed Management Recommendations It s the System that Makes the Difference Key Reasons Demand for Roundup Ready Xtend Crop System Expected to More than Double
MIKE & SAMANTHA MILLER
 201 9 SEED GUIDE E A S T E R N C A N A DA MIKE & SAMANTHA MILLER 3rd Generation Rodney, ON To view the Miller s full story, visit: DEKALB.CA/farmer-stories Everything we do is to make sure the opportunities
SUN PRAIRIE SEEDS 2018 PRODUCT CATALOG CORN AND SOYBEANS
 SUN PRAIRIE SEEDS 2018 PRODUCT CATALOG CORN AND SOYBEANS SUN PRAIRIE SEEDS TEAM IN 1937, Champaign County Seed Company was born of the needs of agriculture. Founded by six progressive farmers and agriculturists,
USE OF STRIP-TILLAGE FOR CORN PRODUCTION IN KANSAS
 USE OF STRIP-TILLAGE FOR CORN PRODUCTION IN KANSAS W.B. Gordon, R.E., Lamond, and L.J. Ferdinand Department of Agronomy Kansas State University, Manhattan, KS 66506 bgordon@oznet.ksu.edu. (785) 335-2836
Genuity Roundup Ready Alfalfa allows you to drive more value per acre
 MANAGEMENT GUIDE Genuity Roundup Ready Alfalfa allows you to drive more value per acre Easy and Convenient GENUITY ROUNDUP READY ALFALFA MANAGEMENT Quality Forage Quality Increase Alfalfa Dry Matter as
Water Savings from Crop Residue in Irrigated Corn
 Water Savings from Crop Residue in Irrigated Corn Norman L. Klocke Professor, Water Resources Engineer Kansas State University Garden City, Kansas Voice: 620-276-8286 Fax: 620-276-6028 Email: nklocke@ksu.edu
Todd P. Trooien South Dakota State University Agricultural and Biosystems Engineering Brookings, South Dakota
 EFFECT OF DRIPLINE DEPTH ON FIELD CORN PRODUCTION IN KANSAS Freddie R. Lamm Kansas State University Northwest Research-Extension Center Colby, Kansas flamm@ksu.edu Todd P. Trooien South Dakota State University
Purdue On-Farm Nitrogen Rate Trial Protocol
 - 1 - Purdue On-Farm Nitrogen Rate Trial Protocol Bob Nielsen (rnielsen@purdue.edu, 765-494-4802) and Jim Camberato (jcambera@purdue.edu, 765-496-9338), Purdue Agronomy This protocol describes the design
2012 Minnesota Canola Production Center (CPC)
") 2012 Minnesota Canola Production Center (CPC) Cooperative Project with the Minnesota Canola Council and the University of Minnesota Field Summary and Research Report December 11, 2012 Donn Vellekson and
2012 Minnesota Canola Production Center (CPC) Cooperative Project with the Minnesota Canola Council and the University of Minnesota Field Summary and Research Report December 11, 2012 Donn Vellekson and
RESULTS OF AGRONOMIC AND WEED SCIENCE RESEARCH CONDUCTED IN SOUTH CENTRAL MONTANA
 RESULTS OF AGRONOMIC AND WEED SCIENCE RESEARCH CONDUCTED IN SOUTH CENTRAL MONTANA - 2004 The Annual Report of the Investigations at and Administration of the Southern Agricultural Research Center, Huntley,
Bruce Potter, Jeff Irlbeck and Jodie Getting, University of Minnesota Department of Entomology and Southwest Research and Outreach Center
 Trial: 2006-Headline Corn The effect of Headline fungicide on the yield of four corn hybrids. Bruce Potter, Jeff Irlbeck and Jodie Getting, University of Minnesota Department of Entomology and Southwest
COMPARISON OF SDI AND SIMULATED LEPA SPRINKLER IRRIGATION FOR CORN
 COMPARISON OF SDI AND SIMULATED LEPA SPRINKLER IRRIGATION FOR CORN Dr. Freddie R. Lamm, P.E. Professor Research Irrigation Engineer Kansas State University Northwest Research-Extension Center Colby, Kansas
Purpose and Introduction:
 Comparison of Crop Water Consumptive Use of,, and Jenny Rees, UNL Extension and Daryl Andersen, Little Blue Natural Resources District Purpose and Introduction: The purpose of this study is to compare
Roundup Ready Xtend Crop System Benefits and Weed Management Recommendations
 1 Roundup Ready Xtend Crop System Benefits and Weed Management Recommendations It s the System that Makes the Difference Key Reasons Demand for Roundup Ready Xtend Crop System Expected to More than Double
CORN NITROGEN RATE RESPONSE AND CROP YIELD IN A RYE COVER CROP SYSTEM. Introduction
 CORN NITROGEN RATE RESPONSE AND CROP YIELD IN A RYE COVER CROP SYSTEM John E. Sawyer 1, Jose L. Pantoja 2, Daniel W. Barker 1 1 Iowa State University, Ames, IA 2 Universidad de las Fuerzas Armadas, Sangolquí,
Crop Management and Cropping Systems
 27 Crop Management and Cropping Systems Joe Touchton and Ken Wells Auburn University and the University of Kentucky No-till research has been conducted sporadically in the Southeast for many years. Intensive
UTILITY OF POLYMER-COATED UREA AS A FALL-APPLIED N FERTILIZER OPTION FOR CORN AND WHEAT
 UTILITY OF POLYMER-COATED UREA AS A FALL-APPLIED N FERTILIZER OPTION FOR CORN AND WHEAT Peter Motavalli Associate Professor Kelly Nelson Research Agronomist Convenience, favorable soil conditions at the
Effect of Crop Stand Loss and Spring Nitrogen on Wheat Yield Components. Shawn P. Conley
 Objective: Effect of Crop Stand Loss and Spring Nitrogen on Wheat Yield Components Shawn P. Conley To quantify the affect of percent crop stand loss and spring nitrogen rate on soft red winter wheat yield.