British Columbia Agrifood Industry YEAR IN REVIEW 2015
|
|
|
- Juliana Osborne
- 6 years ago
- Views:
Transcription


1 British Columbia Agrifood Industry YEAR IN REVIEW 215

2 ii BRITISH COLUMBIA AGRIFOOD INDUSTRY 215 YEAR IN REVIEW
3 Contents A MESSAGE FROM CANADA S AGRICULTURE MINISTER A MESSAGE FROM THE MINISTER OF AGRICULTURE INDUSTRY HIGHLIGHTS INDUSTRY PERFORMANCE AGRIFOOD EXPORT HIGHLIGHTS BRITISH COLUMBIA FARM CASH RECEIPTS 21 TO BRITISH COLUMBIA FOOD AND BEVERAGE MANUFACTURING SHIPMENTS 21 TO B.C. FOOD AND BEVERAGE MANUFACTURING B.C. CROPS Fruits and Nuts Berries and Grapes Tree Fruits Vegetables Greenhouse Vegetables Floriculture, Nursery and Sod Grains and Oilseeds B.C. LIVESTOCK AND POULTRY Beef Dairy Poultry and Eggs Pork and Lamb Other Animals and Animal Products SIGNIFICANT EVENTS IN B.C. AGRIFOOD 215/ DATA SOURCES /MORE INFORMATION BRITISH COLUMBIA AGRIFOOD INDUSTRY 215 YEAR IN REVIEW 1


4 A MESSAGE FROM Canada s Agriculture Minister I am pleased to join Minister Letnick in recognizing the British Columbia agriculture and food industry for another successful year of driving our economy and feeding Canadians and the world. The British Columbia Agrifood Year in Review 215 outlines the remarkable accomplishments of the sector, with increases in farmgate receipts and processing sales, and a 2-per-cent rise in eports. That is a testament to the hard work and dedication of the entire value chain from gate to plate. The Government of Canada is pleased to foster growth in Canada s agriculture and food sector by advancing key priorities for the sector, from trade, to innovation, to sustainability. We have gained access to China and Japan for B.C. cherries and peppers respectively, and I recently led a major trade mission to China along with a large group from B.C. s agriculture and food industry. We are working hard to ratify the Comprehensive Economic and Trade Agreement with the European Union, which will virtually eliminate tariffs on our agricultural eports to the world s largest market for food. At our research centres in B.C., we are eploring new crops and technologies to keep producers on the cutting edge, while reducing their environmental footprint. Our joint investments with the province of $427 million over five years under Growing Forward 2 (GF2) are helping to build a stronger industry in B.C., through initiatives such as those noted in this report. As Canada celebrates our 15th birthday this year, we can look ahead to even greater success. We are now working with B.C. and the provinces, territories and industry to draft a new policy framework in 218 to keep B.C. s agriculture and food industry strong and growing. Once again, thanks for your great work, and here is to another year of growth! Hon. Lawrence MacAulay PC, MP, Minister of Agriculture and Agri-Food 2 BRITISH COLUMBIA AGRIFOOD INDUSTRY 215 YEAR IN REVIEW


5 A MESSAGE FROM THE Minister of Agriculture Welcome to the Ministry of Agriculture 215 British Columbia Agrifood Industry Year in Review, an annual statistical summary of the B.C. agricultural and food and beverage sector. British Columbia is proud of our agriculture history. We are always looking at ways to continue building our worldwide reputation for producing innovative and great-tasting foods. By working together with our sector, we are seeing strong results. In 215, we had record revenues of $13 billion for B.C. agrifood and seafood producers, and record eports of $3.5 billion. Net cash income for primary agricultural production also increased 21.5% in 215 to $44 million, up from $362 million in 214. The secret is out, B.C. products are in demand and enjoyed all over the globe and we want to build on this momentum and have a $15 billion dollar year industry in B.C. by 22. The B.C. government has invested $8 million in our Buy Local program since 212 to help B.C. companies find new customers in British Columbia. Meantime, a network of 13 international trade offices, B.C. trade missions, and innovation and market development funding have all supported opportunities and sales for B.C. businesses. We need young farmers, young business people and young leaders and this will drive the future of our sector. My message to those thinking of a career is that the future of the sector is bright. By working together, we will continue to build an even stronger B.C. agrifoods sector, with producers earning more dollars and supporting strong communities through the province. To learn more about the B.C. agrifoods sector, please visit the Ministry of Agriculture s website at Norm Letnick Minister of Agriculture BRITISH COLUMBIA AGRIFOOD INDUSTRY 215 YEAR IN REVIEW 3
 OVER 214. This document focuses on B.C. s primary agriculture and food and beverage processing sectors.")
6 215 Industry Highlights IN 215, BRITISH COLUMBIA S AGRIFOOD AND SEAFOOD INDUSTRY INCLUDING PRIMARY PRODUCTION IN AGRICULTURE, AQUACULTURE AND COMMERCIAL FISHERIES AND PROCESSING OF FOOD AND BEVERAGES GENERATED $13. BILLION IN GROSS REVENUES, AN INCREASE OF NEARLY ONE BILLION DOLLARS (7.6 PERCENT) OVER 214. This document focuses on B.C. s primary agriculture and food and beverage processing sectors. The provincial seafood sector is profiled separately in the B.C. Seafood Industry Year in Review. In 215, B.C. s nearly 2, agriculture farms generated $3.8 billion in farm sales well over one hundred million dollars above the previous year. B.C. farms produced the largest volume (tonnage) of fruit in Canada; the second largest volume of greenhouse vegetables; and accounted for the second highest farm cash receipts in floriculture and in nursery products, the third highest in vegetables and the third highest supply-managed receipts (dairy, chicken, turkeys, table eggs, and broiler hatching eggs). In addition, the province s nearly 2,5 food and beverage manufacturers generated $9.9 billion in sales more than three quarters of a billion dollars above 214. The $9.9 billion in shipments from B.C. s food and beverage processing sector make this the second largest manufacturing sector in the province after B.C. s forestry sector (wood and paper manufacturing). Μ Μ B.C. AGRIFOOD AND SEAFOOD REVENUES 215 ($ BILLIONS) ΜΜ FOOD & BEVERAGE PROCESSING 9.9 JOB COUNT AGRICULTURE 3.8 SEAFOOD.87 PRIMARY AGRICULTURE 21,39 FOOD AND BEVERAGE PROCESSING 33, PRIMARY SEAFOOD 2,761 TOTAL AGRIFOOD AND SEAFOOD Source: 56,8 ΜΜ BRITISH COLUMBIA AGRIFOOD REVENUES 26 TO 215 1, 8, VALUE OF MANUFACTURING SHIPMENTS MILLIONS 6, 4, FARM CASH RECEIPTS 2, BRITISH COLUMBIA AGRIFOOD INDUSTRY 215 YEAR IN REVIEW
7 Industry Performance IN 215, TOTAL FARM CASH RECEIPTS GENERATED BY BRITISH COLUMBIA S AGRICULTURE SECTOR ROSE BY $132 MILLION (4.5 PER CENT) TO $3.8 BILLION WHILE TOTAL FOOD AND BEVERAGE MANUFACTURING SHIPMENTS INCREASED BY $755 MILLION (9.1 PERCENT) TO $9.9 BILLION. Included in the farm cash receipts total are farm sales of crop and livestock/poultry products as well as direct program payments made to producers. Sales from B.C. s crop sector contributed $1.51 billion (a 49 percent share) of total farm cash receipts in 215 while sales from the livestock and poultry sectors contributed $1.53 billion (a 5 percent share). Direct program payments* accounted for the remaining $36 million (one percent share) of receipts. The five sectors with the largest shares of farm cash receipts in 215 include: dairy with 18 percent, chickens with 12 percent, beef with just over 1 percent, greenhouse vegetables with 1 percent, and floriculture with just under 1 percent. There were close to 2, food processing firms and more than 5 beverage and tobacco processing firms in B.C. in 215. Food processors shipped over $7.62 billion and accounted for 84 percent of the value of B.C. s total food and beverage manufacturing shipments while beverage processors shipped $1.47 billion and accounted for 16 percent. Meat and poultry products accounted for the largest share of B.C. s food and beverage manufacturing shipments in 215 with over 17 percent of the total value. Dairy products accounted for 15 percent, breweries, distilleries and wineries accounted for 12 percent, and seafood products accounted for nine percent of B.C. s total food and beverage shipments. * Direct program payments to agricultural producers include all payments made directly to producers in the calendar year under federal and provincial programs as well as payments made under private programs. HOGS 32. OTHER CROPS 64.6 GRAINS AND OILSEEDS 61.7 TREE FRUITS NURSERY FLORICULTURE GREENHOUSE VEGETABLES 38.3 BERRIES 25.9 FIELD VEGETABLES HONEY 17.1 LAMBS 1.6 HATCHERIES.8 OTHER LIVESTOCK 55.6 TOTAL EGGS TURKEY 49.3 CATTLE & CALVES B.C. CROPS 215 B.C. LIVESTOCK 215 CHICKEN DAIRY B.C. FOOD AND BEVERAGE PROCESSING Shipments ($ Billions) GRAPES FOOD PROCESSING BEVERAGE & TOBACCO PROCESSING ΜΜ VALUE OF B.C. S AGRIFOOD & SEAFOOD INDUSTRY MILLIONS BILLIONS SECTOR % CHANGE CROPS 1,388 1,434 1, % LIVESTOCK AND POULTRY 1,371 1,479 1, % DIRECT PROGRAM PAYMENTS % AGRICULTURE TOTAL FARM CASH RECEIPTS 2,84 2,944 3, % SEAFOOD (AQUACULTURE AND WILD FISHERIES) SALES % FOOD AND BEVERAGE PROCESSING SHIPMENTS 7,812 8,331 9, % B.C. AGRIFOOD AND SEAFOOD TOTAL 11,391 12,13 13, % BRITISH COLUMBIA AGRIFOOD INDUSTRY 215 YEAR IN REVIEW 5
 215 EXPORT (SHARE %) 214 EXPORT VALUE ($ MILLIONS) 214 EXPORT (SHARE %) % CHANGE 214/215 UNITED STATES 1,844.4 76.4 1,54.3 76.8 22.6 CHINA 14.6 5.8 8.9 4.1 73.")
8 Agrifood Eport Highlights AT $2.4 BILLION, BRITISH COLUMBIA S AGRIFOOD EXPORTS MADE UP 68 PERCENT OF THE $3.5 BILLION TOTAL AGRIFOOD AND SEAFOOD EXPORTS IN 215. MARKET 215 EXPORT VALUE ($ MILLIONS) 215 EXPORT (SHARE %) 214 EXPORT VALUE ($ MILLIONS) 214 EXPORT (SHARE %) % CHANGE 214/215 UNITED STATES 1, , CHINA JAPAN SOUTH KOREA HONG KONG REST OF WORLD TOTAL B.C 2, , B.C. EXPORTS 215 Top Eports by Value ($ Millions) and Share of Total B.C. Agrifood Eports (% of 2.4 Billion) PLANTS, BULBS & FLOWERS $96.7, 4% PEPPERS $89.6, 4% LIVE CATTLE & BISON $69.9, 3% TOMATOES $65.4, 3% FOOD PREPARATIONS FOR MANUFACTURING $293.6, 12% PORK PRODUCTS $92., 4% ALFALFA, FODDER & ANIMAL FEEDS $17.7, 4% MUSHROOMS $131.2, 5% BLUEBERRIES $218.1, 9% BAKED GOODS & CEREAL PRODUCTS $23.4, 1% CHOCOLATE & COCOA PREPARATIONS $124.4, 5% B.C. s agrifood eports increased 23 percent in 215 with shipments to 149 markets. Agrifood eports include primary agriculture products and processed food and beverages derived from both domestic and imported sources. The top ten agrifood eport products totaled $1.5 billion and accounted for 61 percent of B.C. s total agrifood eports in 215. Ninety percent ($2.2 billion) of the province s agrifood eport value went to five markets the United States, China, Japan, South Korea, and Hong Kong. The United States continued to be B.C. s most important agrifood eport market with over $1.8 billion in shipments in 215, an increase of 23 percent over BRITISH COLUMBIA AGRIFOOD INDUSTRY 215 YEAR IN REVIEW

9 BRITISH COLUMBIA AGRIFOOD INDUSTRY 215 YEAR IN REVIEW 7

10 British Columbia Farm Cash Receipts 21 to 215 CROPS FRUITS VEGETABLES ($') vs. SECTOR vs. 214 % CHANGE AVERAGE AVERAGE % CHANGE Blueberries 82,62 15, ,748 91, ,21 14,29 25.% 13, % Cranberries 45,255 39,772 41,43 48,795 45,558 41, % 44, % Kiwis 72 na 72 na Raspberries 17,442 15,946 12,38 11,139 18,31 17,73-1.8% 14, % Saskatoon Berries na % Strawberries 6,31 5,685 5,66 4,854 5,548 5,76-8.5% 5, % Other Fruits 972 1,95 1,26 1,49 na 1,81 na Grapes 4,74 41,333 5,476 44,893 46,947 49,764 6.% 44, % Berries and Grapes 192,595 29, ,479 22, , , % 214, % Apples 34,481 34,34 44,23 5,43 46,193 47, % 41, % Apricots % % Cherries Sour na 123 na Cherries Sweet 33,463 3,838 4,427 41,979 45,696 55, % 38, % Nectarines 1, ,265 1, % % Peaches 4,962 5,39 6,16 4,62 6,79 6, % 5, % Pears 1,826 2,867 2,586 3,14 3,39 3, % 2, % Plums and Prunes 911 1,18 1,17 1,445 na 1,136 na Tree Fruits 77,575 75,174 96,76 12,688 14, , % 91, % FRUITS 27,17 284, ,555 35, , , % 35, % Asparagus % % Beans 3,96 3,67 3,79 3,785 3,65 3,712 3.% 3,749-1.% Beets 1,463 3,739 2,278 2,639 2,233 2, % 2, % Broccoli 1,27 2,69 3,248 2,173 2,178 3, % 2, % Brussel Sprouts 2,678 3,69 3,31 1,633 2,765 3, % 2, % Cabbage 3,553 3,996 4,46 5,754 6,95 5,671-7.% 4, % Carrots 3,666 4,118 3,382 4,88 4,152 5,12 2.7% 4, % Cauliflower % % Celery % 4-1.% Corn Sweet 5,522 6,56 7,88 7,152 8,99 8, % 6, % Cucumbers and Gherkins 1,154 1, ,25 1,8 44.% 1, % Garlic ,144 1,455 1,553 1, % 1, % Green Onions and Shallots 1, , % % Green Peas 1,483 1,243 1,657 1,51 1,551 2, % 1, % Leeks % % Lettuce Field 8,422 5,684 5,154 6,224 6,441 6, % 6, % Mushrooms³ 114,74 114,74.% 114,74.% Onions Dry 1,79 2,25 1,378 1,599 1, % 1, % Parsley % % Parsnips % % Peppers 2,487 2,339 2,64 2,113 2,48 2, % 2, % Potatoes 28,745 32,581 37,279 34,55 3,584 28, % 32, % Pumpkins 3,727 3,978 2,987 3,849 3,8 4, % 3, % Radishes % % Rhubarb % % Rutabagas and Turnips 1,254 1,32 1,114 1,364 1,26 1, % 1, % Spinach 1,161 1,2 1, % 1, % Squash and Zucchinis 4,469 4,682 3,76 4,158 4,987 5, % 4, % Tomatoes 1,912 3,169 2,441 2,662 3,25 2, % 2, % Watermelons and Other Melons % % Other Field Vegetables 4,8 na 4,8 na Field Vegetables 175,56 183, , , , ,21 1.5% 193, % Cucumbers Greenhouse 38,139 4,534 39,448 45,729 45,28 42, % 41,812 2.% Lettuce Hydroponics 1,427 na 1,427 na Peppers Greenhouse 95,427 12,993 97,46 136, ,135 14, % 112, % Tomatoes Greenhouse 113, ,712 94, ,68 116,41 119,14 2.2% 111, % Other Greenhouse Vegetables 3,662 na 3,662 na Greenhouse Vegetables 252, , ,515 35,31 296,591 38, % 271, % VEGETABLES 427,522 45,14 433,98 54,627 58, , % 464, % 8 BRITISH COLUMBIA AGRIFOOD INDUSTRY 215 YEAR IN REVIEW

11 British Columbia Farm Cash Receipts 21 to 215 (continued) CROPS LIVESTOCK FLORI CULTURE NURSERY SOD GRAINS and OILSEEDS OTHER CROPS BEEF ($') vs. SECTOR vs. 214 % CHANGE AVERAGE AVERAGE % CHANGE Floriculture 23,596 24,31 246, , ,56 298,12 8.8% 253, % Nursery 186,36 175, , ,72 177, ,88 8.9% 18, % Sod 11,12 1,98 1,357 1,393 9,557 1, % 1, % FLORICULTURE, NURSERY, SOD 427, , ,47 469,98 46,85 51, % 444, % Barley 3,621 4,283 9,15 8,948 9,667 4, % 7, % Canola 13,567 17,822 37,234 27,15 39,789 29, % 27,85 1.% Oats 3,389 5,99 11,917 11,459 8,35 9, % 8, % Wheat 1,668 15,812 32,56 18,166 23,871 19, % 2, % Deferments¹ -7,281-13,722-16,674-12,656-9,234-1, % -11, % Liquidations² 9,717 7,266 13,623 16,521 12,971 9, % 12,2-23.7% GRAINS & OILSEEDS 33,681 37,37 87,171 69,453 85,99 61, % 62, % Ginseng 4, 2,794 1,192 1,464 2,36 3, % 2, % Forage & Grass Seed % % Hay & Clover 28,48 18,381 16,519 18,65 22,468 3, % 2, % Forest Products 6,787 4,515 4,649 4,931 5,14 5, % 5, % Christmas Trees 2,287 3,321 2,63 2,451 2,283 2, % 2, % Miscellaneous Crops 9,354 1,281 11,45 11,539 11,914 12, % 1, % OTHER CROPS 5,974 39,324 36,47 39,25 44,43 53, % 42,5 28.5% TOTAL CROPS 1,21,315 1,237,83 1,329,88 1,388,472 1,433,654 1,513,49 5.5% 1,319, % Cattle 143, ,6 148, ,717 27, , % 154, % Calves 52,44 59,283 58,58 34,362 69,742 84, % 54, % BEEF 195, ,883 26, ,79 277, , % 29, % PORK HOGS 3,163 28,382 28,291 3,32 36,537 31, % 3, % DAIRY DAIRY 494,19 522,77 53, , ,73 564, % 525, % Chickens 34, , , , , , % 354,87 1.3% Turkeys 42,874 45,634 5,993 51,31 5,447 49, % 48,25 2.3% POULTRY 346, , ,95 429, ,42 47, % 42, % Eggs for Consumption 89,284 13, ,389 12,24 119, ,61.9% 18, % EGGS Eggs for Hatching % % TOTAL EGGS 89,334 13, ,95 12,11 119, ,95.9% 19,15 1.9% Sheep na 685 na Lambs 8,381 1,5 7,723 5,485 7,374 1, % 7, % SHEEP & LAMBS 8,998 11,252 7,723 5,485 7,374 1, % 8, % HONEY 7,83 6,795 7,694 9,744 11,94 17, % 8, % Hatcheries 1,846 1, ,88 1, % 1, % Miscellaneous Livestock 39,247 44,854 6,983 65,34 51,767 55, % 52,438 6.% TOTAL OTHER LIVESTOCK 57,174 63,973 77,118 81,657 72,75 84, % 7, % TOTAL LIVESTOCK 1,213,217 1,32,1 1,375,426 1,37,81 1,479,363 1,526, % 1,348, % POULTRY OTHER LIVESTOCK TOTAL DIRECT PAYMENTS 81,629 65,631 47,758 44,432 3,588 36, % 54,8-32.5% TOTAL FARM CASH RECEIPTS 2,55,164 2,64,723 2,752,273 2,83,75 2,943,67 3,75, % 2,721, % Source: B.C. Ministry of Agriculture. Fast Stats Deferred grain receipts include receipts from grain crops that are sold in a year other than the year they were produced. 2 Liquidations represent the deferred sales of crops that have been reviewed and revised by Statistics Canada, to properly reflect the year in which the crop was actually sold. 3 Estimates by B.C. Ministry of Agriculture. na not applicable. Note Totals may not agree due to rounding. Suppressed to meet the confidentiality requirements of the Statistics Act, however confidential estimates are included in commodity group total overall estimate BRITISH COLUMBIA AGRIFOOD INDUSTRY 215 YEAR IN REVIEW 9

12 British Columbia Food and Beverage Manufacturing Shipments 21 to 215 ($') AVERAGE ,285 na 252,75 43,783 1,187,945 1,85,27 643,15 599,371 1,77,79 6,594, , , ,87 1,962 na 215 VS. 214 % CHANGE 8.2% na na 12.8% 1.6% -.8% 18.7% 1.2% 9.6% 8.9% 2.7% 6.1% 21.2% 75.4% na 215 VS. AVERAGE % CHANGE 25.5% na na 8.4% 11.5% -12.1% 29.% 16.4% 3.% 15.5% 4.% 12.4% 52.6% 88.1% na BEVERAGE & TOBACCO FOOD & BEVERAGE FOOD SECTOR Animal Food Products 5,71 556,63 623, ,174 73,4 76,664 Grains & Oilseed Milling Sugar & Confectionary 252,75 Fruit & Vegetables 416, ,813 47, , ,21 437,712 Dairy Products 1,178,48 1,197,481 1,323,997 Meat & Meat Products 1,81,297 1,955,18 1,971,267 1,688,911 1,599,552 1,586,852 Seafood Products 587,86 699, ,754 Bakeries & Tortillas 614,132 69, , , ,8 697,612 Other Food Industries 968,478 1,1,254 1,1,65 1,127,614 1,277,984 1,4,146 FOOD SHIPMENTS 6,181,872 6,521,41 6,674,136 6,599,259 6,995,262 7,619,18 Soft Drink & Ice Manufacturing 358,996 36, , ,196 Breweries 555, , , , ,93 64,497 Wineries 282, ,792 34,87 397, ,76 Distilleries 1,82 2,13 3,689 Tobacco Manufacturing na na na na na na BEVERAGE & TOBACCO 1,163,575 1,136,945 1,136,945 1,212,517 1,335,845 1,466,456 1,197, % 22.5% SHIPMENTS TOTAL FOOD & BEVERAGE SHIPMENTS 7,345,447 7,658,355 7,811,81 7,811,776 8,331,17 9,85,636 7,791, % 16.6% Source: B.C. Ministry of Agriculture. Fast Stats Total Beverage and Tobacco Manufacturing Shipments in 212 are estimated using the value for 211; and 213 and 214 are estimated using Total Beverage Manufacturing Shipments for these same years. na not applicable. Note Totals may not agree due to rounding. Suppressed to meet the confidentiality requirements of the Statistics Act, however confidential estimates are included in commodity group total overall estimate 1 BRITISH COLUMBIA AGRIFOOD INDUSTRY 215 YEAR IN REVIEW
 MANUFACTURING. Total shipments from B.C. s nearly 2, food processing firms and more than 5 beverage processing firms reached a new record of $9.")
. This was followed by the composite category of other manufactured food products* at $1.4 billion (15.")
13 B.C. Food and Beverage Manufacturing B.C. S FOOD AND BEVERAGE MANUFACTURING SHIPMENTS ROSE TO $9.9 BILLION IN 215, AN INCREASE OF MORE THAN THREE-QUARTERS OF A BILLION DOLLARS ABOVE THE PREVIOUS YEAR. FOOD AND BEVERAGE PROCESSING IS B.C. S SECOND LARGEST MANUFACTURING SECTOR AFTER FORESTRY (WOOD AND PAPER) MANUFACTURING. Total shipments from B.C. s nearly 2, food processing firms and more than 5 beverage processing firms reached a new record of $9.9 billion in 215, up over nine percent above 214 and up nearly 17 percent over the previous five-year average. Meat and poultry products at $1.6 billion accounted for the largest share of shipments in 215 (17.5 percent). This was followed by the composite category of other manufactured food products* at $1.4 billion (15.4 percent), dairy products at $1.3 billion (14.6 percent), alcoholic beverage products at $1.1 billion (12 percent), and seafood products at $.8 billion (nine percent). The largest increase in shipments in 215 occurred in processed seafood ($131 million), followed by dairy ($127 million), other manufactured food products ($122 million), alcoholic beverages ($12 million), and bakery and tortilla products ($65 million). The increase in revenues from these five sectors accounted for 75 percent of the total growth that occurred in B.C. s food and beverage manufacturing shipments in 215. Manufactured food and beverage products contribute significantly to B.C. s agrifood eport total. Notable eports in 215 included food preparations for manufacturing and natural health products** at $293.6 million, baked goods and cereal products at $23.4 million and chocolate and cocoa preparations at $124.4 million. Eports of beverage products predominately water, juices and beer amounted to an additional $97.8 million in 215. * Other manufactured food products include snack foods; coffee and tea; flavouring syrups and concentrates; seasoning and dressings; cut, peeled, polished or sliced vegetables; manufactured pizzas; soup mies; prepared meals and sandwiches for the wholesale market; and honey processing; etc. (See NAICS 31199). B.C. FOOD AND BEVERAGE SHIPMENTS 215 ($ Billions) B.C. FOOD AND BEVERAGE SHIPMENTS 215 Selected Product Categories ($ Millions) BEER, CIDER, WINE & OTHER ALCOHOLIC BEVERAGES $1,9 ANIMAL FOODS $761 DAIRY PRODUCTS $1,324 OTHER FOOD PRODUCTS* $1,4 FRUIT & VEGETABLE PRESERVES & SPECIALTY FOODS $438 POULTRY PRODUCTS $1,231 BREAD AND BAKERY PRODUCTS $611 SEAFOOD PRODUCTS $83 OTHER MEAT PRODUCTS $356 ** Food preparations for manufacturing and natural health products is an eport category that includes pastes, powders and flavourings used by food manufacturers, and natural health products. BRITISH COLUMBIA AGRIFOOD INDUSTRY 215 YEAR IN REVIEW 11

14 OTHER CROPS 64.6, 4% GRAINS AND OILSEEDS 61.7, 4% NURSERY 192.9, 13% FLORICULTURE 298.1, 2% B.C. CROPS 215 GREENHOUSE VEGETABLES 38.3, 2% BERRIES TREE FRUITS GRAPES TREE FRUITS 116.6, 8% BERRIES 25.9, 14% FIELD VEGETABLES 215.2, 14% B.C.'S FRUIT CROP IN CANADA 215 GRAPES 49.8, 3% B.C. Quebec Ontario Maritimes Prairies B.C.'S GREENHOUSE VEGETABLE, FLORICULTURE AND NURSERY CROPS IN CANADA 215 B.C. Crops TOTAL FARM CASH RECEIPTS FROM B.C. S AGRICULTURAL CROPS AMOUNTED TO OVER $1.51 BILLION IN 215, AN INCREASE OF MORE THAN $79 MILLION (5.5 PERCENT) ABOVE THE PREVIOUS YEAR. B.C. s diverse climate and varied landscape enables the production of a wide variety of crops. Tree fruits, berries, grapes, field vegetables, mushrooms, greenhouse vegetables, floriculture products, nursery products, grains, oilseeds, and other crops, such as forage, sod, Christmas trees, and nuts reflect the wide range of crops grown on farms across the province. In 215, B.C. farmers produced Canada s largest fruit crop ranking B.C. #1 in Canada with over $372 million (4 percent) of the nation s farm cash receipts in fruits. B.C. farmers generated 42 percent of the nation s farm cash receipts in berries ranking B.C. #1 in Canada in berries; 38 percent of the nation s farm cash receipts in tree fruits ranking B.C. #1 in tree fruits; and 41 percent of the nation s farm cash receipts in grapes ranking B.C. #2 in grapes. B.C. farmers also produced Canada s second largest greenhouse vegetable, floriculture and nursery crops in 215. Producers generated over $38 million (24 percent) of the nation s farm cash receipts in greenhouse vegetables, over $298 million (25 percent) of national farm cash receipts in floriculture products and nearly $193 million (35 percent) of national cash farm receipts in nursery products. 4 2 B.C. Quebec Ontario Maritimes Prairies GREENHOUSE VEGETABLES FLORICULTURE NURSERY 12 BRITISH COLUMBIA AGRIFOOD INDUSTRY 215 YEAR IN REVIEW


15 ΜΜFruits and Nuts B.C. PRODUCED CANADA S LARGEST FRUIT CROP IN 215, WITH NEARLY 273, TONNES OF FRUIT VALUED AT OVER $372 MILLION IN FARM CASH RECEIPTS. B.C. s total fruit production of nearly 273, tonnes in 215 accounted for one-third (33 percent) of the national total, while B.C. s total farm cash receipts from fruit, valued at over $372 million, accounted for 4 percent of the national total ranking B.C. #1 in Canada in fruit production and receipts. Berries, grapes and tree fruits were grown on more than 24, hectares of farmland in the province. In 215, B.C. farmers cultivated over 14, hectares in berries, over 6, hectares in tree fruits, and more than 4, hectares in grapes. In addition, there were approimately 497 hectares in nuts (predominantly filberts/hazelnuts and walnuts, as well as some chestnuts and pecans). Farm cash receipts from fruits in B.C. in 215 were 13 percent higher than in 214 and were 22 percent above the previous five-year average. B.C. fruit farmers led the nation in sales of berries and tree fruits and ranked second nationally in farm sales of grapes. By individual crop, B.C. accounted for the largest share of Canada s farm cash receipts in blueberries, sweet cherries, raspberries and apricots, and ranked second nationally in farm cash receipts from grapes, cranberries, peaches, pears and nectarines. B.C. eported over $58 million worth of fruit and nuts in 215. B.C. s top five fruit and nut eports in 215 included blueberries ($218 million), cherries ($91.6 million), cranberries ($55.5 million), apples ($2.5 million) and raspberries ($13.6 million). STRAWBERRIES 1.1 RASPBERRIES 7.9 STRAWBERRIES 5.1 RASPBERRIES 17.7 B.C. FRUITS 215 Marketed Production (' Tonnes) GRAPES 26.2 CRANBERRIES 43.7 BLUEBERRIES 69.6 CRANBERRIES 41.4 OTHER FRUIT 1.5 APPLES 97. SWEET CHERRIES 15.5 PEACHES 5.2 PEARS 4. PLUMS & PRUNES 1. B.C. FRUITS 215 GRAPES 49.8 BLUEBERRIES 14.3 OTHER FRUIT 5.1 APPLES 47.3 SWEET CHERRIES 55.8 PEACHES 6.7 PEARS 3.1 B.C. FRUIT & NUT PRODUCTS 215 Eports (% Of $58 Million) BLUEBERRIES 43% CHERRIES 18% CRANBERRIES 11% OTHER FRUIT & NUT PRODUCTS 21% APPLES 4% RASPBERRIES 3% BRITISH COLUMBIA AGRIFOOD INDUSTRY 215 YEAR IN REVIEW 13
 Prairies 21 211 212 213 214 215 BLUEBERRIES CRANBERRIES RASPBERRIES STRAWBERRIES Berries: B.")
16 ΜΜBerries and Grapes B.C. BERRY GROWERS RANKED #1 IN CANADA WITH NEARLY $26 MILLION IN FARM CASH RECEIPTS AND B.C. GRAPE GROWERS RANKED #2 NATIONALLY GENERATING NEARLY $5 MILLION IN FARM CASH RECEIPTS B.C. BERRIES AND GRAPES IN CANADA 215 B.C. Quebec Maritimes Ontario BLUEBERRIES CRANBERRIES RASPBERRIES OTHER BERRIES GRAPES B.C. BERRIES 215 Marketed Production (' Tonnes) Prairies BLUEBERRIES CRANBERRIES RASPBERRIES STRAWBERRIES Berries: B.C. farmers harvested over 122, tonnes of berries, including approimately 7, tonnes of blueberries; nearly 44, tonnes of cranberries; nearly 8, tonnes of raspberries; and over 1, tonnes of strawberries in 215. B.C. s blueberry farmers generated $14 million (53 percent) of Canada s farm cash receipts in blueberries, ranking it first in the nation. B.C. also ranked first in raspberries ($18 million, 56 percent), second in cranberries ($41 million, 37 percent), and produced just over five million and under one million of national farm cash receipts in strawberries and Saskatoon berries, respectively. 215 was another record year for B.C. blueberries. Despite challenging weather conditions with very high temperatures and dry conditions throughout much of the spring and summer, a solid crop of late season varieties helped raise overall production by si percent and farm cash receipts by 25 percent over 214 levels. Eports of blueberries ranked third in value amongst the province s agrifood eports in 215, accounting for $218 million, up 29 percent over 214. Eports of B.C. cranberries were valued at $55.5 million, an increase of 91 percent over 214. Grapes: B.C. is home to the second largest grape producing region in the country. B.C. grapes are grown on over 4, hectares of land, accounting for one third of Canada s total acreage of grapes in B.C. WINE Eports ($ Millions) B.C farmers produced 26, tonnes (33 percent of national production) of grapes in 215 and generated nearly $5 million in farm cash receipts a si percent increase over 214 and an 11 percent rise over the previous five-year average. B.C s 215 farm cash receipts in grapes accounted for 41 percent of the national total. The high quality of B.C s grapes is important for another of B.C s agrifood products its world-renowned wine industry. In 215, B.C. eported close to $9.3 million worth of wine, an increase of 12 per cent over BRITISH COLUMBIA AGRIFOOD INDUSTRY 215 YEAR IN REVIEW


17 ΜΜTree Fruits B.C. TREE FRUIT GROWERS PRODUCED CANADA S LARGEST TREE FRUIT CROP IN 215, RANKING #1 WITH MORE THAN 124, TONNES OF FRUIT VALUED AT CLOSE TO $117 MILLION IN FARM CASH RECEIPTS. In 215 B.C. produced over 97, tonnes of apples, more than 15,5 tonnes of sweet cherries, over 5, tonnes of peaches, nearly 4, tonnes of pears, and over 2,5 tonnes of plums/prunes, nectarines, apricots, and other tree fruits combined. In total B.C. s tree fruit production in 215 accounted for almost one-third of the national tree fruit production. Farm cash receipts from B.C. s tree fruits at close to $117 million in 215 were 11 percent above 214 receipts and 28 percent above the previous five-year average. B.C. growers generated the largest share of national farm cash receipts in sweet cherries and apricots; the second largest share of farm cash receipts in peaches, pears, and nectarines; and the third largest share of Canada s farm cash receipts in apples. 215 was an ecellent year for B.C. s sweet cherries in particular production rose 11 percent and farm cash receipts increased 22 percent above 214 levels. At nearly $56 million, receipts from cherries surpassed apples, making them B.C. s largest value tree fruit crop in 215. Cherries are B.C. s largest tree fruit eport. B.C. s eports of cherries rose 7 percent to nearly $92 million in 215. Top eport markets for B.C. cherries included the United States, China, Hong Kong, Taiwan and the United Kingdom B.C. B.C. TREE FRUITS IN CANADA 215 Ontario Quebec Maritimes Prairies SWEET CHERRIES APPLES PEACHES OTHER TREE FRUITS B.C. TREE FRUITS 215 Marketed Production (' Tonnes) SWEET CHERRIES APPLES PEACHES OTHER TREE FRUITS B.C. TREE FRUITS SWEET CHERRIES APPLES PEACHES OTHER TREE FRUITS BRITISH COLUMBIA AGRIFOOD INDUSTRY 215 YEAR IN REVIEW 15
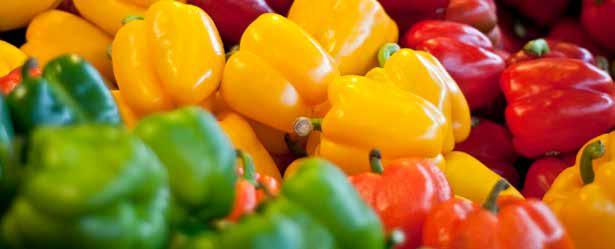
18 B.C. VEGETABLES Vegetables B.C. FARMERS PRODUCED CANADA S THIRD LARGEST VEGETABLE CROP IN 215, GENERATING MORE THAN HALF A BILLION DOLLARS IN FARM CASH RECEIPTS. 1 GREENHOUSE CUCUMBERS GREENHOUSE TOMATOES 55.7 FIELD VEGETABLES SWEET CORN 6.9 PUMPKINS 7.9 GREENHOUSE PEPPERS 4.4 POTATOES 7.9 GREENHOUSE VEGETABLES B.C. VEGETABLES 215 Marketed Production (' Tonnes) B.C. VEGETABLES 215 CARROTS 5. LETTUCE 6.3 CABBAGE 5.7 SQUASH & ZUCCHINI 5.8 SWEET CORN 8.2 PUMPKINS 4.2 GREENHOUSE PEPPERS 14.9 GREENHOUSE TOMATOES 119. CABBAGE 6.5 CARROTS 6.1 LETTUCE 5. BEANS, GREEN OR WAX 4.9 OTHER VEGETABLES MUSHROOMS MUSHROOMS POTATOES 28.9 Total farm cash receipts from vegetables eceeded $523 million in 215, including more than $38 million from greenhouse vegetables and more than $215 million from field vegetables (including mushrooms and potatoes). Over 287, tonnes of vegetables were produced in the province in 215. B.C. farmers harvested almost 12, tonnes of greenhouse vegetables grown on 284 hectares of farmland and more than 167, tonnes of mushrooms, potatoes and other field vegetables grown on about 8, hectares of farmland. At 7,9 tonnes, potatoes (including seed, tablestock and processing potatoes) accounted for the largest volume of B.C. vegetable production, followed by greenhouse tomatoes at 55,7 tonnes, greenhouse peppers at 4,4 tonnes, mushrooms at 39,3 tonnes and greenhouse cucumbers at 23,7 tonnes. Mushrooms were B.C. s highest value non-greenhouse vegetable crop accounting for nearly $114.7 million in farm cash receipts in 215, followed by potatoes at $28.9 million, sweet corn at $8.2 million, lettuce at $6.3 million, squash and zucchini at $5.8 million, cabbage at $5.7 million, carrots at $5. million, and pumpkins at $4.2 million. B.C. farmers grow a large array of other field vegetables, such as beans, broccoli, Brussels sprouts, beets, tomatoes, peas, peppers, cucumbers, garlic, turnips, onions, asparagus, spinach, cauliflower, etc., which in total amounted to $36.3 million in farm cash receipts in 215. GREENHOUSE CUCUMBERS 42.6 OTHER GREENHOUSE VEGETABLES 5.7 OTHER FIELD VEGETABLES 36.3 The top five vegetable eports in 215 included wild and farmed mushrooms ($131.2 million), peppers ($89.6 million), tomatoes ($65.4 million), cucumbers ($12.3 million), and potatoes ($1.6 million), with seed potatoes accounting for one-third (33 percent) of B.C. s potato eports. The United States was the top market for most of B.C. s vegetable eports in BRITISH COLUMBIA AGRIFOOD INDUSTRY 215 YEAR IN REVIEW

19 ΜΜGreenhouse Vegetables B.C. IS HOME TO CANADA S SECOND LARGEST GREENHOUSE VEGETABLE INDUSTRY, WITH NEARLY 12, TONNES OF VEGETABLES PRODUCED IN 215 VALUED AT OVER $38 MILLION IN FARM CASH RECEIPTS. Farm cash receipts generated by B.C. greenhouse producers in 215 included almost $141 million in peppers, $119 million in tomatoes, nearly $43 million in cucumbers and close to $6 million in other greenhouse vegetables. In total, B.C. greenhouse receipts accounted for almost one-quarter (24 percent) of Canada s total farm cash receipts in greenhouse vegetables. B.C. s farm cash receipts in greenhouse vegetables in 215 were four percent higher than in 214 and nearly 14 percent above the previous five-year average. The greenhouse sector supplies the B.C. marketplace with fresh vegetables for about ten months of the year on just 284 hectares of land. In total, nearly 12, tonnes of greenhouse vegetables were grown in 215, including almost 56, tonnes of tomatoes, over 4, tonnes of peppers, almost 24, tonnes of cucumbers, and smaller amounts of lettuce and other greenhouse vegetables. B.C. s production of greenhouse vegetables accounted for 3 percent of national greenhouse production in peppers, 21 percent in tomatoes, and 13 percent in cucumbers. Eports of greenhouse vegetables from B.C. were valued at $167 million in 215, an increase of 14 percent over 214. Peppers accounted for almost 54 percent ($89.6 million) followed by tomatoes at 39 percent ($65.3 million) and cucumbers at over seven percent ($12 million). The United States has historically been B.C. s largest eport market for greenhouse vegetables, accounting for about 99 percent of eport sales , B.C. GREENHOUSE VEGETABLES IN CANADA 215 B.C. Quebec Ontario Maritimes PEPPERS TOMATOES CUCUMBERS B.C. GREENHOUSE VEGETABLES Prairies PEPPERS TOMATOES CUCUMBERS OTHER B.C. GREENHOUSE VEGETABLES Marketed Production (' Tonnes) PEPPERS TOMATOES CUCUMBERS B.C. GREENHOUSE VEGETABLES Eports ($' ) 15, 1, 5, PEPPERS TOMATOES CUCUMBERS BRITISH COLUMBIA AGRIFOOD INDUSTRY 215 YEAR IN REVIEW 17

20 Floriculture, Nursery and Sod B.C. IS HOME TO CANADA S SECOND LARGEST FLORICULTURE AND NURSERY INDUSTRIES, WHICH TOGETHER GENERATED NEARLY HALF A BILLION DOLLARS IN TOTAL FARM CASH RECEIPTS IN B.C. FLORICULTURE AND NURSERY IN CANADA 215 B.C. Quebec Ontario FLORICULTURE FLORICULTURE NURSERY SOD GREENHOUSE FLOWERS & PLANTS 381,446 Maritimes NURSERY B.C. FLORICULTURE, NURSERY & SOD FIELD GROWN NURSERY PRODUCTS 13,221 CONTAINER GROWN NURSERY PRODUCTS 239,245 Prairies B.C. FLORICULTURE AND NURSERY 215 Total Units Grown (') Floriculture: B.C. flower growers generated over $298 million in farm cash receipts in 215, nearly nine percent above 214, and almost 18 percent higher than the previous five-year average. B.C. s floriculture industry was the second largest in Canada and the fifth largest agriculture sector in the province in terms of farm cash receipts in 215. Growers produced and marketed over 92 million cut flowers, nearly 19 million cuttings, and almost 54 million indoor and outdoor potted plants. Nursery: B.C. is home to Canada s second largest nursery industry, valued at almost $193 million in farm cash receipts in 215, an increase of nine percent over 214 and seven percent above the previous fiveyear average. The nursery industry was B.C. s sith largest agriculture sector in terms of farm cash receipts in 215. B.C. growers produced over 22 million nursery tree seedlings; over 17 million perennials and annuals; nearly si million coniferous and evergreen shrubs; about four million deciduous shrubs (including roses); close to two million shade and ornamental trees; close to two million coniferous trees; three-quarters of a million fruit trees and small fruit bushes; and 26 thousand vines. Eports of plants, bulbs and flowers rose more than 18 percent in 215 over the previous year, with shipments totalling $96.7 million. Sod: B.C. sod growers generated $1.6 million in farm cash receipts in 215 on 542 hectares of land. The primary markets for sod in B.C. are home landscaping, sports fields, golf courses and parks. The majority of sod in B.C. is grown in the Lower Mainland, on Vancouver Island and in the Okanagan. 18 BRITISH COLUMBIA AGRIFOOD INDUSTRY 215 YEAR IN REVIEW
, wheat (23 percent), and oats (12 percent), while canola production fell marginally (less than two percent).")
21 Grains and Oilseeds B.C. GRAIN AND OILSEED FARMERS PRODUCED MORE THAN 331, TONNES OF WHEAT, OATS, BARLEY AND CANOLA IN 215, VALUED AT NEARLY $62 MILLION IN FARM CASH RECEIPTS. B.C. farmers produced more than 331, tonnes of grains and oilseeds in 215 including 134,9 tonnes of wheat, 7,8 tonnes of canola, 58, tonnes of oats, and 67,5 tonnes of barley. Production rose 2 percent overall with notable growth occurring in barley (58 percent), wheat (23 percent), and oats (12 percent), while canola production fell marginally (less than two percent). Despite slightly higher producer prices in 215, farm cash receipts in B.C. s grains and oilseeds declined by 28 percent over 214 to nearly $62 million, due to reduced marketings. Canola accounted for nearly half of B.C. s grain and oilseed receipts (48 percent), followed by wheat at 32 percent, oats at 15 percent, and barley at eight percent. In 215, B.C. farmers seeded 4,4 hectares in spring wheat, 36,4 hectares in canola, 3,4 hectares in oats and 24,3 hectares in barley. The total farmland in grain and oilseed crops accounted for nearly two-thirds of B.C. s total farmland in food crops. Generally, canola and the higher grades of wheat, oats and malting barley are either eported directly or moved into the Canadian processing sector, while the lower grades are destined primarily for the domestic feed markets. B.C. is well known for its high quality canola seed used in the making of canola oil and high-protein canola meals fed to livestock. 1, 8, 6, 4, 2, B.C. GRAINS & OILSEEDS Farm Cash Receipts ($') WHEAT OATS BARLEY CANOLA B.C. GRAINS & OILSEEDS 215 WHEAT 19.9 OATS 9.1 BARLEY 4.7 CANOLA 29.8 B.C. GRAINS & OILSEEDS 215 Marketed Production (' Tonnes) SPRING WHEAT OATS 58. BARLEY 67.5 CANOLA 7.8 B.C. LAND IN GRAINS & OILSEEDS 215 Seeded Area (''s Hectares) CANOLA 36.4 SPRING WHEAT 4.4 BARLEY 24.3 OATS 3.4 BRITISH COLUMBIA AGRIFOOD INDUSTRY 215 YEAR IN REVIEW 19

22 B.C. Livestock and Poultry FARM CASH RECEIPTS IN B.C. S LIVESTOCK AND POULTRY SECTORS TOTALLED $1.53 BILLION IN 215, AN INCREASE OF $47 MILLION ABOVE THE PREVIOUS YEAR. Total farm cash receipts from beef, dairy, chickens, turkeys, eggs, pork, sheep, lambs and other animals and animal products amounted to $1.53 billion in 215, an increase of 3.2 percent over 214 and 13.2 percent over the previous five-year average. 2, 1,5 1, 5 LAMBS 1.6 B.C. LIVESTOCK AND POULTRY 215 B.C Quebec HONEY 17.1 OTHER 56.4 POULTRY 48. EGGS BEEF DAIRY DAIRY POULTRY EGGS HOGS 32. B.C. SUPPLY MANAGED COMMODITIES IN CANADA 215 2,5 Ontario Maritimes Manitoba Saskatchewan Alberta B.C. s supply-managed sector (dairy, chicken, turkey, table eggs and broiler hatching eggs) accounted for nearly $1.1 billion (71.6 percent) of the province s total livestock and poultry receipts in 215, followed by beef with $316.8 million (2.8 percent), and hogs, lamb, honey and other animals and animal products for the remaining $116.1 million (7.6 percent). B.C. is home to the third largest supply-managed sector in Canada, after Ontario and Quebec. B.C. s supply-managed receipts account for about 1 percent of national supply managed receipts. Approimately half (9,228) of all of B.C. s 19,759 farms predominantly raise livestock, poultry or other animals. At the end of 215, there were 58, cattle and calves on farms in B.C. including 191,9 beef cows, 33,8 beef replacement heifers, 75,1 dairy cows, 33, dairy replacement heifers, 87, pigs, 39,5 sheep and lambs, 6,8 bison, 4 fallow deer, 45,571 bee colonies and 9,895,419 chicks and turkey poults. In addition, there were approimately 614, other animals on B.C. farms, including horses, ponies, goats, rabbits, ducks, geese, emus, llamas and alpacas. B.C. producers raise some of the less traditional species of livestock and poultry as a means of diversifying farm income and utilizing marginal agricultural land. B.C. eported close to $276 million worth of live animals, meat and animal products in 215, down slightly from 214. Notable contributors to this category included pork products with an eport value of $92 million, live cattle and bison amounting to $7 million, poultry products at $25 million in eports, and dairy products worth $35 million. 2 BRITISH COLUMBIA AGRIFOOD INDUSTRY 215 YEAR IN REVIEW


23 ΜΜBeef B.C. BEEF FARMERS GENERATED CLOSE TO $317 MILLION IN FARM CASH RECEIPTS IN 215, AN INCREASE OF 14 PERCENT OVER 214. In 215, B.C. beef producers marketed nearly 183, cattle and calves amounting to over 85, tonnes and generated close to $317 million in farm cash receipts. The total tonnage of beef marketed in 215 fell si percent below 214, while producer farm cash receipts rose 14 percent over 214 and 51 percent over the previous five-year average. Producers benefited from the continued strong prices in 215 in response to the still low North American supplies. The B.C. cattle industry is primarily cow-calf operations, predominately located in the Thompson-Okanagan, Cariboo, Nechako and Peace River regions. The sector includes a wide range of cattle farms, including small hobby farms, diversified operations and large cattle ranches. The B.C. herd represents approimately 4.3 percent of the Canadian cattle inventory B.C. BEEF 215 Marketed Production (' Tonnes) B.C. BEEF BRITISH COLUMBIA AGRIFOOD INDUSTRY 215 YEAR IN REVIEW 21


24 B.C. DAIRY B.C. DAIRY 215 Production (Million Litres) ΜΜDairy B.C. DAIRY PRODUCERS GENERATED WELL OVER HALF A BILLION DOLLARS IN FARM CASH RECEIPTS IN 215. Farm cash receipts from milk production in B.C. eceeded $564 million in 215 nearly two percent above 214 receipts and over seven percent above the previous five-year average. Accounting for over nine percent of national farm cash receipts in dairy and over 18 percent of the province s total farm cash receipts, B.C. is the third largest dairy-producing region in Canada, and dairy is B.C. s largest primary agriculture sector. The province s 491 licensed dairy farmers, including 31 certified organic milk producers, produced million litres of milk in 215, an increase of over four percent above 214 and over si percent above the previous five-year average. British Columbia ranks first in Canada with the highest average herd size, the highest average herd milk production and the highest milk quality. With 27.1 million litres of certified organic milk produced, B.C. ranks second nationally to Quebec s 41.2 million litres of production. 22 BRITISH COLUMBIA AGRIFOOD INDUSTRY 215 YEAR IN REVIEW

25 ΜΜPoultry and Eggs B.C. POULTRY AND EGG FARMERS GENERATED OVER HALF A BILLION COMBINED IN FARM CASH RECEIPTS IN 215. B.C. poultry farmers generated nearly $48 million in farm cash receipts and B.C. egg farmers generated more than $121 million in 215. B.C. is home to the production of chickens, turkeys, broiler hatching eggs, eggs for consumption, eggs for processing, and various specialty poultry including Silkies, Taiwanese and other ethnic chickens, waterfowl, game birds, and organic chickens and turkeys. Poultry: B.C. poultry farmers raised and marketed almost 15 million chickens and nearly 2.7 million turkeys in 215, amounting to a total combined weight of just over 185, tonnes and total farm cash receipts of nearly $48 million. B.C. chicken production including mainstream chickens as well as specialty poultry amounted to more than 164, tonnes in 215 and farm cash receipts of close to $359 million. B.C. turkey production including mainstream and organic turkey amounted to just over 21, tonnes in 215 and farm cash receipts totalling more than $49 million. B.C. eported over $25 million in poultry products in 215, with the main eport market being the U.S., accounting for $6.3 million (25 percent) of total eports, followed closely by the Philippines with $5.4 million (21 percent). The Congo, Taiwan, and Gabon each accounted for over $2 million (28 percent combined) of B.C. poultry eports in 215. Eggs: B.C. egg farmers produced over 7 million dozen eggs (consumption and hatching eggs) in 215, generating farm cash receipts of more than $121 million. B.C. egg producers led the nation with approimately 2 percent of producers farming specialty eggs (brown, free run, organic and Omega eggs) a higher proportion than any other province B.C. POULTRY & EGGS POULTRY EGGS B.C. POULTRY 215 Marketed Production (' Tonnes) B.C. EGGS 215 Marketed Production (Million Dozen) BRITISH COLUMBIA AGRIFOOD INDUSTRY 215 YEAR IN REVIEW 23


26 B.C. PORK B.C. LAMB ΜΜPork and Lamb B.C. HOG PRODUCERS GENERATED NEARLY $32 MILLION IN FARM CASH RECEIPTS IN 215 AND B.C. LAMB PRODUCERS GENERATED NEARLY $11 MILLION. Pork: B.C. pork producers raised and marketed nearly 24, hogs amounting to nearly 25, tonnes in total weight, and generated nearly $32 million in farm cash receipts in 215. B.C. s total pork marketings in 215 were 11 percent higher than in 214, but prices were 21 percent lower, resulting in a 12 percent overall decline in farm cash receipts. B.C. eports of pork products were valued at $92 million in 215, an increase of nearly ten percent over 214 and accounted for the largest share (33 percent) of B.C. s total animal and animal product eports. Key eport markets for B.C. s pork products in 215 included Japan with nearly 4 percent, China with nearly 37 percent and Taiwan with over eight percent. The B.C. hog industry is concentrated in the Fraser Valley, in close proimity to the Lower Mainland s wide range of niche markets. The average licensed producer in B.C. manages 35 sows (farrow-to-finish) and markets about 7, hogs annually. Sheep and Lambs: B.C. farmers generated $1.6 million in farm cash receipts from the sale of lambs in 215, an increase of 44 percent over 214. At the end of 215, there were 39,5 rams, ewes and lambs on B.C. farms. Approimately 26 percent of sheep farms are located on Vancouver Island, 24 percent are in the Thompson-Okanagan region, and 12 to 16 percent in each of the Lower Mainland, Cariboo and Peace River regions. 24 BRITISH COLUMBIA AGRIFOOD INDUSTRY 215 YEAR IN REVIEW


27 ΜΜOther Animals and Animal Products Honey and Bees: In 215 B.C. beekeepers produced 1,675 tonnes of honey valued at $17.1 million in farm cash receipts, a 43 percent increase in receipts over 214 and a 98 percent increase over the previous five-year average. At the end of 215, B.C. was home to 45,571 colonies of honeybees and nearly 2,4 beekeepers. B.C. accounts for more than a quarter (28 percent) of Canada s 8,5 beekeepers. Honeybees play a key role in agriculture as pollinators of crops. Approimately 6 percent of B.C. s honeybee colonies are located in the Lower Mainland-Southwest where many commercial beekeepers provide pollination services for the horticulture industry, particularly blueberries, cranberries, raspberries and apples. The total value of B.C. s honeybee pollination services was estimated at $4.8 million in 215, up over 3 percent over 214. Eports of B.C. honey were relatively unchanged from 214 at just over $1.7 million. Top markets for B.C. honey eports in 215 included China at 49 percent and Japan at 39 percent. Other Animals and Animal Products: B.C. farmers raised and produced a variety of other animals and animal products amounting to over $56 million in farm cash receipts in 215. B.C produces other animals and animal products including furs, horses, ponies, goats, llamas, alpacas, rabbits, bison, elk, farmed deer, wild boars, mink breeding stock, fo, donkeys, mules, chinchillas, wool, embryos, other poultry (e.g., geese, ducks, roosters, ostriches, game birds, emus, pheasants, quail and pigeons), beeswa, bee pollen, queen bees and nucleus bee colonies B.C. HONEY OTHER ANIMALS & ANIMAL PRODUCTS BRITISH COLUMBIA AGRIFOOD INDUSTRY 215 YEAR IN REVIEW 25


28 Significant Events in B.C. Agrifood 215/16 B.C. Agrifood and Seafood Strategic Growth Plan launched Providing Consumers Certainty When Buying B.C. Organic Products Launch of Bioenterprise B.C. Grows Agri-Tech Companies British Columbia s agrifood and seafood leaders joined Agriculture Minister Norm Letnick to launch a comprehensive plan to increase overall sector revenues to $15 billion per year by 22. Victoria Agriculture Minister Norm Letnick introduced Bill 11, the Food and Agricultural Products Classification Act in the House so British Columbians can shop with confidence. Abbotsford The B.C. government and the B.C. Innovation Council (BCIC) welcomed new partner Bioenterprise B.C. to the B.C. Acceleration Network (BCAN) to support the growth of innovative agri-tech businesses in the province. The B.C. Agrifood and Seafood Strategic Growth Plan focuses on continued sector growth and builds on the success of the 212 B.C. Agrifoods Strategy. The 56,8 British Columbians directly employed in the provincial agrifoods sector form a key economic driver in B.C. and contribute to the second largest manufacturing sector in the province. releases/215agri B.C. Agriculture Generosity + B.C. Charities = Fresh Local Food Vancouver B.C. families who use food banks, charities and school lunch programs will now have further access to fresh, healthy, and local food that has been donated by their neighbours in the B.C. agrifood sector, as a result of the B.C. government s new 216 Farmers Food Donation Ta Credit. releases/216agri8- BRITISH COLUMBIA AGRIFOOD INDUSTRY 215 YEAR IN REVIEW Agriservice BC to Help B.C. S Farmers Now and for the Future Victoria AgriService BC was launched to help individuals looking to start or grow their agrifoods business by linking British Columbians to comprehensive and up-to-date information and tips to be a success in B.C. s eciting agrifoods sector. With AgriService BC, accessing information has just been made easier. content/industry/agriculture-seafood/ agriservice-bc
29 Data Sources /More Information DATA SOURCES ΜΜ Production, farm cash receipts, manufacturing shipment values, and employment data sourced from Statistics Canada. ΜΜ Specific industry data obtained from industry associations, where necessary. ΜΜ Eport data sourced from Statistics Canada through the Global Trade Atlas and CATSNET databases. CONTACT INFORMATION This report is available online at: industry/agriculture-seafood/statistics/industry-and-sector-profiles For more information on B.C. agrifood and seafood, please contact: ΜΜ AgriService B.C. Telephone: For more information on the Province of British Columbia, please visit: January 217 BRITISH COLUMBIA AGRIFOOD INDUSTRY 215 YEAR IN REVIEW 27
30 Notes 28 BRITISH COLUMBIA AGRIFOOD INDUSTRY 215 YEAR IN REVIEW
31 Notes BRITISH COLUMBIA AGRIFOOD INDUSTRY 215 YEAR IN REVIEW 29

32
AGRICULTURAL OVERVIEW
 Regional District of Central Okanagan CONTENTS Corporate Name Date of Incorporation August 24, 1967 Postal Address 1450 KLO Road, Kelowna, BC, V1W 3Z4 Phone (250) 763-4918 Fax (250) 763-0606 E-mail Internet
BUSINESSES IN BRITISH COLUMBIA S AGRIFOOD AND SEAFOOD SECTOR ARE SERVING THE GLOBAL MARKETPLACE.
 QUALITY DIVERSITY BUSINESSES IN BRITISH COLUMBIA S AGRIFOOD AND SEAFOOD SECTOR ARE SERVING THE GLOBAL MARKETPLACE. With British Columbia s growing array of products and our international reputation for
QUALITY DIVERSITY. AGRIFOOD AND SEAFOOD
 QUALITY DIVERSITY AGRIFOOD AND SEAFOOD www.britishcolumbia.ca BUSINESSES IN BRITISH COLUMBIA S AGRIFOOD AND SEAFOOD SECTOR ARE SERVING THE GLOBAL MARKETPLACE. With British Columbia s growing array of products
QUALITY DIVERSITY. AGRIFOOD AND SEAFOOD
 QUALITY DIVERSITY AGRIFOOD AND SEAFOOD www.britishcolumbia.ca BUSINESSES IN BRITISH COLUMBIA S AGRIFOOD AND SEAFOOD SECTOR ARE SERVING THE GLOBAL MARKETPLACE. With British Columbia s growing array of products
BRITISH COLUMBIA AGRIFOOD INDUSTRY YEAR IN REVIEW
 BRITISH COLUMBIA AGRIFOOD INDUSTRY YEAR IN REVIEW ISSN 2368-1969 (Print) ISSN 2368-1977 (Online) Copyright 214, Province of British Columbia All rights reserved. 2 British Columbia Agrifood Industry 213
New Brunswick Census of Agriculture Graphs October 2017
 New Brunswick Census of Agriculture Graphs 216 October 217 New Brunswick Census of Agriculture Report 216 Province of New Brunswick P.O. Box 6, Fredericton NB E3B 5H1 CANADA www.gnb.ca Printed English
regon Agricultural Commodities
 I regon Agricultural Commodities Farm Values and Processed Values H Extension Service and Agricultural Experiment Station, Oregon State University Our cover: For this edition, we feature Oregon green snap
AgriStability GUIDE FOR REPORTING PRODUCTIVE UNITS FOR 2013
 This guide contains all the information you need to report productive units for the 2013 participation year. Guide for Reporting Productive Units... p. 3 List of Productive Units... p. 10 AgriStability
Saskatchewan remains the breadbasket of Canada
 Catalogue no. 95-640-X Saskatchewan remains the breadbasket of Canada Release date: May 10, 2017 How to obtain more information For information about this product or the wide range of services and data
Oregon County and S ate Agricultural Estimates
 I 5 5 01984 ("t) 01 CtkP.er ke)0 P I `49.s 14 g6 a IP) Oregon County and S ate Agricultural Estimates Special Report 726 January 1985 Oregon State University Extension Service AGRICULTURAL COMMODITY SALES
California s International Agricultural Exports in 2004
 University of California Number 30 November 2005 Agricultural Issues Center AIC Issues Brief California s International Agricultural Exports in 2004 In 2004 California s agricultural exports surpassed
Market opportunities for Queensland agribusiness from FTAs with China, Japan and South Korea. Queensland Production
 Market opportunities for Queensland agribusiness from FTAs with China, Japan and South Korea Queensland Production Scope Australia recently signed Free Trade Agreements (FTAs) with China (June 2015), Japan
Interim Update on the Economic Impact of Michigan s Agri-Food and Agri-Energy System
 Interim Update on the Economic Impact of Michigan s Agri-Food and Agri-Energy System H. Christopher Peterson, Director William Knudson, Product Market Economist MSU Product Center for Agriculture and Natural
Oregon State University Extension Service. 71 refl.), ITO :OP. UnbountliqP nr1 not circulate
, ITO :OP. UnbountliqP nr1 not circulate") 05 UnbountliqP nr1 not circulate 71 refl.), ITO :OP. Analytics 1988 Oregon County and State Agricultural Estimates Special Report 790 / Revised January 1989 Oregon State University Extension Service AGRICULTURAL
05 UnbountliqP nr1 not circulate 71 refl.), ITO :OP. Analytics 1988 Oregon County and State Agricultural Estimates Special Report 790 / Revised January 1989 Oregon State University Extension Service AGRICULTURAL
AgriStability Agri-Québec Plus
 AgriStability Agri-Québec Plus Guide for Reporting Productive Units for 2016 This guide contains all the information you need to report productive units for the 2016 participation year Guide for Reporting
REGIONAL FOOD HUB PILOT PROJECT. Regional Profiles. A project of the Greenbelt Fund
 REGIONAL FOOD HUB PILOT PROJECT Regional Profiles A project of the Greenbelt Fund Copyright 2017 Greenbelt Fund All Rights Reserved Greenbelt Fund 661 Yonge Street, Suite 500 Toronto, Ontario M4Y 1Z9 Canada
In 2003 California s agricultural exports increased 14
 University of California Number 28 December 2 0 0 4 Agricultural Issues Center AIC Issues Brief California s International Agricultural Exports in 2003 José E. Bervejillo and Daniel A. Sumner In 2003 California
Chapel Hill Farmers' Market
 Returning Chapel Hill Farmers Market member: To adequately plan for the upcoming market year and to better meet the needs of all our members we need to know what your plans and expectations are for the
California s International Agricultural Exports in 2002
 University of California Number 3 November 0 0 3 Agricultural Issues Center AIC Issues Brief California s International Agricultural Exports in 00 José E. Bervejillo and Daniel A. Sumner The value of California
PRICES OF COMMODITY PRODUCTS
 PRICES OF COMMODITY PRODUCTS The gross farm value of the commodities reported in the parish tables was computed based upon estimated annual per-unit prices. The state average prices listed below were used
Organic fruit and vegetable production: Is it for you?
 Catalogue no. 21-004-XIE September 2002 Organic fruit and vegetable production: Is it for you? By William Parsons Responding to a niche market Although more and more consumers have come to believe in the
Executive Summary. Fruits and Berries
 Executive Summary This report provides historical perspective, including acreage, operation count, cash receipts, production and yields, for Missouri-grown specialty crops. Data are reported for all facets
Horses, donkeys and ducks: identifying key trends in other livestock and poultry
 Catalogue no. 96 325 X ISSN 0-662-35659-4 Canadian Agriculture at a Glance Horses, donkeys and ducks: identifying key trends in other livestock and poultry by Mitra Rostami Agriculture Division Release
Chapel Hill Farmers' Market NEW MEMBERSHIP APPLICATION PACKET ( )
") INSTRUCTIONS FOR APPLICATION PROCESS Thank you for your interest in becoming a Member of the Chapel Hill Farmers' Market. We are now accepting vendor applications for the 2018-2019 season for the Saturday
INSTRUCTIONS FOR APPLICATION PROCESS Thank you for your interest in becoming a Member of the Chapel Hill Farmers' Market. We are now accepting vendor applications for the 2018-2019 season for the Saturday
BRITISH COLUMBIA AGRI-FOOD INDUSTRY YEAR IN REVIEW
 BRITISH COLUMBIA AGRI-FOOD INDUSTRY YEAR IN REVIEW 2010 A MESSAGE FROM THE MINISTER OF AGRICULTURE Welcome to the Ministry of Agriculture s 2010 Agri-food Year in Review. As Canada s most diverse agricultural
STATISTICAL PROFILE OF HALIFAX AND HANTS COUNTIES. Prepared By: Nova Scotia Federation of Agriculture
 STATISTICAL PROFILE OF HALIFAX AND HANTS COUNTIES Prepared By: Nova Scotia Federation of Agriculture 1.0 Introduction Agriculture in the Local Economy Agriculture in Halifax and Counties are characterized
Crossroads Resource Center
 Crossroads Resource Center Tools for Community Self-determination 7415 Humboldt Ave. S. / Minneapolis, Minnesota 55423 / 612.869.8664 kmeter@crcworks.org www.crcworks.org Sarasota County, Florida Local
Input-output models for agriculture and agri-food industries
 Input-output models for agriculture and agri-food industries Pre-conference: Canadian Agricultural Economics Society Andreas Trau 613-951-3466 andreas.trau@statcan.gc.ca January 11, 2017 Overview Introduction
A brief focus on Georgia s agricultural industry
 A brief focus on Georgia s agricultural industry 2010 Total Farm Gate Value $200,000,000 - $475,048,630 $80,000,000 - $200,000,000 $45,000,000 - $80,000,000 $20,000,000 - $45,000,000 $313,000 - $20,000,000
Activity 27 GROWING PLANTS. How long does it take for a seed to sprout and what can I do to help it grow into a healthy plant?
 Activity 27 GROWING PLANTS STUDY QUESTION: THE ACTIVITY: How long does it take for a seed to sprout and what can I do to help it grow into a healthy plant? In this activity children plant seeds in two
Step 1: Get Started - Farmer Self-Assessment
 Step 1: Get Started - Farmer Self-Assessment The following questions are designed to help you determine your interest and ability to market your food products to local schools. This information is not
Step 1: Get Started - Farmer Self-Assessment
 Step 1: Get Started - Farmer Self-Assessment The following questions are designed to help you determine your interest and ability to market your food products to local schools. This information is not
COLUSA COUNTY DEPARTMENT OF AGRICULTURE 2011 CROP REPORT JOSEPH J. DAMIANO AGRICULTURAL COMMISSIONER
 COLUSA COUNTY DEPARTMENT OF AGRICULTURE 2011 CROP REPORT JOSEPH J. DAMIANO AGRICULTURAL COMMISSIONER COLUSACOUNTY DEPARTMENT OF AGRICULTURE JOSEPH J. DAMIANO AGRICULTURAL COMMISSIONER/SEALER OF WEIGHTS
Statistical Overview of the Canadian Honey and Bee Industry and the Economic Contribution of Honey Bee Pollination
 Statistical Overview of the Canadian Honey and Bee Industry and the Economic Contribution of Honey Bee Pollination 2013-2014 Prepared by: Horticulture and Cross Sectoral Division Agriculture and Agri-Food
Crop Statistics in Germany
 Crop Statistics in Germany Follow up regional workshop on crop statistics Zagreb, 17 18 April 2008 Ute Walsemann Head of Subdivision Land use and Crop statistics Federal Statistical Office of Germany Federal
Farm Eligibility Table. Fire & Allied. Classification. FL/GL Auto
 Animal - General Farms, Primarily Livestock and Animal Specialties - general animal specialty and livestock farms; general livestock and animal specialty farms. See also - (Animal Specialty)/(Livestock)/
STATISTICAL PROFILE OF COLCHESTER COUNTY. Prepared By: Nova Scotia Federation of Agriculture
 STATISTICAL PROFILE OF COLCHESTER COUNTY Prepared By: Nova Scotia Federation of Agriculture 1.0 Introduction Agriculture in the Local Economy Agriculture in County is characterized by a diversity of farm
Agricultural CROP REPORT. Yolo County
 Agricultural CROP REPORT Yolo County 1956 County of Yolo P.O. BOX 175 WOODLAND, CALIFORNIA 95695 (916) 666-8261 CHAS. H. HARDY COUNTY AGRICULTURAL COMMISSIONER SEALER OF WEIGHTS AND MEASURES TO: THE HONORABLE
Agricultural CROP REPORT. Yolo County
 Agricultural CROP REPORT Yolo County 1957 County of Yolo P.O. BOX 175 WOODLAND, CALIFORNIA 95695 (916) 666-8261 CHAS. H. HARDY COUNTY AGRICULTURAL COMMISSIONER SEALER OF WEIGHTS AND MEASURES The Honorable
Welcome to the. Our members are those individuals, farms and partnerships or corporations who reside and produce or sell within our region.
 Welcome to the Durham Farm Fresh We are an association of Durham Region Farmers, Producers and other Stakeholders who care about locally produced food ~ bringing quality and freshness from our farms and
CENSUS OF AGRICULTURE HIGHLIGHTS New York State, 1997
 APRIL 1999 E.B. 99-06 CENSUS OF AGRICULTURE HIGHLIGHTS New York State, 1997 Number of Farms, 1997 W. Knoblauch L. Putnam B. Stanton Department of Agricultural, Resource, and Managerial Economics College
Payment details: 2018 Midweek Market Vendor Application
 PLEASE NOTE NEW ADDRESS: Tower Grove Farmers Market P.O. BOX 6117, St Louis, MO 63139 Tel. (314) 319-9696 erin@tgfarmersmarket.com www.tgfarmersmarket.com Payment details: ( ) Record & Calendar ( ) Confirmation
Dollars & Sense. Opportunities to Strengthen Southern Ontario s Food System. Econometric Research Limited Harry Cummings & Associates Rod MacRae, PhD
 Dollars & Sense Opportunities to Strengthen Southern Ontario s Food System Econometric Research Limited Harry Cummings & Associates Rod MacRae, PhD Econometric Research Limited Harry Cummings & Associates
Payment details: 2018 Saturday Market Vendor Application
 PLEASE NOTE NEW ADDRESS: Tower Grove Farmers Market P.O. BOX 6117, St Louis, MO 63139 Tel. (314) 319-9696 erin@tgfarmersmarket.com www.tgfarmersmarket.com Payment details: ( ) Record & Calendar ( ) Confirmation
Bulletin No October 18, Broadway, Suite 900 Oakland, CA Fax
 WCIRB Bulletin Bulletin 2017-21 October 18, 2017 1221 Broadway, Suite 900 Oakland, CA 94612 415.777.0777 Fax 415.778.7007 www.wcirb.com wcirb@wcirb.com Revised Standard Endorsement Form Farm Schedule Endorsement
This presentation is sponsored by the Beginning Farmer and Rancher Development Program INTEGRATED FARMS
 This presentation is sponsored by the Beginning Farmer and Rancher Development Program INTEGRATED FARMS Integrated Farms In the 20 th century, farming saw a gradual separation and specialization of production
PORTAGE BUSINESS IMPROVEMENT DISTRICT FARMERS MARKET 2018 APPLICATION COMPLETE THESE PAGES 1 THROUGH 4 AND RETURN TO MARKET MANAGER
 PORTAGE BUSINESS IMPROVEMENT DISTRICT FARMERS MARKET 2018 APPLICATION COMPLETE THESE PAGES 1 THROUGH 4 AND RETURN TO MARKET MANAGER (Fill out completely and type or print all information clearly. Thanks!)
Colusa County Department of Agriculture Crop Report. Harry A. Krug Agricultural Commissioner
 Colusa County Department of Agriculture 2001 Crop Report Harry A. Krug Agricultural Commissioner The 2001 Colusa County Crop Report is dedicated to Robert E. Herkert in memory of his untimely passing on
Factors that influence farm business behavior
 Catalogue no. 21-004-XIE September 2000 Factors that influence farm business behavior By Deborah Niekamp and Margaret Zafiriou Farm operators and farm families in Canada are a diverse group. Farm operators
Netherlands Training Placements 2017
 Dairy farming Dairy (milk cows) breeding and propagation of ornamental flowers ; modern company Arable and Field vegetables production Biological arable farming and field vegetable prod Dairy Biological
Manitoba Pig and Pork Industry
 Manitoba Pig and Pork Industry History: Manitoba farmers have been raising pigs since the province was settled by Europeans in the 18s. Pig production has fluctuated over the decades depending on market
Certified Organic Production in Canada Prepared for Canadian Organic Growers
 Certified Organic Production in Canada 25 Prepared for Canadian Organic Growers By Anne Macey August 26 Certified Organic Production in Canada 25 Published August 26 Canadian Organic Growers Inc. 323 Chapel
Agriculture in Bulgaria
 Agriculture in Bulgaria Situation and development of the national economy Economy of Bulgaria in 2007 the first year as a Member State of the European Union is economically stable and there is an increase
Market utilization overview. Grain Farmers of Ontario
 Market utilization overview Grain Farmers of Ontario Introduction AGRICULTURE IS AN important economic driver for the province of Ontario. In 2016, more than 13 million metric tonnes of barley, corn,
MARKET PROMOTIONS SURVEY MAINE FOOD OR FARM PRODUCTS PRODUCED, DISTRIBUTED, RAISED OR HARVESTED FOR SALE
 SECTION I BASIC DATA Instructions: Fill in your name, business name and other contact information the way you want to see it published for potential customers/buyers to read. Answer the questions below
CERESSYS ASSESSMENT OF THE ECONOMIC CONTRIBUTION OF AGRICULTURAL AND AGRI-FOOD EXPORTS TO THE CANADIAN ECONOMY.
 CERESSYS ASSESSMENT OF THE ECONOMIC CONTRIBUTION OF AGRICULTURAL AND AGRI-FOOD EXPORTS TO THE CANADIAN ECONOMY. Bertrand Montel, PhD for the Canadian Agri-Food Trade Alliance July 2016 Bertrand Montel
USDA Farm Data for the HICAHS Region
 USDA Farm Data for the HICAHS Region The six-state HICAHS region includes Colorado, Montana, North Dakota, South Dakota, Utah, and Wyoming. Through an agreement with the Southwest Center for Agricultural
L I V E S T O C K. Alberta Livestock Industry in Table No.
 Alberta Livestock Industry in 2008 Table No. 48. Livestock on Farms, Canada and Provinces, July 1, 1997-2008 49. Cattle and Calves on Alberta Farms, July 1, 1963-2008 50. Pigs on Alberta Farms, July 1,
Overview of livestock farm operating expenses
 Catalogue no. 96 32 X No. 008 ISSN 0-662-369-4 Canadian Agriculture at a Glance Overview of livestock farm operating expenses by Jean-Mathieu Lachapelle Release date: October 28, 2014 How to obtain more
Adding Value with Horticulture Farming
 Adding Value with Horticulture Farming Patrick Byers Regional Horticulture Specialist University of Missouri Extension 417-881-8909 byerspl@missouri.edu Outline Introduction Inventory your resources Determine
The Value of Plant Science Innovations to Canadians. Prepared for: CropLife Canada
 The Value of Plant Science Innovations to Canadians Prepared for: CropLife Canada 2015 Table of Contents Executive Summary... 2 1. The Plant Science Sector in Canada... 6 1.1. What is Plant Science?...
VENDOR APPLICATION (Please complete all 3 pages) Taxes: Please circle the options that applies to you:
 Taxes: Please circle the options that applies to you:") VENDOR APPLICATION (Please complete all 3 pages) Please Clearly Print the following information: Contact Person Name: Farm/ Business Name (if applicable): Address: City, State, Zip: Phone (Home): Phone
VENDOR APPLICATION (Please complete all 3 pages) Please Clearly Print the following information: Contact Person Name: Farm/ Business Name (if applicable): Address: City, State, Zip: Phone (Home): Phone
PLANT ENTERPRISES PRODUCTION
 s COTTON Lint - Non-irrigated 11,539.0 910.00 10,500,490 lbs. $5,460,255 Seed - Non-irrigated 11,539.0 1,456.00 16,800,784 lbs. $924,043 Cotton () 9 11,539.0 $6,384,298 FORESTRY Pulpwood Hardwood 44,476
AGRICULTURE Statistics
 Agriculture Statistics Index: http://www.gov.mb.ca/agriculture/market-pricesand-statistics/index.html AGRICULTURE Statistics MANITOBA CROP HIGHLIGHTS 2016 CENSUS OF AGRICULTURE Farm Area: Total farm area
Statistics. October Manitoba Agricultural Review LIST OF GRAPHS : GRAPH Land Use TABLE OF CONTENTS : INTRODUCTION
 Manitoba Agricultural Review 2001 Table of Contents - Manitoba Agriculture and Food Statistics October 2002 Manitoba Agricultural Review 2001 LIST OF GRAPHS : GRAPH Land Use TABLE OF CONTENTS : INTRODUCTION
Protectionist View Impacts on American Agriculture VERONICA NIGH AMERICAN FARM BUREAU FEDERATION 11/13/2018
 Protectionist View Impacts on American Agriculture VERONICA NIGH AMERICAN FARM BUREAU FEDERATION 11/13/2018 What s Changed and What Hasn t Trade is Still Important FTA Renegotiation Finally Concluding
CENSUS OF AGRICULTURE PROFILE 2011
 1 NOVA SCOTIA CENSUS OF AGRICULTURE PROFILE 2011 As of the 2011 Statistics Canada Census of Agriculture, Nova Scotia was home to 1.9 percent of all farms in Canada, up slightly from 1.7 percent in 2006.
Mississippi Fresh Produce Availability Calendar
 Mississippi Fresh Produce Availability Calendar Product Jan Feb Mar Apr May Jun Jul Aug Sep Oct Nov Dec FRUITS Apples 15th ------- 15th Blueberries 25th ------- 25th Muscadines 5th 15th Peaches 15th -------
Rural NYS II. Agriculture. Farmland in NYS. Top AgCounties (receipts) Grape Regions. Pumpkins. New York is an Agricultural State
 Grape Regions. Pumpkins. New York is an Agricultural State") Farmland in NYS Rural NYS II Agriculture Prof. Anthony Grande AFG 2012 New York is an Agricultural State Top AgCounties (receipts) NATIONAL RANK COMMODITY 26 Tot. Value, Agric Products 2 Pumpkins 2 Apples
Farmland in NYS Rural NYS II Agriculture Prof. Anthony Grande AFG 2012 New York is an Agricultural State Top AgCounties (receipts) NATIONAL RANK COMMODITY 26 Tot. Value, Agric Products 2 Pumpkins 2 Apples
Colorado Reader. What is Agriculture? Food, Fiber and Natural Resource Literacy Colorado Foundation for Agriculture -
 Colorado Reader AG in the Classroom - Helping the Next Generation Understand Their Connection to Agriculture Food, Fiber and Natural Resource Literacy Colorado Foundation for Agriculture - www.growingyourfuture.com
Table 10: U.S. AGRICULTURAL IMPORTS FROM CANADA, 1995 AND 1996
 Table 10: U.S. AGRICULTURAL IMPORTS FROM CANADA, 1995 AND 1996 Canada Canada Commodity / Calendar year Jan.- Jan. Jan.- Jan. Jan.- Jan. Jan.- Jan. Change from Change from Share of total Share of total
Appendix B. General Explanation and Report Form
 Appendix B. General Explanation and Report Form DEVELOPMENT OF THE REPORT FORM Planning for the NASS organic production survey began in the fall of 2013. Report form content was developed with individuals
Agricultural Marketing and Development, Phone: , $20.00 (Required) (3100)
 (3100)") Application for Minnesota Grown 625 Robert St. N., St. Paul, MN 55155-2538 www.mda.state.mn.us Agricultural Marketing and Development, Phone: 651-201-6140, mngrown.mda@state.mn.us Labeling License and
Application for Minnesota Grown 625 Robert St. N., St. Paul, MN 55155-2538 www.mda.state.mn.us Agricultural Marketing and Development, Phone: 651-201-6140, mngrown.mda@state.mn.us Labeling License and
Table 8: U.S. AGRICULTURAL IMPORTS FROM MEXICO, 1995 AND 1996
 Table 8: U.S. AGRICULTURAL IMPORTS FROM MEXICO, 1995 AND 1996 Mexican Mexican Commodity / Calendar year Jan.- Jan. Jan.- Jan. Jan.- Jan. Jan.- Jan. Change from Change from Share of total Share of total
The Measure of California Agriculture
 The Measure of California Agriculture CHAPTER 4 University of California Agricultural Issues Center Marketing, Trade, Policy and Risk Management 4-3...Cooperatives 4-7...Marketing channels 4-9...International
PRODUCT CENTER For Agriculture and Natural Resources Room 80 Agriculture Hall, Michigan State University, East Lansing, MI (517)
") THE STRATEGIC MARKETING INSTITUTE WORKING PAPER The Economic Impact and Potential of Michigan s Agri-Food System H. Christopher Peterson William A. Knudson Getachew Abate 1-1606 January 2006 PRODUCT CENTER
THE STRATEGIC MARKETING INSTITUTE WORKING PAPER The Economic Impact and Potential of Michigan s Agri-Food System H. Christopher Peterson William A. Knudson Getachew Abate 1-1606 January 2006 PRODUCT CENTER
Findings from the Township of Langley Food Self-reliance Study
 The Township of Langley Food System Study Institute for Sustainable Food Systems Findings from the Township of Langley Food Self-reliance Study Authors: Wallapak Polasub Emily Hansen Kent Mullinix Caitlin
Economic Contribution of Agriculture to Polk County s Economy
 Economic Contribution of Agriculture to Polk County s Economy J.A. Stricker 1 In urbanizing areas, like Polk County, using land for agriculture is often thought of as a temporary land use. The feeling
PRICE INDICES IN AGRICULTURE, THIRD QUARTER OF
 PRICE INDICES IN AGRICULTURE, THIRD QUARTER OF 2017 1 Producer price indices in agriculture The producer price index in agriculture in the third quarter of 2017 increased by 3.6% in comparison with the
Industry and Market Highlights
 Ag Statistics 101 Series Industry and Market Highlights............................... Webinar March 22, 2018, 9:00AM-10:30AM Agenda Industry Highlights Eric Liu, Manitoba Agriculture Eric is Manger of
Washington State Certified Organic Acreage, Sales and Dairy Cattle Tables Revised March, 2011
 Washington State Certified Organic Acreage, Sales and Dairy Cattle 2005-2010 Tables Revised March, 2011 Table of Contents Table 1. Washington National Organic Program (NOP) certified organic acreage summary,
Oregon Farms Generate Buying Power
 Oregon Farms Generate Buying Power $176 million firsf sfep beyoncf the farm gafe by Gerald E. Korzan Agricultural Economist MAY, 1958 AGRICULTURAL EXPERIMENT STATION OREGON STATE COLLEGE, CORVALLIS -I.-
Prices Received, Prices Paid, and Ratio of Prices Received to Prices Paid Indexes 2011 Base United States: February 2015 with Comparisons
 Agricultural Prices ISSN: 1937-4216 Released March 30,, by the National Agricultural Statistics Service (NASS), Agricultural Statistics Board, United States Department of Agriculture (USDA). Special Note
We grow a lot more than you may think
 We grow a lot more than you may think Find out what makes our agriculture and agri-food industry the apple of Canada s eye Agriculture and Agri-Food Canada Agriculture et Agroalimentaire Canada Ag Facts
SANTA CRUZ COUNTY 2007 CROP REPORT
 2007 CROP REPORT County of Santa Cruz OFFICE OF THE AGRICULTURAL COMMISSIONER KEN CORBISHLEY AGRICULTURAL COMMISSIONER SEALER OF WEIGHTS AND MEASURES DIRECTOR, MOSQUITO AND VECTOR CONTROL A.G. Kawamura,
Intensive Livestock Farming: Does Farm Size Matter?
 Statistics Canada Agriculture Division Agriculture and Rural Working Paper Series Working Paper No. 48 Intensive Livestock Farming: Does Farm Size Matter? Prepared by Martin S. Beaulieu, MSc, Analyst Analysis
Farmers & Farmers Market Handbook
 Farmers & Farmers Market Handbook Senior Farmers Market Nutrition Program Texas Department of Agriculture In accordance with Federal civil rights law and U.S. Department of Agriculture (USDA) civil rights
BC FARM BUSINESS ADVISORY SERVICES PROGRAM APPLICATION
 BC FARM BUSINESS ADVISORY SERVICES PROGRAM APPLICATION PART A APPLICANT INFORMATION Please complete the sections below that apply to you. (check one in each section) Section 1 You are applying as: A sole
Farm Credit Canada Annual Report
 16 17 2016-17 Annual Report Annual Report 2016-17 19 Agriculture industry overview FCC advances the business of agriculture by lending money to all agriculture sectors, including primary producers, agribusinesses
2017 COLUSA COUNTY CROP REPORT
 2017 COLUSA COUNTY CROP REPORT Table of Contents 2 Agricultural Commissioner's Letter 3 Staff 4 Apiary Products / Organic Production 5 Fruit & Nut Crops / Vegetable Crops 6 Field Crops 7 Rice Totals Graph
1979 Food and Agricultural Outlook
 1979 Food and Agricultural Outlook NEIL A. STEVENS and CLIFTON B, LUTTRELL ~HE 1979 forecast of U.S. food and agricultural developments by the U.S. Department of Agriculture (USDA) points to larger food
County of Elgin. Final Report. Agriculture + Agri-Business Sector Profile. July 2009
 Final Report County of Elgin Agriculture + Agri-Business Sector Profile July 2009 County of Elgin Agriculture + Agri-Business Sector Profile 1 P age Contents 1 Background... 4 2 Industry Trends Assessment...
Current Status of Organic Agriculture in Washington State
 Current Status of Organic Agriculture in Washington State 21 Revised April, 211 Photo by C. Donovan Elizabeth Kirby and David Granatstein WSU-Center for Sustaining Agriculture and Natural Resources In
Farm and Off-Farm Income Statistics
 Catalogue no. 21-019-XIE Farm and Off-Farm Income Statistics 2001 Statistics Canada Statistique Canada How to obtain more information Specific inquiries about this product and related statistics or services
Irrigation Scheduling
 Irrigation Scheduling Order No. 577.100-11 October 2011 AGRICULTURE IRRIGATION SCHEDULING CALCULATOR The Agriculture Irrigation Scheduling Calculator (AISC) is a water management tool to assist producers
1. LEGAL STATUS OF THE FARM (to confirm, write ``x``)
") 69 1 LEGAL STATUS OF THE FARM (to confirm write ``x``) 1 LEGAL PERSON 3 FAMILY FARM (OPG) 2 FARM INFORMATION (to confirm write ``x``) 4 Farm is no longer engaged in agricultural production 8 Other (out
69 1 LEGAL STATUS OF THE FARM (to confirm write ``x``) 1 LEGAL PERSON 3 FAMILY FARM (OPG) 2 FARM INFORMATION (to confirm write ``x``) 4 Farm is no longer engaged in agricultural production 8 Other (out
Catalogue no X. Statistics on Revenues and Expenses of Farms
 Catalogue no. 21-208-X Statistics on Revenues and Expenses of Farms How to obtain more information For information about this product or the wide range of services and data available from Statistics Canada,
Characterizing U.S. Fruit and Vegetable Production
 Characterizing U.S. Fruit and Vegetable Production Daniel Pick, Chief & Agnes Perez, Agricultural Economist Specialty Crops and Fibers Branch The Fruit and Vegetable Industry Census of Agriculture reports
Agriculture and Food Processing in Washington State Economic Impacts and Importance of Water
 Agriculture and Food Processing in Washington State Economic Impacts and Importance of Water 2015 PNWER Conference July 14, 2015 Spencer Cohen Senior Economist spencer@communityattributes.com Contents
BC FARM BUSINESS ADVISORY SERVICES PROGRAM APPLICATION. First Nations Agricultural Opportunities Assessment
 BC FARM BUSINESS ADVISORY SERVICES PROGRAM APPLICATION First Nations Agricultural Opportunities Assessment 2013-2017 Agricultural Opportunities Assessments are intended to aid First Nations communities