Vientiane, October 2014
|
|
|
- Sophia Walters
- 6 years ago
- Views:
Transcription


1 LAO PDR Lao Census of Agriculture 2010/11 Analysis of Selected Themes Vientiane, October 2014
2 Copyright 2014 by the Ministry of Agriculture and Forestry, Government of the Lao People s Democratic Republic All rights reserved. No part of this publication may be reproduced, distributed, or transmitted in any form or by any means, including photocopying, recording, or other electronic or mechanical methods, without the prior written permission of the publisher. For permission requests, write to the publisher at the address below. Ministry of Agriculture and Forestry Department of Planning and Cooperation P.O. Box 811, Lane Xang Avenue Patouxay Square, Vientiane, Lao PDR ii
3 LAO CENSUS OF AGRICULTURE 2010/11: ANALYSIS OF SELECTED THEMES Vientiane, October September iii
4 Foreword The Lao Census of Agriculture (LCA) of 2010/11 was a landmark achievement for the Lao PDR in generating an important dataset and asset for decision-makers, researchers, and development practitioners throughout country. The census built and improved upon the achievements of the first LCA of 1999/98, both of which provide a benchmark to examine agricultural trends and measure the progress of development goals. While collecting the data is of eminent importance, as important is the analysis of the data so that it can be readily understood, contextualized, compared with other data sources, and incorporated into policy and project decision-making. Thus, with the assistance of the Food and Agriculture Organization of the United Nations, the Ministry of Agriculture and Forestry has put together this report to examine and analyse the key themes emerging from the census. Focusing on key issues of farming household profiles, land use and cropping patterns, livestock and poultry production, forestry, aquaculture and fisheries, and infrastructure development in the Lao PDR, this report will be helpful for a wide audience. It is our hope that this report will contribute to the country s progress towards achieving the Millennium Development Goals in 2015 and escaping the category of Least Developed Country by Agriculture and related sectors are key components of achieving these goals and thus it is critically important to assess the changes that have occurred in the past decade between the two LCAs. One of the most productive aspects of this report is that it does not simply provide an account of the findings from the LCA 2010/11, but carries out a robust analysis of the data in relation to data from the LCA 1999/98 as well as data from other sources and the prevailing literature on the various themes. This approach allows each chapter to provide a well-rounded analysis of the various themes as well as go into the specific details of the various indicators and census questions. There are differences between the some census results shown in this report and data from other sources. This is mainly because of different data collection methodologies, but might also reflect data quality problems. Overall, the studies find that there have been significant changes in the agricultural and related sectors in the Lao PDR. Agricultural modernization has occurred quickly as farmers have adopted modern agricultural technologies and have become integrated into market-based production, with evidence of livelihood benefits. However, the analyses also show that many challenges and constraints remain, particularly inequalities in productivity and development between upland and lowland areas and large remaining instances of rural poverty. The LCA and this report provide the means to gauge these changes and inform decisions on future actions to develop and improve the agricultural sector and reduce rural poverty. Xaypladeth Choulamany Director General, Department of Planning and Cooperation Ministry of Agriculture and Forestry, Lao PDR Stephen Rudgard Representative to Lao PDR Food and Agriculture Organization of the United Nations i i
5 Acknowledgements This publication is the result of contributions from a number of people. Mr. Purushottam Mudbhary, previously FAO Representative to Lao PDR, planned it and supervised the team carrying out the analysis and preparing the chapters. Mr. Viswanathan Pozhamkandath drafted most of the content, except the chapter on livestock and poultry production which was drafted by Mr. Sonevilay Nampanya and the chapter on gender aspects which was drafted by Ms. Nami Ishihara. The publication is based on the agricultural census data provided by Department of Planning and Cooperation, Ministry of Agriculture and Forestry Lao PDR, which assigned Mr. Souksavanh Intharack to support the work of the authors. Professor Sisira Jayasuriya of Monash University in Australia thoroughly reviewed all chapters and helped the authors revise them substantively. Mr. Mukesh Srivastava, Senior Statistician, and Mr. Joachim Otte, Senior Animal Production and Health Officer, at FAO Regional Office for Asia and the Pacific (RAP) provided comments and advice on selected chapters. The publication was edited by Mr. Brett Shapiro. Mr. Miles Kenney-Lazar compiled and formatted the chapters and other components of the publication into a unified whole. Finally, the financial support of the Swiss Development Cooperation is gratefully acknowledged. ii
6 Contents Foreword... i Acknowledgements... ii Contents... iii List of tables, figures, appendices... vi Acronyms & abbreviations... x Executive summary... xii Chapter 1 Overview of economic growth and the agricultural sector in regional context... 1 Selected indicators of economic growth in Lao PDR in recent decades... 2 Gross value added in agriculture and its composition... 4 Trends in exports, including exports of agriculture products... 4 Agriculture and economic development in Lao PDR: A comparative perspective... 5 Demographic profile... 6 Land use characteristics... 7 Economic indicators... 8 Agricultural production structure and export performance... 9 Conclusion Chapter 2 Overview of the Lao Census of Agriculture 2010/ Agricultural Census of Lao PDR Lao Census of Agriculture 1998/ Lao Census of Agriculture 2010/ Chapter 3 Profile of farm households Profile of households in Lao PDR Distribution of households by rural/urban and geographical setting Demographic and socio-economic characteristics of farm households Structure and composition of farm households Ethnic characteristics of farm households Modes of farm management Adoption of technology by farm households Conclusion Chapter 3 appendices Chapter 4 Land use, cropping pattern changes and agricultural performance Land use and changes in cropping patterns Changes in cropping pattern Cropping pattern changes: temporary (seasonal) crops iii
7 Rice production in Lao PDR Cropping pattern changes: permanent crops Agricultural performance: resource use and farm management practices Use of fertilizers and pesticides Use of irrigation Farm mechanization Farm labour and labour markets Use of farm credit and access to farm information Agricultural performance: the crop sector Rice Sector Performance of maize Performance of coffee and tea Emergence of rubber plantations...64 Chapter 4 appendices...67 Conclusion Chapter 5 Livestock and poultry production Overview of meat consumption and production in Lao PDR and neighbouring countries Current livestock and poultry production in Lao PDR Farm households with livestock and poultry Trends in the numbers of cattle and buffaloes Trends in the numbers of small livestock and poultry Factors affecting numbers of buffaloes and cattle Vaccination and prevalence of endemic animal diseases Livestock market information Roles of livestock development, gender and ethnic equality and human nutrition Improvement of farmer knowledge, attitude and practice (KAP) on animal health and production Chapter 5 appendices Chapter 6 Forestry, aquaculture and fisheries Forestry and aquaculture and fishery subsectors: Trends and current status Changing forest landscape and its importance Non-timber forest products...93 Household dependence on forestry and fishery subsectors: Evidence from LCA 2010/ Household dependence on forestry Use of public forests Use of own forest holdings Aquaculture and fishery subsectors Household dependence on aquaculture and fisheries: Evidence from LCA Challenges facing the forestry and fishery subsectors iv
8 Chapter 6 appendices.105 Chapter 7 - Gender aspects in Lao PDR agriculture Household headship and decision-making Ethnicity and household headship Access to land Use of technology and agricultural inputs Credit use Sources of information Wage inequality Crop production Livestock and poultry-raising Livelihood sources and strategies Labour allocation within agricultural households Summary and conclusions Chapter 8 Village-level infrastructure and development constraints Status of infrastructure development in the villages: Evidence from LCA 2010/ Access to roads, primary education and health care Access to water supply, electricity, year-round roads and telecom services Household water supply Public services Land allocation and resettlement of villages Farming environment in the villages Presence of unexploded ordnance Shifting cultivation and land degradation Agricultural infrastructure Irrigation infrastructure Financial institutions and credit facilities Agricultural marketing facilities Rural development projects Living standards in the villages Constraints and problems faced by farmers Climatic variability and natural disasters Conclusion Chapter 8 appendices References v v
9 List of tables, figures, appendices Tables Table 1.1: Changes in the sectoral composition of GDP, 1990s and 2000s... 3 Table 1.2: Gross value added in agriculture sector, (at constant prices 2002)... 4 Table 1.3: Trends in major exports, including agricultural products, 1991 to 2012 (million US$)... 5 Table 1.4: Trends in exports of major agricultural and livestock products, (million US$)... 5 Table 1.5: Demographic profile of Lao PDR and its neighbouring countries... 7 Table 1.6: Major categories of land use in Lao PDR and its neighbouring countries in Table 1.7: Key economic indicators, Lao PDR and its neighbouring countries... 8 Table 1.8: Farm size, resource use and farming practices across countries Table 1.9: Distribution of cropped area across countries, Table 1.10: Area and production of rice, Lao PDR and other countries, Table 1.11: Trends and structure of agricultural products exports, Lao PDR and its neighbouring countries...12 Table 2.1: Major data components of the Lao Census of Agriculture, 2010/ Table 3.1: Changes in the profile of the households in Lao PDR between 1998/99 and 2010/ Table 3.2: Geographical profile of households and land area in Lao PDR, 2010/ Table 3.3: Distribution of farm and non-farm households by geographical location and region, 2010/ Table 3.4: Distribution of farm households by geographical location and type of village across regions, 2010/ Table 3.5: Demographic characteristics of farm households, by regions, 1998/99 & 2010/ Table 3.6: Sex ratio, by age, of farm households, 2010/ Table 3.7: Distribution of farm households based on landholding size and household size in Lao PDR, 2010/ Table 3.8: Age structure of farm households, by gender and region, 2010/ Table 3.9: Farming operations of the households by ethnic groups, 2010/ Table 3.10: Mode of farm management at household level, 2010/ Table 4.1: Major changes in agricultural land use in Lao PDR between 1998/99 and 2010/ Table 4.2: Features of land use by region, LCA 2010/ Table 4.3: Number of growers and area under temporary crops in Lao PDR, 1998/99 & 2010/ Table 4.4: Important features of rice activity in Lao PDR, by region, 2010/ Table 4.5: Number of growers and area under permanent crops in Lao PDR, 1998/99 & 2010/ Table 4.6: Regional concentration of permanent crops in Lao PDR, 2010/ Table 4.7: Changes in the use of fertilizers and pesticides in Lao PDR, 1998/99 and 2010/ Table 4.8: Irrigated land use and rice area irrigated, by type of land, 2010/ Table 4.9: Use and ownership of farm machinery by farm households, 2010/ Table 4.10: Use of farm machinery and equipment by size class of farm, 2010/ Table 4.11: Use of draught animals and tractors by farm households, 2010/ Table 4.12: Distribution, by landholding size class, of farm households obtaining agricultural credit from major sources, 2010/ Table 4.13: Contributions from crop production sector towards Lao Agricultural GDP, 2008/09 to 2010/11 (at constant 2002 prices) Table 4.14: Trends in rice area and production in Lao PDR by type of land, 1976 to Table 5.1: Meat production in Lao PDR and its neighbouring countries, (kg per capita per year)...74 Table 5.2: Number of cattle and buffaloes in the LCA 2010/11 ('000) and their population change (%) between 1999 and 2011 by regions Table 5.3: Number of pigs and goats in the LCA 2010/11 ('000) and their population change (%) between 1999 and 2011 by regions Table 5.4: Number of poultry by species in the LCA 2010/11 ('000) and their population change (%) between 1999 and 2011 by regions Table 5.5: Vaccination rate (%) of the farm households with livestock by type of animals and region in the LCA 2010/ vi vi
10 Table 6.1: Trends in forest-planted area in Lao PDR, Table 6.2: Details of forest lands owned by farm households, 1998/99 and 2010/ Table 6.3: Use of public forests by households of different landholding sizes, 2010/11 (% of farm households)...96 Table 6.4: Household use of public forests by types of villages and geographical locations, 2010/11 (% of farm households)...96 Table 6.5: Utilization of products from own forest holdings, 2010/ Table 6.6: Farm household data on capture fishing and aquaculture, 1998/99 & 2010/ Table 6.7: Source of capture fisheries, 2010/ Table 7.1: Ethnic groups with the highest prevalence of female-headed households Table 7.2: Ethnic groups with the lowest prevalence of female-headed households Table 7.3: Average area of agricultural and irrigated land holding, by household type Table 7.4: Main source of information for agricultural production activities Table 7.5: Village-level wage gap by agro-ecological zone Table 7.6: Top 10 wet-season temporary crops grown by male-headed farm households (by planted area) Table 7.7: Top 10 wet-season temporary crops grown by female-headed farm households (by planted area) Table 7.8: Top 10 dry-season temporary crops grown by male-headed farm households (by planted area) Table 7.9: Top 10 dry-season temporary crops grown by female-headed farm households (by planted area) Table 7.10: Top 10 permanent crops grown by male-headed farm households (by planted area) Table 7.11: Top 10 permanent crops grown by female-headed farm households (by planted area) Table 7.12: Average number of livestock and poultry per farm household by household type and difference between male and female-headed households Table 7.13: Main economic activity of men and women (15-64 years) Table 7.14: Main economic activity of men and women (15 years and over), 1998/ Table 8.1: Access to primary education and health care facilities, 2010/ Table 8.2: Access to water supply, electricity, concrete roads and telecom services, 2010/ Table 8.3: Distribution of villages based on household use of different water sources, 2010/ Table 8.4: Land allocation and resettlement of villages, 2010/ Table 8.5: Presence of UXOs in the rural villages and potential for land development, 2010/ Table 8.6: Villages practicing shifting cultivation and affected by soil degradation Table 8.7: Agricultural infrastructure status in the rural villages of Lao PDR, 2010/ Table 8.8: Availability of irrigation facilities in villages by region and type of land, 2010/ Table 8.9: Major types of irrigation infrastructure in the villages, 2010/ Table 8.10: Availability and types of credit facilities in rural villages, 2010/ Table 8.11: Marketing of agricultural produce in the rural villages, 2010/ Table 8.12: Presence of rural development projects by sector in the villages, 2010/ Table 8.13: Major constraints and problems faced by farmers in the villages Table 8.14: Changes in weather conditions in rural villages by region, village and land type, 2010/ Table 8.15: Incidence of natural disasters in the villages as reported by village heads Figures Figure 1.1: Map showing the geographical location of Lao PDR and its provinces... 6 Figure 1.2: Trends in agriculture value added (% GDP): Lao PDR and others... 9 Figure 1.3: Trends in cereal productivity across countries, 1991 to Figure 3.1: Changes in the status of households in Lao PDR, 1999 & Figure 3.2: Changes in the status of households by region, Figure 3.3: Provinces showing a rise in number of non-farm households between 1999 and Figure 3.4: Proportion of non-farm households in major provinces Figure 3.5: Share of urban households and urban farm households across provinces, 2010/ Figure 4.1: Distribution of farm landholdings and area in Lao PDR 2010/ Figure 4.2: Changes in area under temporary and permanent crops, 1999 to Figure 4.3: Number of permanent crop growers across provinces, 1998/99 and 2010/ vii vii
11 Figure 4.4: Proportion of farmers growing rice and area under rice, by province, 2010/11 (%) Figure 4.5: Cultivation of maize, cassava and sugar cane across provinces, 2010/ Figure 4.6: Use of fertilizers and pesticides across provinces, 2010/ Figure 4.7: Major sources of irrigation, 2010/ Figure 4.8: Irrigation use by size of landholdings in Lao PDR, 2010/ Figure 4.9: Female contributions to rice farming activities, 2010/ Figure 4.10: Distribution of farm population based on activity in farming and livestock, 2010/ Figure 4.11: Farm households reporting production mainly for sale, 1998/99 and 2010/ Figure 4.12: Long-term trends in rice productivity in Lao PDR by growing environment Figure 4.13: Trends in rice productivity in Lao PDR by growing environment, Figure 4.14: Trends in area, production and yield of maize in Lao PDR, Figure 4.15: Trends in area, production and productivity of coffee and tea in Lao PDR, Figure 5.1: Number of farm households with livestock and poultry by regions Figure 6.1: Changes in forest cover in Lao PDR, Figure 6.2: Trends in fish production by type, Figure 6.3: Per capita fish availability across provinces in Lao PDR Figure 7.1: Estimated farm population by sex and age, 2010/ Figure 7.2: Changes in sex ratio: (number of males per 100 females) Figure 7.3: Proportion of male, female and joint-headed farm households 2010/11 (number of households in parenthesis) Figure 7.4: Proportions of male and female-headed farm households 1998/ Figure 7.5: Average number of household members in male, female and joint-headed farm households by region 111 Figure 7.6: Proportions of male, female and joint-headed farm households by agro-ecological zone Figure 7.7: Prevalence of female-headed farm households by village type Figure 78.8: Proportion of male, female and joint decision-maker farm households 2010/11 (number of households in parenthesis) Figure 7.9: Proportion of male, female and joint decision-maker farm households by agro-ecological zone Figure 7.10: Proportions of female-headed farm households within language family categories Figure 7.11: Land size distribution of agricultural land holdings, by type of farm household Figure 7.12: Land size distribution of irrigated land holdings, by type of farm household Figure 7.13: Average area (ha) of agricultural land operated by male, female and joint-headed farm households by region Figure 7.14: Average area (ha) of irrigated land operated by male, female and joint-headed farm households by region Figure 7.15: Farm households using farm machinery, by type of machinery and sex of household decision-maker 118 Figure 7.16: Farm households using agricultural inputs by type of agricultural input and sex of household decisionmaker Figure 7.17: Farm households that have a current loan for agricultural purposes, by sex of household decision-maker Figure 7.18: Percentage Distribution of source of loans by type of household Figure 7.19: Livestock and poultry-raising in farm households by household type Figure 7.20: Main source of income for male-headed farm households Figure 7.21: Main source of income for female-headed farm households Figure 7.22: Percentage of farm households that sold an agricultural product in the last 12 months, by type of household Figure 7.23: Percentage of male and female-headed farm households selling crop and livestock products by region Figure 7.24: Male-female ratio of farm household work by specific rice cultivation activity Figure 7.25: Time spent on crops during the past 12 months, by men and women viii
12 Figure 7.26: Time spent per day on livestock, by men and women Figure 8.1: Major sources of electricity supply in the villages, 2010/ Figure 8.2: Sources of household water supply in the villages, 2010/11... Figure 8.3: Distribution of villages based on presence of public services, 2010/ Figure 8.4: Number of villages and land area affected by UXO in Lao PDR Figure 8.5: Villages and land area affected by UXOs across provinces, 2010/ Figure 8.6: Irrigation facilities in villages across provinces, 2010/ Figure 8.7: Major types of irrigation infrastructure in the villages Figure 8.8: Villages with access to credit (%), 2010/ Figure 8.9: Source of funding for development projects in the villages Figure 8.10: Changes in living standards in the rural villages, 2010/ Figure 8.11: Villages reporting no change or a decline in living standards, Figure 8.12: Gender wage equality across regions and type of villages Figure 8.13: Gender wage equality in the villages across provinces Figure 8.14: Major constraints and problems faced by farmers in the villages Appendices Appendix 3.1: Changes in sex and dependence ratios among farm households across provinces, 1998/99 and 2010/ Appendix 4.1: Distribution of farm landholdings and area by size class and province, 2010/ Appendix 4.2: Agricultural land use in the provinces of Lao PDR, 2010/ Appendix 4.3: Major permanent crops grown in Lao PDR, number of growers and area planted, 2010/ Appendix 4.4: Status of irrigation development across rice-cultivated areas by type of land and rice seed used, 2010/ Appendix 4.5: Use of farm machinery and farm equipment by farm households across provinces, 2010/ Appendix 4.6: Extent of female work participation in rice-farming activities, 2010/11 (%)...70 Appendix 4.7: Distribution of family labour in various farming activities, 2010/ Appendix 4.8: Female farm population aged years working on rice holdings, by type of work done and province, 2010/ Appendix 5.1: Meat production in Lao PDR and its neighbouring countries, ('000 tonnes)...83 Appendix 5.2: Meat consumption in Lao PDR and its neighbouring countries in 2009 (kg/capita/year)...83 Appendix 5.3: Number of farm households with livestock/poultry and number of animals in Lao PDR, 1998/99 and 2010/11 census...84 Appendix 5.4: % Farm households with livestock and local chickens, herd sizes in the LCA 2010/11 by region...88 Appendix 5.5: Sex distribution of cattle, buffaloes, pigs and goats (%) in the LCA 2010/11 by region...89 Appendix 5.6: Vaccination rate (% of farm households with livestock) by type of animal, region and province in the LCA 2010/ Appendix 5.7: Characteristics of farm households by ethnic group of household head in the LCA 2010/ Appendix 6.1: Status of fish production across provinces of Lao PDR, Appendix 6.2: Details of farm households with their own forest holdings, 1998/99 and 2010/ Appendix 6.3: Household use of own forest holdings for growing various products, 2010/ Appendix 6.4: Farm households engaged in capture fishing activities, by province, 1998/99 and 2010/ Appendix 6.5: Distribution of farm households engaged in capture fisheries, by source of fish capture and province, 2010/ Appendix 8.1: (1) Deep borehole (closed) in Lao PDR, (2) Lao girl collecting water from Mekong, (3) Rainwater tank/jar in Lao PDR, (4) Gravity-fed water tap in Lao PDR Appendix 8.2: Marketing of agricultural produce in villages across provinces, 2010/ Appendix 8.3: Availability of development projects in villages across provinces, 2010/ Appendix 8.4: Major constraints and problems faced by provinces Appendix 8.5: Natural disasters in rural villages by province, 2010/ ix
13 Acronyms & abbreviations ADB AFD AFTA ASEAN AusAID BP CAG CSH FAO FMD FNPP GDP GIZ GMS HS ha HH IFAD IMF IRRI KAP Km LAK LCA LECS Lao PDR LECS LFP LSIS LUP-LA MAF MC MDG MFI MOPI MRB MSL NAFRI NH NGO NPA NSC NSEDP NTFP PFA PSFM REDD Asian Development Bank Agence Française de Développement ASEAN Free Trade Area Association of Southeast Asian Nations Australian Agency for International Development Bolovan Plateau compounded annual growth rate Central/Southern Highlands Food and Agriculture Organization of the United Nations Foot and Mouth Disease FAO Netherlands Partnership Programme gross domestic product Deutsche Gesellschaft für Internationale Zusammenarbeit Greater Mekong Subregion Haemorrhagic Septicaemia hectare household International Fund for Agricultural Development International Monetary Fund International Rice Research Institute Knowledge, Attitude and Practice kilometre Lao Kip (Lao currency) Lao Census of Agriculture Lao Expenditure and Consumption Survey Lao People s Democratic Republic Lao Expenditure and Consumption Survey Labour force participation Lao Social Indicator Survey Land Use Planning and Land Allocation Ministry of Agriculture and Forestry Mekong Corridor Millennium Development Goal microfinance institution Ministry of Planning and Investment Mekong River Basin Mean sea level National Agriculture and Forestry Research Institute Northern Highlands non-governmental organization National Protected Area National Statistics Centre National Socio-Economic Development Plan non-timber forest product Production Forest Area participatory sustainable forest management Reducing Emissions from Deforestation and forest Degradation x x
14 UNDP UNEP UNESCO USD or US$ UXO VDF VIG VP SDC WB WFP WHO WTO United Nations Development Programme United Nations Environment Programme United Nations Educational, Scientific and Cultural Organization United States dollars Unexploded Ordnance Village Development Fund village irrigation groups Vientiane Plains Swiss Agency for Development and Cooperation World Bank World Food Programme World Health Organization World Trade Organization xi
15 Executive summary The second Lao Census of Agriculture (LCA) in the Lao People s Democratic Republic (Lao PDR) was carried out in 2011 and collected crop data for the wet season of 2011 and the dry season of 2010/11. The LCA 2010/11created an important and rich set of data on a wide range of key agricultural topics, with connections to related fields such as forestry, fisheries, infrastructure, and rural development. These data are immensely useful for decision-makers, researchers and project managers, among others, working in Lao PDR. However, the census data on their own can be challenging to interpret and use without contextual understanding, references to other related sources of data and information, and comparison with previous census data. In order to make the data accessible for a wide audience, it is necessary to provide initial analysis. It is for this reason that the Ministry of Agriculture and Forestry (MAF), with assistance from the Food and Agriculture Organization of the United Nations (FAO), has produced this report, which analyses selected themes from the LCA 2010/11 and draws out some important changes that have taken place during recent years through comparisons with the previous LCA conducted in 1998/99. The approach of analysis taken in this report is to focus on themes that were given high importance within the census and seen as most important for the agricultural sector in Lao PDR. The six themes analysed are: the composition and structure of farm households; land use, cropping patterns and agricultural performance; forestry, aquaculture and fisheries; village-level infrastructure and development constraints; livestock and poultry production; and gender dimensions of the agricultural sector. To place the discussion of these themes in perspective, in Chapter 1 an overview is presented of the trends in growth and structure, as well as the state of development of the agricultural sector in Lao PDR in the comparative regional context of its neighbouring countries, namely Cambodia, Myanmar, Thailand and Viet Nam. A description of the LCA 2010/11 is also provided, including the history of the LCA in Lao PDR and the approach and methodology used. This executive summary presents some of the main findings of the chapters as well as key points specific to each theme. However, it must be noted that these findings are based on preliminary analysis of the data; they must be treated as only indicative rather than definitive at this stage. 1 The introductory overview highlights the broader context within which the agricultural sector has evolved in recent years, noting that the pace of economic activity in Lao PDR has accelerated in the last two decades, particularly after the introduction of several new policy initiatives following the launching of the Sixth Plan in 2006 (ADB 2013). This growth acceleration, also reflected in quite rapid growth in agriculture, has been accompanied by important structural changes in the economy. The share of agriculture in the overall economy has fallen but agricultural exports 1 The discussions in the following report are largely based on averages (means) of specified variables. Because there is much variation in the selected variables within different groups or categories, differences in averages may or may not be statistically significant, and conclusions based on such differences in averages must be treated as preliminary only and interpreted with appropriate caution. xii
16 have grown, rural incomes have increased and there has been a significant decline in rural poverty. However, despite agricultural productivity improvements and increased commercialization, the regional comparison reveals that the agriculture sector has much untapped potential that can be exploited to make major contributions to the growth and development of the country. For example, Lao PDR has the lowest proportion of its land under cultivation in comparison with its neighbours and only a small proportion of its rice area under irrigation. It also has the highest proportion of its total labour force still employed in agriculture. As discussed in Chapter 2, the LCA 2010/11 was much more comprehensive than the first LCA of 1998/99, and significant improvements were made in data collection approach and in thematic coverage. All 1.1 million farm households were enumerated in the 2010/11 LCA, of which (63%) were categorized as farm households and (5.3%) were randomly selected for more in-depth surveys on a wide range of topics. Village-level data were also collected from village heads in all villages throughout the country. The third chapter provides a profile of farm households in the country and analyses trends and patterns in the profile of farm households between the LCA 1998/99 and the LCA 2010/11. The LCA 2010/11 classified the Lao PDR into four topographical zones and found that a majority of households (57%) are in lowland areas, while 22 percent are settled in upland areas, and 21 percent are located in plateaus. These figures correspond closely to each topographical zone s percentage of national land area (53% for lowland, 24% for upland, and 23% for plateaus), thus indicating that population densities throughout these three zones are similar across the three land categories. Topographical distribution of the population differs by region: more than 70 percent of households in the Southern and Central provinces live in lowland areas (which comprise the majority of land in these provinces) while 74 percent of households in Northern provinces live in uplands (43%) and plateau areas (30.5%), which have a smaller proportion of lowlands. Nearly a quarter of households in the country are classified as non-farm households. They are more common in the Central provinces (where a third of all households belong to this category). By land type, most non-farm households are located in the lowlands; on the other hand, nearly all households in upland areas (94%) are farm households. The LCA 2010/11 data on households show three particularly interesting developments: First, between 1999 and 2011, the total number of households in the Lao PDR increased by 28 percent, from 0.79 to 1.02 million, but the proportion of farming households fell. While the number of farming households increased by 17 percent, non-farming households increased faster, and their proportion in total households increased from 16 to 23 percent between 1999 and The increase in non-farm households was most dramatic in the Central provinces, largely due to the presence of Vientiane Capital, but it was also noticeable in other more developed provinces. However, 80 percent of households in most provinces continue to engage in some form of agricultural or livestock activity. xiii
17 Second, the LCA 2010/11 shows the growth of urbanization and non-farm activities in the country. The percentage of urban households at the national level has now reached 31 percent. However, 47 percent of these urban households are also engaged in farming activities, showing that many households transitioning from agriculture to an urban economy continue to maintain links with the agricultural sector. Third, important changes occurred in the structure and composition of farm households between 1999 and The average farm household size declined marginally, from 6.1 to 5.7 persons. The male-to-female sex ratio (number of males/100 females) increased from 97.2 (1998/99) to (2010/11). Most households in Lao PDR own some land and the number of landless farm households remains small (<1%), at just above households or 1 percent of total farm households, although another 7 percent have less than 0.5 hectares (ha). The majority of households (65%) have landholdings of between 0.5 and 2.99 ha. Larger farms, with 3 ha and above (27%), account for 58 percent of the total farmland in the country. The fourth chapter of the report examines land use, cropping pattern changes and agricultural performance. In total, there was an increase of 66 percent in the amount of agricultural land area under cultivation between 1999 and 2011, from to 1.62 million ha, resulting in an increase of agricultural land as a proportion of total land area from 4.4 to 7.9 percent. At the same time, average landholding size per household increased by almost 50 percent, from 1.6 to 2.4 ha. Within the LCA, agricultural land was classified as land under temporary and permanent crops, land temporarily fallow, and meadows and pastures. Between 1999 and 2011, the area under temporary crops increased from to 1.23 million ha, but the share of total agricultural land declined from 73 to 66 percent because there was a shift towards permanent crops, particularly in the newly developed lands. Land devoted to permanent crops increased sixfold in the Northern provinces and two-fold in Central and Southern provinces. Larger farmers (> 3 ha) were much more likely to adopt permanent crops than smaller farmers. The share of land used for non-agricultural uses nearly doubled, increasing from 6.9 to 13.2 percent. Forest area which also includes tree plantations increased by 10 percent between the two periods, and 10 percent of the land was kept fallow in Rice continues to be the dominant temporary crop; almost 80 percent of land area used for temporary crop production is allocated for rice production, although there has been a significant expansion in maize cultivation, with the area devoted to maize increasing at an average annual rate of 15 percent. On the other hand, the number of growers of cotton, yam, sweet potato, sugar cane, and cassava fell, with cotton grower numbers falling by as much as 16 percent. The LCA 2010/11 showed that the total area of planted rice in the Lao PDR was ha, of which 72 percent was wet season lowland rice, 22 percent was upland rice, and 6 percent was dry season lowland rice. The most important rice-growing provinces were Savannakhet and Champassak, which together accounted for 33 percent of total rice area planted throughout the country. Improved rice varieties are planted in nearly half of the total rice-growing areas, but this xiv
18 proportion is much higher in the Central and Southern provinces. Over 90 percent of the rice produced is of the glutinous variety. For permanent crops, the most important change between the 1999/98 and 2010/11 LCAs was the expansion of rubber from a quite insignificant crop to one of major significance. Rubber now covers ha, and some farmers are engaged in smallholder rubber cultivation. Land under beverage crops, tea and coffee, also expanded. The area under tea increased by ha and the number of tea growers increased by The area under coffee production increased by ha and the number of growers by However, during this period the number of growers and area planted fell for some fruit crops, such as lemon, pineapple, papaya, orange, tamarind and banana. The LCA 2010/11 showed a significant increase in the adoption of several modern farming practices throughout the country compared with the previous LCA. The number of farm households in the country using fertilizers increased from 29 to 42 percent. But there remain pronounced regional differences in fertilizer use; only around 15 percent of households in the Northern provinces use any form of fertilizer compared with over half of the households in the Southern and Central provinces. The number of households using pesticides has increased from 11 to 18 percent but pesticide use remains low in the country, and only about 11 percent of farms use pesticides in rice cultivation. According to MAF, irrigated area in the country has increased from 0.17 million ha in 1995 to 0.41 million ha in 2011 and the LCA 2010/11 shows that 22 percent of all farming households use some form of irrigation, with higher rates in the Central and Northern provinces (26% and 21%, respectively) than in the Southern provinces (12%). There has been a major increase in the use of agricultural machinery; between the two rounds of the LCA the number of households using two-wheeled tractors increased from 20 to 61 percent, greatly reducing the dependence on draught animals, especially buffaloes, for farm operations. Other changes were seen in farm employment, access to credit, and market orientation. The total employed farming population between 1999 and 2011 increased by 27 percent, and the proportion of households employing outside labour increased from 26 to 45 percent. Credit use by farm households for farming operations remains limited, at only around 13 percent in 2010/11. There has been a marked shift towards more commercial farming; the number of households producing crops primarily for the market increased dramatically from 6 to 30 percent between 1999 and 2011, and households selling some part of their output in the market increased from 35 to 71 percent. Chapter 5 discusses trends in livestock and poultry production. A major finding from the two LCAs was that, while the number of farm households with cattle and goats increased by 43 and 69 percent, respectively, between 1999 and 2011, the number of households with buffaloes and pigs contracted by 30 and 6 percent, respectively. More than half of the households had some chickens and there was no change in this number. Several factors may have contributed to the large decrease in buffalo numbers. First, increased use of two-wheeled tractors has reduced the need for draught animals. Second, the reduction of common grassland with the expansion of cash xv xv
19 crop plantations, particularly in the Northern provinces, may also have been a factor, as almost 80 percent of households are reliant on natural pasture. A third factor may be the outbreak of infectious diseases, particularly Foot and Mouth Disease and Hemorrhagic Septicemia. Increase in market demand for beef and buffalo meat may also be outpacing reproduction capacity. Livestock vaccination, however, has increased dramatically between 1999 and 2011 from 36 to 56 percent for cattle, 48 to 60 percent for buffaloes, and from 8 to 18 percent for pigs. The LCA 2010/11 found that 29 percent of all farm households raised livestock mainly for sale, while 41 percent sold some livestock products. Chapter 6 reports on the forestry, aquaculture and fishery sub-sectors. The information on the forestry sector is based on data collected in the LCAs on both forest lands that are owned or operated by individual households and public forest lands used by many households. According to the LCA 2010/11, 12 percent of households owned individual forest lands, an increase from 8 percent in 1999/98. Most households, particularly upland farms, reported using public forest lands; 69 percent of households utilized public forests in 2010/11, and 38 percent sold various products sourced from public forest lands. Between 65 and 70 percent of households engaged in aquaculture and fishing, primarily as parttime activities. The majority (around two-thirds) of farm households were engaged in capture fishing or aquaculture for their own consumption. Between the two LCAs, the number of farm households engaged in capture fishing increased by 13 percent and aquaculture holdings and the area under aquaculture increased by 23 percent. The majority of aquaculture activities (90%) involve use of fish ponds, 14 percent practise rice-fish culture, and a small percentage use tanks and cages. Chapter 7 examines gender dimensions of agricultural production by using gender-differentiated data from the LCA 1998/99 and 2010/11. The data are disaggregated by the sex of the household headship, sex of the household decision-maker, and sex of members within the household. The LCA 2010/11 showed that 91 percent of households are headed by males, but 64 percent of were joint decision-makers, showing that even in male-headed households women play an important role in decision-making on agricultural activities. Furthermore, men and women appear to participate equally in all agricultural tasks and there hardly any gender difference in rural wages for men and women. While female-headed households operate smaller areas of agricultural and irrigated land, the differences are relatively small at the national level. Female decision-maker farm households use similar levels of small machinery as male decision-maker households, but use lower levels of large machinery and productivity-enhancing inputs and access less credit. However, use of inputs and credit is low among all households. Finally, there were no major differences between types of households concerning crop cultivation and cattle and poultry raising. That women are so active in agricultural production means that policy formulation and development planning aimed at increasing productivity should be aimed at both men and women. Chapter 8 analyses trends in village-level infrastructure development. The LCA 2010/11 found that 83 percent of the rural villages had some road connectivity. Around 65 percent of rural xvi xvi
20 villages had primary schools, with the lowest percentage in uplands. A pharmacy or drug kit was available in 70 percent of villages, but only 16 percent had dispensaries or hospital facilities. Residents in 54 percent of rural villages had to walk more than two hours to reach a dispensary or hospital. On average, 46 percent of villages had access to safe drinking water and 70 percent had electricity in the village, but only half of upland villages were electrified. A large number of villages had access to village development funds (49% in the Central provinces, 43% in the North, and 37% in the South) but access to other public services, such as livestock banks, cooperatives, trade groups and rice banks, was quite limited. The LCA 2010/11 revealed that land allocation programs had been implemented in 50 percent of villages, and that 10 percent of villages (19% of upland villages) had been resettled. Unexploded ordnance (UXO) continues to be a problem, particularly in the plateau and upland areas of the Southern and Central provinces. In 2010/11, 27 percent of villages in the South and 23 percent in the Central provinces were affected by UXO, with 11 percent of the land area being affected in each region. The LCA also collected data on shifting cultivation, finding not surprisingly that it was being practiced in higher concentrations in upland villages, villages without road connectivity, and in the Northern provinces. Additionally, villages that practiced shifting cultivation also tended to report moderate to severe levels of soil degradation, though this may not necessarily mean that there is a direct link between the two. Village heads in 80 percent of all villages, particularly in the North and Central provinces, and from villages with road connectivity, considered that living standards had improved during the previous two-year period. According to village heads, the major development constraints were: (a) lack of irrigation (59% of villages); (b) lack of farm inputs (43%); (c) lack of livestock vaccination (40%); (d) low agricultural commodity prices (38%); (e) lack of land for expansion of farming (29%); (f) lack of markets (24%); (g) lack of draught animals and farm machinery (16%); and (h) lack of farm labour (10%). In summary, the data gathered in the LCA 2010/11, taken in conjunction with the information from the LCA 1998/99, provides a snapshot of the dynamic changes that have taken place in the agricultural sector of Lao PDR during this decade of rapid economic transformation in the country. The data on household activities show the increasing urbanization and the shift by many households into more involvement in non-farm activities, so that the proportion of non-farming households has increased in the country, despite a large increase in the absolute number of farm households and a large increase in agricultural land area. Indeed, Lao PDR is probably one of the few developing countries in Asia where average farm size has increased quite significantly during this decade. The trends in land use, agricultural practices and market activities make it clear that the agricultural sector is both responding to and reflecting the wider changes in the economy through a transition from subsistence-dominated farming using traditional practices and techniques to a more commercial orientation, with farmers increasingly adopting modern farming practices, xvii
21 including mechanization and modern input use. The shift from subsistence farming is clear from the large increase in the proportion of farms producing partly or mainly for the market, the emergence of commercial enterprises in the livestock and poultry sector, and the rapid increase in commercial crop area, particularly in permanent crops like rubber. This change is accompanied by the wider adoption of modern farming practices, such as increasing use of purchased inputs such as fertilizer, and rapid increase in mechanization of farm operations. In this context, the LCA 2010/11 also points to the daunting challenges facing the agricultural sector, highlighting the severe weaknesses and deficiencies of the rural infrastructure and the need for improved roads, irrigation facilities and institutional infrastructure. It is hoped that this preliminary outline of the rich body of data and information in the LCA 2010/11 will encourage both researchers and policy-makers to more intensively analyse and utilize the data to provide further insights and information that can guide policy formulation to confront the challenges and exploit the opportunities for agricultural and rural development and poverty alleviation in Lao PDR. xviii
22 Chapter 1 Overview of economic growth and the agricultural sector in regional context The Lao People s Democratic Republic (Lao PDR) is a landlocked country located in the heart of the Southeast Asian region, with a geographical area encompassing square kilometres. It shares its borders with China on the north, Cambodia on the south, Viet Nam on the east, Myanmar on the northwest and Thailand on the west. Lao PDR has a long history and a rich civilization. From 1353 to 1828, the country was unified as Lane Xang (the Kingdom of a Million Elephants). In the 19th century, Thailand (formerly Siam) took control of most of the Lao Kingdom, until the French incorporated it into French Indochina, along with Cambodia and Viet Nam, in From 1893 until 1949, Lao PDR continued as a French colony, apart from a brief period of Japanese occupation in the 1940s. Lao PDR gained formal independence from France in 1953 and this was ratified under the Geneva Convention in 1954, which became the official Independence Year. In December of 1975 the Lao PDR was proclaimed and committed itself to building a socialist economy. In 1986, the Lao Government launched the New Economic Mechanism, with the ultimate aim of turning into an open-market economy with one of the most liberal foreign investment packages in the region. In July 1997, Lao PDR became a member of the ASEAN and beginning in 2008, it started gradually lowering its tariff barriers in line with the tariff reduction schedule of the ASEAN Free Trade Area (AFTA). In 2012, Lao PDR became a member of the World Trade Organization (WTO). The topography of the Lao PDR is characterized by two main geographical zones the central plains along the Mekong River and the mountainous regions to the north, east and south. The climate of Lao PDR is typically tropical. During the rainy season, from May to October, monsoon rains provide an annual average precipitation rate of around 1600 mm that is more or less evenly distributed across provinces (Department of Meteorology and Hydrology, Lao PDR). The dry season stretches from November to April, with a few summer showers in between. In terms of agro-climatic specificities, Lao PDR is divided into six distinct agro-ecological zones 2 : (a) Vientiane Plain; (b) Northern Lowlands; (c) Northern Highlands; (d) Mekong Corridor; (e) Bolovan Plateau; and (f) Central/Southern highlands. 2 This classification is based on the agro-ecological characteristics of the provinces in terms of topography, altitudes and rainfall pattern as discussed in MAF (2013). Accordingly, Vientiane Plains (VP) consists mainly of higher plains and lower slopes, with rolling topography and middle mountain areas. Located in the altitudes of meters above mean sea level (MSL), VP receives the highest rainfall, in the range of mm/per annum. Northern Lowlands (NL) are predominantly mountainous and located in the elevations of metres, with annual rainfall in the range of mm. Northern Highlands (NH) comprise steep mountainous topography with high erosion levels, located in the altitudes of metres and reporting mm of rainfall. The Mekong Corridor (MC) zone covers plains and moderate slope areas, lying in lower altitudes ( metres) and receiving mm rainfall. The Bolovan Plateau (BP) mainly consists of natural savannah, forest and grassland formations, in altitudes of metres with rainfall of mm. The Central/Southern Highlands (CSH) includes upper valleys and upland areas in an altitude of metres, reporting the second highest rainfall (in the range of ), after VP and BP. 1 1
23 Lao PDR is abundant in natural resources. These include land, water and forests, as well as other resources, including coal, hardwood timber, hydropower, gypsum, tin, gold and gemstones. With respect to water resources, a large part of Lao PDR falls within the boundaries of the Mekong River Basin (MRB), as it includes a 1865 km section of the Mekong River, which is about 38% of the entire MRB. Lao PDR and Cambodia account for about 30 percent of the population of the MRB, with Thailand (39%) and the Mekong Delta and Central Highlands of Viet Nam (31%) accounting for the rest (MRC, 2010c). The terrain is characterized by rugged mountains, rising to a highest elevation of metres, which gives the country immense hydroelectric potential. The forest and woodland cover is reported to be about 47 percent of the country s land area (MAF, 2001). These natural resources make Lao PDR potentially a very attractive destination for foreign investment. This chapter provides an overview of the trends in growth and structure, as well as the state of development of the agricultural sector in Lao PDR over the past few decades in the comparative regional context of its neighbouring countries, namely Cambodia, Thailand, Myanmar and Viet Nam. It then sets the background for a detailed account of the structure and characteristics of the farm households based on the two rounds of Agricultural Census of Lao PDR, in 1998/99 and 2010/11. Selected indicators of economic growth in Lao PDR in recent decades Most Asian countries succeeded in increasing major cereal production from the mid-1960s following the introduction of high-yielding varieties and policy support that promoted the construction of irrigation facilities and the use of modern inputs such as chemical fertilizers and pesticides. The resulting Green Revolution allowed most Asian countries to develop a vigorous smallholder sector, comprising almost 87 percent of the small and marginal farms (i.e. <2 ha) of the world (Oksana, 2005; Viswanathan et al., 2012), and enabled this sector to achieve rapid growth in food agriculture and a high degree of self-sufficiency in the production of basic staples and other food crops.3 However, the trajectory of agrarian transformation in the Asian region has not been uniform. Although a handful of countries, such as Japan and South Korea, achieved rapid rural transformation, similar to that achieved earlier in the advanced industrial economies of the West, agriculture remains the mainstay of the economy in most countries of South and Southeast Asia, particularly as a source of employment and rural incomes (World Bank 2009). Some countries, such as Thailand and Viet Nam, have been more successful in establishing highly commercialized and diversified agricultural production systems and have emerged as major exporters of agricultural produce. However, some others, such as Lao PDR, Cambodia and Myanmar, continue to have large agricultural sectors dominated by subsistence-oriented production systems. 3 The Asian smallholder sector is highly significant, as it produces 80% of the food consumed in the developing world and feeds one-third of the global population (FAO 2011). 2 2
24 Although not dramatic by regional standards, Lao PDR has been on a sustained growth path since the 1990s, with real gross domestic product (GDP) growing an average of 6.6 percent per annum during the 1990s. The rate of growth in real GDP was close to 8 percent per annum during the last decade ( ) according to estimates of the National Statistics Centre (NSC) of Lao PDR. Agriculture growth, in particular, was led by extensive investment in irrigation and increased cross-border trade (though this is mostly informal) in agricultural commodities with Thailand. In the industrial sector, manufacturing, construction and power have been the fastest-growing subsectors, contributing to national wealth as shown in Table 1.1. Table 1.1: Changes in the sectoral composition of GDP, 1990s and 2000s Share Average Average annual growth Share (%) annual growth (%) Agriculture (a) Crops, livestock and hunting (b) Forestry (c) Fishing Industry (a) Mining and quarrying (b) Manufacturing (c) Electricity and water (d) Construction Services Note: The data series pertains to constant 1990 prices and relates to constant 2002 prices. Sources: IMF Staff Country Report No. 3, 2000; IMF World Economic Outlook Database 2011; National Statistics Centre (NSC), Lao PDR; Bank of Lao PDR Annual Reports; MOPI, Statistical Year Book, Lao PDR. As is evident from Table 1.1, Lao PDR has been undergoing structural transformation, moving from a primarily agrarian economy to a more diversified economy. The share of agriculture in GDP has fallen from about 56 percent during the 1990s to about 31 percent during the last decade, while the shares of services and industries sectors experienced significant increases during this period. Within the services sector, wholesale and retail trade has the largest share (52%), followed by transport, storage, post and telecommunications (13%) and community, social and personal services (4%). Although annual growth of the overall agricultural sector had fallen to 3.1 percent during the first decade of the new century, partly due to the decline of the forestry sector, the crop and livestock subsector maintained its growth rate at around 5 percent. By and large, the pace of economic activity in Lao PDR has accelerated in the last two decades, particularly after the introduction of several new policy initiatives following the launching of the Sixth Plan in 2006 (ADB, 2013). This growth acceleration has been accompanied by important changes in the agriculture sector, which has benefited from pro-active government policies 3
25 intended to stimulate agricultural production and strengthen the commercial agriculture sector. The significant growth achieved over the past two decades has also contributed to reducing the percentage of population living below the poverty line, from 45 percent in 1993 to 39 percent in 1998 and further to 27.6 percent by (MOPI, 2011). Gross value added in agriculture and its composition A review of the status of subsectors within agriculture in Lao PDR is useful to understand the relative significance of these subsectors in the broader economy. Table 1.2 presents the latest trends in the performance of the agriculture subsector with respect to contribution to the gross value of output. As is evident from the Table, the contributions from cereals and livestock sectors were the highest during the recent three-year period, followed by fisheries and the industrial crops. Within the cereals category, lowland rainfed paddy continued to have the most prominent position, while the contribution from upland paddy production declined by about 2 percent between 2008/09 and 2010/11. Although the contribution from lowland rainfed paddy continues to be stronger within the broad cereals sector, the other three sectors i.e. forestry, fisheries and livestock have reported significant growth. The industrial crops have also made significant contributions towards national GDP. Table 1.2: Gross value added in agriculture sector, (at constant prices 2002) Value of GDP (Billion Kip) Crops/ sectors (Average) GDP (%) share CAG ( )* 1. Total cereals Lowland rainfed paddy Upland paddy Industrial crops Livestock Fisheries Forestry Total Agriculture Note: CAG Compounded annual growth rates. Source: Ministry of Agriculture and Forests, 2011 (concerned department websites) Trends in exports, including exports of agriculture products The trends in total exports of Lao PDR, including agriculture and forest products, are presented in Table 1.3. Overall, it may be seen that exports have increased in recent years, especially in the areas of agriculture and forest products, although exports of wood products declined between 2005 and 2010, mainly due to the government ban on the exports of timber in roundwood and log forms. 4
26 Table 1.3: Trends in major exports, including agricultural products, 1991 to 2012 (million US$) Wood products 40.9 (42.3) 88.3 (28.4) 78.1 (14.1) 37.4 (2.1) 81.7 (3.7) 131.1(5.8) Coffee 3.0 ( 3.1) 21.3 (6.8) 7.5 (1.4) 26.1 (1.5) 67.8 (3.1) (5.0) Agriculture & forest products 3.7 (3.8) 13.7 (4.4) 20.2 (3.7) (9.7) (6.9) (9.7) Garments 15.1 (15.6) 76.7 (24.7) (20.1) (9.8) (9.9) (8.1) Electricity 21.3 (22.0) 24.1 (7.7) 98.4 (17.8) (6.5) (16.0) (22.1) Mining na na (39.2) (35.8) (56.0) (41.7) Others 12.6 (13.0) 86.9 (27.9) 21.4 (3.9) (34.6) 99.3 (4.5) (7.5) Total 96.6 (100.0) 311 (100.0) (100.0) (100.0) (100.0) (100.0) Note: Other also includes fuel purchase by foreign carriers. Figures in parentheses are shares in total exports. Sources: Government of Lao PDR, Customs Department, Ministry of Finance, Ministry of Industry, Commerce & Electricity Enterprises; Quarterly Monetary Statistics, Monetary Policy Department, Bank of Lao PDR. While agricultural exports increased in absolute terms over time, Table 1.4 reveals that, until 2005, live animals, including cattle and buffaloes, had formed a major share of agricultural exports of Lao PDR. However, since 2006, exports of live animals became negligible following the ban of exports of buffaloes and cattle. Table 1.4: Trends in exports of major agricultural and livestock products, (million US$) Period Buffaloes Cattle Green coffee Groundnuts Maize Total agri. Products (11.4) (40.7) (35.7) 2.54 (6.6) 0.84 (2.2) [96.7] (9.1) 4.50 (17.0) (63.2) 0.77 (2.9) 0.14 (0.5) [92.8] (14.3) 0.63 (3.2) (68.2) 0.14 (0.7) 1.11 (5.7) [92.1] (0.1) 0.01 (0.02) (48.4) 0.43 (0.8) (31.7) [81.0] Note: The figures are five-year averages. Figures in round brackets are the respective share of total. Figures in square brackets indicate the combined share of five major export items listed in the table. Source: Compiled from FAOSTAT Trade data. Table 1.4 also shows the dominance of coffee exports and the emergence of maize as one of the major sources of agricultural exports of Lao PDR. Agriculture and economic development in Lao PDR: A comparative perspective According to the FAO Statistical Year Book 2013, the estimated population of Lao PDR was 6.29 million in The country is divided into 17 provinces, with Vientiane as the capital city, which is the centre for business and economic activities and where most of the national government and international development agencies are located (see Figure 1.1). For administrative purposes, the 17 provinces of Lao PDR are further divided into three broad regions: Northern Region comprising 7 provinces; Central Region with 6 provinces and the Southern Region covering 4 provinces. 5
 The next subsection provides key socio-economic and demographic data to place the Lao economy in a comparative regional context.")
27 Figure 1.1: Map showing the geographical location of Lao PDR and its provinces Source: (accessed 15/12/2013) The next subsection provides key socio-economic and demographic data to place the Lao economy in a comparative regional context. Demographic profile According to the three previous population censuses, the population of Lao PDR has increased by approximately one million every 10 years; in 1985 Lao PDR had approximately 3.5 million inhabitants, in 1995 approximately 4.5 million inhabitants and in 2005 approximately 5.6 million. With an annual growth rate of 2 percent, it is estimated that the population of Lao PDR will be 6.9 million by The majority of the population of Lao PDR is young; 50 percent of the total population is under the age of 20. The labour force (i.e. those aged between years) increased from 51 percent in 1995 to 57 percent in 2005, and is expected to increase to 60 percent in 2015 (MOPI 2011). Table 1.5 presents the demographic profile of Lao PDR and its bordering countries. It is clear to see that, although it is the smallest country in terms of population size, Lao PDR has experienced faster population growth than its neighbours. 6
28 Table 1.5: Demographic profile of Lao PDR and its neighbouring countries Count ry Population (million) Average annual growth* Population density (persons/ sq km) Share of population, 2011 (%) Rura Urb Agri. l an Pop. Age composition of total population (%) years years Camb odia Lao PDR Myan mar Thaila nd Viet Nam Note: *Figures indicate annual compound growth rates. Source: Estimated from FAO Statistical Year Book, Lao PDR, at 27 persons/square kilometre, has the lowest population density in the region. In terms of the proportion of rural population, Lao PDR looks similar to Thailand; however, it has the highest share of farming population, in sharp contrast to Thailand. Lao PDR is similar to Cambodia in terms of age composition of the population, with a younger demographic profile compared with Myanmar, Thailand or Viet Nam. Land use characteristics Only 10 percent of the land area in Lao PDR has been brought under cultivation (Table 1.6) and only 58 percent of this is arable land, which is the lowest percentage in the region. The low ratio of land area under cultivation has been partly due to the continuing presence of unexploded ordnance (UXO) dating from the American bombing raids in the 1970s. Pastures and meadows account for over one-third of the land area, the highest proportion in the region. Table 1.6: Major categories of land use in Lao PDR and its neighbouring countries in 2009 Country Total land area (million ha) Total agri. land (million ha) Land area (% share) Agricultural area (%) Arable Permanent Agriculture Forests* land crops Pastures/ meadows Cambodia Lao PDR Myanmar Thailand Viet Nam Source: Estimated from FAO Statistical Year Book, *Data for Lao PDR is sourced from UNEP (2012), Lao Environmental Outlook. 7
29 While Cambodia and Myanmar report higher percentages of arable land and area under forest cover, Lao PDR has a lower forest cover owing to the high rates of deforestation occurring over the past few decades. Economic indicators Table 1.7 provides a comparison of the major economic indicators for Lao PDR and its neighbours. Despite the robust growth in recent years (as reported above), Lao PDR still has both the smallest population and also the smallest economy, measured by size of GDP, in the region. Lao PDR has the highest proportion of rural population working as agricultural labourers in the region. Interestingly, in Lao PDR, labour force participation ratios are more or less similar for male and female workers. All these countries have relatively high levels of child employment, despite legal prohibitions, with Cambodia reporting the highest percentage (49%) of children in the labour force, and Lao PDR reporting the second lowest (19%). Table 1.7: Key economic indicators, Lao PDR and its neighbouring countries GDP - Current US$ (billion) Sectoral share in GDP, 2010 LFP rate (2010) % change per Country annum* Agri. Industry Services Female Male Cambodi a Agri. labour force** (2011, %) 65.4 Child workers ( , %) *** Lao PDR Myanmar Thailand Viet Nam Note: LFP refers to the labour force participation; *Annual compound growth rate. **Represents the percentage of economically active persons aged 15-64, plus those persons aged and over 64 who reported economic activity. Child workers relates to % of children aged 7-14, ***Child employment figure for Myanmar is based on World Bank (1999): Myanmar: An Economic and Social Assessment, 18 August Sources: FAO Statistical Year Book, 2013, World Food and Agriculture, Rome; World Bank, World Development Indicators database. In general, it may be observed that agriculture sector continues to be the dominant source of occupation (i.e. agricultural labour) in Lao PDR, Cambodia, Myanmar and Viet Nam. The share of agriculture in GDP remains somewhat high (in the range of 33-40%) in these countries. Although the share of agriculture in Lao PDR is somewhat lower than in Cambodia and Myanmar, the highest proportion of the country s labour force is employed in agriculture. On the other hand, Thailand and Viet Nam have experienced tremendous shifts from agriculture to industry, with the manufacturing and services sectors together contributing percent of the national GDP. The data on the share of agriculture since the 1990s presented in Figure 1.2 points to some important changes during the past two decades and also highlights some regional differences
30 Figure 1.2: Trends in agriculture value added (% GDP): Lao PDR and others Share of agriculture in GDP (%) Cambodia Lao PDR Thailand Viet Nam Source: Estimated from FAOSTAT. Thailand the richest, most industrialized economy of the region is clearly an outlier compared to its neighbours, having experienced rapid structural transformation during the 1970s and 1980s, and Viet Nam has been moving rapidly in the same direction. Agriculture still contributes about one-third of total GDP in Lao PDR and Cambodia but both countries have experienced significant declines in the share of agriculture since the 1990s, with Lao PDR experiencing a faster decline over the past decade. Agricultural production structure and export performance The percentage of irrigated land area is much lower in Cambodia, Lao PDR and Myanmar compared with Thailand and Viet Nam (Table 1.8). 4 Lao PDR has the highest proportion of the rice grown in rainfed lowlands (77%) and uplands (14%). Viet Nam has the smallest landholdings on average, followed by Lao PDR; almost 95 percent of the landholdings in Viet Nam are below 2 ha in size, while 70 percent of landholdings in Lao PDR are below 2 ha. The use of inputs such as fertilizer and farm machinery is significantly lower in Cambodia, Lao PDR and Myanmar, compared with the levels in Thailand and Viet Nam. 4 There are varying estimates of irrigated rice area in Lao PDR. For instance, data from the Lao Census of Agriculture 2010/11 show the share of irrigated area as 22%, while the Rice Policy study (FAO/IRRI, 2012) reports that the irrigated rice area was 13% during The Draft National Plan on Irrigated Agriculture reports the wet season irrigated area to be ha, which is about 14 percent of the total agricultural land area in the country. 9
31 Table 1.8: Farm size, resource use and farming practices across countries Avg. holding size (ha) Tractor use (No/100 sq km) (%) of total rice area grown in Rainfed lowlands Uplands Country Irrigated area (%) Holdings < 2 ha (%) Fertilizer use (Kg/ha) Cambodia Lao PDR Myanmar Thailand Viet Nam Note: Irrigated area is the average of agricultural area equipped for irrigation during ; Holding size and holdings relate to different years as reported from respective government sources; Fertilizer use data pertains to 2010; Tractor use relates to average of ; Rice area (rainfed lowland and upland relates to Sources: Estimated from FAOSTAT and government sources of respective countries. Data on irrigated area and tractor use compiled from In all these countries, rice is the dominant crop but the share of land under rice is lowest in Lao PDR (Table 1.9). Maize, rubber and coffee are the other important crops grown in Lao PDR. Table 1.9: Distribution of cropped area across countries, 2010 Country Percentage share of crops in total agricultural area reported during 2010 Rice Maize Soybean Rubber Coffee Tea 6 crops Total cereals Cambodia Lao PDR Myanmar Thailand Viet Nam Source: Estimated based on FAOSTAT data. Table 1.10 presents the status of rice production in the same five countries, including Lao PDR, and their contribution towards rice production in the larger Asian context. These five countries account for 22 percent of total rice area in Asia and 19 percent of total rice output; Lao PDR has the smallest rice area and output in the group. Lao PDR ranks third (3.6 tonnes/ha) in terms of productivity, with productivity levels above Cambodia and Thailand. As seen in Figure 1.3, Lao PDR has made progressive improvements in rice productivity since the 1990s a noteworthy achievement, given that most of its rice is grown under rainfed conditions. 10
32 Table 1.10: Area and production of rice, Lao PDR and other countries, 2010 Country Rice Area ( 000 ha) Rice Production ( 000 tonnes) Productivity (tonnes/ha) Cambodia (4.5) (2.6) 2.97 (4) Lao PDR 855 (1.4) (1.0) 3.59 (3) Myanmar (13.1) (10.3) 4.07 (2) Thailand (19.7) (11.2) 2.94 (5) Viet Nam (12.2) (12.6) 5.34 (1) Asia (100.0) (100.0) 4.42 Subtotal (five countries) (21.8) (18.9) 3.78 Note: Figures in parentheses indicate the percentage shares in cases of area and production and ranking in terms of productivity. Source: FAO Statistical Year Book, 2013, World Food and Agriculture, Rome. Figure 1.3: Trends in cereal productivity across countries, 1991 to Cereal productivity (kg/ha) Cambodia Lao PDR Myanmar Thailand Viet Nam Note: The figures are five-yearly averages for the reporting period. Source: Estimated based on FAOSTAT database. As shown in Table 1.11, agricultural export growth in Lao PDR has been well below that of its neighbours. Though rice has been the major cereal export of the other countries, maize has been the main cereal export in Lao PDR. Exports of livestock products, including meat, processed products and live animals, have grown quite rapidly in all these countries, including Lao PDR. 11
33 Table 1.11: Trends and structure of agricultural products exports, Lao PDR and its neighbouring countries Total Agri. Products Exports (million US$) Major Agri. Products Exports, 2010 (million US $) (%) annual Livestock products change* Cereals Rice Coffee (food & animals) Cambodia (23.2) 34.9 (21.6) (0.01) Lao PDR (33.9) 0.00 (--) 33.4 (43.4) Myanmar (7.5) 42.4 (6.6) (0.07) Thailand (21.1) (20.5) 3.8 (0.02) Viet Nam (31.2) (31.2) (17.8) Note: *Indicates annual compound growth rates. Figures in brackets indicate the relative shares in total agricultural exports for Source: FAOSTAT, accessed on 16 August Conclusion Lao PDR has experienced a rapid rate of overall economic and export growth in the past two decades, resulting in a significant structural transformation of its economy. Its growth performance has been particularly strong since the implementation of new economic policies following the launch of the Sixth Plan in However, developing and modernizing the agricultural sector, which is a critical sector of the economy and one with large unexploited potential, poses major challenges for the country. In this context, as will be seen from the information presented in the following chapters, the two rounds of the Lao Census of Agriculture (LCA), implemented by the Ministry of Agriculture and Forestry (MAF) during 1998/99 and 2010/11, provide a rich body of information useful to both policy makers and researchers about the structure of rural households, the changing profile of the rural population and the status of agricultural development in the country. These data from the two rounds of the LCA are of major importance for formulating appropriate policies for sustainable agricultural development and poverty alleviation in the country to confront the challenges emanating from a volatile global economy and the threats posed by global climate change. Much more information and insights can and should be extracted from this valuable data source, which sheds light on the structure and dynamics of Lao PDR s rural and agricultural economies. 12
34 Chapter 2 Overview of the Lao Census of Agriculture 2010/11 Agricultural Census of Lao PDR Understanding the conditions of rural households is an important pre-requisite for designing appropriate policies and interventions that can strengthen their capacities and livelihoods. A number of development interventions, by both international and national development agencies, have enabled the Lao PDR to gradually transform its rural economy. However, prior to the first Lao Census of Agriculture (LCA) in 1998/99, the processes and trajectory of agricultural development taking place in the country had not been properly documented by means of systematic collection and compilation of data from farm households. Lao Census of Agriculture 1998/99 The first LCA was primarily undertaken by the Agricultural Census Office, which had been established within the Department of Planning, in the Ministry of Agriculture and Forestry. The census covered all 141 districts in the country and was undertaken in two parts. The first part included an overview of all households in the Lao PDR in order to collect basic data about agriculture; in the second part, a sample survey of farm households was conducted to collect more detailed information. A systematic random sampling approach was used for selecting the sample villages and farm households for the final round of the survey. 5 The survey covered sample farm households (5.3% of all households), drawn from 2454 sample villages (22% of all villages). Data were collected during February and March 1999; the reference year included the wet season of 1998 and the dry season of 1998/99. The scope and coverage of the LCA 1998/99 covered the entire country, including urban areas in Vientiane and elsewhere. The census covered only agricultural activities of private households, carried out on their own or in partnership with other households. Agricultural activities undertaken by government organizations, businesses, etc. were excluded. People living in accommodation units, such as hostels, were also excluded. The census was developed based on the guidelines detailed in FAO Statistical Development Series No.5: Programme for the World Census of Agriculture 2000 (FAO 1996), taking into account the particular circumstances in Lao PDR. Extra emphasis was given to the collection of data on rice, because of its importance in Lao agriculture (LCA, 1998/99). 5 The sample was selected using two-stage sampling: first a sample of villages was selected and then a sample of households was selected from each sample village. Agricultural holdings were identified by asking each sample household about their crop and livestock activities. In most districts, a sample of 18 villages was used, with an average of 18 households selected in each sample village for a total of approximately 320 sample households (or 300 sample agricultural holdings) in each district. A smaller sample was taken in districts containing few villages or households. Approximately 400 households were sampled in the main urban districts of Vientiane Capital. The entire survey covered sample households, or agricultural holdings (LCA, 1998/99)
35 Lao Census of Agriculture 2010/11 The LCA 2010/11 was much more comprehensive, with significant improvements in the system of data collection as well as in the coverage of themes and topics. It was based on a critical review of the LCA 1998/99 by the Ministry of Agriculture and Forestry, with technical inputs and support provided by the Food and Agriculture Organization of the United Nations (FAO), including the recommendations of an Agricultural Statistics Expert. 6 The LCA 2010/11 was undertaken under the overall control of the Agricultural Census Steering Committee, chaired by Mr. Somsavat Lengsavad, Deputy Prime Minister. The Department of Statistics in the Ministry of Planning and Investment provided technical assistance to the Ministry of Agriculture and Forestry. Financial support for the census was received from a number of donors, including the Swiss Agency for Development and Cooperation (SDC), the International Fund for Agricultural Development (IFAD), the Australian Agency for International Development (AusAID), Agence Française de Développement (AFD) and Deutsche Gesellschaft für Internationale Zusammenarbeit (GIZ). The Government of Lao PDR also contributed its own funds. The Lao Census of Agriculture 2010/11 covered the whole of Lao PDR, including all 143 current districts in the country. The census data collection was undertaken in March Crop data were collected for the 2010 wet season and the 2010/11 dry season. A total of 1.1 million households were enumerated under the census and about households (63.64%) were categorized as farm households. Of those farm households, approximately households (5.3%) were randomly selected for a more detailed survey on several topics, including agricultural practices and crop production, livestock holdings, farm labour, farm management, forestry and fishery. Village level information on village infrastructure, socio-economic conditions and environmental factors was collected from the village heads in all of the villages. The LCA 2010/11 comprised three major components: (a) the village component; (b) the household component; and (c) the sample farm household component. A summary of the sources and types of data gathered with respect to each component is provided in Table During February-September 2009, an Expert Mission was set up by the FAO Regional Office for Asia and the Pacific (FAORAP), Bangkok under the guidance of Dr. Vidyadhar with the broad objectives of strengthening the policy, strategy and project formulation and management capacity of the Ministry of Agriculture and Forestry in Lao PDR. While discussing the deficiencies in the agricultural statistical information as well as the rural household data collection system in Lao PDR, the report highlighted the need for a detailed understanding of the rural households from multiple perspectives on the structure and related characteristics of agricultural holdings, including size of holdings, lease patterns, land utilization, cropping patterns, type of livestock, age and sex distribution of livestock, agricultural implements and machinery, use of inputs, etc. It also brought out the need for collection of benchmark data to formulate agricultural development programmes for the country and evaluate their progress. The report further observed that the agricultural statistics collection system which existed at the time needed improvements inscope, credibility and timeliness. To overcome the problems identified, the report suggested adopting a four-fold remedial approach, namely: (i) improvement of the system of data collection, with respect to data that are currently being generated; (ii) exploration of alternative techniques in relation to the existing statistics collection system, if the present system for collecting data is not suitable; (iii) identification of new data series that may be generated for management of the agriculture sector; and (iv) evolution of appropriate methodologies for collection of data, in response to the new data requirements (FAORAP, 2009)
36 Table 2.1: Major data components of the Lao Census of Agriculture, 2010/11 Data component A. Village component: a survey of all villages in the country to collect data from village heads on rural infrastructure and services B. Household component: a survey of all private households in Lao PDR to collect basic data on crops and livestock C. Sample farm household component: a sample survey of farm households to collect detailed data on agricultural activities Source: LCA, 2010/11. Type/ nature of data collected Presence of electricity, irrigation facilities, credit facilities, schools, health facilities, agricultural markets, public services and community facilities, transport links, sale of agricultural produce, shifting cultivation practices, sources of drinking water, Unexploded Ordnance (UXO)-affected agricultural land, 7 resettlement, soil degradation, weather patterns, natural disasters and changes in living standards Identification of farm households, area of agricultural land, area irrigated, area of each temporary crop by season, areas of productive and non-productive permanent crops, livestock numbers by type, purpose of agricultural production, sale of agricultural production, ownership of tractor and water pump, aquaculture and capture fisheries, household size, sex, age and ethnic group of household head, presence of forest land and primary source of income Farm size, land tenure, land fragmentation, land use, shifting and rotating cultivation, use of crop inputs, age, sex and purpose of livestock by type, vaccination, use of credit, agricultural marketing, certified agricultural produce, farm population by age and sex, employment of farm population, farm management, forestry activities and types of fishing activities Since the data gathered from the farm household component in the census were based on a sample, they were subject to some sampling errors. A separate analysis of sampling errors has been conducted. It should be noted that data from the census may not be consistent with data from other sources for the following reasons: 1. The agricultural census covers only the private household sector. Agricultural activities of institutional units such as government farms, private companies and schools are excluded, as are crops and livestock of collective households. 2. Data for a province refer to land cultivated by or animals raised by households living in the province, not simply to the land or animals located within the province. Other agricultural statistics in the Lao PDR are based on land or livestock located in the province. This variance may be significant in large urban areas. 3. Crop area data exclude the land of households that have 0.02 ha or less of agricultural land. 7 According to LCA 2010/11, UXO-affected land refers to agricultural land affected in some way by UXO. It includes agricultural land not cultivated because of the presence of UXO, as well as land still being cultivated despite the presence of UXO
37 4. Temporary crops grown in plots of less than 100 square meters in area, such as small kitchen gardens, are not included in crop area figures, but are included in figures on the number of growers. 5. The census livestock data refer to the number of animals on the day the household was enumerated in the census. 6. The census only covers livestock raised by farm households; it excludes livestock holdings of households with less than 0.02 ha of agricultural land or with small numbers of livestock (1-2 cattle/buffaloes, fewer than 5 pigs/goats/sheep, or flocks of fewer than 20 poultry) or any livestock belonging to households that have been categorized as non-farm households. 7. The census estimates of upland rice area are higher than cited in official statistics. Different data collection methodologies were used: in the census, data were collected directly from households, whereas the official statistics are obtained from reports of local agricultural officials and village heads. 8. Comparisons between data for provinces in the LCA 1998/99 and the LCA 2010/11 are affected by changes in provincial boundaries. Xaysomboon Special Region was eliminated and the districts within it were assigned to Luangprabang, Xiengkhuang and Vientiane provinces. Similarly, boundary changes at the district level have also occurred in the period between the two LCAs. However, despite these possible limitations, the two rounds of LCA are important from the perspective of future development. These two data sets contain rich information about the changing dimensions of the rural landscape in the Lao PDR, and about the dynamics of transformation taking place across provinces, districts and villages, as well as in farm households at the micro level. More importantly, to benefit the Lao PDR with its abundant natural resources and diversity in terms of culture, socio-economic life and ethnic traditions the household and village information gathered under the two rounds of LCA should be subjected to detailed analysis. These data offer critical inputs for the country to evolve and fine-tune its agricultural development policies, as well as to create a roadmap for the future course of sustainable and equitable growth, without compromising the existing natural resources or ecological and environmental systems. 16
38 Chapter 3 Profile of farm households This chapter provides a holistic view of the demographic and socio-economic profiles of rural households captured by the two rounds of the Lao Census of Agriculture (LCA). This section focuses primarily on the LCA 2010/11, comparing agricultural development scenarios across sectors and provinces with those described in the LCA 1998/99. In addition to data from the two rounds of the LCA, this chapter also draws from other relevant documents and datasets, as well as online materials provided by national government agencies and international research and development agencies, including the Food and Agriculture Organization of the United Nations (FAO), United Nations Development Programme (UNDP), World Food Programme (WFP), World Bank (WB), Asian Development Bank (ADB), and the International Rice Research Institute (IRRI). The data pertaining to the production performance of the agriculture sector in the country have been drawn from the official statistical data compiled in the Agricultural Statistics Year Book 2011 (and previous years), published by the Ministry of Agriculture and Forestry. For brevity in presentation and comparison of data, the analysis follows the convention by which the 17 provinces have been classified into three geographical regions: Northern region, Central region and Southern region. The Northern region includes seven provinces, i.e. Phongsaly, Luangnamtha, Oudomxay, Bokeo, Luangprabang, Huaphanh and Xayabury; the Central region includes six provinces, Vientiane Capital, Xiengkhuang, Vientiane Province, Borikhamxay, Khammuane and Savannakhet; and the Southern region comprises the four provinces of Sarvane, Sekong, Champasack and Attapeu. This section is organized into four sub-sections. The first sub-section analyses the major changes in the status of households over time. The second sub-section examines the status of rural households and villages with respect to their specific characteristics: (a) rural/urban; (b) rural with and without road connectivity; and (c) topographical/geographical features. The third subsection considers the demographic profiles and the socio-economic and ethnic characteristics of the farm households in the two agricultural censuses. Finally, the fourth sub-section discusses the status of farm households with respect to various aspects of farm management, gender roles, access to irrigation sources and diversification of farm livelihood activities, i.e. livestock, fishery/aquaculture and forestry. Profile of households in Lao PDR There was a 28 percent increase in the total number of Lao PDR households from 0.79 million to 1.02 million between 1999 and 2011, with a corresponding increase of 20 percent in the number of farm holdings, including livestock holdings at the national level (Figure 3.1). 17


39 Figure 3.1: Changes in the status of households in Lao PDR, 1999 & , /99 Households ('000 nos) / No. of households No. of land holdings No. of farm households No. of livestock holdings No. of nonfarm households The period also witnessed a notable increase (17%) in the number of farm households and a 24 percent rise in the number of livestock holdings. Interestingly, although the number of farm holdings increased over this period, the percentage of non-farm households also increased from 16 percent to 23 percent of total households from 1999 to 2011 which denotes a significant shift towards non-farm activities. It is notable that all regions experienced this shift among households towards non-farm activities, though it was more pronounced in the Central region (Figure 3.2). Figure 3.2: Changes in the status of households by region, Households ('000s) No. of farm households No. of livestock holdings No. of non-farm households / / / / / /11 North Central South 18 18
40 Table 3.1 presents some of the important changes that occurred in the structure and composition of the farm households across the three regions between the two rounds of the census. Table 3.1: Changes in the profile of the households in Lao PDR between 1998/99 and 2010/11 North Central South Number of households/ % % % holdings by type ( 000) 1998/ /11 change 1998/ /11 change 1998/ /11 change 1. Total households Landholdings Farm households Livestock holdings Non-farm households Farm households (%) Non-farm HHs (%) Livestock holdings (%) Source: LCA 1998/99 and 2010/11 As illustrated, the Central region, which includes Vientiane Capital and Vientiane Province, has witnessed the maximum increase in the total number of households (34%). This was mainly the result of an increase in the number of non-farm households (90%), compared to the increase in those households seen in the North (87%) and in the South (61%). The increase in the number of non-farm households in the central provinces of Vientiane Capital and Vientiane Province can be viewed as an outcome of increased availability of non-farm employment opportunities and the resulting shift of people into non-farm activities and migration of people from remote areas to urban centres in search of employment opportunities. The increase in the number of farm households varied across regions as a result of the increase, over time, in the number of households dependent on non-farm activities. However, the increase in livestock holdings has been more or less similar across regions. The Northern and Southern regions have shown similar patterns in terms of higher dependence on farm and livestock activities. The Central region reported a sharp decline in the number of farm households (9.6%) and a corresponding increase in non-farm households. At the same time, it may be observed that, although an increase in the number of non-farm households was seen across all provinces, in eight of the seventeen provinces the increase in the number of non-farm households between the two periods was less than 2 percent. The increase in non-farm households was most evident in the five more highly developed provinces, i.e. Vientiane Capital (41%), Vientiane Province (12%), Savannakhet (12.4%), Champasack (11%) and Luangprabang (7.4%), as shown in Figure


41 Figure 3.3: Provinces showing a rise in number of non-farm households between 1999 and 2011 Non-Farm Households ('000) Luangpraban Vientiane Vientiane Savannakhet Champasack g Capital Province 1998/ / Despite the increase in the number of non-farm households between the two periods, most provinces reported a significant proportion (higher than 80%) of households engaged in both farming and livestock activities. Only four provinces reported the share of non-farm households to be more than 20 percent of total households. Vientiane Capital, the country s main urban centre, reported the highest proportion of non-farm households (69 percent) in 2011, up from 50 percent in 1999 (Figure 3.4). Figure 3.4: Proportion of non-farm households in major provinces 20
42 Distribution of households by rural/urban and geographical setting It is also useful to understand the distribution of households in terms of their rural or urban setting, as well as in the various geographical contexts of Lao PDR, which include lowland, upland, plateau and mixed land type topographies. The rural/urban settings of households revealed by the LCA 2010/11 are analysed and discussed below. First, the distribution of households in terms of rural/urban setting, according to the LCA 2010/11, indicates that the proportion of urban households at the national level was 31 percent. This corresponds with the official data on the proportion of urban population (34% during 2011, according to the FAO Statistical Year Book, 2013). However, the proportion of urban households varied between regions, with the Central provinces showing the highest percentage (38%) compared to Northern (25%) and Southern (22%) provinces. In fact, the larger proportion of urban households observed in the Central region was mainly attributable to its being the location of the Vientiane Capital, where the proportion of urban households was 69 percent, compared with less than 30 percent in other provinces. At the same time, it is notable that, along with an increase in urban households 8 shown in the LCA 2010/11, a large proportion of urban households (47%) are reportedly engaged in farming activities. 9 The proportion of farm households in urban areas was highest in the Northern provinces, at 68 percent, followed by 51 percent in the Southern provinces and only 37 percent in the Central region. Thus, the distribution of urban households vis-a-vis the percentage of farming population within urban contexts highlights the preponderance of urban farm households across provinces, except in Vientiane Capital (Figure 3.5). Normally, urban areas are not expected to have large proportions of farm households. The phenomenon of urban households engaged in farming and related activities, as reported in the LCA 2010/11, needs further scrutiny with regard to the nature, type and extent of farming activities undertaken by these households. Further examination of the data is also necessary to confirm whether the higher proportion of farm households in urban areas reflects the classification of urban areas in the Lao context specifically, or whether it could be attributed to 8 The LCA 2010/11 report published by the Steering Committee for the Agricultural Census, Agricultural Census Office (Lao Census of Agriculture 2010/11: Highlights, May 2012) does not provide clear definitions with regard to urban area or urban household. However, a working definition of urban is provided by the National Statistics Center (NSC, Lao PDR). In its 2005 Population Census, the NSC used five criteria to come up with a definition of urban villages. Urban villages are those with: (a) proximity to district or provincial government offices; (b) a population of more than 600 residents or 100 households; (c) access roads for motor vehicles; (d) a majority of households with electricity and tap water; and (e) a market in the village (MOPI, 2005). 9 This finding of the LCA 2010/11 regarding the presence of farm households in urban areas corresponds with an earlier report, which observes that in urban areas about 41% of the households are engaged in agriculture and related activities. Many agricultural activities of a significant scale are taking place near or within cities, mainly to cater to the growing urban food demands (Socio-Economic Atlas, Lao PDR, 2005: 108). 21
43 the emergence and growth of peri-urban farming activities, including vegetable gardens and fisheries. Figure 3.5: Share of urban households and urban farm households across provinces, 2010/11 Urban & Urban Farm HHs (%) Phongsaly Luangnamtha Oudomxay Bokeo Luangprabang Huaphanh Xayabury Urban households Urban farm HHs Vientiane Cap. Xiengkhuang Vientiane Pr. Borikhamxay Khammuane Savannakhet Saravane Sekong Champasack Attapeu One feature of the rural economy of Lao PDR is the distinct demarcation of its geographical settings, characterized by the existence of four topographies, i.e. lowlands, uplands, plateau and mixed land. The LCA 2010/11 reported that, while almost 57 percent of all households (occupying 53% of land area) live in the lowland areas, 22 percent are settled in the uplands (24% of land area), 21 percent are located in the plateau (23% of land area) and a very small percentage (0.38%) live in the mixed lands (Table 3.2). Table 3.2: Geographical profile of households and land area in Lao PDR, 2010/11 Type of location No of HHs ( 000) % share Area ('000 ha) % share Lowland Upland Plateau Mixed Lao PDR The LCA 2010/11 indicated that the location of households in terms of geographical setting within provinces could be described as follows: more than 70 percent of total households in both the Southern (73.6%) and Central (71%) provinces are located in the lowland areas, while over 74 percent of all the households located in the Northern provinces live in the uplands (43%) or 22
44 plateau (30.5%) areas. The vast majority of households were engaged in farming, whether in the uplands (94%), plateau (88%) or mixed land (83%) areas. In the lowland areas, although the majority of households were engaged in farming, a substantial percentage (34%) was engaged in other activities (Table 3.3). Table 3.3: Distribution of farm and non-farm households by geographical location and region, 2010/11 Distribution of total, farm and non-farm households Lowland Upland Plateau Mixed All land types All Households ('000) Northern Central Southern Lao PDR Farm Households (%) Northern Central Southern Lao PDR Non-Farm Households (%) Northern Central Southern Lao PDR The highest proportion of households engaged in non-farm activities was found in the Central provinces, across all geographical settings, with the largest percentages in the lowland areas (41%) and mixed land areas (27.7%). Though mixed land areas reported the second largest proportion of households in Lao PDR that are engaged in non-farm activities (17%), the number of households living in those areas is under in total. The distribution of farm households with respect to their location in the urban areas, as well as in rural villages with and without road connectivity, in each of the geographical regions and topographical settings is presented in Table 3.4. It may be noted that the Central and Northern provinces have somewhat larger proportions of urban farm households 21 percent and 19 percent, respectively compared with the Southern provinces (14.2%). The majority of urban farm households are found in the lowland areas in all three regions, with the Northern region reporting the largest proportion (41%) compared with the Central (24%) and Southern (16%) regions. Although the majority of farm households across all land types are located in rural areas with road connectivity, a notable proportion of farm households in the Southern (14%) and Northern 23
45 Table 3.4: Distribution of farm households by geographical location and type of village across regions, 2010/11 Region/land type Farm Households* Lowland Upland Plateau Mixed Total Northern Region Urban (40.7) (7.7) (19.4) 0.46 (25.3) (18.9) Rural with Road (57.0) (72.0) (72.6) 1.13 (62.5) (68.7) Rural - No Road 1.57 (2.4) (20.3) 7.04 (8.0) 0.26 (14.4) (12.4) Sub-Total (100.0) (100.0) (100.0) 1.84 (100.0) (100.0) Central Region Urban (24.0) 9.19 (14.3) (18.2) 0.10 (10.3) (21.0) Rural with Road (71.7) (72.8) (75.4) 0.83 (84.2) (72.6) Rural - No Road 8.91 (4.3) 8.30 (12.9) 3.90 (6.4) 0.05 (5.5) (6.3) Sub-Total (100.0) (100.0) (100.0) 0.99 (100.0) (100.0) Southern Region Urban (16.2) 0.75 (6.4) 3.82 (10.8) 0.00 (0.0) (14.2) Rural with Road (68.6) 7.51 (64.0) (85.3) 0.29 (80.2) (72.0) Rural - No Road (15.2) 3.48 (29.6) 1.39 (3.9) 0.08 (22.3) (13.8) Sub-Total (100.0) (100.0) (100.0) 0.37 (100.0) (100.0) Lao PDR Urban (24.6) (9.7) (17.4) 0.56 (17.7) (18.9) Rural with Road (68.3) (71.8) (76.0) 2.25 (71.3) (71.1) Rural - No Road (7.1) (18.5) (6.7) 0.39 (12.5) (10.1) Grand Total (100.0) (100.0) (100.0) 3.20 (100.0) (100.0) Note: * Figures within parentheses are percentages of households in each category. The land types, Rural with Road and Rural - No Road should be read as Rural with road connectivity and Rural with no road connectivity, respectively. (12%) provinces do not have access to motorable roads with proper connectivity. The problem of lack of road access is most pronounced in the upland areas of the Southern (29.6%) and Northern (20%) provinces. Demographic and socio-economic characteristics of farm households A brief account of the demographic and socio-economic characteristics of farm households is presented in Table 3.5, which shows changes in the number of farm households, farm population and average household size, as well as sex and dependency ratios of the farm households across regions/provinces between the 1998/99 and 2010/11 censuses. The average farm household size declined marginally, from 6.1 to 5.7 people. 24
46 Table 3.5: Demographic characteristics of farm households, by regions, 1998/99 & 2010/11 Northern Central Southern Total Agricultural census No. of farm households ( 000) Farm population ( 000) Avg. HH size (no.) Sex ratio* Dependency ratio** 1998/ / % change / / % change / / % change / / % change Notes: * Sex ratio refers to number of males/100 females. A ratio below 100 indicates that there are more females than males; a ratio above 100 indicates more males than females. **Dependency ratio refers to the ratio of people aged 0-14 and 65+ to the population aged years. The male-to-female sex ratio (number of males/100 females) reported among farm households showed an increase, from 97.2 (1998/99) to (2010/11) at the national level. The sex ratio of the economically active population showed that women outnumber men, especially in the age group of years (sex ratio in this group being 97-99), although this ratio has become more even for the total population, as well as across age groups over 45 years, with some differences across some provinces 10 (Table 3.6). As shown in Appendix 3.1, there was a notable change in sex ratio across provinces, with almost all provinces showing a slightly higher proportion of males. Similarly, all provinces reported a significant reduction in the dependency ratio (ratio of people aged 0-14 and 65+ to the population aged years) of farm households between the two periods. However, there was greater variation in the dependency ratio across provinces compared with the sex ratio (the coefficient of variation across provinces of the dependency ratio was 16.8% compared to less than 3% for the sex ratio). The projections at national level, based on estimates of the National Population Census 2005, indicate that the dependency ratio is likely to fall further in Lao PDR over the next five to ten years (NSC, 2005). 10 The Lao Expenditure and Consumption Survey 4 (2007/2008) confirmed these data, reporting that, of the national agricultural population, 49.6% was male and 50.4%was female. In a few provinces, such as Vientiane Capital, Phongsaly, Luangnamtha, Bokeo, and Luangprabang, the overall female agricultural population slightly exceeded that of males, while in Oudomxay, Xayabury, and Sekong the overall male agricultural population slightly exceeded that of females (LECS, 2009)
47 Table 3.6: Sex ratio, by age, of farm households, 2010/11 Age (years) Farm population ( 000) Male (%) Female (%) Sex ratio* 0 to to to to to to to years Total Notes: *Sex ratio refers to number of males/100 females. A ratio below 100 indicates that there are more females than males, and vice versa. Structure and composition of farm households This section describes the structure and composition of farm households with respect to landholding size and household size as well as the differences in household size across land categories. It should be noted that holding size refers to operated land (i.e. land over which the household exercised management control) and does not imply ownership; the LCA only provides information on operational holdings and not ownership. Table 2.7 shows the distribution of farm households across the categories of land size, including landless (holding no land). The number of landless farm households in Lao PDR is very small, slightly above households or less than 1 percent of total farm households, but another 7 percent of households have less than 0.5 hectares. The majority of households (65%) have landholdings between 0.5 and 2.99 ha. Close to 27 percent have landholdings of 3 ha and above, and they account for 58 percent of the total farmland in the country. Table 3.7: Distribution of farm households based on landholding size and household size in Lao PDR, 2010/11 Land category Households Percentage of households by HH size No ('000s) % share < = 5 members 6-9 members 10+ members No land ha ha ha ha ha ha & over Lao PDR
48 Examination of farm households in terms of family size shows that, while about half of the farm households have five or fewer members, a considerable number of farm households (over 41%) reported a family size of between six and nine members and almost 7 percent reported ten or more members. The figures in Table 3.7 suggest that farm households with larger landholdings tend to have a larger household size (often with 6-9 and 10 or more members per family). For instance, 47 percent of farm households with landholdings of three or more hectares have between six and nine members, and almost 10 percent have ten or more household members. Both household size and landholding size have a significant bearing on the socio-economic status of the household; more members per farm household can effectively contribute to farming and related activities, while a larger holding can support more household members Table 3.8 describes the age composition of the farm households as enumerated in the LCA 2010/11. As reported above, the gender balance is quite similar across all age groups and in all regions. It is notable that almost half of the rural population (both males and females) belongs to the highly productive age classes and years. It was also observed that 18 percent of the farm household population was aged 45 years or older. In this respect, Lao PDR has a younger demographic profile than many other Asian countries (such as Bangladesh, China, India, the Republic of Korea, Thailand and Viet Nam), where a larger proportion (30-40%) of the rural population falls in the upper age groups of 45 years or older, and there is a larger proportion of elderly in the farming population. In the Republic of Korea and Thailand, the proportion of elderly (above 65 years) engaged in farming has been reported to be 18 percent and 11 percent, respectively (Viswanathan, et al., 2012). However, an important dimension of the age structure of farm households is that the proportion of the population in the age group of years (between 12% and 13%) is considerably smaller than in the next two major economically active age groups (15-24 and years). It is also a smaller proportion than the age group of 0-9 years (18-22%). Ethnic characteristics of farm households Lao PDR is one of the world s most ethnically diverse countries, containing 49 ethnic groups speaking more than 200 languages. Based on ethno-linguistic classification, these 49 groups have been classified into four main groups: (a) Lao Tai; (b) Hmong-Mien; (c) Sino-Tibetan; and (d) Mon-Khmer (MAF, 2003). The Lao Tai groups account for about 67 percent of the national population and are located in the agriculturally productive lowland areas around Vientiane Capital and along the Mekong Corridor. The Hmong-Mien and the Sino-Tibetan groups are generally found in the Northern highlands and the Mon-Khmer groups are found in both the Northern and Southern regions (WB, 2008). 27
49 Table 3.8: Age structure of farm households, by gender and region, 2010/11 Age (years) Male population (%) Female population (%) North Central South Total North Central South Total 0 to to to to to Total ( 000s) The LCA 2010/11 provides a detailed account of the farm households with respect to their ethnic backgrounds and the extent of their engagement in various farming and related activities in the country. The census shows that approximately 61 percent of farm households belong to Lao Tai, followed by Mon-Khmer (30%), Hmong-Mien (8%) and other ethnic groups (1%). The average household size was highest for Hmong-Mein groups, at 7.2 members, followed by 6 members for Mon-Khmer and 5.4 members for Lao Tai groups. Average farm size was in the range of ha across these ethnic groups. A small segment of farm households (8-10%) reported leasing farmlands. The proportion of land being leased was only around 6 percent in most cases, except in the Hmong-Mien groups, where the percentage of leased land reported was slightly higher, at about 10 percent of the total farmland operated. Table 3.9 provides a concise picture of the composition of farm households by ethnic groups and their engagement in farming operations, including livestock, fishery and forestry. Among the four major ethnic groups in the country, Lao Tai and Mon-Khmer communities together constitute the majority (92%) of the farm households. The most striking aspect of the farming practices is that an overwhelming majority of the farm households (87%) grow the dominant variety of glutinous rice. This proportion is highest among the Lao Tai (92%) and lowest among the Hmong-Mien (54%). The Hmong-Mien farm households allocate the largest share of their holdings (59%) for growing non-glutinous rice varieties, produced mainly for self- consumption. Farm households belonging to other community groups reported growing as much as 19 percent non-glutinous rice. The overall proportion of rice holdings using irrigation facilities was 28 percent across the country, with some differences across ethnic groups. For instance, Lao Tais, the majority of whom live along the Mekong River, report a relatively higher share of irrigated rice holdings (34%) compared with only 18% for the Mon-Khmer. The proportion of holdings growing dry season rice seems to be much lower, at 11% percent nationally with differences across communities (16% for Lao Tai and 4% for Mon-Khmer households). 28
50 Table 3.9: Farming operations of the households by ethnic groups, 2010/11 Farming activities Lao Tai Mon-Khmer Hmong-Mien Other Lao PDR Farm households ('000) (61.3) (30.4) 63 (8.0) 1.7 (0.2) (100.0) Landholdings ('000) (61.1) (30.6) 62.8 (8.1) 1.7 (0.2) (100.0) Area of holdings ('000 ha) (63.7) (27.3) (8.8) 4.6 (0.2) (100.0) A. Crop cultivation (% of household holdings) Glutinous rice holdings Non-glutinous rice holdings Irrigated rice holdings Dry season rice holdings Improved rice seed holdings Permanent crop holdings Use of two-wheeled tractors Use of chemical fertilizers (temporary crops) B. Ownership of Livestock/Poultry/Fishery/Forestry (% of households) Cattle Buffaloes Pigs Local chickens Livestock raised mainly for sale Capture fisheries Forestry (% of household income) Note: Households may be engaged in more than one type of farming activity. In total, 38 percent of the farm households reported using improved rice seed varieties. The proportion was the highest among the Lao Tai (52%) and lowest in the case of the Hmong-Mien (8%). All the major ethnic groups devoted about half of their holdings to cultivation of permanent crops. The types of permanent crops grown, as well as the extent of area allocated to such crops by the various ethnic groups, will be examined in more detail in the report on land use and cropping pattern changes. As shown in Table 3.9, a large proportion of the farm households across all ethnic groups engage in livestock, fishery and forestry-related activities. However it was noted that a greater proportion (63%) of the Hmong-Mien farm households raised pigs, which is substantially higher than the national average of 39 percent. Mon-Khmer farm households obtained more of their household income (13%) from forestry activities compared with other ethnic groups. Modes of farm management The issue of farm management is an integral aspect of farm production systems, as it has significant relevance for determining the overall socio-economic status of the farm household. In 29
51 Asia, most major farm management decisions are typically made by men, thereby marginalizing women in terms of effective access to land and financial resources, technology, extension services, etc. (Vepa, 2005; Kelkar, 2009). This section examines the emerging scenario in Lao agriculture with respect to gender roles in farm management and the extent of female participation in farming and related activities based on the LCA 2010/11. The LCA 2010/11 examined two possible modes of farm management by households: single person management and two person management. This was further elaborated to consider whether the farm holding was managed by a male or a female, in the case of single person management, and whether the farm was managed by two males, two females or jointly by a male and a female, in the case of two person management. Interestingly, the household responses at the aggregate level revealed that an overwhelming majority of the farm holdings (67%) are jointly managed by two persons and in most cases of such two person management, the husband and wife jointly manage the farms (Table 3.10). Table 3.10: Mode of farm management at household level, 2010/11 Farm households/management Northern Central Southern Lao PDR No. of farm households ('000) Single person management (%) Two person management* (%) Note: *LCA 2010/11 defines two person management as management by two persons of either gender. In the majority of cases of single person management (33%), male family members were responsible for the important decisions on farm management. The proportion of male family members managing farm affairs under the single management system was 83 percent at the national level, with some variation across regions (89% in the North, followed by 80% in the Central region and 79% in the South). In other words, women family members were sole managers in only 17 percent of farm households. Adoption of technology by farm households The LCA 2010/11 provided information on two important indicators of technology adoption by farm households, in addition to the use of improved rice seeds, as discussed above. Between 1998/99 and 2010/11, use of two-wheeled tractors increased from 20 percent to 61 percent and use of chemical fertilizers increased from 29 percent to 42 percent, with fertilizer use varying substantially across the temporary crops (14-57%). The LCA 2010/11 also brought out the importance of livestock, fishery and forestry activities, as a large proportion of households supplement their livelihoods with such activities. Because a detailed assessment of the livestock sector is provided in a following Chapter, it will simply be noted here that livestock activities revolving around the production of cattle, buffaloes, pigs, 30
52 poultry, etc. have been important traditional activities followed by rural households in Lao PDR. However, the degree of commercialization within the livestock sector has been almost negligible because a large part of the livestock production is used for own consumption, as reported by 70 percent of farm households. Alongside livestock activities, capture fisheries have been an important source of livelihood reported by about 67 percent of the households. There were no major differences reported in these activities across major ethnic groups. The LCA 2010/11 reported that a large proportion of farm households exploit public forests for collecting nontimber forest products (NTFPs), including mushrooms, fruits and vegetables, throughout the year, especially during times of food shortages. The Millennium Development Goal (MDG) Progress Report 2013 observed that NTFPs provide almost half of the cash income of rural households in Lao PDR (GoL/UNDP, 2013). Conclusion The foregoing sections provide an overview of the profile of farm households and farm holdings in Lao PDR as revealed by the two rounds of the Lao Census of Agriculture, in 1998/99 and 2010/11. The analysis highlights that some important changes have taken place in the structure and functioning of farm households that have had significant impacts on farming practices and the performance of agriculture across regions and provinces. 31
53 Chapter 3 appendices Appendix 3.1: Changes in sex and dependence ratios among farm households across provinces, 1998/99 and 2010/11 Province Sex ratio* Dependency ratio** 1998/ / / /11 Phongsaly Luangnamtha Oudomxay Bokeo Luangprabang Huaphanh Xayabury Vientiane Capital Xiengkhuang Vientiane Province Borikhamxay Khammuane Savannakhet Saravane Sekong Champasack Attapeu Notes: *Sex ratio refers to number of males/100 females. A ratio below 100 indicates that there are more females than males; a ratio above 100 indicates more males than females. **Dependency ratio refers to the ratio of people aged 0-14 and 65+ to the population aged years. 32
54 Chapter 4 Land use, cropping pattern changes and agricultural performance Recent government policy initiatives in the agriculture sector in Lao PDR have had the objective of modernizing lowland farming, with a focus on market-oriented production (i.e. cash crops) for smallholders and better conservation of upland ecosystems These policies are intended to improve the livelihoods of rural populations while ensuring food security (NAFRI, 2008). In this chapter we examine the changes that have taken place in the agriculture sector between the two rounds of the LCA, reflecting the impact of government policies, increased exposure to global markets and the substantial foreign investment in certain agricultural sectors. Specifically, this chapter aims to: 1. Discuss the important changes in land use and cropping pattern that have taken place over the past decade across regions/provinces; 2. Understand the resource use and farm management practices of farm households in terms of: (a) use of fertilizers; (b) use of pesticides; (c) irrigation; (e) adoption of farm mechanization; and (e) farm labour and gender differences therein; 3. Review the functioning and characteristics of the rural farm labour market in the country and describe participation trends of farming populations across different farm-related activities (described in terms of gender, age, use of family, outside labour, etc.); 4. Analyse farm production systems the rice production system in particular under various agro-ecological conditions, the composition of farm outputs and trends in productivity of other cropping systems with reference to temporary (annual) crops and permanent (perennial) crops, and marketing and sale of farm produce; and 5. Examine the use of agricultural credit across different types/categories of farms, and the acquisition of agricultural information by farm households. This report supplements analysis of the two rounds of the LCA with data from several other sources, including various issues of the Agricultural Statistics Year Book of the Lao PDR and the recent Lao People s Republic Rice Policy Study (FAO et al., 2012). Land use and changes in cropping patterns Agricultural systems in Lao PDR are broadly divided into lowland and upland systems. Lowland agriculture is dominated by rain-fed and irrigated rice crops, while upland agriculture is dominated by shifting cultivation. Irrigated rice farming largely remains a monoculture system despite government efforts to encourage crop diversification. However, commercial crops are 33 33
55 expanding in lowland areas under irrigated conditions. In upland areas, food crops are grown primarily for home consumption (MAF, 2010). Most farm households follow a mixed farming system, depending on the topography of the land. In the uplands of the Northern provinces, farmers grow rice along with other crops, such as maize, cassava and vegetables, in the rainy season. In the rainfed paddy fields of the Central and Southern provinces, farmers also grow vegetables and groundnuts or other rainfed crops, including tropical fruits. Recently, cultivation of commercial crops, such as rubber, sugar cane, cassava and maize, has expanded in several parts of the country. The LCA 2010/11 showed that only 23 percent of the farm households in Northern provinces are located in lowlands, compared with 70 percent in the South and 62 percent in the Central provinces. The remaining 77 percent of the farm households in the Northern provinces are located in the upland areas (46%) and plateaus (31%). A comparison of data from the LCA 1998/99 and the LCA 2010/11 reveals significant changes. First, there was a 66 percent increase in agricultural land area, from ha to 1.62 million ha, with an additional land area of 0.65 million ha brought under farming. This increased the agricultural land area as a proportion of total area from 4.43 percent to 7.9 percent. With this increase, the average per capita farmland availability increased by almost 50 percent, from 0.24 ha (1998/99) to 0.36 ha (2010/11), and average landholdings per farm household also increased by 50 percent, from 1.6 ha to 2.4 ha. Average farm sizes vary considerably, and range from 3.1 ha in Savannakhet province to 1.3 ha in the Huaphanh province. Only about 1 percent of households are landless, although their number almost tripled, from in 1999 to in A typical farm household in Lao PDR has two or three separate parcels of land. The average parcel size had increased slightly, from 0.77 ha in 1999 to 0.90 ha in Farmlands are most fragmented in the Northern provinces. In Phongsaly province, for example, there is an average of 3.8 parcels per farm household, with an average parcel size of 0.43 ha. The distribution of farmland varies across regions. At the national level, about 22 percent of farm households operate on land of less than 1 ha, while 31 percent operate on between 1 and 2 ha of land, and 19 percent on 2 to 3 ha. Farm households with landholdings of 3 ha or greater constitute 27 percent of total households but occupy 58 percent of the total farmland in the country (Figure 4.1). There are substantial regional variations in the farm size distribution. In the Central region, for example, about 25 percent of households are holdings of less than 1 ha; these have only around 5 percent of the total farmland while households operating 3 ha or more (who comprise 28% of the total number of households) occupy almost 64 percent of the total farmland. In the Central provinces, the largest proportions of farm households with less than 1 ha are located in Vientiane Capital (43%), followed by Huaphanh (42%), Phongsaly (33%) and Vientiane Province (27%). The relative shares of these households in the total area of these 34 34
, Savannakhet (37%), Xayabury (35%) and Sarvane (31%); these farm households had 67 percent")
56 provinces were 10 percent, 18 percent, 12 percent and 10 percent, respectively. Provinces with the largest proportion of farm households with 3 ha and over include Luangprabang (41%), Savannakhet (37%), Xayabury (35%) and Sarvane (31%); these farm households had 67 percent (Luangprabang), 70 percent (Savannakhet), 66 percent (Xayabury) and 60 percent (Sarvane), respectively, of the total farmland in each province. A detailed view of the distribution of farm households according to size classes (landholdings and area) across the country according to the LCA 2010/11 is presented in Appendix 4.1. Figure 4.1: Distribution of farm landholdings and area in Lao PDR 2010/11 No. of holdings (%) Area of holdings (%) No land Below 1 ha 1-2 ha 2-3 ha Above 3 ha According to recent FAO estimates, Lao PDR has the lowest proportion (10.2%) of total land area used for agricultural production, compared with its neighbours, Cambodia (31.5%), Myanmar (19%), Thailand (38.7%), and Viet Nam (33.1%). 11 This low proportion of agricultural land is due to the constraints on land development in Lao PDR, such as land topography, substantial levels of waterlogged areas and the presence of UXOs, which are found in 15 out of the 17 provinces in the country. 12 The province most severely affected by UXOs is Xiengkhuang, where almost 35 percent of landholdings are affected. Other provinces affected to a significant 11 Source: FAO Statistical Year Book, The figure for proportion of cultivated area in FAOSTAT is slightly higher than that obtained from the LCA, probably due to differences in the time period and sample coverage. 12 The presence of UXOs continues to have an impact on rural lives by affecting livelihoods and food security for a large number of households in Lao PDR, even thirty years after the war. UXOs cause loss of life as well as physical disabilities. According to the Lao National Unexploded Ordnance Programme, accidents usually occur in village centres (32%), upland rice fields (18%), lowland rice fields (13%) and near forests (12%).Furthermore, the contaminated areas represent 50% of all agricultural land. UXO presence still affects access to land, making it more difficult to plant crops, herd animals, and collect fuel, water and NTFPs, thus reducing livelihood opportunities for many rural households(lnuop, 2008). 35
57 extent include: Attapeu (with 17% households affected), Sekong (14%), Khammuane (11.5%), Saravane (8.3%) and Savannakhet (7%). The LCA defined agricultural land use by farm households as including land under temporary as well as permanent crops, temporarily fallow land, meadows and pastures. It classified land under forests and other woodlands, as well as other lands as non-agricultural land. 13 Table 4.1 shows the changes in land use between 1999 and 2011, when agricultural land area increased by an average of 4 percent per annum. Table 4.1: Major changes in agricultural land use in Lao PDR between 1998/99 and 2010/11 Agricultural land area ( 000 ha) Land use category (%) annual 1998/ /11 growth* I. Agricultural land 976 (93.1) (86.8) 4.3 (a) Land under temporary crops 765 (73.0) (65.8) 4.0 (b) Land temporarily fallow 112 (10.7) 198 (10.6) 4.9 (c) Land under permanent crops 81 (7.7) 149 (7.9) 5.2 (d) Meadows and pastures 18 (1.7) 26 (1.4) 3.1 II. Non-agricultural land 72 (6.9) 247 (13.2) 10.8 (a) Forest and other wooded land 54 (5.2) 122 (6.5) 7.0 (b) Other land 18 (1.7) 125 (6.7) 17.5 Grand Total (100.0) (100.0) 4.9 % share of total land area Note: Other land includes land under water, land occupied by buildings or roads, wasteland, and other uncultivated land. Figures in brackets indicate the relative share of total land area. *Growth rates indicate annual compound growth. There was a major shift during this period from temporary to permanent crops, and the area under permanent crops grew at 5 percent per annum. The area under temporary crops grew at 4 percent, increasing from ha (1998/99) to ha (2010/11), but its share in total agricultural land declined, from 73 percent to 66 percent. It is important to highlight that during this period, the land under non-agricultural uses increased rapidly, particularly that categorized as other lands, which increased at an average annual rate of 17.5 percent, increasing its share in total land from 1.75 to 6.7 percent. There was an average annual increase of 7 percent in forest area between the two periods. This increase could be attributed to the impact of the recent policies of the Government of Lao PDR to increase forest cover by promoting forest plantations (including agro-forestry plantations), which are classified by the government as a type of forest. While teak and rubber plantations have been extensively planted by the smallholders in northern Lao PDR, Eucalyptus and Acacia 13 The Agricultural Census collected two types of forestry data, i.e. forest land that forms part of the land owned or operated by the household, and public forest land exploited by the household. Other land includes land under water, land occupied by buildings or roads, wasteland, and other uncultivated land (LCA, 2010/11). 36
58 plantations have increasingly been planted by multinational companies in the Central and Southern regions (Phimmavong, et al., 2009). Table 4.2 provides a summary of the agricultural land use scenario reported in the LCA 2010/11. It indicates that both the Northern and Southern regions use almost 90 percent of the total arable land for cultivation, compared to 83 percent in the Central region. This somewhat higher level of cultivation intensity in the Northern and Southern regions may be partly attributable to the relatively larger share of permanent crops grown in these regions (20% and 13%, respectively), compared to the Central region, where only 4 percent of the total agricultural land area was used for permanent crops. It may also be partly due to the shortening of fallow periods and increased multiple cropping. Table 4.2: Features of land use by region, LCA 2010/11 Land use category North Central South Lao PDR 1. Total area of holdings ('000 ha) Total agricultural land ('000 ha) Agricultural land (% of total area) Temporary crops (% of total agri. land) Permanent crops (% of total agri. land) Fallow land (% of total area) Grazing area (% of total area) Forest & other woodlands (% of total area) Other lands (% of total area) The proportion of land kept fallow was about 10 percent on average during 2011, although a somewhat higher proportion of fallow land was reported in the North (14%). This could be attributed to the fact that the majority of land in the Northern provinces is uplands (Table 4.3 in the report on farm households), where opportunities for growing temporary crops are very limited. The Central region differs from the Southern and Northern regions in terms of agricultural area put to other land uses, as well as forest plantations (8.7% and 8.4%, respectively). A detailed assessment of the present agricultural land use scenario across the provinces is presented in Appendix 2. Changes in cropping pattern One of the major changes observed between the two LCA periods was the increase in area devoted to permanent crops, although most land area in the country (89%) is still devoted to temporary crops. There was a significant increase in land devoted to permanent crops in all the regions but with considerable variation across regions. The rate of increase was more prominent in the Northern provinces, which saw a six-fold increase, compared with a two-fold increase in 37
 1000.0 800.0 600.0 400.0 200.0 0.")
59 the Southern and Central provinces. Permanent crops already had a significant presence in the Southern region during 1998/99 and the increase since then was only marginal (Figure 4.2). Figure 4.2: Changes in area under temporary and permanent crops, 1999 to Area ('000 ha) North Central South Total Permanent crops Temporary crops There were about permanent crop growers added at the national level between 1999 and The largest increases in the number of permanent crop growers were in the Central and Northern provinces, where their numbers increased by and , respectively. In the North, more growers started growing permanent crops in the five provinces of Phongsaly, Luangnamtha, Oudomxay, Bokeo and Xayabury, while in the Central region the increase was most pronounced in the provinces of Khammuane, Savannakhet, Vientiane Province and Xiengkhuang. In the South, although all four provinces reported an increase in the number of permanent crop growers, two provinces, Attapeu and Sarvane, reported a more than threefold increase (Figure 4.3). Cultivation of permanent crops seems to have been more attractive for larger farmers. Farmers with holdings below 1.5 ha rarely adopted these crops, while the larger farmers (with over 3 ha) were the highest adopters. Smaller farmers are more likely to devote their lands to meeting subsistence food needs, given expected revenues and risks. They are also likely to be more cashconstrained and therefore unable or unwilling to incur the cash outlays needed to establish permanent crops that give returns only in the relatively distant future. 38
 had a cultivation intensity of more than 100 percent in the case of temporary crops.")
60 Large growers (>3 ha) have reported a higher percentage of total farmland area under permanent crops (23%) compared with 12 percent in the case of medium and small growers ( ha). On the other hand, the smallest landholders (<1.5 ha) had a cultivation intensity of more than 100 percent in the case of temporary crops. In these smaller farms, rice occupied percent of the area, compared with percent in the larger (>1.5 ha) farms. Figure 4.3: Number of permanent crop growers across provinces, 1998/99 and 2010/11 Attapeu Champasack Sekong Saravane Savannakhet Khammuane Borikhamxay Vientiane Pr. Xiengkhuang Vientiane Cap / / Xayabury Huaphanh Luangprabang Bokeo Oudomxay Luangnamtha Phongsaly No. of permanent crop growers ('000) Note: The total number of permanent crop growers was and , respectively, during 1998/99 and 2010/11. Cropping pattern changes: temporary (seasonal) crops The potential for expansion of arable land area in Lao PDR is severely affected by multiple constraints, such as type of terrain, bodies of water and presence of UXOs. Nonetheless, agriculture in Lao PDR is diversified and produces a wide variety of annual (mainly seasonal) crops. The LCA 2010/11 reported that the country had grown more than 100 temporary crops, broadly falling into the categories of: (a) food crops; (b) starchy roots and tubers; (c) legumes; (d) leafy, stem and fruit-bearing or other vegetables; (e) sugar crops; (f) oil seed crops; (g) fibre crops; and (h) fodder crops. The variety of temporary crops grown may in fact be greater, as the census reported crop data only where the farm household s crop area was more than 100 square metres (LCA, 2010/11). However, most farming is focused on producing a handful of temporary crops, most importantly rice (Table 4.3). 39
61 Table 4.3: Number of growers and area under temporary crops in Lao PDR, 1998/99 & 2010/11 No. of growers ( 000) Area*( 000 ha) (%) Annual change* Average area/grower (ha) Temporary crops 1998/ / / /11 Growers Area 1998/ /11 1. Rice Maize Sweet potato Cassava Yam Mung bean Sugar cane Groundnut Soybean Sesame Cotton Tobacco Chinese cabbage Watermelon Chili Note: *Area excludes crops planted in plots of less than 100 square metres. *Indicates annual compound growth rates. Overall there has been a significant increase in the area of most of the temporary crops grown. This period witnessed a notable increase in the number of rice growers (1.4% growth per annum) and rice area (2.5% growth per annum) along with a 13 percent increase in the average ricegrowing area per grower, from 1.2 ha (1998/99) to 1.4 ha (2010/11). Another important development has been the rapid increase in area devoted to maize, which increased at an average annual rate of 15 percent, although the number of growers increased quite slowly (at about 2% per annum). Annual maize production increased tenfold between 2000 and 2009 from to tonnes becoming the second largest contributor to the country s agricultural GDP and agricultural exports (Castella and Lestrelin, 2011). Most farmers reported growing maize along with rice, with maize primarily as a cash crop and rice to meet food requirements (Douangsavanh and Bouahom, 2006). While most maize is exported to animal feed and food processing industries in Thailand, some of it is used domestically for human consumption and animal feed. Table 4.3 also shows a decline in the number of growers of nine crops, including cotton (16%), yam (6.8%), sweet potato (5%), sugar cane (4%) and cassava (3%). In the case of sweet potato, although the number of growers fell, the area cropped increased by 11 percent. Sweet potato has traditionally been used for consumption by households when rice was in short supply, although much of the sweet potato is currently used as feed for farm livestock, especially pigs (FNPP, 2007). There was an increase in the number of farmers growing other crops between the two census rounds, but the area cultivated under such crops was quite small. For instance, in the case of potato, while the number of potato growers increased from 100 to 900, the total potato area 40
, sugar cane (0.1 ha to 0.5 ha), sesame (0.03 ha to 0.")

62 increased only to 300 ha by 2010/11. Similarly, a large number of farmers (9 800) had started growing taro by 2010/11, but the total area cultivated was only 100 ha. The average cropped area per grower increased between the two periods, especially in cases of crops other than rice, i.e. maize (0.2 ha to 0.7 ha), sugar cane (0.1 ha to 0.5 ha), sesame (0.03 ha to 0.4 ha), cassava (0.1 ha to 0.4 ha), groundnut (0.23 ha to 0.29 ha) and soybean (0.17 ha to 0.28 ha).this may be because, despite the decline in grower numbers, the remaining farmers have increased land allocated to such crops in response to market incentives. The status of adoption of various crops across the provinces may be a useful indicator to determine the concentration of growers and specific crops in the provinces. Almost 80 percent of the temporary cropped area is devoted to rice, the main staple crop, and many farmers have very little additional land to allocate to other crops. Figure 4.4 shows both the proportion of farmers growing rice and the share of rice in total farmland in 2010/11. It may be noted that the vast majority of farm households grow rice (in five provinces this included every farmer), and typically most of the land is allocated to rice. Only two provinces, Xayabury and Oudomxay where maize is very important reported a relatively lower share of areas grown with rice (41% and 57%, respectively). A brief account of the important aspects of the rice economy of Lao PDR is provided in the next section. Figure 4.4: Proportion of farmers growing rice and area under rice, by province, 2010/11 (%) Attapeu Champasack Sekong Saravane Attapeu Champasack Sekong Saravane Savannakhet Khammuane Borikhamxay Vientiane Pr. Xiengkhuang Vientiane Cap Savannakhet Khammuane Borikhamxay Vientiane Pr. Xiengkhuang Vientiane Cap Xayabury Huaphanh Luangprabang Bokeo Oudomxay Luangnamtha Phongsaly Share of growers growing rice (%) Xayabury Huaphanh Luangprabang Bokeo Oudomxay Luangnamtha Phongsaly Share of area grown with rice Other than rice, the crops that occupied significant land area were maize, cassava and sugar cane. In fact, maize is the second most important crop after rice. As shown in Figure 4.5, maize is grown throughout the country, particularly in the Northern region, where it is grown either as a monocrop or in combination with upland rice. Maize is grown mainly for human consumption in 41

. Figure 4.")
63 the Central and Southern regions, where farmers commonly grow local, waxy varieties. In the Northern region and parts of the Central region, such as Vientiane Capital and Vientiane Province, maize is grown mainly for export as poultry and animal feed. The Government of Lao PDR has promoted maize production for animal feed purposes by introducing hybrid varieties, which resulted in a significant expansion in area and production of maize in recent years. However, it is reported that the country does not have a well-designed maize breeding programme, as it does in the case of rice (FNPP, 2007). Figure 4.5: Cultivation of maize, cassava and sugar cane across provinces, 2010/11 Attapeu Champasack Sekong Saravane Savannakhet Khammuane Borikhamxay Vientiane Pr. Xiengkhuang Vientiane Cap. Xayabury Huaphanh Luangprabang Bokeo Oudomxay Luangnamtha Phongsaly Maize Cassava Share of growers (%) Attapeu Champasack Sekong Saravane Savannakhet Khammuane Borikhamxay Vientiane Pr. Xiengkhuang Vientiane Cap. Xayabury Huaphanh Luangprabang Bokeo Oudomxay Luangnamtha Phongsaly Maize Share of area in total crop area (%) Note: Percentage share of sugarecane in total crop area is not reported for most provinces. Although a large number of growers also grow other important crops, such as cassava, sugar cane, soybean and groundnut, these crops do not occupy a notable share in the land area across provinces, with a few exceptions i.e. Vientiane Capital, Borikhamxay, Sekong and Sarvane where the percentage of land area allocated for growing cassava exceeded that allocated for maize. Rice production in Lao PDR As in most countries in the region, rice is the staple food in Lao PDR. Rice is not only associated with cultural traditions, but it has also been a prime crop throughout the country s history (Schiller, et al., 2006). The national policy of rice area expansion over the past two decades, aimed 42
64 at achieving food security, was instrumental in achieving self-sufficiency in rice production at the national level by 2006 (FAO et al., 2012). According to the LCA 2010/11, the total area of rice planted in Lao PDR was ha, comprising ha (72%) of wet season lowland rice, ha (22%) of upland rice, and ha (6%) of dry season lowland rice. The most important rice-growing provinces were Savannakhet ( ha) and Champasack ( ha), which together accounted for 33 percent of the total rice area planted in the country. Between 1998/99 and 2010/11, the number of wet season rice growers increased by more than 18 percent, from to Vientiane Province and Savannakhet, with and additional growers, respectively, reported the largest number of new rice growers. The average size of wet season rice holdings has increased slightly, from 1.1 ha in 1999 to 1.3 ha in Rice farms are smaller in the North, averaging less than 1 ha, compared with 1.5 ha in the rest of the country. The average size of a rice farm was about 2 ha in Savannakhet province. Table 4.4 provides an overview of the important features of rice production in Lao PDR. The majority of the rice is grown during the wet season (94%). The majority of the rice-growing area in the Central and South regions is in the lowlands, while over half of the rice in the South is grown in the uplands. Table 4.4: Important features of rice activity in Lao PDR, by region, 2010/11 Features of rice-growing areas North Central South Lao PDR 1. Total rice area ( 000 ha) Total wet season rice area ('000 ha) (96.7) (93.2) (94.0) (94.2) 3. Lowland rice area ( 000 ha) (39.7) (84.6) (82.0) (72.4) 4. Upland rice area ( 000 ha) (57.0) (8.6) (11.9) (21.8) 5. Total dry season lowland rice ( 000 ha) 8.55 (3.3) (6.8) (6.0) (5.8) 6. Local rice seed area ( 000 ha) (87.7) (46.3) (35.0) (54.5) 7. Improved rice seed area ( 000 ha) (12.3) (53.7) (65.0) (45.5) 8. Glutinous rice-growing area ( 000 ha) (85.4) (94.1) (92.9) (91.6) Short Maturity (% of glutinous Medium rice-growing area) Long Note: Figures in brackets indicate the percentages of the respective areas. Data from the LCA 2010/11 indicate that the proportion of total irrigated rice area is relatively low in the Southern (11%) and Central regions (18%), compared with 30 percent in the Northern provinces. A detailed analysis of the farming environments, as well as resource use by farm households, is presented in the next section of this report. At the national level, improved rice varieties are planted in almost 46 percent of the total ricegrowing area. However, the adoption of improved seed varieties is largely confined to the 43 43
65 Southern (65%) and Central (54%) provinces, with the Northern provinces reporting use of improved seeds in only 12.3 percent of the rice-growing area. 14 Improved rice varieties are most widely used in the provinces of Champasack (by 82% of rice growers) and Savannakhet (by 74% of rice growers). The fact that much of the rice-growing area in the Northern provinces is located in the uplands makes it difficult for many farmers in the region to increase their use of improved seeds, which are mainly used in lowland conditions. Reportedly, this is the one of the reasons for the major rice deficit in the Northern regions (FAO et al., 2012). One notable feature of the rice production sector in Lao PDR is that over 90 percent of its rice is of the glutinous type, which has been traditionally cultivated by most Lao people 15 (Latvilayvong, et al., 2010). In fact, Lao PDR, together with Thailand and Viet Nam, produced more than 13 million tonnes of glutinous rice (FAO et al., 2012), with Lao PDR contributing approximately 22 percent, behind Viet Nam (28%) and Thailand (50%). At the regional level, the reported share of glutinous rice production in the Northern provinces was 85 percent, compared with 94 percent in the Central and 93 percent in the Southern regions. Non-glutinous rice was most commonly grown in the Northern provinces of Phongsaly and Luangnamtha, where 41 percent and 37 percent, respectively, of rice-growing area was planted with nonglutinous varieties. With respect to the length of the cropping season, the Northern region grows longer-maturing (5 months) rice in almost half of the total glutinous rice-growing area. Growers in the Southern and Central regions reported growing more of the short-maturing (3 months) and medium-maturing (4 months) varieties. In the Southern region, 91 percent of rice-growing area was planted with the short- and medium-maturing varieties, and in the Central region, these varieties occupied 82 percent of the rice-growing area. Cropping pattern changes: permanent crops The LCA 2010/11 defined permanent crops as crops with a growing cycle of longer than one year, such as fruit and nut trees, bananas, coffee, tea, cardamom and natural rubber. A comprehensive survey of permanent crops (excluding crops in areas of less than 100 square meters) indicated a total of over 80 permanent crops grown in the country, broadly classified as: (a) citrus crops; (b) pome and stone fruits; (c) tropical fruits; (d) beverage crops; (e) spice crops; 14 The adoption of improved seeds in the Central and Southern provinces had reached 65-80% in the wet season and almost 100% in the dry season during the 1990s. Many farmers had adopted new varieties in response to market demand, while continuing to grow the traditional indigenous varieties to meet personal and family taste preferences (FAO/IRRI, 2012). 15 The adoption of glutinous rice is closely associated with the early migration and settlement of ethnic groups from the southern part (Yunnan Province) of China, north-eastern part of Myanmar, north-western part of Viet Nam, northern part of Cambodia, and northern and upper north-eastern parts of Thailand, which are all neighbours of Lao PDR. The preference for glutinous rice has been associated with the predominance of ethnic groups (Latvilayvong, et al., 2010)
66 (f) natural rubber; (g) nut crops; (h) fibre crops; and (i) other (unclassified) permanent crops. A detailed list of the major permanent crops (by broad category), along with the distribution of growers, areas planted with permanent crops and the relative dominance of three selected crops in each category, is presented in Appendix 4. Table 4.5 illustrates some important changes in the structure and composition of the permanent crop sector in Lao PDR that occurred between the two rounds of the LCA. An important change in the agrarian landscape of Lao PDR over the last decade ( ) has been the emergence of natural rubber as a new permanent commercial crop. Rubber shows immense potential for further development and for improving the socio-economic status of farm households. There were only about 100 rubber growers reported in the LCA 1998/99, but this number has increased dramatically, to growers with a planted area of ha. Table 4.5: Number of growers and area under permanent crops in Lao PDR, 1998/99 & 2010/11 No. of growers ('000) Average crop area/ % % Area planted (ha) grower (ha) annual annual Crops 1998/ /11 Change* 1998/ /11 Change* 1998/ /11 1. Rubber na Coffee (BC) Banana (TC) Cardamom (SC) Mango (TC) Tea (BC) Pineapple (TC) Mandarin (CC) na Tamarind Lemon (CC) Coconut Jackfruit Orange (CC) Longan Papaya (TC) Note: CC citrus crops; TC tropical crops; BC beverage crops; SC spice crops. *Indicates annual compound growth rates. The increase in both the number of permanent crop growers and the area planted was also noticeable in the case of beverage crops tea and coffee although the increase in coffee was not as prominent as in the case of tea. The number of tea growers increased from to and the increase in tea area planted was four-fold, from 500 ha (1998/99) to ha (2010/11). In the case of coffee, there were an additional growers and the increase in area planted was about hectares (or 11.4%) between the two periods. There were new farmers 45
67 growing cardamom but the area planted only increased by ha. In the case of coconut, there was a marginal increase in the number of growers without any change in the area planted. Although the number of coffee growers and coffee area planted between the two periods increased only slightly, coffee production has provided significant export gains for the Lao PDR. Coffee exports increased significantly in the 1990s, facilitated by several factors, including the new economic initiatives, a rise in coffee prices in 1994 and the devaluation of the national currency. The national authorities also supported development of the coffee sector by promoting adoption of high-yielding Arabica dwarf varieties (MAF, 2007). The number of growers fell for several crops. These included oranges (about 7% per annum) lemons, pineapples (6% per annum) and papayas (4% per annum). The planting area of some of these fruit crops also fell, particularly in the case of papaya (7% per annum), orange (5.6% per annum), tamarind and banana (3% each per annum). It is important to note that the permanent crops show a high degree of regional concentration (Table 4.6). For instance, almost the entire coffee-growing area in Lao PDR (99%) is in the Southern region, especially in the Champasack (64%) and Saravane (22%) provinces. Although 80 percent of the rubber-growing area is located in the Northern region, all other provinces (except Attapeu), have also started growing rubber, either with support from foreign companies or with individual farmer investments. Bananas were grown in all regions, but most bananas were produced in the Central region (52%) and the Southern region (31%). Table 4.6: Regional concentration of permanent crops in Lao PDR, 2010/11 Permanent crops North (%) Central (%) South (%) Total ( 000 ha) Total area under permanent crops Area of compact plantations Coffee Rubber Banana Cardamom 42.2 na Tea na Mango Tamarind Coconut Cardamom-growing areas are confined to the Northern (Phongsaly province) and Southern regions, with three Southern provinces Champasack, Sarvane and Sekong reporting 58 percent of the cardamom crop area. Almost all the tea-growing areas are in the Northern provinces, with over 75 percent of the tea plantations located in Phongsaly province. 46
68 Agricultural performance: resource use and farm management practices This sub-section reviews the resource use and farm management practices of farm households in Lao PDR. It specifically looks at the following aspects: (a) use of fertilizers and pesticides; (b) irrigation; (c) farm mechanization; and (d) use of farm labour, including gender differences, if any. Use of fertilizers and pesticides Since a large proportion of farm households in Lao PDR still engage in traditional subsistence agriculture, the use of purchased inputs, especially chemical fertilizers and pesticides, has been minimal. The adoption of these inputs had largely been confined to the farmlands along the Mekong River corridor (Schiller, et al., 2006). However, with the gradual move towards the use of improved seeds, as well as the emergence of commercial interests in farming, the use of chemical fertilizers and pesticides, especially over the last decade, has increased significantly. According to a farm-level survey reported by Pandey and Sanamongkhoun (2008), about 60 percent of the farmers claimed to have started using fertilizers only after The LCA 2010/11 also highlighted the increasing adoption of modern agriculture practices in the country. This included a significant increase in the use of fertilizers, from 29 percent of households in 1998/99 to 42 percent in 2010/11, as well as an increase in the number of households using pesticides, from 11 percent to about 18 percent during the same period (Table 4.7). However, application of fertilizers is currently restricted to temporary crops, mainly rice and maize. The use of organic fertilizers also showed a 21 percent increase during the period, from 34 percent to 41 of farm households. Farmers have shown a preference for organic fertilizers; chemical fertilizers are often used in conjunction with them. The Government of Lao PDR has a policy promoting use of organic fertilizers in the lowland rice production system in particular, because most of the soils in the major rice-producing areas are moderately acid loams, sandy loams and loamy sands, which are low in organic matter, carbon exchange capacity and percent base saturation. The government has set up organic fertilizer factories in many provinces of the country to cater to the growing demand for organic fertilizers and, reportedly, the price of organic fertilizer was not a major concern for farmers (Sayalath et al., 2006). Table 4.7: Changes in the use of fertilizers and pesticides in Lao PDR, 1998/99 and 2010/11 Percentage of farm households using Region Chemical fertilizer Organic fertilizer* Pesticides 1998/ / / / / /11 Rice (2010/11) Northern Central Southern Lao PDR Note: Data on use of fertilizers relate to temporary crops, while data on use of pesticides relate to all crops; *Organic fertilizers are substances of organic origin, either natural or processed, such as animal manure and compost


69 The regional scenario of fertilizer use (both chemical and organic) indicates relatively lower use in the Northern provinces (16% for both types) compared to the Southern and Central regions. The relatively lower use of fertilizers reported in the Northern region could be attributable to a combination of factors. First, Northern regions have a higher proportion of upland areas (57%) than the Central (9%) and Southern (12%) provinces (see Table 4.4). Second, only 16 percent of the farm households use improved rice varieties in the North, compared with 51 percent in the Central and 66 percent in the Southern regions. Third, Northern provinces have a relatively lower share of some of the important crops in total farm area, i.e. rice (26%), cassava (22%), groundnut (31%) tobacco (24%) and watermelon (30%), that are grown using chemical fertilizers (also see Onphandhala, 2009). A comparison of pesticide use by region over the two rounds of the LCA reveals that there was little change in pesticide use in the Central region (16% to 18%) during this period, but it increased from 8 percent to 16 percent in the Southern provinces and from 5 percent to 19 percent in the Northern provinces, so that at the national level pesticide use is now more or less similar across regions. It may be noted that only 11 percent of farmers used pesticides for rice. Figure 4.6: Use of fertilizers and pesticides across provinces, 2010/11 Chemical only Organic alone Both Attapeu Champasack Sekong Saravane Lao PDR Attapeu Champasack Sekong Saravane Savannakhet Khammuane Borikhamxay Vientiane Pr. Xiengkhuang Vientiane Cap. Xayabury Huaphanh Luangprabang Bokeo Oudomxay Luangnamtha Phongsaly Savannakhet Khammuane Borikhamxay Vientiane Pr. Xiengkhuang Vientiane Cap. Xayabury Huaphanh Luangprabang Bokeo Oudomxay Luangnamtha Phongsaly Percentage of holdings Percentage of crop growers using pesticides The pattern of fertilizer use across provinces varied considerably; in most cases, the use of either organic fertilizers alone or a combination of organic and chemical fertilizers appeared to be the preferred option among farm households (Figure 4.6). Although the use of chemical fertilizers alone was lower than 5 percent in six of the 17 provinces, it was much higher in two provinces, 48 48
70 Vientiane Capital (38%) and Champasack (37%), and moderately higher in Luangnamtha (20%), Savannakhet (18%), Bokeo (18%) and Vientiane Province (16%). Some reasons for the relatively higher use of chemical fertilizers in these provinces include: (a) higher proportions of rice growers cultivating improved rice varieties (82% in Champasack; 74% in Savannakhet; 63% in Vientiane Capital); (b) larger proportions of farm holdings greater than 3 ha (43-70%); and (c) higher proportions of land devoted to temporary crops (57-70%). The application of pesticides was reported to be highest in the provinces of Luangnamtha, Phongsaly, Vientiane Capital, Vientiane Province, Champasack, Bokeo, Champasack and Attapeu. The use of pesticides differed across landholding size classes, with the smallest (<0.5 ha) and largest (> 2 ha) farm holdings using slightly more (16-17%) compared with holdings of ha (10-13%). It is important to note here that the census data do not provide sufficient data for comparing the actual quantity of fertilizers and pesticides being applied by farmers. Use of irrigation Lao PDR is regarded to be much better supplied with freshwater resources than most of the countries in the Southeast Asian region. As per the latest assessment available for the year 2012 (AQUASTAT, FAO), Lao PDR reported freshwater availability of thousand cubic metres per capita compared with 5-33 thousand cubic metres per capita in other countries in the region. The rate of freshwater withdrawal is also one of the lowest (1.3% per annum) compared with many of the countries (2.3% to 17%) in the region. These data suggest that the country has great water resource potential for the development of irrigation systems. According to sources in the Ministry of Agriculture and Forestry, large public investments were made during the second half of the 1990s to support the installation of irrigation pumps along the Mekong River and its tributaries in the three main plains of Vientiane, Savannakhet and Khammuane provinces. As a result, the irrigated area in the country increased from 0.17 million ha during 1995 to 0.37 million ha during 2005 and then to 0.41 million ha during A notable aspect of the irrigation development was that the share of dry season irrigated area in the country increased from 20 percent during 1995 to almost 42 percent during 2010 (MAF, 2011). The LCA 2010/11 provided some important information regarding the use of irrigation sources among farm households, especially rice growers. The farm households were asked whether they used irrigation for their crops during the 2010 wet season and the 2010/11 dry season. This included irrigation through government irrigation schemes as well as other options. Most irrigation schemes are small-scale and village-based. At the national level, the level of irrigation development reported was 22 percent, suggesting room for development of irrigation potential in regions and provinces that are not currently covered under the national development strategy. 49
71 Regionally the proportion of irrigated area was relatively high in the Central (26%) and Northern (21%) provinces and lowest in the Southern (12%) provinces (Table 4.8). Table 4.8: Irrigated land use and rice area irrigated, by type of land, 2010/11 Irrigated area (%) Region Total agri. Rice area Wet season Dry season land ('000 ha) ('000 ha) Total land Total rice rice rice North (43.5) Central (71.7) South (68.0) Total (61.0) Note: Figures in parentheses indicate the relative share of rice area in the total agricultural area in the region or at the national level. Government- provided irrigation facilities account for only 22 percent of the irrigation facilities across regions. Other sources, such as permanent weirs, reservoirs, pump schemes, private pump installations, gates and dykes, temporary weirs, gabions, etc. were the major sources of irrigation water (Figure 4.7). Temporary and permanent weirs constitute nearly half of available irrigation facilities. Pump schemes were available in 8 percent of the villages. Figure 4.7: Major sources of irrigation, 2010/11 Gabions, 6.8% Permanent weirs, 16.7% Temporary weirs, 29.3% Reservoirs, 4% Pump schemes, 7.5% Gates & dykes, 3% Note: Data based on the Village Survey Component of the LCA, 2010/11 An interesting fact revealed by the LCA 2010/11 was that the farmers in the smallest landholding size class (below 0.5 ha) reported a higher proportion of land area under irrigation (almost 49%) 50
72 than the larger farm size classes (Figure 4.8). Though the percentage of holdings accessing irrigation facilities ranged between 41 percent and 46 percent in the landholding size classes above 1.5 ha, the proportion of irrigated area for these size classes ranged from 17 percent to 27 percent. This corresponds to the observation that, by and large, holders of the smallest farm sizes (below 1 ha) grow rice on percent of their farmlands, in contrast to the medium- and largesize growers who grow rice on smaller fractions of their farmlands (68% in the 1.5 to 2 ha size class; 62% in the 2-3 ha size class; 40% in the over 3 ha size class). Figure 4.8: Irrigation use by size of landholdings in Lao PDR, 2010/ Below 0.5 ha > ha > ha > ha > 2-3 ha Above 3 ha Hold. Irrigated (%) Area irrigated (%) The status of irrigation development and water use for agriculture, especially rice, is presented by province in Appendix 4. In four of the seven Northern provinces Xayabury, Huaphanh, Luangnamtha and Bokeo the share of irrigated rice area was in the relatively high range of 35 percent to 38 percent. Vientiane Province and Xiengkhuang, in the Central region, reported the highest percentages of rice area under irrigation, i.e.40 percent and 38 percent, respectively. The lowest proportions of irrigated rice area were reported from Attapeu and Savannakhet (8% each), followed by Champasack (8.7%) and Khammuane (9.7%) provinces. The proportion of irrigated area also varied according to the location of households across geographical settings. For instance, households located in the plateau reported relatively higher irrigation coverage (38%) compared with households in the lowlands (29.7%) and uplands (25%). Farm households growing improved rice seeds reported increased use of irrigation (see Appendix 4). In the Northern provinces, 69 percent of farm households growing improved rice used irrigation, compared with less than 25 percent of farm households growing local rice varieties. These ratios were similar in the Central provinces but were lower in the Southern 51 51
73 provinces, where only 14 percent of farm households growing improved rice varieties reported use of irrigation, compared with 5 percent of households growing local seeds. While this is probably at least partly due to the lower irrigation development status in the South (12%), compared with Central (26%) and Northern regions (21%), as seen in Table 4.8, this issue needs to be explored further. The fact remains that, despite the abundant freshwater resources enriched by reasonable amount of rainfall 16 in the country, about 75 percent to 78 percent of the agricultural land areas still lack irrigation coverage. Farm mechanization A significant aspect of agricultural transformation experienced in Lao PDR over the past decade has been the increasing mechanization of farm operations. This has mostly been a case of selective mechanization, characterized by increased adoption of four-wheeled or two- wheeled tractors and use of water pumps and farm processing machinery, as well as other small farm equipment. Between the two rounds of the LCA, the proportion of farm households in the country using twowheeled tractors increased three-fold, from 20 percent (1998/99) to 61 percent (2010/11). Ownership of a two-wheeled tractor increased almost five-fold, from 7 percent to 34 percent. The increase in the use of tractors was more pronounced in the Central region, where it increased from 35 percent to 82 percent, compared with the Southern (5.4% to 58%) and Northern (13% to 47%) regions. Among the provinces, the level of adoption of farm mechanization was highest in Vientiane Capital and Khammuane; use of two-wheeled tractors increased in Vientiane Capital from 67 percent (1999) to 88 percent (2011), while Khammuane reported an increase from 25 percent to 88 percent. Other provinces reporting higher use of tractors were Vientiane Province (85%), Savannakhet (82%), Borikhamxay (79%) and Xayabury (76%). The use of tractors by farm households was notably lower in two provinces, Phongsaly (26%) and Sekong (30%), in both 1998/99 and 2010/11. The low level of tractor use in these two provinces may be partly due to the relatively higher proportion of households practicing shifting cultivation 24 percent in Sekong and 12 percent in Phongsaly compared with 5 percent at the national level. The twowheeled tractors are available for US$1 500 per unit, as opposed to conventional four-wheeled tractors, which cost US$ or more per unit; this makes them more affordable for creditconstrained farmers. Two-wheeled tractors also minimize soil erosion and nutrient loss caused 16 The rainfall records for the period as reported by the Meteorology Department (Ministry of Agriculture and Forestry) indicate that average annual rainfall was as high as mm in Pakse, followed by Vientiane Capital (1 772 mm), Savannakhet (1 619 mm) and Luangprabang (1 481 mm)
74 by heavy tillage done with conventional large tractors and they are also better adapted to small bunded rice paddy fields. The LCA 2010/11 showed that many households utilized machinery in farm operations, though only a minority of households owned the machines, suggesting that many farmers access machinery rental services (Table 4.9). Table 4.9: Use and ownership of farm machinery by farm households, 2010/11 Percentage of Farm HHs Machinery type Using machinery Owning machinery 1.Two-wheeled tractor Rice miller Rice thresher Truck Four-wheeled tractor Sprayer Mower Pump Harvester Generator Blender Planter/seeder Table 4.10 provides data on use of farm machinery and equipment as well as use of draught animals, according to farm size. While use of two-wheeled tractors, threshers and millers was relatively similar among land-owning farm households, use of other machinery tended to be somewhat higher among larger-sized farms. Table 4.10: Use of farm machinery and equipment by size class of farm, 2010/11 Percent of farm HHs using No land * Below 1 ha 1 to 2 ha 2 to 3 ha Above 3 ha Total 1. Draught animals Trucks Four-wheeled tractor Two-wheeled tractor Generator na Water pump Rice thresher Rice miller No. of farm HHs ('000) Note: *The use of farm machinery by households with no land may be taken to mean use of the same on land leased by this group for farming purposes. 53
75 The widespread use of two-wheeled tractors in particular has caused a significant decline in the number of households depending upon draught animals. A large number of households have been selling their cattle stock, thereby causing a sharp decline in the number of draught animals (especially buffaloes) in the country (Tanthaphone, 2007; see also Chapter 6). The expansion of rubber cultivation is also reported to be a major factor triggering this decline, as noted in the chapter on livestock and poultry. However, the Southern provinces still report substantial use of draught animals (30%) and lower use of four-wheeled tractors (Table 4.11). Appendix 5 presents a detailed picture of the use of farm machinery across provinces. Table 4.11: Use of draught animals and tractors by farm households, 2010/11 Percent of farm households using Province Draught Animals Four-wheeled Tractors Two-wheeled Tractors Phongsaly Luangnamtha Oudomxay Bokeo Luangprabang Huaphanh Xayabury Vientiane Cap Xiengkhuang Vientiane Pr Borikhamxay Khammuane Savannakhet Saravane Sekong Champasack Attapeu Total Farm labour and labour markets The LCA 2010/11 reported that a majority of the farm households also offer their labour services for various farm-related activities. In this section we discuss some important aspects of the rural labour markets across provinces. The farm population in Lao PDR increased by about 11 percent, from 4.06 million during 1998/99 to 4.5 million during 2010/11. During this period the employed farm population in the age group 15 years and older, grew by 27 percent, such that the proportion of economically 54
76 active rural population rose from 48 percent to almost 56 percent. This growth was accompanied by a gender balancing in the farm labour market, so that the share of economically active males and females was equalized across the country. Although the total farm population increased, an increase in off-farm activities led to an increase in the proportion of farm households employing outside farm labour. The emergence of a rural labour market in Lao PDR was one of the major changes that occurred during this period, as the proportion of farm households employing outside labour increased from 26 percent to 45 percent. Households in the Northern region used more hired labour (58%), compared with 43 percent in the Central region and only 25 percent in the Southern region. However, only 35 percent of the farm households paid cash wages for using outside labour in the Northern region, in contrast to 78 percent in the Central region and 72 percent in the Southern region. The payment of wages in kind or by exchange of farm labour in the Northern provinces may be attributable to the absence of income generation options among the rural households, as a larger share of the land area in the Northern provinces falls in the uplands (63%) and has inferior road connectivity (see Table 4.4 in chapter 2). The Lao Expenditure and Consumption Survey (LECS) 2002/03 reported, for example, that only 6 percent of households generated cash income in the Northern province of Phongsaly, compared with 70 percent in Vientiane in the Central region, 66 percent in Sekong and 58 percent in Champasack in the South. It was common for household members who were working mainly off-farm to contribute labour during peak planting and harvesting periods. However, alternative employment opportunities in rural areas have increased since 1998/99, with many people reporting having secondary jobs. For instance, the proportion of the age group over 15 years reporting a secondary job increased from 24 percent in 1998/99 to 40 percent in 2010/11. The census data also suggest considerable use of child labour. The population engaged in farming activities was defined in the LCA 2010/11 as those aged 10 years and above. About percent of the population in the age group of years was involved in farm and other farm-related activities and about percent of this group was reported to be usually employed. Exchange of labour among the farm households was very high (82%) in the Northern region, compared to 35 percent in the Central region and 24 percent in the Southern region. Payment of wages in kind (i.e. with farm produce) was less than 10 percent in all provinces, with minor variations (10% in the Southern region, 8% in the Central provinces, 8% and lower in the Northern region). The majority of the households reportedly face labour shortages for transplanting/sowing operations during June and July and for harvesting during October and November in all three regions

77 The contribution of females to various rice farming operations in farm and related activities is shown in Figure 4.9. While women household members participate in all the rice farming operations, they are particularly active in transplanting, weeding and harvesting, threshing, seedbed preparation and transportation of farm inputs and farm produce. A detailed review of the extent of female participation in rice farming operations across the provinces is presented in Appendix 4.6. Figure 4.9: Female contributions to rice farming activities, 2010/11 Transportation Threshing Harvesting Irrigation Pest control South Central North Fertilizer application Weeding Transplanting Preparation of seedbeds Land preparation Female farm population (%) Note: The figures are for females aged 15 years and above in farm households. There is significant participation in farming activity by young children (10-14 years) in eight provinces: Sarvane (47%), Savannakhet (46%), Attapeu (45%), Khammuane (44%), Luangnamtha (41%), Xiengkhuang (40%), Bokeo (37%), and Phongsaly (36%). In four provinces (Oudomxay, Xayabury, Borikhamxay and Sekong), more girls of this age were involved in farm activities such as transplanting, fertilizer application, pest control, harvesting, threshing and transportation (Appendix 8). Even in the relatively well-developed province of Vientiane Capital, girls aged participated in fertilizer application (54%), pest control (70%) and irrigation (58%). As shown in Figure 4.10, the duration of work in farming-related activities varied, with percent working for three to six months during the year and another percent working for six to nine months, as reported in the LCA 2010/11. A higher proportion (18%) worked for over 9 months in the Northern region, compared with about 9 percent in the Southern and Central regions. 56

78 Many rural people were engaged in livestock rearing along with working on the farm, though around half spent less than an hour per day on livestock (Figure 4.10). A detailed assessment of the activity of the farm population across the provinces is presented in Appendix 7. To summarize, although the agriculture sector has witnessed a major change in terms of emergence of a rural labour market over time, opportunities for wage employment are still lacking, especially in the Northern provinces. More importantly, the substantial involvement of child labour (10-14 year age group) particularly girls in the farming activities (Appendix 8) indicates a need to consider the impact of such activities on their educational opportunities. Figure 4.10: Distribution of farm population based on activity in farming and livestock, 2010/ North Central South Total 60.0 Farm population (%) < 3 months 3-6 months 6-9 months > 9 months < 1 hr/ day 1-4 hrs/day > 5 hrs/day Work on farm Work on livestock Use of farm credit and access to farm information The use of credit for various farming operations as well as for sourcing agricultural and farmrelated information is becoming more important, particularly with the increasing use of purchased inputs and the commercialization of farming. The LCA 2010/11 incorporated the question whether the household had (any) debt existing at the time of the enumeration. It defined agricultural credit as any type of loan received by farm households for purposes related to crop, livestock or aquaculture production activities. This includes credit for purchasing crop and livestock inputs, constructing farm buildings and purchasing farm machinery. Data from the LCA 2010/11 show that credit use was still very limited in Lao PDR; only about 13 percent of farm households reported using credit for various farming operations. This proportion was slightly higher in the Northern region (17%) compared with the Central and Southern regions (about 11% each). Around 55 percent of farm households using credit obtained 57
79 it from public banks, with a higher proportion (74%) in the Southern region using bank credit, compared with around 50 percent in the Northern and Central provinces. Another major source of credit was the Village Development Fund (VDF), which provided credit to around 40 percent of farm households using credit; fewer farmers in the Southern provinces (21%) utilized it compared with those in the Central (47%) and Northern (42%) provinces. Microfinance institutions were utilized by less than 4 percent of farm households using credit. About half the farm households nationally used credit for buying farm inputs, such as fertilizer, pesticides and fuel, and for purchase of livestock (30% of households), livestock inputs (16% of households) and farm equipment (13% of households). While the purchase of farm inputs was the major purpose of credit use in the Central (62%) and Southern (64%) provinces, the majority of the households (41%) in the Northern provinces sought credit for purchase of livestock/cattle. As seen in Table 4.12, use of credit was relatively higher among the larger farmers. Larger farms generally used public banks, while smaller farmers depended more on VDF. Table 4.12: Distribution, by landholding size class, of farm households obtaining agricultural credit from major sources, 2010/11 Holding size (ha) No. of farm HHs ('000) HHs with credit (%) Public bank Percentage of farm households obtaining credit from Foreign Private Micro bank domestic bank finance VDF Others No land na 5.4 na Below up to up to up to up to Above Total Note: The figures represent percentages of households obtaining credit from multiple sources and thus exceed 100% in some cases. With respect to accessing farming-related information, farm households reported multiple sources. The most common sources of information reported were television (52% of all farm households) followed by radio (43%). Other sources of information included public announcements (34%), input suppliers (23%), extension agents (18%) and newspapers (8%). A large number of farm households (55%) also reported sourcing farming-related information from neighbouring farmers. While the pattern of sourcing information remained similar across the provinces, farm households in the Northern provinces reported a higher dependence on input markets as information sources (34%) compared with Southern (20%) and Central (16%) provinces. 58

80 Agricultural performance: the crop sector This section will discuss the changes observed between the two censuses in the context of the broader developments in the crop sector, drawing on national data sources and other studies. The comparison of information between the two censuses reveals some important shifts in agriculture in Lao PDR over the decade, such as increased adoption of permanent crops, use of fertilizers (chemical and organic), increased adoption of two-wheeled tractors, etc. A major change reported was the shift from subsistence-dominated farming to commercial crops in many provinces, while continuing with rice cultivation. While there was variation in the degree of commercial crop adoption across provinces and farms, this period marks a country-wide change from the traditional, primarily subsistence-oriented, farming. This change becomes quite apparent in the expansion of permanent commercial crops, such as rubber, which is being promoted by provincial governments using various models of plantation investment: (a) land concession model; (b) contract farming model; (c) smallholder model; and (d) farmer collective model (Hicks, et al., 2009). This shift towards more market-oriented farming was also reflected in the increase in the number of farm households producing crops primarily for sale, which increased from around 6 percent of farms in 1998/99 to almost 30 percent of farm households at the national level (and to as high as 37% in the Northern region) (see Figure 4.11). Figure 4.11: Farm households reporting production mainly for sale, 1998/99 and 2010/ / / Farm households (%) Phongsaly Luangnamtha Oudomxay Bokeo Luangprabang Huaphanh Xayabury Vientiane Cap. Xiengkhuang Vientiane Pr. Borikhamxay Khammuane Savannakhet Saravane Sekong Champasack Attapeu Lao PDR Similarly, while in 1998/99 only about 35 percent of farm households reported the sale of some portion of their agricultural output in the market, in 2010/11 this proportion had doubled; almost 59
81 71 percent of farm households reported that they sell some portion of the output in the market (79% in the North, 72% in the South and 63% in the Central region). The remainder of this section will offer an overview of trends in agriculture in Lao PDR over the past decade, also drawing on data available from official publications, such as the Agricultural Statistics Year Book (2008 & 2011) of the Ministry of Agriculture and Forestry (MAF), Government of Lao PDR. Crop production in Lao PDR is dominated by a few major crops: rice, coffee, maize and sugar cane. These four crops together contributed almost 40 percent of the total value of agricultural output during 2011 (Table 4.13). However, cultivation of several new cash crops, such as tea, soybean, rubber, fruits and vegetables, has been expanding in recent years, although their contribution to output has yet to reach its full potential. Extensive cash crop cultivation in the highlands is a relatively new phenomenon, having begun in 2005, when the government opened the domestic agricultural market and allowed foreign traders to contract independently with farmers for specific agricultural commodities. Government statistics indicate that crop areas devoted to corn, cassava, Job s tears, banana and sugar cane increased by 88 percent in the past five years alone, rising from approximately ha in 2005 to ha in 2010 (USDA, 2011). The remainder of this section focuses on the performance of the crop production sector, with particular reference to the major crops rice, maize, coffee, tea and rubber as the livestock, fishery and forestry sub-sectors are discussed in chapters 4 and 5. Rice Sector Rice production in Lao PDR takes place in three distinct environments: (a) lowland rainfed areas; (b) lowland irrigated (dry season) areas; and (c) upland rainfed areas. Upland rainfed paddy is often considered part of a continuum with upland slash and burn agriculture. In official parlance, these three types of paddy production systems are designated as: (a) lowland rice; (b) irrigated rice; and (c) upland rice. The long-term trends in area and production of rice from the three major rice-growing environments in Lao PDR are presented in Table The data in Table 4.14 reveal that there was significant growth in irrigated rice area, particularly during the last decade. These figures also indicate that, while rice production from upland areas has contracted alongside contractions in rice-growing area, irrigated rice production has been on the rise, and currently contributes about 18 percent of the total rice production in the country. reported from the three major rice-growing environments are presented in Figure Figure 4.13 shows the trends in productivity across rice-growing environments during the last decade. These trends indicate that, by and large, productivity levels differed across the three riceproducing environments, with irrigated yields being much higher than yields in the uplands and lowlands. 60
82 Table 4.13: Contributions from crop production sector towards Lao Agricultural GDP, 2008/09 to 2010/11 (at constant 2002 prices) Agriculture and other sub-sectors Gross value added (Billion Kip$) Percentage share (%) 2008/ / / / / /11 A. Cereal crops (a) Lowland rainfed paddy (b) Dry season paddy (c) Upland rainfed paddy (d) Maize (e) Starchy roots (f) Vegetable & other beans B. Industrial crops (a) Soybean (b) Mung bean (c) Peanut (d) Tobacco (e) Cotton (f) Sugar cane (g) Coffee (h) Tea (i) Fruit Total crop production sector Total Livestock, Fishery & Forestry Grand total Note: The average exchange rate between US dollar and Lao Kip was: 8752 LAK/1 US$ (2008/09); 8516 LAK/ US$ (2009/10) and 8269 LAK/1 US$ (2010/11). Source: Ministry of Agriculture and Forests, 2011 (concerned department websites) Table 4.14: Trends in rice area and production in Lao PDR by type of land, 1976 to 2011 Year Rice harvested area ( 000 ha) Rice production ( 000 tonnes) Lowland Irrigated Upland Total area Lowland Irrigated Upland Total production (60.6) 3 (0.5) 204 (38.9) 525 (100.0) 455 (68.9) 3 (0.5) 202 (30.6) 661 (100.0) (58.3) 8 (1.1) 297 (40.6) 732 (100.0) 704 (66.9) 12 (1.1) 337 (32.0) 1053 (100.0) (57.7) 10 (1.5) 270 (40.8) 663 (100.0) 1023 (73.3) 27 (1.9) 346 (24.8) 1395 (100.0) (60.3) 12 (1.9) 246 (37.8) 650 (100.0) 1081 (72.5) 40 (2.7) 370 (24.8) 1491 (100.0) (65.6) 13 (2.4) 179 (32.0) 560 (100.0) 1072 (75.6) 51 (3.6) 296 (20.9) 1419 (100.0) (66.1) 92 (12.8) 152 (21.1) 719 (100.0) 1552 (70.5) 390 (17.7) 260 (11.8) 2202 (100.0) (77.4) 61 (8.3) 105 (14.3) 736 (100.0) 2083 (81.1) 272 (10.6) 216 (8.4) 2571 (100.0) (73.6) 107 (12.5) 119 (13.9) 854 (100.0) 2331 (75.9) 513 (16.7) 227 (7.4) 3071 (100.0) (73.2) 112 (13.7) 107 (13.1) 817 (100.0) 2324 (75.8) 540 (17.6) 202 (6.6) 3066 (100.0) Source: Ministry of Agriculture and Forestry, Lao PDR
83 Moreover, rice productivity in the upland areas has been almost stagnant, at around tonnes per ha over the past decade. The productivity of irrigated rice has grown consistently over the years, especially since 2005, achieving an average yield in the range of 4.4 to 4.8 tonnes per ha. The improvements in productivity reported from the irrigated rice-growing areas and the lowlands have been mainly the result of increased use of improved rice seeds. The LCA 2010/11 data confirmed this point, showing an improved rice seed adoption rate of 66 percent in the Southern provinces and 51 percent in the Central provinces; the Northern provinces lag behind, with only 17 percent adoption of improved rice seeds. Figure 4.12: Long-term trends in rice productivity in Lao PDR by growing environment Lowland Irrigated Upland Lao PDR Rice yield (tonnes/ha) Source: Ministry of Agriculture and Forestry, Lao PDR. However, despite achieving self-sufficiency in food production at the national level, concerns have been raised about food security at regional levels. For instance, the recent Rice Policy Study by FAO, et al. (2012) observes that rice shortages as a cause of food insecurity are becoming an increasingly localized phenomenon. Food security measured strictly as access to rice is no longer a major problem in an aggregate (national) sense, but remains a local problem, particularly in the upland areas. The study further notes that a broader focus on food security will require addressing issues related to nutritional deficits, rather than simply overcoming shortages of rice per se. From the perspective of long-term food security, it has been observed that the country needs to strengthen its rice production sector through: (a) facilitating trade; (b) enlarging rice seed and 62
84 Figure 4.13: Trends in rice productivity in Lao PDR by growing environment, Rice yield (tons/ ha) Lowland Irrigated Upland Source: Ministry of Agriculture and Forestry, Lao PDR. food reserves; (c) improving the efficiency and effectiveness of public investments; and (d) strengthening the rice seed sector (FAO et al., 2012). Public investment for development and expansion of irrigation potential will be crucial, given that approximately 86 percent of the total rice area is non-irrigated, grown mainly in the rainfed lowlands (73%) and the uplands (13%). Rice production in the country has been highly volatile due to the frequent occurrence of droughts and floods along the lowlands of the Mekong River basin (USDA, 2011; FAO et al., 2012). In the context of food insecurity, addressing the risks posed by natural hazards is a major challenge facing the rice sector in Lao PDR. A study by Schiller et al. (2006), based on a review of the occurrence of natural hazards (floods and droughts) in Lao PDR during the period from 1966 to 2002, revealed that, in every year, at least part of the country was affected by either drought or flood, or a combination of both. More importantly, these events and their effects are usually regional. For instance, the Central and Southern regions where most rice is cultivated were reported to have suffered the most impact from droughts and/or floods; over the 37-year period of the study, 32 years included droughts and/or floods that affected the Central region and 22 years included extreme weather events affecting the Southern region. Performance of maize In Lao PDR, maize has exhibited great success over the past decade, with consistent growth in area and productivity, though production levels have tended to stagnate during the past 4-5 years. The trends in area, production and productivity of maize over the past decade are presented in Figure
85 Figure 4.14: Trends in area, production and yield of maize in Lao PDR, Area Production Yield Area ('000 ha) Production ('000 tonnes)/ yield (kg/ha) Source: Ministry of Agriculture and Forestry, Agricultural Statistics Year Book (various issues). Performance of coffee and tea Coffee and tea are beverage crops grown in Lao PDR that have great potential in both the domestic and export markets. While coffee, including organic coffee, is already a major export earner for the country (Philaphone, 2011), the case of tea deserves attention as well. Promoting tea as a beverage crop in the domestic sector could assist farm livelihoods through employment and income generation. Cultivation of tea has also been proposed as an alternative to shifting cultivation practices in the mountainous regions (Yoshida and Hemmavanh, 2010). The latest trends in area, production and productivity of coffee and tea in Lao PDR are presented in Table These trends indicate an increase in area and production of both crops, with a consistent rise in coffee productivity. Tea productivity showed more fluctuation during the reporting period, which may be attributable to the varying agro-ecological conditions under which tea is grown and to the harvesting practices, as well as the health of the tea plants. More importantly, improving the performance of these two crops will depend upon better farm management strategies, as well as more conducive environmental conditions, as these crops are known to be highly sensitive to variability in climatic and weather conditions. Emergence of rubber plantations Rubber is a relatively new crop for Lao PDR and the national government has shown an increasing interest in promoting rubber plantations through investments from outside the country. Though rubber was introduced into Lao PDR as early as the 1930s, the development of rubber 64
86 Figure 4.15: Trends in area, production and productivity of coffee and tea in Lao PDR, Year Harvested area ( 000 ha) Coffee Production ( 000 tonnes) Yield (kg/ha) Harvested area (ha) Tea Production (tonnes) Yield (kg/ha) Source: Ministry of Agriculture and Forestry, Agricultural Statistics Year Book, 2008 and 2011 plantations on a commercial scale has received serious attention only since the 1990s. The high prices and income potential for rubber have sparked great interest in developing plantations in the country. As reported above, most provinces have started growing rubber and many provinces have included rubber development for implementation in their provincial development plans (Thanthathep, et al., 2008). From around mid 2000s, many foreign companies have invested in rubber plantations in Lao PDR. Chinese companies predominate in the Northern region, while the Central region is dominated by Thai investors and the South by the Vietnamese. Rubber is considered to be an alternative to opium cultivation, a means to reduce the slash and burn system of shifting cultivation and a potential contributor to poverty alleviation at the national level. It is also expected to become one of the main exports of Lao PDR once the rubber plantations start yielding output (Baird, 2010) and rubber-based manufacturing industries develop in the country that can take advantage of the domestic rubber production. The area planted with rubber in Lao PDR is not known with precision. According to the approvals of land concessions for rubber development by foreign investors in Lao PDR, rubber is reported to account for almost 61 percent of total forestry land deals, which cover a total plantation area of ha, with an average plantation of 609 ha (Schönweger, et al., 2012: 27). The extent of rubber plantation area reported in the LCA 2010/11 was ha, but with only ha of that area (7%) actually producing rubber. At the same time, it is reported that the country has the potential for developing ha of rubber plantations across the provinces (NAFRI 2005 as cited in Manivong, 2007). However, given the relatively small area planted with rubber and the even smaller area actually producing it, there is little information currently available on the potential economic returns to smallholder producers that could be used as a basis for the government to promote the crop. 65
87 A study on the economics of smallholder rubber production in Northern Lao PDR by Manivong and Cramb (2008) has shown that, given the current market conditions and subsidized credit support with low interest rates, investment in smallholder rubber production in the uplands of Northern Lao PDR could be profitable. Rubber can be considered an alternative for poor upland farmers, in line with the government policy of stabilizing shifting cultivation and supporting new livelihood options in poverty reduction. It is also reported that rubber offers better options for the poor smallholders in Lao PDR, as the monthly reported income of a rubber grower is USD 210, compared with the current monthly income for farmers of about USD 140 (Thanthathep, et al., 2008). However, the prospects for rubber development in Lao PDR depend on addressing several structural issues and production-related problems, such as: (a) concerns over loss of common property resources (including forests), loss of forests, loss of livestock and loss of farmlands; (b) insufficient availability of skilled labour for rubber-tapping and processing; (c) need for development of rubber processing and manufacturing facilities; (d) lack of standardization of rubber processing; and (e) land titling and property rights issues. Conclusions The LCA 2010/11 showed that important changes have taken place in land use and crop cultivation practices in Lao PDR since the LCA 1998/99. The most striking change has been a significant shift from subsistence-dominated agriculture to commercial agriculture. An increase in mechanized farming operations, particularly in land preparation and rice threshing, with increased adoption of two-wheeled tractors and mechanical threshers, is another significant change. In the rice sector, which still dominates farming activity in Lao PDR, total output has continued to increase. With increased adoption of modern cultivation technologies and inputs, productivity has continued to improve, although at a slow pace, for irrigated rice, which offsets the impact of lower productivity in lowland and upland rice. However, there is still considerable potential to increase adoption of modern technologies and farming practices in the rice sector, particularly if irrigation is extended to new areas. The most remarkable change has been the dynamic expansion of commercial crops such as coffee, maize, soybean and sugar cane. These crops have brought new and modernizing influences into the agricultural sector. Rubber, for example, has brought in substantial foreign investment, and some of these commercial crops are being produced under contract and using organic farming systems with quite encouraging outcomes (Philaphone, 2011; Setboonsarng, et al., 2008). However, the expansion of these crops also raises important institutional and policy challenges, such as those related to environmental concerns and land titling and property rights issues. Overall, the changes highlighted by the LCA2010/11 suggest that the prospects for improved agricultural performance in Lao PDR are quite bright and that the agriculture sector has the potential to build further on improvements already taking place in the farm production systems and move forward on a dynamic path of growth. 66
88 Chapter 4 appendices Appendix 4.1: Distribution of farm landholdings and area by size class and province, 2010/11 Province Distribution of number of landholdings (%) Farm HHs Distribution of area of holdings (%) Above Below ha 2-3 ha Above 3 ha ('000) Below ha 2-3 ha 3 ha Total area ('000 ha) Phongsaly Luangnamtha Oudomxay Bokeo Luangprabang Huaphanh Xayabury Vientiane Cap Xiengkhuang Vientiane Pr Borikhamxay Khammuane Savannakhet Saravane Sekong Champasack Attapeu Total Appendix 4.2: Agricultural land use in the provinces of Lao PDR, 2010/11 Province Total area of holdings ( 000 ha) Total agri. land ( 000 ha) Cropping intensity (%) Share of crops (%) Temporary Permanent Fallow land (% share) Grazing land % share Forest & other woods (%) Phongsaly Luangnamtha Oudomxay Bokeo Luangprabang Huaphanh Xayabury Vientiane Cap Xiengkhuang Vientiane Pr Borikhamxay Khammuane Savannakhet Saravane Sekong Champasack Attapeu Total Other lands (%) 67
89 Appendix 4.3: Major permanent crops grown in Lao PDR, number of growers and area planted, 2010/11 No. of crops No. of Area Avg. crop area/ grower Three major crops No. of Area (%) of 3 major crops by Crop groups reported growers covered (ha) growers covered Growers Area Citrus crops Orange, Mandarin, Lemon Pome & stone fruits Plum, Peach, Pear Banana, Mango, Tropical fruits Pineapple Other fruits Coconut, Gooseberry, Strawberry Nut crops Passion fruit, Hazelnut, Cashew Beverage crops Coffee, Tea, Cocoa Cardamom, Ginger, Spice crops Pepper Natural rubber Natural rubber Fibre crops Kapok Other Lemon grass, Areca permanent crops (betel nut), Oil palm Total Total Appendix 4.4: Status of irrigation development across rice-cultivated areas by type of land and rice seed used, 2010/11 Percentage of rice Total agri. Total rice- Percentage irrigated area out of irrigated in case of land ('000 planted area Total Rice Total Wet Total Dry Local Improved ha) ('000 ha) Total land Province area rice area rice area seeds seeds Phongsaly Luangnamtha Oudomxay Bokeo Luangprabang Huaphanh Xayabury Vientiane Cap Xiengkhuang Vientiane Pr Borikhamxay Khammuane Savannakhet Saravane Sekong Champasack Attapeu Total Note: The figures are percentage shares out of the total land area reported for total land, total rice area, total wet rice area and total dry rice area. In case of rice seeds, the figures indicate the irrigated percentage of local seeds and improved seeds. These figures, when subtracted from 100, will indicate the share of non-irrigated areas in each case. 68
90 Appendix 4.5: Use of farm machinery and farm equipment by farm households across provinces, 2010/11 Percentage of farm households using Draught Fourwheelewheeled Two- Trucks Generator Water Rice Rice animals/ pumps thresher miller Province buffaloes tractor tractor Phongsaly Luangnamtha Oudomxay na Bokeo Luangprabang Huaphanh na Xayabury Vientiane Capital Xiengkhuang Vientiane Pr Borikhamxay Khammuane Savannakhet Saravane Sekong Champasack Attapeu Total
91 Appendix 4.6: Extent of female work participation in rice-farming activities, 2010/11 (%) Province Land preparation Preparing seedbed Weeding Fertilizing Pest control Irrigation Harvesting Threshing Transplanting Transportation Farm HHs work on rice holdings ('000) Phongsaly Luangnamtha No. of employed persons ( 000) Oudomxay Bokeo Luangprabang Huaphanh Xayabury Vientiane Cap Xiengkhuang Vientiane Pr Borikhamxay Khammuane Savannakhet Saravane Sekong Champasack Attapeu Total
92 Appendix 4.7: Distribution of family labour in various farming activities, 2010/11 Province Work on the family farms ( 000) Percentage distribution of farm family workers devoting time to crop activities < 3 months 3-6 months 6-9 months > 9 months Percentage distribution of farm family workers devoting time to livestock: hours/day 1-4 < 1 hour hours > 5 hours Phongsaly Luangnamtha Oudomxay Bokeo Luangprabang Huaphanh Xayabury Vientiane Cap Xiengkhuang Vientiane Pr Borikhamxay Khammuane Savannakhet Saravane Sekong Champasack Attapeu Total Note: The table shows the distribution of farm population aged 15 years and over engaged in farming activities in family farm holdings and livestock activities during 2010/11 71
93 Appendix 4.8: Female farm population aged years working on rice holdings, by type of work done and province, 2010/11 Province Land preparation Preparing seedbeds Transpla nting Weeding Fertili zing Pest control Irrigation Harvesting Threshing Transporta tion Phongsaly Luangnamtha Oudomxay Bokeo Luangprabang Huaphanh Xayabury Vientiane Cap Xiengkhuang Vientiane Pr Borikhamxay Khammuane Savannakhet Saravane Sekong Champasack Attapeu Total
94 Chapter 5 Livestock and poultry production In the Lao PDR, livestock production is an important sector of the economy, and improving livestock productivity has been recognized as one of the most important national goals to foster sustainable growth of the economy and reduce rural poverty and food insecurity (Khounsy and Conlan, 2008; Nampanya et al., 2010). It was reported that the livestock sector, together with fisheries, contributes up to 16 percent of the nation's gross domestic product (GDP) (Wilson, 2007), providing up to 50 percent of annual household cash income (ADB, 2005). Despite its importance, this economic sector is still underdeveloped. The majority of livestock products are produced by smallholder farmers (Wilson, 2007). Many rural households with livestock are currently best considered to be livestock keepers rather than livestock producers, using their livestock as cash reserves and for ceremonial needs (Millar and Phoutakhoun, 2008; Wilson, 2007). The transformation of livestock keepers into more specialized producers requires improved farmer knowledge and practices in livestock husbandry and disease prevention, as well as the formation of farmer groups for marketing of animal products, which can lead to improvements in productivity, increased smallholder household incomes and reduced rural poverty (Windsor, 2011). However, providing effective interventions requires a better understanding of current livestock production, in order to manage the many health and husbandry constraints that compromise smallholder livestock productivity (Nampanya et al., 2010; Windsor et al., 2008).This thematic report discusses the current livestock production scenario in Lao PDR using the LCA 2010/11 data, and identifies trends associated with livestock productivity and socio-economic progress in the region by comparing them with the earlier LCA 1998/99 and other relevant information. Overview of meat consumption and production in Lao PDR and neighbouring countries Unlike the green revolution in cereal grains in the 1970s, which was driven by supply shortages, the livestock revolution has been stimulated by increasing demand for animal products, particularly in Asia (Delgado et al., 1999), where economic growth has continued at a remarkable pace and is geographically widespread (WB, 2012). Based on figures from Delgado (2003) and FAO (2012), it can be estimated that, between 1997 and 2009, total meat consumption in China increased from 43 kg to 58 kg per capita per year and in Southeast Asia from 18 kg to 26 kg per capita per year. Consumption has been projected to grow at around 3.1 percent and 3.0 percent per annum, to reach 73 kg and 30 kg per capita per year, respectively, by In Lao PDR, total meat consumption was approximately 21 kg per capita per year in 2009, with an annual growth rate forecast of 5.2 percent (FAO, 2012). Increasing demand for meat in both domestic and neighbouring markets (i.e. China and Viet Nam) enhanced by the development of a regional road network throughout the Greater Mekong sub-region, or GMS (ADB, 2005) offers a market opportunity for Lao livestock farmers to increase their incomes by improving livestock productivity, and thus also contributing to rural poverty alleviation, and to improved regional food security in the GMS. Between 2005 and 2009, total meat production per capita increased steadily in Lao PDR and its neighbouring countries, with the exception of Thailand (Table 5.1, Appendices 5.1 and 73 73
95 5.2). Meat production in Lao PDR increased from 17 kg to 21 kg per capita per year between 2005 and The Ministry of Agriculture and Forestry's Strategy for Agricultural Development 2011 to 2020, which aimed at sustainable development, food and income security, emphasized the need for achieving a 5 percent annual growth of meat production to increasing total meat supply to kg per capita per year (Ministry of Agriculture and Forestry, 2010). Achieving this goal is a challenge; it requires a holistic and multipleintervention approach towards animal health, production and market linkages that will support smallholder livestock farmers to improve productivity and market access (Nampanya et al., 2013a; Windsor, 2011). An increase in productivity will have limited success if farmer linkages to markets are not simultaneously enhanced (Arias et al., 2013). The introduction of appropriate multiple interventions can stimulate livestock farmers to improve productivity and move from the current low input and output system to medium-sized, market-oriented livestock production. Table 5.1: Meat production in Lao PDR and its neighbouring countries, (kg per capita per year) Countries/ meat types Years % change per annum* Bovine meat Cambodia Pig meat Poultry meat Total Bovine meat China Pig meat Poultry meat Total Bovine meat Lao PDR Pig meat Poultry meat Total Bovine meat Myanmar Pig meat Poultry meat Total Bovine meat Thailand Pig meat Poultry meat Total Bovine meat Viet Nam Pig meat Poultry meat Total * Simple annual average growth rate. Source: FAO, (2013), FAOSTAT ( accessed 15 July 2013) Current livestock and poultry production in Lao PDR Farm households with livestock and poultry The number of farm households with cattle and goats increased by 43 percent and 69 percent, respectively, between 1999 and 2011 whereas the number of households with buffaloes and 74 74
96 pigs contracted by 30 percent and 6 percent, respectively, in the same period (Appendix 5.3, details in chapter 2). The number of farm households with chickens, both local and commercial, remained relatively unchanged over this time. Of the total farm households reported in the LCA 2010/11, (38%) kept cattle and (6%) kept goats (Figure 5.1). The increase in farm households with cattle and/or goats was more prominent in the central region. Further, a significant reduction in farm households with buffaloes was observed in both Northern and Central provinces, particularly in Laungnamtha, Xayabury (Northern province), as well as in the Vientiane Capital (Central province). Figure 5.1: Number of farm households with livestock and poultry by regions 800 No farm households ('000) North Central South Total 0 Total Farm households Farm households with cattle Farm households with buffaloes Farm households with pigs Farm households with goats Farm households with local chickens Trends in the numbers of cattle and buffaloes Cattle Between 1999 and 2011, the total number of cattle increased by 68 percent (4.4% per annum) from to (Table 5.2, Appendices and 5.3.2). In 2011, farm households with cattle had an average of 5.3 cattle, with 58 percent of these households having a herd size of four or fewer. Of the total cattle, 60 percent were located in the central region, where cattle numbers in Savannakhet province alone accounted for 20 percent of the national cattle herd. Buffaloes The number of buffaloes decreased by 22 percent (2.0% per annum) from to between 1999 and 2011 (Table 5.2, Appendices and 5.3.3). This reduction in buffalo stock was observed in every province, with the exception of Vientiane Province, where annual growth of 0.3 percent was observed. Farm households with buffaloes had an average of 3.4 buffaloes, with 78 percent of these households having a herd size of four or fewer. In the northern provinces of Luangnamtha and Oudomxay, the number of buffaloes reported in 75
97 the LCA 2010/11 was less than half the number reported in the LCA 1998/99. In the central province of Savannakhet, where almost 20 percent of the total buffalo herd is located, a 19 percent reduction in the buffalo population was observed between the two census periods. Table 5.2: Number of cattle and buffaloes in the LCA 2010/11 ('000) and their population change (%) between 1999 and 2011 by regions Region Cattle Population ('000) in 2010/11 % Change between 1998/99 and 2010/11 Growth per annum (%)* Buffaloes Population ('000) in 2010/11 % Change between 1998/99 and 2010/11 North Central South Total 1, *Based on compound growth rates Trends in the numbers of small livestock and poultry Pigs and goats Growth per annum (%)* The LCA 2010/11 indicated a 5.6 percent reduction in total number of pigs, from to between 1999 and 2011 (Table 5.3, Appendices and 5.3.4). The average number of pigs per farm household with pigs was 3.2, with 82 percent of these households having a herd size of four or fewer pigs. Despite the overall reduction in the pig numbers nationally, particularly in the Southern region, the number of pigs in the Central provinces of Vientiane Capital and Vientiane Province increased significantly (Appendix 5.3.4). In contrast, the number of goats increased very significantly by 128 percent, from to between 1999 and 2011, representing an annual growth rate of 7.1 percent (Table 5.3, Appendix 5.3.5). More than half of the goats are located in the central region, with more than goats (around 26% of the total national herd) located in Savannakhet Province (Appendix 5.3.5). Table 5.3: Number of pigs and goats in the LCA 2010/11 ('000) and their population change (%) between 1999 and 2011 by regions Pigs Goats Region Population ('000) in 2010/11 % Change between 1998/99 and 2010/11 Growth per annum (%)* Population ('000) in 2010/11 % Change between 1998/99 and 2010/11 Growth per annum (%)* North Central South Total *Based on compound growth rates 76
98 Poultry Between 1999 and 2011 the number of commercial chickens and ducks increased by 124 percent (6.9% per annum) and 32.5 percent (2.4% per annum), respectively (Table 5.4 and Appendices ), while the number of local chickens fell by 7.6 percent. The vast majority (almost 84%) of commercial chickens was reported in the central region, mostly in Vientiane Capital, where almost commercial broiler and layer chickens (around 72% of the total national flock) were located. This shows how commercial chicken rearing has expanded in response to increasing demand for chicken and eggs in the urban areas, particularly in Vientiane Capital and other cities. Table 5.4: Number of poultry by species in the LCA 2010/11 ('000) and their population change (%) between 1999 and 2011 by regions Region Local chickens Commercial chickens Ducks % Change % Change Growth Growth Population between Population between Populatio per per ('000) in 1998/99 ('000) in 1998/99 n ('000) in annum annum 2010/11 and 2010/11 and 2010/11 (%)* (%)* 2010/ /11 % Change between 1998/99 and 2010/11 Growth per annum (%)* North Central South Total *Based on compound growth rates Factors affecting numbers of buffaloes and cattle The reduction in the number of buffaloes and farm households with buffaloes between the two censuses may be attributable to several factors. Firstly, the trend of increased farm mechanization, leading to replacement of buffaloes kept for draught purposes, may have contributed to the sale of buffaloes and reduction in their numbers. Over 61 percent of all farm households reported using a two-wheeled tractor for ploughing purposes, as indicated in the LCA 2010/11 (details in chapter 3). Increased mechanization for draught was particularly evident in the provinces along the Mekong, namely Xayabury, Vientiane Capital, Vientiane, Borikhamxay, Khammuane, Savannakhet, Saravane and Champasack. However, some farmers in the provinces of Huaphanh and Xiengkhoung still use buffaloes for draught, in combination with hand tractors. But the more important motives for keeping buffaloes are as a means of wealth accumulation and,because of low soil fertility in these provinces, to provide manure for rice cultivation(millar and Phoutakoun, 2008; Stür et al., 2002). Secondly, the reduction in the availability of common grassland, and the establishment and expansion of cash crop plantations (rubber, maize, banana, sugar cane, cassava), particularly in the northern provinces of Luangnamtha, Bokeo, Oudomxay, Xayabury, and recently in the central provinces of Borikhamxay and Savannakhet, may have had a negative effect on buffalo numbers in those provinces (for details see chapter 2). The LCA 2010/11 indicated that 79 percent of farm households with livestock are reliant on natural pasture and 51 percent rely on rice straw for their large ruminant feed source (Appendix 3.9). Some cattle and buffalo smallholders may have chosen to sell some of their livestock, rather than be fined 77
99 if their animals trespassed into other properties, because of reduced availability of grazing land and feed deficiency, particularly in the dry season. The increasing numbers of goats and cattle and a decrease in the number of buffaloes in Savannakhet Province and others may also reflect a more general shift in farm practices from holding buffaloes to holding goats, cattle and other smaller livestock in response to broader economic changes. Further studies will be useful to provide a better understanding of the correlation between the expansion of cash crops and the reduction in buffalo numbers, particularly in the provinces of Luangnamtha and Savannakhet. Thirdly, low reproductive performance could be another reason for the reduction in buffalo numbers and the potential expansion of the cattle herd. A recent study showed that buffaloes have lower calving rates (41-52 %) than cattle (51-75 %); they also have longer inter-calving intervals of months compared with months in the case of cattle (Nampanya et al., 2013a). Fourthly, outbreaks of endemic infectious diseases such as Foot and Mouth Disease (FMD) and Haemorrhagic Septicaemia (HS) are likely to be additional factors contributing to the low numbers of cattle and buffaloes, due to mortalities, morbidities and change in the herd structure (Rushton et al., 2002). Between the two census periods, a series of FMD outbreaks occurred in many provinces of Lao PDR (Khounsy et al., 2009; Nampanya et al., 2012; Perry et al., 2002; Rast et al., 2010). Although nutritional deficiency is a major factor affecting large ruminants, FMD infections also seriously decrease reproductive ability and slow down weight gain (Nampanya et al., 2013b; Rast et al., 2010; Rushton et al., 2002). Furthermore, an extreme cold exposure event in northern Lao PDR in March 2011 (the same time the LCA 2010/11 was conducted), which resulted in mortality of over cattle and buffaloes (Khounsy et al., 2011), may have had an impact on the numbers of cattle and buffaloes reported for this region in the LCA 2010/11. Fifthly, poor husbandry practices and reproductive management have led to low reproductive performance in both cattle and buffaloes (Nampanya et al., 2013a). Recommended standard reproductive management practices for large ruminants, such as sex segregation, castration of male calves not required for breeding, selective breeding of superior animals and other aspects of breeding management, are not practiced by smallholder farmers in Lao PDR. The LCA 2010/11 showed a high ratio (1:2.5) of male to female cattle and buffaloes (Appendix 5) with adverse effects on the productivity as well the quality of the herd. This conclusion is supported by previous studies in the region (Nampanya et al., 2013a; Stür et al., 2002; Wilson, 2007). Improving cattle and buffalo breeding and husbandry practices in Lao PDR remains a significant challenge and will require appropriate interventions to improve animal health care, nutrition and farmers knowledge of livestock husbandry and production (Nampanya et al., 2010). Further, the increase in market demand for beef and buffalo meat, both domestically and in neighbouring markets, is probably outpacing current production growth, resulting in a surge in the prices of beef and buffalo meat. For instance, the price of beef and buffalo meat in Vientiane Capital increased by almost 67 percent, from Lao Kip (LAK) to LAK per kg, between April 2010 and April 2013 (Lao News Agency, 2013). The increasing 78
100 prices for red meat and higher sales values of large ruminants, due to increasing demand in both domestic and neighbouring markets, are likely to encourage many smallholder farmers to sell more of their stock than in the past, and they may be unable to replace their stock and maintain their livestock-holding numbers. It is also possible that the increasing prices for red meat if expected to continue could encourage large ruminant smallholders to improve their husbandry practices and build up herd sizes, leading to improvement in reproductive performance and higher numbers of cattle and buffaloes to satisfy the higher market demand. Vaccination and prevalence of endemic animal diseases Livestock vaccination rates increased sharply at the national level between 1999 and 2011: from 36 to 56 percent for cattle; from 48 to 60 percent for buffaloes; and from 8 to 18 percent for pigs. However, vaccination of cattle is less common in the northern region; only 38 percent of farmers reported vaccinating their cattle in the LCA 2010/11, compared with 63 and 62 percent in the southern and central regions, respectively (Table 5.5 and Appendix 5.6). This was also the case with buffalo vaccinations, where 75 percent of farm households with buffaloes in the southern region reported vaccinating in the LCA 2010/11, compared with only 44 percent in the northern region. According to the LCA 2010/11, these regional differences in vaccination rates were less pronounced for pigs and poultry. Across regions, between 18 and 20 percent of farm household vaccinated their pigs while between 8 and 13 percent of poultry-raising farm households vaccinated their poultry in 2011 (Table 5.5). Table 5.5: Vaccination rate (%) of the farm households with livestock by type of animals and region in the LCA 2010/11 Region Cattle Buffaloes Pigs Poultry North Centre South Total The prevalence of endemic diseases, which has a severe impact on the livelihood of livestock smallholders, is one of the main constraints to livestock development in Lao PDR (ADB, 2005; Nampanya et al., 2012; Stüret al., 2002). FMD and HS are the most important serious diseases of cattle and buffaloes; outbreaks have been recorded in many provinces of Lao PDR over the past ten years (Khounsy et al., 2009; Nampanya et al., 2012; Perry et al., 2002; Rast et al., 2010). An assessment of the financial impact of FMD on smallholder farmers in northern Lao PDR showed the cost of FMD per household to be as high as US$ 381 and US$ 1124 in the northern provinces of Xayaburi and Luangprabang, respectively, even when considering only the costs of treatment and losses due to mortality and morbidity (Nampanya et al., 2013b). If other indirect costs, such as the cost of additional feed needed to recover the weight lost during infection, future production losses due to change in herd structure caused by infertility, and opportunity costs of lost trade are included, the financial losses to large ruminant smallholders that are attributable to FMD are likely to be even higher (Rast et al., 2010; Rushton et al., 2002). 79
101 Though the LCA 2010/11 shows the emergence of medium-sized piggeries, particularly in the central provinces including Vientiane Capital and Vientiane Province, a successful transition from smallholder farms to medium-sized commercial farms producing for the market will depend on improved feed management, given the limited supply of feed grain, and on the control of important diseases (Stüret al., 2002). Classical Swine Fever is recognized as one of a number of serious pig diseases, causing severe impacts on small to medium-sized pig farms (Khounsy and Conlan, 2008; Stüret al., 2002). Other viral diseases, such as FMD, and the recent emergence of the highly pathogenic Porcine Reproductive and Respiratory Syndrome (commonly known as blue ear disease) in Vientiane Capital and Vientiane Province are also significant, and could potentially have a major impact on future pig production and development in Lao PDR (Jianqianget al., 2012; B. Khambounheung, 2013, personal communication). High mortality rates (between 20 and 40%) of piglets in smallholder farms, resulting from lack of good hygienic practices and poor feed management, have also been reported (Chittapong et al., 2013; Phengsavanh et al., 2011). For poultry, fowl Cholera, Newcastle disease and the Highly Pathogenic Avian Influenza have been identified as important serious diseases that need to be controlled (Stüret al., 2002; Van Kerkhove et al., 2012). Further, limited farmer knowledge of animal health care, nutrition and management, as well as limited capacity of veterinary services, have been observed (Nampanya et al., 2010; Stüret al., 2002; Windsor et al., 2008). Therefore, improving livestock production, leading to reduction of rural poverty, depends on the ability to control the risks of these diseases and the enhancement of veterinary and extension services to improve farmer knowledge and livestock husbandry practices. Although no information is given about the vaccines used, the low vaccination rates indicated in the LCA 2010/11 reflect the low availability of vaccines and veterinary services in Lao PDR where, according to the LCA 2010/11, only 2 percent of rural villages have a veterinary clinic (see chapter 5). However, occurrence of diseases is not only an indication of low vaccination coverage but, perhaps even more significantly, a reflection of poor biosecurity practices (P. Windsor, 2013, personal communication). The concept of biosecurity refers to all the hygienic practices designed to reduce the risk of infectious diseases occurring within or being introduced into a herd or a country; it includes practices designed to control the spread of infectious agents within a herd (Larson, 2008). The development of a basic biosecurity plan for smallholder livestock farmers in Lao PDR should focus on herd management (Nampanya et al., 2010). In addition to vaccination interventions when available, biosecurity practices of quarantine, rapid disease recognition, isolation of sick animals and reporting of disease, as well as attention to transmission risks and proper disposal of infected materials, should be promoted as essential elements of disease control programmes. Implementation of village-level biosecurity should be adopted, together with productivity improvement interventions, such as vaccination programs and programs to improve farmer knowledge followed by nutritional management and parasite control (Nampanya et al., 2011; Windsor, 2011). Livestock market information According to the LCA 2010/11, farm households (29% of all farm households) indicated their main reason for raising livestock was for sale, and farm households 80
102 (41%) sold some livestock products in 2011 (details in chapter 3). Currently, meat weight of large ruminants is estimated by visual estimation, which is subject to human error and trader bias (Machila et al., 2008; Nampanya et al., 2010). Large ruminant smallholders, who generally sell old or sick animals when they need substantial sums of money for special or emergency events, have little bargaining power as traders can set a low price, particularly for sick and old animals, knowing that farmers are anxious to sell in order to obtain money and cut their losses (Rweyemamu et al., 2008). Farmers are also constrained by their geographic, social and economic in seeking reliable information on marketing conditions(chadwick et al., 2008). This imbalance of bargaining power between livestock traders and farmers reduces the incentives for smallholders to improve product quality (Nampanya et al., 2010). Though good information on livestock markets is needed to formulate policies for improving marketing systems and livestock productivity of smallholder farmers, there is only very limited information available on livestock markets in Lao PDR. It is strongly recommended that further research is conducted on livestock markets and supply chains, that can also obtain quality assurance and production data (e.g. mature weight and carcass percentage for local cattle and buffaloes). Roles of livestock development, gender and ethnic equality and human nutrition Information obtained in the LCA 2010/11 shows that women and ethnic minority groups play a large part in pig and poultry production. Both males and females aged 15 and over are almost equally engaged in livestock activities; 32 percent of males and 27 percent of females spent more than one hour per day on livestock activities (details in chapter 3). This is consistent with other evidence that women and children provide significant labour inputs as the primary caretakers of households' pigs and poultry (Chittapong et al., 2013; Phengsavanh et al., 2011). On average, a Hmong household had 4 chickens and 19 pigs while Mon-Khmer households had 3 chickens and 14 pigs (Appendix 7). The importance of women and ethnic minority groups in chicken and pig production shows that they should be priority targets for programs aimed at improving small animal productivity. Interventions to improve farmer knowledge and practices in small animal production and disease prevention can help to achieve two important objectives: to improve pig and poultry production in rural areas; and to support a reduction in gender inequality and vulnerability among the ethnic groups. Although some key information on gender, access to credit and farm management by women (details in chapter 6) is available, the role of womenin livestock development, particularly he role of women from ethnic minority groups, may be considered a topic for further investigation. It is difficult to determine specific linkages between development of livestock and improvement in human nutrition. However, improvements in livestock productivity on small farms can increase the supply of meat for household consumption, thereby providing much needed micronutrients and dense calories as well as higher incomes from selling to expanding markets (Delgado, 2003). A recent survey on risk and vulnerability among households in Lao PDR showed that 28 percent of children between the ages of 48 and 59 months were underweight and 51 percent of the children in this age group were stunted in growth. This was true despite the fact that 54 percent of households reported consuming poultry and 52 81
103 percent reported consuming pork at least one day per week (MAF, 2013). The link between livestock development, particularly small livestock such as pigs and poultry, and rural farm household nutrition is an important area for further investigation. Improvement of farmer knowledge, attitude and practice (KAP) on animal health and production Although the majority of livestock owners are smallholders, the LCA 2010/11 showed that a very small proportion of farms are significantly larger: 3 percent and 1 percent of farm households with cattle and pigs have herd sizes of more than 20 cattle or 20 pigs, respectively, and 7 percent of households with local chickens have a flock size of more than 50 birds. The emergence of such medium-sized livestock and poultry producers indicates the business and market potential of livestock development. To facilitate the transition of livestock keepers to more market-oriented producers requires improved farmer KAP in livestock husbandry and disease prevention, in addition to the formation of farmer groups for animal products, in order to improve productivity. Public and private investments, along with livestock research and human resource development, can play significant roles in assisting livestock farmers in this transitional period for improving livestock productivity (Windsor, 2011). Studies in southern Cambodia have demonstrated that improved farmer KAP on animal health and production requires multiple learning opportunities, including applied field research and disease awareness through posters and public awareness, in addition to formal training and farmer schooling programmes (Nampanya et al., 2011). This learning process takes time and requires ongoing support and close collaboration with research and development programmes to improve extension capacity, animal movement control, surveillance, vaccination programmes and public awareness (Windsor, 2011). To enhance the contribution of livestock to smallholder household income, Lao PDR should adopt a multiple-intervention approach toward animal health and disease risk management through regular vaccination programmes and improved biosecurity knowledge, husbandry practices and animal nutrition, as well as measures to improve market linkages, all of which will help smallholder livestock farmers to improve productivity and market access (Nampanya et al., 2011; Windsor, 2011). The improvement in livestock productivity will offer opportunities for smallholders to further develop into small to medium-sized livestock enterprises, thereby alleviating rural poverty and enhancing food security in Lao PDR. 82
104 Chapter 5 appendices Appendix 5.1: Meat production in Lao PDR and its neighbouring countries, ('000 tonnes) Countries/meat types Years % change per annum* Bovine meat Cambodia Pig meat Poultry meat Total Bovine meat China Pig meat Poultry meat Total Bovine meat Lao PDR Pig meat Poultry meat Total Bovine meat Myanmar Pig meat Poultry meat Total Bovine meat Thailand Pig meat Poultry meat Total Bovine meat Viet Nam Pig meat Poultry meat Total * Simple annual average growth rate. Source: FAO (2013) FAOSTAT ( Accessed: 15 July 2013) Appendix 5.2: Meat consumption in Lao PDR and its neighbouring countries in 2009 (kg/capita/year) Kg per Capita per year Bovine meat Pig meat Poultry meat
105 Appendix 5.3: Number of farm households with livestock/poultry and number of animals in Lao PDR, 1998/99 and 2010/11 census Appendix Number of farm households with livestock/poultry and number of animals by type in Lao PDR, between the LCA 1998/99 and 2010/11 No. HH with livestock/poultry ('000) No. of livestock/poultry ('000) Species % Growth per % Growth per 1998/ / / /11 Change annum (%)* Change annum (%)* Cattle Buffaloes Pigs Goats Local chickens C. chickens Ducks C. chickens = commercial chickens *Based on compound growth rates Appendix 5.3.2: Number of cattle ('000) and % change between the LCA 1998/99 and 2010/11 by region and province Region/province LCA Comparison 1998/ /11 Difference % Change Growth per annum (%)* North Phongsaly Luangnamtha Oudomxay Bokeo Luangprabang Huaphanh Xayabury Centre Vientiane Capital Xiengkhuang Vientiane Province Borikhamxay Khammuane Savannakhet South Saravane Sekong Champasack Attapeu Total *Based on compound growth rates 84 84
106 Appendix 5.3.3: Number of buffaloes ('000) and % change between the LCA 1998/99 and 2010/11 by region and province Region/province LCA Comparison 1998/ /11 Difference % Change Growth per annum (%)* North Phongsaly Luangnamtha Oudomxay Bokeo Luangprabang Huaphanh Xayabury Centre Vientiane Capital Xiengkhuang Vientiane Province Borikhamxay Khammuane Savannakhet South Saravane Sekong Champasack Attapeu Total *Based on compound growth rates Appendix 5.3.4: Number of pigs ('000) and % change between the LCA 1998/99 and 2010/11 by region and province Region/province LCA Comparison 1998/ /11 Difference % Change Growth per annum (%)* North Phongsaly Luangnamtha Oudomxay Bokeo Luangprabang Huaphanh Xayabury Centre Vientiane Capital Xiengkhuang Vientiane Province Borikhamxay Khammuane Savannakhet South Saravane Sekong Champasack Attapeu Total *Based on compound growth rates 85
107 Appendix 5.3.5: Number of goats ('000) and % change between the LCA 1998/99 and 2010/11 by region and province Region/province LCA Comparison 1998/ /11 Difference % Change Growth per annum (%)* North Phongsaly Luangnamtha Oudomxay Bokeo Luangprabang Huaphanh Xayabury Centre Vientiane Capital Xiengkhuang Vientiane Province Borikhamxay Khammuane Savannakhet South Saravane Sekong Champasack Attapeu Total *Based on compound growth rates Appendix 5.3.6: Number of local chickens ('000) and % change between the LCA 1998/99 and 2010/11 by region and province Region/province LCA Comparison 1998/ /11 Difference % Change Growth per annum (%)* North Phongsaly Luangnamtha Oudomxay Bokeo Luangprabang Huaphanh Xayabury Centre Vientiane Capital Xiengkhuang Vientiane Province Borikhamxay Khammuane Savannakhet South Saravane Sekong Champasack Attapeu Total *Based on compound growth rates 86
108 Appendix 5.3.7: Number of commercial chickens ('000) and % change between the LCA 1998/99 and 2010/11 by region and province Region/province LCA Comparison 1998/ /11 Difference % Change Growth per annum (%)* North Phongsaly 5.8 Luangnamtha Oudomxay Bokeo Luangprabang Huaphanh Xayabury Centre Vientiane Capital Xiengkhuang Vientiane Province Borikhamxay Khammuane Savannakhet South Saravane Sekong Champasack Attapeu Total *Based on compound growth rates Appendix 5.3.8: Number of ducks ('000) and % change between the LCA 1998/99 and 2010/11 by region and province Region/province LCA Comparison 1998/ /11 Difference % Change Growth per annum (%)* North Phongsaly Luangnamtha Oudomxay Bokeo Luangprabang Huaphanh Xayabury Centre Vientiane Capital Xiengkhuang Vientiane Province Borikhamxay Khammuane Savannakhet South Saravane Sekong Champasack Attapeu Total *Based on compound growth rates 87 87
109 Appendix 5.3.9: Farm households with livestock by type of feed (%) in the LCA 2010/11 by region and province Region/province No. of farm household with livestock ('000) Type of feed Natural pasture Improved pasture Other fodder crop Rice straw Processed feed North Phongsaly Luangnamtha Oudomxay Bokeo Luangprabang Huaphanh Xayabury Centre Vientiane Capital Xiengkhuang Vientiane Province Borikhamxay Khammuane Savannakhet South Saravane Sekong Champasack Attapeu Total Root crop Appendix 5.4: % Farm households with livestock and local chickens, herd sizes in the LCA 2010/11 by region Appendix 5.4.1: % Farm households with cattle, herd size by region Region % farm households with cattle < 5 head 5-9 head >10 head Mean North Central South Total Appendix 5.4.2: % Farm households with buffaloes, herd size by region Region % farm households with buffaloes < 5 head 5-9 head >10 head Mean North Central South Total
110 Appendix 5.4.3: % Farm households with pigs, herd size by region Region % farm households with pigs < 5 head 5-9 head >10 head Mean North Central South Total Appendix 5.4.4: % Farm households with goats, herd size by region Region % farm households with goats < 5 head 5-9 head >10 head Mean North Central South Total Appendix 5.4.5: % Farm households with local chickens, flock size by region Region % farm households with local chickens 10 < head head head >50 head Mean North Central South Total Appendix 5.5: Sex distribution of cattle, buffaloes, pigs and goats (%) in the LCA 2010/11 by region Region Cattle (%) Buffaloes (%) Pigs (%) Goats (%) Male Female Male Female Male Female Male Female North Central South Total
111 Appendix 5.6: Vaccination rate (% of farm households with livestock) by type of animal, region and province in the LCA 2010/11 Region/province Vaccination rate (%) Cattle Buffaloes Pigs Poultry North 38% 44% 18% 8% Phongsaly 18% 24% 17% 8% Luangnamtha 44% 35% 20% 10% Oudomxay 27% 34% 16% 5% Bokeo 40% 48% 21% 11% Luangprabang 34% 50% 18% 10% Huaphanh 27% 42% 8% 5% Xayabury 62% 65% 27% 11% Centre 62% 62% 20% 13% Vientiane Capital 79% 81% 49% 20% Xiengkhuang 54% 58% 13% 10% Vientiane Province 50% 54% 18% 12% Borikhamxay 62% 58% 35% 13% Khammuane 70% 71% 29% 20% Savannakhet 63% 61% 16% 10% South 63% 75% 19% 10% Saravane 62% 68% 17% 6% Sekong 40% 37% 14% 17% Champasack 69% 87% 21% 11% Attapeu 61% 63% 24% 16% Total 56% 60% 18% 10% Appendix 5.7: Characteristics of farm households by ethnic group of household head in the LCA 2010/11 Parameter Total Ethnic Group Lao Tai Mon- Khmer Hmong- Lewmien Other No. of farm households ('000) % Farm households with livestock and poultry Cattle 38% 39% 31% 61% 31% Buffaloes 29% 29% 30% 26% 27% Pigs 39% 28% 55% 63% 30% Local chickens 62% 60% 64% 78% 52% Average number of livestock/poultry per holding Cattle Buffaloes Pigs Local chickens Main source of income (% of farm households) Cropping 53% 54% 52% 53% 53% Livestock 7% 6% 7% 17% 9% Aquaculture and fisheries 1% 1% - - 1% Forestry 5% 2% 13% 7% 7% Other 34% 38% 28% 24% 31% Use of two-wheeled tractor (% of farm households) 61% 77% 34% 40% 48% 90 90
112 Chapter 6 Forestry, aquaculture and fisheries This chapter documents and analyses developments in two important natural resource-related subsectors of the Lao PDR economy, the forestry subsector and the aquatic and fisheries subsector, based on the information gathered in the Lao Census of Agriculture (LCA) 2010/11. It also draws on the LCA 1998/99 as a baseline to assess developments during the intervening decade and to examine the dependence of farm households on the forestry and fishery subsectors. The official data published by the Departments of Forestry, Livestock and Fisheries are also used to provide an overview of the status of forestry as well as aquaculture and fishery resources at the national level and to discuss the major issues and challenges affecting these subsectors as they emerge from the analysis. The report is organized into three sections. The first section provides an overview of the trends and current status of the forestry and aquaculture and fishery subsectors in Lao PDR. The next section provides a detailed analysis of the LCA 2010/11 with respect to the household dependence on these two subsectors and offers comparisons across regions/ provinces and with the first round of LCA 1998/99. The final section summarizes the main findings and outlines the major issues and challenges affecting the forestry and fishery subsectors. Forestry and aquaculture and fishery subsectors: Trends and current status The forestry and aquaculture and fishery subsectors occupy prominent positions in Lao PDR for the provision of food security, livelihood support, poverty eradication, and economic, social and cultural grounding for over 80 percent of the population (NAFRI 2008; MAF, 2010). Together, the two subsectors directly accounted for about 18 percent of the total agricultural gross domestic product (GDP) in the country in 2010/11. At the national level, the relative contribution from the forestry and fishery subsectors hovered at around 7-9 percent of the country s GDP during the previous decade (MAF, 2011). The relative share of the forestry subsector accounts for slightly more than 5 percent of GDP; however, its significance is much larger as wood-processing industries contribute 12 percent of the manufacturing value added in the country and about 35 percent of national export earnings (MONRE, 2012). The value of output from the forestry and fishery subsectors grew at a rate of 5-6 percent per annum between 2000/01 and 2010/11. In absolute terms, the contributions of these two subsectors to the national wealth have been increasing and, as per the most recent estimates, earnings from fishery activities increased by more than 18 percent, from million Kip (constant 2002 prices) in 2008/09 to million Kip in 2010/11. The corresponding increase in the case of the forestry subsector was close to 40 percent, with an increase in income from 29 million Kip to 40 million Kip, during the same period (MAF, 2011).The forestry subsector alone is able to supply products worth USD 31.4 million domestically, and exports worth USD 74.4 million (MOPI, 2011). The two subsectors are also important from the perspective of biodiversity Though less well-known than in its neighbours, China, Thailand and Viet Nam, Lao PDR contains rich biodiversity in both flora and fauna. Reportedly, there are an estimated species of flowering 91 91
113 Changing forest landscape and its importance Lao PDR has a rich endowment of forests but there has been substantial loss of forest cover over the past several decades due to a number of factors: fire, unsustainable wood extraction, shifting cultivation, agricultural expansion, industrial tree plantations, mining, hydropower, infrastructure development and urban expansion (WREA, 2010; Moore et al., 2011). The total forest area in the country reportedly declined from approximately 17 million hectares (ha) (70% of total area) in the 1940s to 11.6 million ha (47% of total area) in 1982, and further to 9.6 million ha (40.3% of total area) in 2010 (Fujita, 2011; Meeserli, et al., 2008; UNEP, 2012) (Figure 6.1). Figure 6.1: Changes in forest cover in Lao PDR, Forest area (Mill. Ha) Million ha Forest area (%) % % % 47.2% % 40.3% Source: UNEP (2012) Lao Environmental Outlook Forest area (%) There are significant variations in deforestation rates across the country (e.g. FAO, 2010; Sophathilath, 2010; Moore et al., 2011) with most deforestation reported from the Northern upland areas of the country, where much of the land is mountainous and shifting cultivation is the common farming system. Further, the proportion of dense forests declined from 29 percent in 1992 to 8.2 percent in 2005, with degraded open forests increasing from 16 percent to 24.5 percent of the total forest area (DoF, 2005; FAO, 2009). Simultaneously, forest fragmentation has become a significant issue. For instance, while forest areas of 10 ha or fewer represented only 0.9% percent of the total forest area in 1992, their share increased to 6.7 percent in 2005 (MAF, 2005). However, the area under forest plantations has increased during the last several years, as shown in Table 6.1. This increase reflects the shift in approach towards forest conservation over the past two decades. This shift is supported by policies and programmes on forest categorization and demarcation, law enforcement and governance, sustainable forest management, and forest regeneration and reforestation. The country has developed the plants. Approximately one-third of the plants in the Indo-Chinese bio-geographic sub-region are endemic to this sub-region, which includes most of Lao PDR (MacKinnon and MacKinnon, 1986, as cited in MAF, 2003)
114 National Forestry Strategy 2020, along with several legislative initiatives related to the environment and to natural resources management. One of the key strategies proposed is to increase the forest cover in Lao PDR to 70 percent of the total land area by (MONRE, 2012). Table 6.1: Trends in forest-planted area in Lao PDR, Year Forest-planted area ( 000 ha) North Central South Lao PDR (85%) (21%) (8%) (76%) (97%) (89%) (5%) (95%) (97%) (95%) (6%) (96%) (87%) (73%) (7%) (82%) Note: Figures in parentheses indicate the share of reforested area in the total forest area. Source: Agricultural Statistics Year Book 2008 & 2011, Ministry of Agriculture and Forestry. Forest plantations are increasingly encouraged as a measure to reduce pressure on natural forests as well as to augment local wood availability and meet processing capacity requirements. In addition, plantations of bioenergy products, such as Jatropha spp., as well as valuable trees, such as Aquilaria spp., rubber (Hevea braisiliensis), agarwood (Aquilaria spp.), teak (Tectona grandis) and Eucalyptus spp., are also being promoted by involving local and foreign investors and encouraging farmers to convert their fallow lands into such plantations (Tong, 2009). Recently, the Government of Lao PDR has also developed a strategy and programme for Reducing Emissions from Deforestation and forest Degradation (REDD+) to avoid the unnecessary loss of forests and to increase carbon storage. The objective in this regard is to scale up REDD+ activities through participatory sustainable forest management (PSFM) in priority areas and to pilot forest landscape management, primarily in the four Northern provinces in Lao PDR, i.e. Xayabury, Luang Namtha, Oudomxay and Bokeo (MONRE, 2012). Non-timber forest products Farm households in the Lao PDR depend to a large extent on non-timber or non-wood forest products for their livelihoods. 19 It is reported that an overwhelming majority of the villages 18 The major targets set by the Forestry Strategy 2020 are to: (i) raise forest cover to 70% of total land area, by naturally regenerating up to 6 million ha and planting up to ha of trees in un-stocked forest areas; (ii) provide a sustainable flow of forest products for domestic consumption and export; (iii) preserve the many species and unique habitats; and (iv) conserve the environment. Many important steps have been taken towards achieving these targets, such as the establishment of National Protected Areas (NPAs) and Production Forest Areas (PFAs), along with increasing the area under forest certification (MAF, 2005). 19 The literature on household dependence on NTFPs in Lao PDR is extensive (Fisher, et al., 1996; Clendon, 2001; Morris et al, 2004; Ingles et al., 2006; Foppes and Samontri, 2010) and points out that NTFPs not only provide important sources of subsistence (foods, medicines, etc.) for many rural households (especially poor 93 93
115 have access to village/community forests, which mainly include village protection forests (along water sources, river banks and roadsides), village conservation forests (spirit and cemetery forests) and village production/use forests. The village use forests are mainly used for timber harvesting for village infrastructure construction and household use, including collection of non-timber forest products (NTFP) for own consumption and sale, as per the approved management plans and village regulations (Chokkalingam, 2010). It is reported that, on average, a rural family in Lao PDR consumes NTFPs worth USD 280 per year, which is significant given that the per capita GDP of Lao PDR was about USD 880 in Charcoal and fuel-wood remain the dominant source of energy in Lao PDR, even in the cities (IUCN, 2010). The major NTFPs that are commonly extracted include: (a) food products, such as game and other wildlife, fish and other aquatic animals, fruits, greens, tubers, mushrooms, bamboo shoots and honey; (b) fibre and bark products, such as khem grass and paper mulberry bark; (c) condiments and medicinal products, such as cardamom and malva nuts; and (d) inputs for the chemical and perfume industries, such as benzoin, peuakmeuak, resins and oleoresins, and lamxay (MAF, 2003). Several studies on NTFPs conducted in the late 1990s and early 2000s also reported that food gathered from the wild provided important aspects of dietary diversity in terms of both macro- and micronutrients. However, as a result of shifting patterns of agriculture, land tenure and access to land, the share of food foraged and gathered from the wild declined from 36.6 percent to 25.9 percent during this period (Foppes, et al., 2011). A large number of medicinal plants (mostly trees, climbers and herbs) that are also reportedly collected by households are widely used in the production of traditional and modern medicines. As a result of the indiscriminate harvesting of these products, conservation of medicinal plants in the country has been severely constrained by the lack of awareness about the potential of these plants. Some plants and herbs are still to be defined in terms of their medicinal properties and economic value, as well as their status as plants which may be endangered or threatened with extinction (MAF, 2003). Along with the increasing awareness about the importance of conserving NTFPs, there have been significant efforts to improve the stock of village/community forests in the country. The recent trends in seed collection and planting of saplings during the period between 2006 and 2011 show that, on average, about 116 tonnes of seeds are collected per annum and about 72 million saplings are planted as part of the ongoing reforestation programme, which is likely to have a positive impact on sustaining the NTFP base in the country (MOPI, 2011). Household dependence on forestry and fishery subsectors: Evidence from LCA 2010/11 Household dependence on forestry The LCA considered forest land to include natural and planted timber tracts having value as wood, timber, other forest products, or for protection. Two types of forestry data were ones), but also offer key sources of cash, from items such as broom grass, resin, honey, etc., that are sold to traders in high volumes at particular times of year. Another study estimated NTFPs in one province to be worth an average of USD 313 per household per year (Emerton, 2005)
116 collected in the census: (a) forest land that forms part of the land owned or operated by the household; and (b) public forest land exploited by the household. Forest land owned by the household may be economically exploited or preserved for environmental or other purposes. On average only about 12 percent of farm households owned forest land, an increase from 8 percent in 1998/99, with growth being fastest in the Northern region (Table 6.2). Table 6.2: Details of forest lands owned by farm households, 1998/99 and 2010/11 Households/area Census period North Central South Lao PDR No. of farm HHs ('000) 1998/ / / Farm HHs with forest 2010/11 holdings ('000) (%) increase per annum Area of forest in holdings ('000 ha) Share of HHs with forest holdings (%) Average size of forest land in holdings (ha) 1998/ / (%) increase per annum / / / / Overall, this increase in forest-planted area as recorded by the LAC 2010/11 is consistent with the changes in forest area reported at the national level (Table 6.1), with all three regions showing a substantial increase in household access to forest lands at both household and village levels. With a sizeable increase in forest land area brought under the care of farm households, the average size of forest area per farm increased from 0.99 ha in 1998/99 to 1.3 ha in 2010/11. Among the provinces, the increase in the number of farm households with forest holdings was highest in Phongsaly, Attapeu, Huaphanh, Borikhamxay, Xayabury, Vientiane Province and Khammuane (Appendix 6.2). The increase in forest area within these holdings has been more or less uniform across provinces, and the average size of forest holdings has been greater than 1 ha in most of the Central and Southern provinces. Use of public forests Farm households reported a high level of dependence on public forests for the collection and use of various products, including for sale. For instance, at the national level, 69 percent of all farm households accessed public forests in 2010/11, with relatively more doing so in the North (Table 6.3). The main forest products were fuelwood (with almost all households accessing public forests for fuelwood), fruit and vegetables, mushrooms and bamboo. The proportion of households selling various products accessed from public forests was 38 percent at the national level, with a higher proportion in the Northern provinces (45%). It was observed that more upland farm households exploited public forests in 2010/11, compared 95
117 with those in lowland areas. There were some differences among the various size groups of households with respect to the use of public forests for sourcing different products, both for their own consumption and for sale. Farm households that owned at least 0.5 ha of land used public forests more than either the landless or those with very small (<0.5 ha) holdings (Table 6.3). The reasons for this are not clear and require further investigation. Table 6.3: Use of public forests by households of different landholding sizes, 2010/11 (% of farm households) Land class (ha) Use of public forests Timber Fuelwood Bamboo Mushroom Fruits & vegetables Sale products No land Below to to to to Above Lao PDR Household utilization of public forests also showed some differences across different types of villages depending on their locations (Table 6.4). Table 6.4: Household use of public forests by types of villages and geographical locations, 2010/11 (% of farm households) Villages Use of public forests Timber Fuelwood Bamboo Mushroom Fruits & vegetables Sale products Urban Rural with road Rural with no road Lowland Upland Plateau Mixed Lao PDR As would be expected, farm households located in the urban villages generally reported low utilization of public forests (54%) compared to those in rural villages, and most of them used such forests to meet their consumption requirements rather than to gather products for sale. Farms in the lowlands also reported somewhat lower utilization of public forests. Use of own forest holdings The data from LAC 2010/11 revealed that, at the national level, only a small minority (12%) of the farm households own forest holdings. About 58 percent of those households that own 96
118 forest holdings use them to grow various products for family consumption (or use) as well as for sale in the market. In the Central provinces, this share was almost 71 percent compared with that in the North (50%) and South (47%). In most cases, farm households use their own forest holdings for multiple purposes. The major use of the forest holdings is for fuelwood (90%). Collection of bamboo and timber from these holdings has been reported by 44 percent and 14 percent of farm households, respectively. Use of the forest plots for growing mushrooms was the next most common activity (64%), followed by fruit and vegetable production (50%). Almost 42 percent of these households reported selling various products from their farm forest holdings. Table 6.5 shows the household use of farm forest holdings, by region, for growing various crops and products. Table 6.5: Utilization of products from own forest holdings, 2010/11 North Central South Lao PDR Farm households using products from own forest holdings (% of those owning forests) Farm households using own forest holdings for extracting or growing (%) Timber Fuelwood Bamboo Mushrooms Fruits & vegetables Sale of products For most of the products listed, the pattern of use of own forest holdings seems to be quite similar across provinces, with a few exceptions in cases of collection of timber, mushrooms and sale of products, as shown Appendix 6.3. Aquaculture and fishery subsectors The aquaculture and fishery subsector forms an integral aspect of livelihoods in Lao PDR. Traditionally, many villagers rely on gathering, fishing and hunting in forests to acquire food as regular sources of protein and fat (WFP, 2007).While NTFPs acted as food reserves during years of poor agricultural harvest in many places, forest foods, as well as wild fish and other aquatic animals, supplemented rice that formed the primary part of the diet (Foppes, 2008). Rivers, including the Mekong 20 and its tributaries, reservoirs, water bodies, ponds, weirs and other natural and constructed wetlands, which together account for about 4 percent of the land area of the country, act as major sources of fish catch for the people in Lao PDR Fish species diversity in the Mekong River basin was estimated at species. Although comparisons of biodiversity between regions and ecosystems depend greatly on the criteria used, it is worth noting that the fish species diversity of the Mekong, per unit area of catchments, is roughly three times that found in the Amazon River basin (MAF, 2003). 21 The inland fishery of the lower Mekong River basin is the largest in the world, with a value of USD 2 billion per year. The people of Lao PDR consume approximately 40 kg per capita of fish each year and it also accounts for a significant portion of household income (WWF, 2009). For instance, in Southern Lao PDR, over 80% of households participate in fisheries, accounting for around 20% of the income of households (MAF/WREA, 2010:34)
119 (DLF, 2001). These wetlands support a large fishery subsector and provide a wide range of fish and other aquatic animals that are harvested for household consumption and trade. With the exception of a small number of externally introduced fish used for aquaculture, a major part (more than 70%) all of the fish production in the country is from indigenous species (MAF/WREA, 2010). However, as a result of unscientific fishing practices, as well as various pressures exerted on the inland water bodies, including the Mekong River basin, it is reported that there has been significant decline in fish production in Lao PDR. About 500 indigenous fish species are reported to live in the Mekong and its tributaries in Lao PDR (Kottelat, 1989), but of these 500 species, nine are already threatened (MAF/WREA, 2010). Fish production is highly sensitive to environmental and changing climatic conditions. It is reported that in Lao PDR, most fish ponds are seasonal and dry up during the six-month dry season. As the ponds dry up, water temperature becomes a major constraint adversely affecting the survival of the fish populations. On the other hand, monsoon rains cause flooding, which also leads to loss of fish in the water bodies. Contamination of household ponds and other water bodies downstream from disposal of toxic waste into the tributaries of Mekong River and the canal systems by upstream users is also reported to affect fish populations (Jensen, 2002). The latest data available at the provincial and national levels reveal that the production of culture fisheries (aquaculture) accounts for about percent of the total annual fish production in the country 22 (Figure 6.2). The production of capture fisheries has been almost stagnant, at thousand tonnes, while production of culture fisheries increased from tonnes (2007) to tonnes (2011). Given this trend in the production of capture fisheries (stagnant at tonnes as reported in 2011), it appears that the production of capture fisheries declined by more than half from its 2000 level ( tonnes) as reported above. The stock of capture fisheries has apparently already hit sustainability constraints, as also reported in an earlier study (WB 2006, as cited in NAFRI, 2008: 20). 22 An earlier study reveals that almost 33% of the total fish production has been from rainfed and irrigated rice fields, followed by the Mekong River and its 14 tributaries (25%) and fish ponds (14%). Among the other sources, irrigation canals and small reservoirs contributed about 7%, followed by large reservoirs (5%) and swamps and wetlands (4%) [ICEM, 2003]
120 Figure 6.2: Trends in fish production by type, Fish production ('000 tonnes) Capture fish Culture fish Source: Ministry of Agriculture and Forestry, Lao PDR The latest status of fish production across the provinces is presented in Appendix 6.1. Almost 75 percent of the production of culture fisheries in the country originates from eight provinces, with the highest contribution from Vientiane Capital (19%), followed by Champasack (12.6%), Savannakhet (10.4%) and Oudomxay (7.6%). It may be relevant to look at the current status of per capita production of fish in Lao PDR, especially given that the national government has set a target to increase the annual supply of fishery products from the current levels of kg per capita to kg by A simple estimate of fish availability per capita can be derived based on the reported annual fish production and the mid-year population at the national level. The per capita availability of fish at the national level was about 20 kg in 2011, with significant variation across provinces. For instance, the per capita fish production was about 29 kg per annum in the Central region, compared with 16 kg in the Southern region and barely 10 kg in the Northern region. The three-year average of fish availability per capita as presented in Figure 6.3 indicates that in 10 of the 17 provinces, the per capita fish availability was below 20 kg per annum, with four provinces reporting the lowest availability, in the range of 6-11 kg per capita per annum. These provinces were Phongsaly (6.4 kg), Sarvane (9 kg), Luangprabang (10.2 kg) and Luangnamtha (10.7 kg). These figures demonstrate the need for a national effort to increase fish production and to promote efficient internal trade to improve nutrient levels and overall food security. 23 The production targets set by the Seventh Plan ( ) aim at achieving meat production of tonnes and aquatic production (fish, prawns and frogs) of tonnes, i.e., on average 53 kg per person per year, sufficient to meet the consumption needs. In urban areas, this target is approximately 63 kg per person per year, and in rural areas, 48 kg per person per year. This difference in food consumption between urban and rural areas is due to the reason indicated by the Ministry of Health that urban people s diet is well-balanced since they consume meat, fish and eggs as well as green leafy vegetables, while the diet in rural areas is generally poor, with limited intake of protein, fat and micronutrients, although often a high intake of vegetables. The share of livestock and fisheries in agricultural GDP is expected to rise to 42-45%. Fish, frogs, turtles, snails and other aquatic animals provide more than 50% of the animal protein consumed by the population in the Lao PDR and are of critical importance to national food security (MOPI, 2010)

121 Figure 6.3: Per capita fish availability across provinces in Lao PDR Per capita fish availability (Kg.) Phongsaly Luangnamtha Oudomxay Bokeo Luangprabang Houaphanh Xayaboury Vientiane Cap. Xiengkhouang Vientiane Pr. Borikhamxay Khammouane Savannakhet Saravane Sekong Champasack Attapeu Lao PDR Note: Figures are three year averages for the period Source: MOPI, Given that culture fish production is the dominant source of fish for the country, sustaining the production levels will require substantial investments for controlling the production environments and addressing the various risks arising from changing climatic conditions. More detailed empirical investigations are required to understand the impact of the changing climatic parameters on availability, status, species diversity and migration patterns, as well as the economic value (reflecting the scarcity factor) of fishery and aquatic animals in the country, based on a nationwide assessment. In this context, the data gathered in the two rounds of the LCA provide much important information at the farm household level. Household dependence on aquaculture and fisheries: Evidence from LCA Both rounds of LCA reported that almost 65 percent to70 percent of the households engage in aquaculture and fishing as part-time activities to add to household food security, as well as to supplement the household income and thereby ensure livelihood security. The number of farm households engaged in capture fishing increased by 13 percent between 1999 and 2011 (1% per annum), with the majority of the increase coming from the Northern provinces (Table 6.6). The period witnessed an increase of about 23 percent (1.7% per annum) in the number of aquaculture holdings and in the area under aquaculture at the national level, with much of the increase in area reported from the Central provinces. As a result of the increase in area brought under aquaculture activities, there was also a sizeable increase in the average size of aquaculture holdings, with Southern and Central provinces reporting the availability of relatively larger size of holdings than that reported in the Northern region
122 Table 6.6: Farm household data on capture fishing and aquaculture, 1998/99 & 2010/11 Holdings and areas Total number of farm households ( 000) No. of farm HHs with capture fishing ('000) No. of aquaculture holdings ('000) Area of aquaculture ('000 ha) Census period North Central South Lao PDR 1998/ / / (64.3) (73.0) (75.7) (69.6) 2010/ (64.8) (68.5) (69.0) (67.2) % change per annum / / % change per annum / / % change per annum / / Average size of aquaculture holding (ha) Note: Figures in parentheses are the percentage share of farm HHs with capture fishing in the total number of farm households during the two census periods. At the national level, there was a slight decline in the proportion of farm households engaged in capture fishing between the two periods, although the absolute numbers increased. While the proportion of farm households engaged in capture fishing has remained the same in the Northern provinces, the Southern and Central provinces showed a decline. The decline in those provinces may be an outcome of a combination of factors, such as: (a) the general decline in the fish stock (or fish productivity) in the surrounding inland water bodies, due to overfishing or depletion; and (b) the shift among the farm households towards either growing cash crops or other remunerative opportunities, including tourism (MRC, 2010b). The provincial-level data on farm households engaged in capture fishing and aquaculture activities during both rounds of the LCA is presented in Appendix 6.4. The number of farm households engaged in capture fishing declined in the provinces of Luangprabang, Vientiane Capital and Champasack. While an increase in area under aquaculture was reported from most of the provinces, the net addition in area was largely in the provinces of Xiengkhuang, Savannakhet, Sarvane and Phongsaly. Capture fishing is a major secondary activity of farm households; however, the share of farm households with their own aquaculture holdings was only about 9 percent at the national level, which suggests that the vast majority of households depend upon common water sources for capture fishing. The majority (around two thirds) of farm households undertake capture fishing and aquaculture mainly for their own consumption. Only about a third of farm households reported some sales of their aquacultural produce from common pool water sources. In the Northern region, the proportion of households selling some part of their aquaculture produce ranged between 16 percent (Phongsaly) and 33 percent (Oudomxay), while in the Central region, the proportion ranged between 29 percent (Savannakhet) and 47 percent (Vientiane Province). In the Southern region, the proportion ranged between 5 percent (Sekong) and 40 percent (Champasack). This variation across provinces may be due 101
123 to: (a) the relatively high household consumption requirements for aquacultural produce in relatively poor provinces such as Sekong and Phongsaly; and (b) the better opportunities for marketing of aquacultural produce in the relatively more developed provinces of Vientiane Province and Savannakhet. The LCA 2010/11 also revealed that, at the national level, about 78 percent of the farm households engaged in capture fisheries use the fish caught for their own consumption. In the Northern provinces, this proportion extends to 85 percent. In other words, only about 22 percent, on average, of all farm households sell some part of their captured fish in the markets. This proportion breaks down regionally to 28 percent in the South, 23 percent in the Central region and only 15 percent in the Northern region. Almost 90 percent of the aquaculture activities use ponds, with 14 percent of households practising rice-fish culture. 24 Very few households use other forms of aquaculture, such as tanks and cages, except in the Southern region, where 11 percent reported using tanks. The majority of farm households use multiple sources for catching fish (Table 6.7). Table 6.7: Source of capture fisheries, 2010/11 Land class (ha) HHs doing capture fishery (%) Sources of capture fisheries (%) River Reservoir/ lake Swamp Rice field Irrigation canal Village pond Other No land Below to to to to Above Lao PDR Landless and very small (<0.5 ha) farm households tend to be somewhat less involved in capture fishing, which is dominated by river and lake fishing. Over a third of capture fish are caught in rice fields (Appendix 6.5 gives detailed data for each province). Challenges facing the forestry and fishery subsectors From the foregoing it is clear that the forestry and fishery subsectors are important sources of livelihoods for the vast majority of rural households in Lao PDR. Historically, the majority of the rural households have practiced farming systems that have integrated agriculture, livestock, fisheries and forestry-related activities. Intensification of agriculture has been constrained by several factors as elaborated in the report on land use; hence farm households 24 Rice paddy fisheries and the collection of aquatic animals during the rainy season are important activities in the country and their harvests form an important part of the diet. Rice-fish culture is practised in several provinces and a variety of systems are used, according to the agro-climatic characteristics of the area. Since the farmers can produce their own seed fish, this activity is popular since cash is not required. Rice-fish culture is popular with farmers due to the integrated nature of the system (FAO, 2007). 102
124 have increasingly tended to overexploit forestry and fishery resources for their sustenance. This has contributed to the depletion and degradation of natural resources, particularly forests and fisheries. However, of late, national policies have been highly responsive in terms of strategies and action plans, especially for strengthening the forest resources of the country. It is evident from the data that farm household dependence on forestry and fishery has remained largely unchanged over time, although some regional variations are observed. Many farm households use public forests (as well as their own forest holdings, if they have them) to obtain and often sell a range of forestry products. Most farm households are also engaged in capture fishing while some undertake aquaculture activities. The importance of these natural resource-based activities in farming systems, and the consequent tendency to overexploit them, raises the need for sustainable management of these resources in order to achieve the broader goals and objectives of national development strategies. This would require implementation of appropriate policies, including the development of necessary institutions and regulatory measures, to ensure that forestry and fishery resources will not be subjected to further depletion and degradation. An important challenge facing the forestry and fishery subsectors in Lao PDR is how to cope with the potential threat from climate change, which is still poorly understood in the country. It may be noted that sustainability of resources, especially in the case of stock of fisheries, largely depends on the health of the rivers, wetlands, swamps, tanks, ponds and other water bodies that form the basis of aquaculture and fishery activities in Lao PDR. Since the water levels in these water bodies are replenished by rainfall, variability as well as changes in the pattern of rainfall might affect the status of water availability in them. Another major challenge that affects the stock of fisheries in the tributaries of the Mekong River is the blockade of fish migration routes caused by the dams constructed on the Mekong (MRC, 2010a). It is also reported that rivers in the region are facing potential pollution threats posed by: (a) the transport of dangerous goods and cargo by the major riparian countries i.e. Cambodia, Thailand and Viet Nam through the waters of the Mekong River basin; and (b) pollution caused by wastewater disposal and chemical contamination (MRC 2012). Clearly, it is crucial to improve water management practices around the local water bodies, including the river basins and open aquifers. The data that emerged from the LCA 2010/11 on the nature and importance of forests and fishery resources for the welfare of farm households highlight the need for improved information on the patterns and changes in the use of natural resources in the country. The LCA also provided information that could be used effectively to select regions, villages and farm households for more detailed investigations on the changing profiles of the forestry and fishery subsectors in the country. In the case of forests, better forest mapping, including satellite/gis mapping, can help to assess the impact of increased plantation forest development activities on forests and on village economies. This is also essential to ensure that the forest cover is well maintained so as to achieve the national goal of raising the forest cover to 70 percent by The agro- 103
125 forestry and monoculture plantation development programmes underway in the country regarding land concessions and leasing arrangements also require systematic investigation with respect to their impacts on poverty reduction and on the rehabilitation of shifting (as well as opium) cultivators. Similarly, the diverse aquatic resources of Lao PDR need more careful scrutiny in the current context, when some of the species are facing the threat of extinction. As observed elsewhere (MAF, 2003), the most extensive information on aquatic resources currently available in Lao PDR is related to fish, while the status of other aquatic resources, such as amphibians, reptiles, mollusks, crustaceans, and water insects has not been properly assessed, with the exception of one study in Luangprabang in 1999 (LARReC 2000). More detailed and current information on all these aspects would be essential to implement sustainable natural resource management. 104

126 Chapter 6 appendices Appendix 6.1: Status of fish production across provinces of Lao PDR, Total fish Culture fish Phongsaly Luangnamtha Oudomxay Bokeo Luangprabang Huaphanh Fish meat production ('000 tonnes) Xayabury Vient- Cap. Xiengkhuang Vient- Pro. Borikhamxay Khammuane Savannakhet Saravane Sekong Champasack Attapeu Note: Figures are average production for the period Source: Ministry of Agriculture and Forestry, Lao PDR. Appendix 6.2: Details of farm households with their own forest holdings, 1998/99 and 2010/11 No. of farm HHs ('000) HHs with forest lands (%) Area of forest lands on holdings ('000 ha) Average size of forest lands on holdings % change/ % change/ Province 1998/ / / /11 annum 1998/ /11 annum 1998/ /11 Phongsaly Luangnamtha Oudomxay Bokeo Luangprabang Huaphanh Xayabury Vientiane Cap Xiengkhuang Vientiane Pr Borikhamxay Khammuane Savannakhet Saravane Sekong Champasack Attapeu Lao PDR
127 Appendix 6.3: Household use of own forest holdings for growing various products, 2010/11 Type of product (% of exploiting households) Province HHs use own forest (%) Timber Fuelwood Bamboo Mushroom Fruit & veg. Sale of products Phongsaly 67.7 na Luangnamtha Oudomxay Bokeo Luangprabang Huaphanh Xayabury Vientiane Cap Xiengkhuang Vientiane Pr Borikhamxay Khammuane Savannakhet Saravane Sekong Champasack Attapeu Lao PDR Appendix 6.4: Farm households engaged in capture fishing activities, by province, 1998/99 and 2010/11 Province (%) of farm HHs with capture fishing No. of aquaculture holdings Area of aquaculture Net 1998/ /11 Net Net change 1998/ /11 change ( 000 ( 000 change 1998/ /11 (no.) ( 000) ( 000) (no.) ha) ha) (no.) Average size of aquaculture holding Phongsaly Luangnamtha Oudomxay Bokeo Luangprabang Huaphanh Xayabury Vientiane Cap Xiengkhuang Vientiane Pr Borikhamxay Khammuane Savannakhet Saravane Sekong na Champasack Attapeu Lao PDR /99 (ha) 2010/11 (ha) 106
128 Appendix 6.5: Distribution of farm households engaged in capture fisheries, by source of fish capture and province, 2010/11 Farm Households engaged in capture fisheries (%) Region/Province River Reservoir/lake Swamp Rice field Irrigation canal Village pond Other Phongsaly na 12.0 Luangnamtha na 9.8 Oudomxay Bokeo Luangprabang Huaphanh Xayabury Northern Region Vientiane Cap Xiengkhuang Vientiane Pr Borikhamxay Khammuane Savannakhet Central Region Saravane Sekong Champasack Attapeu Southern Region Lao PDR
129 Chapter 7 - Gender aspects in Lao PDR agriculture This chapter analyses gender-differentiated data from the Lao Census of Agriculture (LCA) 2010/11 and 1998/99 to provide information on gender differences in agricultural practices and the situation of women in agricultural households in the Lao People s Democratic Republic (Lao PDR). Specifically, this chapter compares the activities of female-headed and female decision-making households with other households to better understand issues regarding access to resources and livelihoods. It also examines the different patterns of agricultural work by men and women in farm households. In Lao PDR, women play a significant but often unrecognized or undervalued role in the agricultural sector. They perform many farm activities such as planting, weeding, harvesting, gardening and taking care of livestock in the household. Agricultural activity is especially important for women, since there are only limited opportunities for them to generate income and gain employment in other sectors. Also, gender stereotypes place a greater time burden on women to do household chores, which further limits their ability to generate income independently. Examining gender-based roles and the differences and inequalities between men and women is crucial to agricultural development. Women (and female-headed and female decisionmaking households) may have different access to resources and contribute differently than men to agricultural work. These differences can cause disparities in development outcomes. Also, perceptions and customs relating to gender roles can affect food security and household welfare (WB, FAO and IFAD 2009, 2). In this preliminary analysis, the raw data from the LCAs were disaggregated by variables that are relevant from a gender perspective: sex of household headship (i.e. male, female and jointly-headed farm households), sex of household decision-maker (i.e. male, female and joint decision-maker farm households) and sex of members within sample farm households. In addition, village-level data on the gender wage gap are included in this chapter. All data in the tables and figures in this chapter are from the LCA 2010/11, unless otherwise noted. An important distinction is made in this chapter between household headship and household decision-making. As part of the survey of all farm households in the LCAs 1998/99 and 2010/11, respondents were asked the question, Is the household head male or female? A third option of Joint was added in the 2010/11 LCA, which was not an option in 1998/99. The questionnaire forms used by the enumerators for the LCA 2010/11 did not include the option for joint headship. As for household decision-making, respondents were asked the following question in the sample survey component: Who in the household are the main decision-makers for crop and livestock production activities? Respondents had the option of recording one or two people in the household. In this chapter, female decision-maker(s) household means a household where one or two women were reported to be the main decision-makers;; male decisionmaker(s) household means a household where one or two men were reported to be the main 108
, the sex ratio (expressed as the number of males to 100 females in the population) has gradually increased")
130 decision-makers; and joint decision-maker household means a household where a man and a woman were reported to be the main decision-makers. Figure 7.1: Estimated farm population by sex and age, 2010/11 As previously noted (see Chapter 2), the sex ratio (expressed as the number of males to 100 females in the population) has gradually increased over the past 25 years within Lao PDR s general population. This trend is also seen within the farm population; the sex ratio of the farm population in the country had increased to 101 by 2011 from just over 97 in 1998/99 (Figure 7.2). Figure 7.2: Changes in sex ratio: (number of males per 100 females) Source : LCA 1998/99, LCA 2010/11, Lao Population Census 1985, 1995, 2005 Note : Data from the Population Census is based on the general population, whereas data from the Agricultural Census is based on the agricultural household population. 109
.")
131 Household headship and decision-making More than 91 percent of farm households are male-headed. Female-headed farm households comprised 8 percent of total farm households in 2010/11, little changed since 1998/99 (Figures 7.3 and 7.4). A study based on the 2009 Lao Expenditure and Consumption Survey found that widowhood was the primary reason for female headship (in 62 percent of femaleheaded households). The next most common reason (in 20 percent of female-headed households) was that married women became de facto heads of households when men migrated or left the household for other reasons (FAO and MAF 2010, 14). Figure 7.3: Proportion of male, female and joint-headed farm households 2010/11 (number of households in parenthesis) Source: LCA 2010/11 Data on household size reinforces the above finding that women usually become heads of households primarily because of the absence of a husband. Typically, the average number of household members in the female-headed farm household (5.0) in 2010/11 was smaller by one compared with the average number in the male-headed households (5.9). The difference in household size between female-headed and male-headed households was largest in the northern region (Figure 7.5). The Mekong Corridor had the highest proportion of female-headed households (14 percent of total farm households), followed by the Vientiane Plain, where 11 percent of farm households were female-headed. The proportion of female-headed households was lowest in the Northern Lowland and Highland Areas, where only 4 percent of total farm households were headed by women (Figure 7.6). 110


132 Figure 7.4: Proportions of male and female-headed farm households 1998/99 (number of households in parenthesis) Source: LCA 1998/99 Figure 7.5: Average number of household members in male, female and joint-headed farm households by region The proportion of female-headed farm households was highest in urban villages and higher in rural villages with roads than in rural villages without roads. This may be related to the greater availability of work and income opportunities in the non-farm sector in these areas, but this needs further examination (Figure 7.7). 111

133 Figure 7.6: Proportions of male, female and joint-headed farm households by agro-ecological zone Figure 7.7: Prevalence of female-headed farm households by village type The overwhelming predominance of male-headed households may seem to imply strongly unequal gender relations. But in the Laotian context, household headship is not necessarily an indicator of who is making the main farming decisions in the household. In fact, 64 percent of farm households were joint decision-maker households, where a man and a woman make joint decisions on crop and livestock production activity. This means that even within most male-headed households, women are heavily involved in making the main decisions on crop and livestock production activity. It also means that the reverse is true, to some extent: men 112
134 are also involved in making the main farming decisions in some female-headed households. In 2010/11, 8.2 percent of farm households were headed by women, but there were only 6.5 percent of farm households where only one or two women made the main decisions (Figures 7.3 and 7.8). 25 Figure 7.8: Proportion of male, female and joint decision-maker farm households 2010/11 (number of households in parenthesis) 26 Although there was some variation across agro-ecological zones, men and women jointly made the main decisions relating to agricultural activity in more than 60 percent of all farm households. The proportion of female decision-maker households was somewhat lower in the Northern Lowland, Northern Highland and Upland, and Central and Southern Highland Areas (4 percent or 5 percent of total farm households) compared with the Mekong Corridor, Bolaven Plateau and Vientiane Plain (10 percent of total farm households) (Figure 7.9). Ethnicity and household headship The proportion of female-headed farm households varied among the various ethnic groups as classified by language families, with female headship highest among the Lao-Tai groups (10.2 percent) and lowest among the Hmong-lu Mien groups (2.8 percent) (Figure 7.10). 25 Households with two male decision-makers were included in the male decision-maker household category and comprise 1 percent of total farm households (estimated number of households is ). Households with two female decision-makers are included in the female decision-maker household category and comprised 2 percent of total farm households (estimated number of households is 8 647). 26 The number of households for each decision-maker category is an estimated figure derived from the sample component survey. 113
135 Figure 7.9: Proportion of male, female and joint decision-maker farm households by agroecological zone Figure 7.10: Proportions of female-headed farm households within language family categories However, there was considerable variation among ethnic groups within the broader language family ethnic group categories, making generalization on the basis of ethnicity problematic. For example, the Makong, Yru, Xuay, Brao and Nhahern groups all part of the Mon-Khmer language family category had rates of female headship higher than 9 percent. Also, the Phoutai and Leu groups both part of the Lao-Tai language family category had much lower rates of female headship, at 3.4 percent and 4.5 percent (Tables 7.1 and 7.2). 114
136 Table 7.1: Ethnic groups with the highest prevalence of female-headed households Ethnic group Language family Number of femaleheaded farm households Proportion within the ethnic group (%) Lao Lao-Tai Tai Lao-Tai Makong Mon-Khmer Yru Mon-Khmer Xuay Mon-Khmer Brao Mon-Khmer Nhahern Mon-Khmer Xaek Lao-Tai Lolo Chine-Tibet Source: LCA 2010/11 Table 7.2: Ethnic groups with the lowest prevalence of female-headed households Ethnic group Language family category Number of female-headed farm households Proportion within the ethnic group (%) Hmong Hmong-lu Mien Phoutai Lao-Tai Leu Lao-Tai Akha Chine-Tibet Tri Mon-Khmer Phong Mon-Khmer Katu Mon-Khmer Access to land This section examines whether there are differences in the size of land holdings operated by female, male and joint-headed farm households. At the national level, the average size of agricultural land operated by female-headed farm households was only slightly smaller than the land operated by male-headed farm households. Female-headed farm households operated, on average, 0.07 hectares (or 700 square metres) less agricultural land than maleheaded households, a difference of only 3.5 percent (Table 7.3). For irrigated lands, femaleheaded farm households operated, on average, 0.04 hectares (400 square metres) less than male-headed farm households, a difference of 5 percent (Table 7.3). 115
137 Although it is true that female-headed farm households in Laos were found to operate less land on average than male-headed households, the difference is relatively small when compared with neighbouring Cambodia and Viet Nam. 27 This may be due to the relative abundance of land in Laos, or it may reflect lower barriers to land access for women. Table 7.3: Average area of agricultural and irrigated land holding, by household type Male-headed farm households Female-headed farm households Joint-headed farm households Average area of agricultural land holding (ha) Average area of irrigated land holding (ha) Source: LCA 2010/11 The distribution of overall holding size also shows that female-headed households operate somewhat smaller areas of agricultural and irrigated land. Twelve percent of female-headed farm households were in the smallest agricultural land size category ( ha), while only 9 percent of male-headed farm households were in that category. Forty-four percent of female-headed farm households were in the smallest irrigated land size category ( ha), as opposed to 40 percent of male-headed farm households (Figures 7.11 and 7.12). Figure 7.11: Land size distribution of agricultural land holdings, by type of farm household 27 Data for Viet Nam are from FAO and General Statistics Office/Ministry of Planning, Viet Nam (2010): p.20. Data for Cambodia are from FAO and the National Institute of Statistics/Ministry of Planning, Cambodia (2010): p.21. The observed difference in averages may not be statistically significant. 116

 smaller areas than the male-headed households (13).")
138 Figure 7.12: Land size distribution of irrigated land holdings, by type of farm household The analysis of average land area by region yielded some surprising results: in the Central Region, the average area of agricultural land operated by female-headed farm households was marginally larger than that of male-headed households; however, the difference of only a few tenths of a percentage point may not be statistically significant. In contrast, in the Northern Region, the female-headed households operated substantially (0.5 ha) smaller areas than the male-headed households (Figure 7.13). Figure 7.13: Average area (ha) of agricultural land operated by male, female and joint-headed farm households by region Across all regions, there were small differences between female-headed and male-headed farm households in the average operated area of irrigated land. Male-headed farm households operated the same, or slightly larger, areas as female-headed farm households. The jointheaded households in the Northern and Central Regions operated somewhat larger areas, but
 of irrigated land operated by male, female and joint-headed farm households by region Use of technology and agricultural inputs Use of technology and agricultural inputs Use of")

139 this may be a function of the extremely small sample size, as there were only jointheaded farm households counted in the LCA 2010/11 (Figure 7.14). Figure 7.14: Average area (ha) of irrigated land operated by male, female and joint-headed farm households by region Use of technology and agricultural inputs Use of technology and agricultural inputs Use of rice millers and two-wheel tractors did not differ much between male decision-maker households and female decision-maker households. Use of threshers among female decisionmaker households was over 10 percent higher than among male or joint decision-maker households. In contrast, the use of large machinery (such as trucks and four-wheel tractors) was slightly lower in female decision-maker households (Figure 7.15). Figure 7.15: Farm households using farm machinery, by type of machinery and sex of household decision-maker

140 Rates of use of agricultural inputs such as fertilizers and pesticides were somewhat higher among female decision-maker farm households compared with other types of households. This gap was largest in the case of chemical fertilizers, with 10 percent of female decisionmaker households using them compared with 6 percent of male decision-maker households and 5 percent of joint decision-maker households (Figure 7.16). But it should be noted that use of these inputs was very low overall among all types of households. In fact, the vast majority of households did not use any of these inputs. Promoting wider use of such inputs among households is likely to raise crop yields and improve livelihood outcomes. The reasons for the slightly higher use of agricultural inputs among female decision-maker households are not clear and merit further investigation. Figure 7.16: Farm households using agricultural inputs by type of agricultural input and sex of household decision-maker Credit use As noted in earlier chapters, credit use among all farm households was quite low, and over 84 percent of all households did not use any credit (Figure 7.17). As with other inputs, credit use was even lower among female decision-maker households (11 percent compared with slightly more than 15 percent among male and joint decision-maker households). Among the small minority of households that had taken a loan, a slightly smaller proportion of female decision-maker farm households borrowed money from banks. Female decisionmaker households also had a slightly lower rate of using village development funds (Figure 7.18). 119

141 Figure 7.17: Farm households that have a current loan for agricultural purposes, by sex of household decision-maker Figure 7.18: Percentage Distribution of source of loans by type of household Note: Bank includes public, foreign and private banks. Sources of information There was not much difference between types of decision-maker households in where they obtain information for their agricultural production activities. Other farmers and television were the most popular sources of information, followed by radio and state organizations (Table 7.4). 120
142 Table 7.4: Main source of information for agricultural production activities Source of information Male decision-maker household (%) Female decision-maker household (%) Joint decision-maker household (%) State organizations Extension services Radio Television Newspapers Input suppliers Other farmers Other sources Wage inequality The data show a surprising absence of gender-related wage disparities. There was no wage inequality between men and women for agricultural work in more than 95 percent of the villages in every region. In fact, in the small number of villages that reported a wage gap (less than 3 percent), twice as many villages reported that female wages were higher than male wages (Table 7.5). The reasons for this are not entirely clear and merit further research. Table 7.5: Village-level wage gap by agro-ecological zone Agro-ecological zones Males = Females Females > Males Males > Females % number of villages % number of villages % number of villages Vientiane Plain Bolaven Plateau Central and Southern Highland Areas Mekong Corridor Northern Highland and Upland Areas Northern Lowland Paddy Areas Total
143 Crop production For both male- and female-headed farm households, lowland (or irrigated) rice is the dominant temporary crop, followed by upland rice and other cereals. The most widely grown permanent crops are rubber, coffee and bananas (Tables 7.6, 7.7, 7.8, 7.9, 7.10, 7.11). However, some differences can be observed between different household types. A smaller proportion of female-headed households grow crops other than rice, while a higher proportion of male-headed households grow a diverse range of crops, particularly temporary crops, in the wet season (Tables 7.6, 7.7, 7.8, 7.9). Coffee was the most widely grown permanent crop for female-headed farm households (grown by 29 percent of female-headed households), whereas rubber was the most widely grown crop by male-headed households (Tables 7.10, 7.11). The average area planted did not differ much between the different household types. But female-headed households cultivated slightly larger areas of lowland rice, while male-headed households cultivated slightly larger areas of upland rice (Tables 7.6, 7.7, 7.8, 7.9). Table 7.6: Top 10 wet-season temporary crops grown by male-headed farm households (by planted area) Crop Area (ha) Number of farm holdings growing crop Average area (ha) planted per holding % of maleheaded households Lowland rice/irrigation rice Upland rice Cereals used as fodder crops (e.g. maize, oats) Makdeay Sweet corn Cassava Sesame Groundnut (peanut) Sugar cane Chilli Source: LCA 2010/11 122
144 Table 7.7: Top 10 wet-season temporary crops grown by female-headed farm households (by planted area) Crop Area (ha) Number of farm holdings growing crop Average area (ha) planted per holding % of femaleheaded households Lowland rice/irrigation rice Upland rice Cereals used as fodder crops (e.g. maize, oats) Cassava Sweet corn Makdeay Groundnut (peanut) Sesame Sugar cane Grasses Source: LCA 2010/11 Table 7.8: Top 10 dry-season temporary crops grown by male-headed farm households (by planted area) Crop Area (ha) Number of farm holdings growing crop Average area planted (ha) per holding % of maleheaded households Lowland rice/irrigation rice Cereals used as fodder crops (e.g. maize, oats) Cassava Sweet corn Tobacco Sugar cane Watermelon Groundnut (peanut) Chilli Chinese cabbage
145 Table 7.9: Top 10 dry-season temporary crops grown by female-headed farm households (by planted area) Crop Area (ha) Number of farm holdings growing crop Average area planted (ha) per holding % of femaleheaded households Lowland rice/irrigation rice Cassava Sugar cane Cereals used as fodder crops (e.g. maize, oats) Sweet corn Tobacco Watermelon Onion Chilli Groundnut (peanut) Table 7.10: Top 10 permanent crops grown by male-headed farm households (by planted area) Crop Area (ha) Number of farm holdings growing crop Average area planted (ha) per holding % of male-headed households Rubber Coffee Banana Cinnamon Mango Tea Pineapple Other permanent crops Mandarin and tangerine Lemon
146 Table 7.11: Top 10 permanent crops grown by female-headed farm households (by planted area) Crop Area (ha) Number of farm holdings growing crop Average area planted (ha) per holding % of femaleheaded households Coffee Rubber Banana Cinnamon Mango Tea Pineapple Makyau Coconut Other permanent crops Livestock and poultry-raising No major differences were observed between male-headed and female-headed households in cattle-raising activities, and there is no support for the stereotypical view that mostly men raise the big animals such as cattle and buffaloes. In fact, a higher proportion of maleheaded households raised pigs and local chickens (Figure 7.19). Figure 7.19: Livestock and poultry-raising in farm households by household type Female-headed households raised, on average, a somewhat smaller number of animals (Table 7.12). 125
147 Table 7.12: Average number of livestock and poultry per farm household by household type and difference between male and female-headed households Livestock and poultry Average number raised by male-headed households (a) Average number raised by female-headed households (b) Difference between male and female-headed households (a-b)/(b) Cattle % Buffaloes % Pigs % Goats % Sheep % Local chickens % Commercial chickens % Ducks % Figure 7.20: Main source of income for male-headed farm households Livelihood sources and strategies A slightly higher percentage of male-headed households reported crop production as their main source of income (52 percent compared with 47 percent of female-headed households). Other sources were the main income source for 43 percent of female-headed households compared with 34 percent of male-headed households (Figures 7.20 and 7.21). 28 Unfortunately, information about the sources of income included in the category Other is 28 Joint-headed farm households were excluded from this analysis because of the extremely small size of this category (1 850 households, or 0.2 percent of farm households) compared with male- and female-headed households, but information is included in the Annex to this report. 126


148 not available in the Census of Agriculture, but this may be an indicator that a higher proportion of female-headed households depend on non-agricultural sources of income, including paid employment or income from commercial enterprises. Figure 7.21: Main source of income for female-headed farm households Sales of non-rice crops, livestock and fish products were smaller among female decisionmaker households (Figure 7.22). While this requires more research, it suggests that farming activities among female decision-maker households are more subsistence- oriented. Figure 7.22: Percentage of farm households that sold an agricultural product in the last 12 months, by type of household Note: Forest products include forest products taken from own land and public forests. Fish includes aquaculture and wild fish. 127


149 There were very few regional differences in the pattern of crop or livestock sales across different types of households (Figure 7.23). Figure 7.23: Percentage of male and female-headed farm households selling crop and livestock products by region Labour allocation within agricultural households There appear to be no major differences among the different types of households in labour allocation patterns across agricultural tasks. Women participate extensively and almost equally with men in almost all rice cultivation activities, such as harvesting, weeding and transplanting, and somewhat less in transportation, threshing and seeding. The differences were more visible for tasks that require use of heavy equipment and specialized inputs (e.g. controlling pests, irrigating, fertilizing and preparing land) (Figure 7.24). Figure 7.24: Male-female ratio of farm household work by specific rice cultivation activity Note: This shows the proportions of men and women (above 10 years old) undertaking each activity. 128
150 Women were reported to do more unpaid work than men (61 percent compared with 54 percent) (Table 7.13), though it should be noted that the category of No benefit (as directly translated from the Lao wording in the questionnaire) is somewhat ambiguous and may include cases of people working on their own farms from which they derived income but not in the form of a wage. Furthermore, the high percentage of men and women reporting No benefit as their main economic activity may not reflect the real economic activity of agricultural household members. The categories of the survey response regarding main economic activity had been changed in LCA 2010/11. According to the LCA 1998/99 data, 77% of men and 76% of women reported doing Paid work on own holding as their main economic activity, and only 15% of men and women reported doing Unpaid agricultural work on own holding (Table 6.14). This suggests that the low percentage of men and women reporting Own business as their main economic activity in 2010/11 (and high percentage reporting No benefit ) may simply be a function of the wording of the questionnaire. Table 7.13: Main economic activity of men and women (15-64 years) Main economic activity Men (%) Women (%) Employee 9 5 Employer 1 1 "Own business" "No benefit" Other Table 7.14: Main economic activity of men and women (15 years and over), 1998/99 Main economic activity Men (%) Women (%) Unpaid agricultural work on own holding Paid work on own holding Unpaid agricultural work outside own holding 0 0 Paid work outside own holding 8 9 Source: LCA 1998/99 There was no discernible difference between men and women in the amount of time spent on either growing crops or raising livestock. Most men and women spent three to six months on crop cultivation (Figure 7.25). Most of the people who raised livestock spent less than an hour per day on livestock (Figure 7.26). 129

151 Figure 7.25: Time spent on crops during the past 12 months, by men and women Figure 7.26: Time spent per day on livestock, by men and women Note: Excludes respondents who reported spending No time on any activity. Summary and conclusions This preliminary analysis of the data from the LCAs revealed some interesting features of agricultural households in Lao PDR from a gender perspective. First, women play a major role as partners in making decisions on agricultural activities, although female-headed households comprise only 8 percent of total farm households. Second, there appears to be no gender bias in rural wages in Lao PDR, which is a remarkable finding. Men and women appear to participate almost equally in all types of agricultural tasks. 130
152 Third, although female-headed households tend to operate smaller areas of agricultural and irrigated land compared with male-headed households, the differences are relatively small at the national level. However, there were differences related to region and ethnicity. For example, the average size of agricultural land operated by male-headed households was considerably larger than in female-headed farm households in the Northern region. Fourth, female decision-maker farm households used fairly similar levels of small machinery (e.g. rice millers, two-wheel tractors and threshers), but used lower levels of large machinery (e.g. four wheel tractors) and productivity-enhancing inputs (e.g. fertilizers). However, it should be noted that use of such inputs is generally very low among all households. Similarly, female decision-maker farm households used less credit, particularly bank credit, compared with male-headed households; but overall credit use was very low among all households. Further investigation is needed to ascertain whether these differences are related to gender-related barriers that constrain female-headed households from accessing markets and undertaking commercial activities. Fifth, there were no major differences between different household types in cultivated crops, cattle and poultry-raising, though there were some indications that female-headed households may be somewhat more subsistence-oriented in their agricultural activities. But femaleheaded households also seem to obtain a larger proportion of their incomes from nonagricultural income sources, so the subsistence orientation of their agricultural activities does not necessarily imply that they rely only on agricultural activity for their livelihoods. While further investigations are needed to find the reasons for these differences, these preliminary results from the agricultural censuses are sufficient to highlight the importance of taking gender-related issues into account in policy formulation and development planning. In particular, it is clear that women participate actively and extensively in agriculture-related decisions. This means that policies and development initiatives aimed at raising agricultural productivity should target and involve not only men but also women, even in male-headed households. In addition, while women participate in decision-making and there seems to be little or no gender inequality in wages, there are some indications that there are genderrelated barriers to women s market access and commercial success. In this context, a number of measures may be particularly helpful to women and to female-headed households, such as those which expand access to credit and use of productivity-enhancing agricultural inputs and those which provide women with the know-how and resources necessary to sell non-rice crops, livestock and poultry
153 Chapter 8 Village-level infrastructure and development constraints According to World Bank estimates, the Lao People s Democratic Republic (Lao PDR) is one of the poorest countries in the East Asia and Pacific Region. In 2011, the country s human development ranking was 138 out of 179 countries, with an overall score of (UNDP, 2012). Although the per capita gross domestic product (GDP) had increased from USD 114 in 1985 to USD 330 in 2000, and further to USD in 2012 (Lao Statistics Bureau 2012), the incidence of poverty remains high, with 28 percent of the population reported to be living in poverty (MAF, 2010). The government s development strategy emphasizes poverty reduction, infrastructure development and human resources development to attain two overarching goals: to move out of the category of Least Developed Nation by 2020 and to eradicate poverty. This chapter examines the overall development status and availability of rural infrastructure across provinces in Lao PDR based on information gathered in the Lao Census of Agriculture (LCA) 2010/11 through its village component. 29 The report assesses important changes over the past decade, drawing on information from the LCA 1998/99, and focusing on: 1. Education, health care, roads, transportation, communication, rural connectivity, power supplies, drinking water supplies, irrigation infrastructure, availability of formal and informal financial institutions and credit support systems, agricultural markets (input and output), availability of rural development projects and their spread across villages, etc.; 2. Living standards of the households based on perception analysis; and 3. Major constraints to agricultural development, including availability of various essential production factors and adverse impacts of climate change and natural hazards. Status of infrastructure development in the villages: Evidence from LCA 2010/11 The LCA 2010/11 covered villages out of the total of villages in Lao PDR. Out of these, around 85 percent of the villages (7 300) were classified as rural and the rest (1 362) as urban. In terms of topographical features, almost 40 percent of the rural villages are located in the upland areas, 36 percent in the lowland areas and about 24 percent in the plateau or mixed land areas. The Central provinces reported a larger proportion of urban villages (21%) compared with 13 percent in the North and 11 percent in the South. Access to roads, primary education and health care Around 83 percent of the rural villages (6 031) reported having some road access and the remainder (17%) do not have any road connectivity. Rural villages with road access were on average somewhat larger (104 households) than those without (68 households). The status of 29 The village data available from the LCA 2010/11 consist of the responses (presented in percentage terms) of the village heads about the availability of various infrastructure facilities in their respective villages. In most cases, the responses were gathered in terms of yes or no and the percentages so derived are standalone (independent) values; therefore rows and column figures in some tables may not add up to
154 villages with respect to primary education as well as primary health care facilities is presented in Table 8.1. Table 8.1: Access to primary education and health care facilities, 2010/11 Location of the villages Primary education (% of villages) School within 1 hr walk distance Primary school Incomplete* primary school Primary health care (% of villages) Pharmacy or drug kit Dispensary/ hospital Disp./hosp. within 2 hr walk distance North Central South Lao PDR Urban Rural with road Rural - No road Lowland Upland Plateau Mixed land type Note: *The LCA 2010/11 does not provide a definition for Incomplete primary school. As per the National Plan of Action of the Ministry of Education (MOE, 2005), Government of Lao PDR, the incomplete primary school is defined as a primary school which does not have a full cycle of five years from Grade 1 to 5. The overall scenario suggests that about 65 percent of the villages have primary schools and that the situation is similar across regions, with some exceptions in the North. Even though primary schools are available in a large number of villages, a significant proportion of them are incomplete, 30 as they do not have a full cycle of five grades. About one-fourth of the villages also report that primary schools are located at a distance requiring at least a one hour walk. Among the four geographical regions, villages in the uplands showed the greatest lack in terms of primary schools and in a large number of them the schools are incomplete in comparison with other regions. As regards primary health care facilities, almost 70 percent of the villages have a pharmacy or drug kits available for the use of households, while 16 percent of the villages have dispensaries or hospital facilities. However, a large number of villages (54% at the national level) still face difficulties in accessing health care facilities, as dispensaries or hospitals are located at a distance of more than two hours walk. Urban villages are relatively better positioned (especially compared with rural villages without roads) in terms of the availability of dispensaries or hospitals, either within the villages themselves or within two hours walking distance. Rural villages, both with and without road connectivity, often reported a lack of dispensary or hospital facilities. In almost 30 According to a report from the Ministry of Education (MOE, 2009), a large number of primary schools also remain incomplete as they do not have basic physical facilities, including a proper roof on top of the buildings. Another report observes that, by and large, provinces with large ethnic group populations have more villages without any schools or with a higher number of incomplete primary schools with less qualified teachers (MOE, 2005)
155 three-fourths of the villages in areas without road connectivity, the household members have to walk more than two hours to access dispensary or hospital facilities. Access to water supply, electricity, year-round roads and telecom services Table 8.2 presents the status of the villages in terms of access to other amenities, such as safe drinking water supply, electricity supply and roads that are traversable year-round to the district headquarters, as well as postal and telecommunication offices. In general, villages in the Northern region have poorer access to safe drinking water (19.3% of villages), electricity (64%), power grid connectivity (38%) and year-round traversable roads (56%) than those in the Central and Southern regions. They also show a greater lack of usable roads (14%) compared with Central and Southern villages. A vast majority of the villages (85%) lack postal and telecommunication office services at the national level, although Central provinces reported relatively better access to such services. The status of villages located in the uplands, as well as in areas without road connectivity, is much worse than other areas in terms of drinking water supply, access to electricity and availability of permanent traversable roads. Table 8.2: Access to water supply, electricity, concrete roads and telecom services, 2010/11 Location of the villages Safe water supply Electricity in village Percentage of villages with access to Year-round No Connected to traversable traversable power grid road to district road to district Post & telecom. offices North Central South Lao PDR Urban Rural with road Rural - No road Lowland Upland Plateau Mixed land type From these data, it may be noted that: (a) nearly villages in the country, i.e. almost onethird of all the villages, do not have year-round road access to the district centres; (b) more than half of the villages do not have sufficient proper drinking water supplies; and (c) the majority of upland villages are severely lacking most services. The marked rural/urban disparity in the case of safe drinking water supply, as demonstrated by the LCA 2010/11, may be attributable to the fact that water supply schemes are implemented by two different ministries in the rural and urban areas For instance, urban water supplies are allocated to the Ministry of Communication, Transportation, Post and Construction, while rural water supplies are the responsibility of the Ministry of Health (WHO, 2008)
, followed by hydro-electric generators (12%), solar cells (3%) and public and private")
156 In terms of electricity supply, 30 percent of all villages do not have access to electricity and almost half of the villages in the uplands are not electrified. Figure 8.1 shows that the majority of the villages source their power from electricity grids within the village (55%), followed by hydro-electric generators (12%), solar cells (3%) and public and private generators (3%). Sharp differences can be observed between urban villages and rural villages without roads in terms of power grid connectivity within the village. Thus, in rural villages without road connectivity, hydro-electric generators are the main source of power (20%), followed by grid connectivity. Figure 8.1: Major sources of electricity supply in the villages, 2010/11 Mixed lands Plateau Upland Lowland Rural - No road Rural with road Urban Power grid Hydro generators Lao PDR South Central North Percentage of villages Household water supply Water supply and sanitation have been important areas of concern for the Government of Lao PDR for the past several years. As part of the Millennium Development Goals (MDGs), the Government has established targets at the national level to provide 80 percent of the total population with access to improved drinking water sources and 60 percent with access to improved sanitation facilities by 2015, using the 1995 service level estimates as a baseline (WB, 2010). In this regard, the latest Lao Social Indicator Survey (LSIS) 2011/12 showed that the country has so far achieved 70 percent coverage of the population in terms of improved drinking water provision at the national level. However, this figure appears to reflect primarily urban coverage, as there are marked differences across regions, as well as between urban and rural villages, which were revealed by the LSIS 2011/12 and the Lao Agricultural Census 2010/11 and illustrated in Table 8.2. The LCA 2010/11 reported that households use multiple sources of water in the villages. In the order of their importance at the national level, these sources are: rivers/streams/dams; protected wells/boreholes; rainwater tanks; unprotected wells/boreholes; and water pipes (Table 8.3, Figure 8.2, Appendices ). 135

157 Table 8.3: Distribution of villages based on household use of different water sources, 2010/11 Location of the villages Piped water Protected well/borehole Percentage of villages reporting Unprotected well/borehole River/ stream/dam Rainwater tank North Central South Lao PDR Urban Rural - No road Lowland Upland Table 8.3 shows the disparate status of villages in terms of access to different sources of water by the households. By and large, piped water supplies are concentrated in the urban villages (56%), particularly in the lowland villages (21%) and villages in the Central provinces (16%). There is far less piped water available in the villages without road connectivity and in the uplands. A recent study (WB, 2010) showed that the rural water supply system in Lao PDR suffers from the lack of institutional support for operators of rural water supply systems and small-scale providers of piped water supply. Figure 8.2: Sources of household water supply in the villages, 2010/ Lao PDR Urban Rural with road Rural -No road 40.0 Villages (%) Piped water Protected well/ borehole Unprotected well/ borehole River/stream/dam Rainwater tank The availability of protected wells/boreholes was reported from 38 percent of the villages at the national level, with the Northern provinces showing much lower proportions (11%) than the South or Central regions. The proportion of unprotected wells/boreholes was reported to be very high in villages located in the Central provinces, with the greatest concentration in the lowland and urban villages. While large numbers of villages in all the regions reported similar levels of access to and use of rivers, streams or dams for sourcing water, rainwater tanks are predominantly used in the lowland villages and villages located in the Southern and 136
.")
158 Central provinces. In contrast, very few Northern villages reported using rainwater tanks, which may be attributable to the inadequate rainfall in the moist to dry subtropical Northern highlands (ICEM, 2003). Public services The LCA 2010/11 provided a broad classification of the villages in terms of the presence of public services. These services included: (a) rice bank; (b) livestock bank; (c) cooperative; (d) trade group; and (e) village development fund (VDF). Figure 8.3 presents the status of villages with respect to the availability of these important public services. A large proportion of villages (49 percent in Central provinces, 43 percent in the North and 37 percent in the South) reported having a VDF with a strong presence. More urban villages (65%) have access to the VDF support services than rural villages with roads (43%) or without roads (26%). Upland villages lag behind the lowland and plateau villages in terms of access to VDF support. Figure 8.3: Distribution of villages based on presence of public services, 2010/11 Rice bank Livestock bank Cooperative VDF Trade group Mixed land Plateau Upland Lowland Rural - No Road Rural with road Urban Lao PDR South Central North Villages (%) The majority of the villages in all regions and categories reported minimal access to public services, especially livestock banks, cooperatives and trade groups. Rice bank services are available to a reasonable proportion of villages located in the uplands, plateau regions and the Northern provinces. However, only a very small proportion (3-12%) of villages anywhere had other services, such as livestock banks, cooperatives and trade groups. These data show that the vast majority of villages are severely disadvantaged in terms of availability of many services and facilities. While there may be several reasons for the relatively poor development and lack of availability of services and facilities across 137
159 provinces, this may be due, at least in part, to sheer lack of knowledge among the village communities and local officials about cooperative principles and management and the potential benefits of such local associations. Land allocation and resettlement of villages From 1997 to 2006, based on the Land Use Planning and Land Allocation (LUP-LA) manual produced by the Lao Swedish Forestry Programme, the Government of Lao PDR undertook a massive land allocation and titling programme throughout the country. Through this programme households received both permanent and transferable (temporary) land titles. In the urban and peri-urban areas, the Ministry of Finance was the main implementing agency, while in the rural areas, the Ministry of Agriculture and Forestry was responsible for issuing land titles and temporary land use certificates to households. The Government has also undertaken a major programme for resettlement of villages and nearly 900 villages have been resettled over the past decade, 32 including one in five of the upland villages. The government also proposes to undertake resettlement of over 300 more villages in the future. To understand the impacts of the land allocation and resettlement programmes in the villages, the LCA 2010/11 incorporated several important questions, including: (a) whether a land or forest allocation programme had been implemented in the village; (b) if so, the area of land or forest allocated for different activities, e.g. construction, conservation forest, protection forest, exploitable forest; and (c) whether resettlement of villages had been undertaken or was being planned for the future. The outcomes of the land allocation programmes and village resettlement undertaken over the past decade are presented in Table 8.4. A majority of the villages in the Northern provinces (61%) had been affected by land allocation programmes as well as village resettlement (15%) over the past ten-year period. The higher proportion of upland areas in the villages of Northern provinces without road connectivity seemed to be the major reason for the region receiving resettlement programmes. Only percent of the villages in the Central and Southern regions have had similar programmes, and less than 7 percent of villages in these two regions have been resettled. Larger proportions of rural villages with road connectivity (54%) received land allocation compared with urban villages (41%) and villages without road access (38%). On the other hand, a relatively higher proportion of villages without road access (17%) and/or located in the uplands (19%) were resettled over the past ten years. 32 Though not officially considered a policy by the Lao government, resettlement of ethnic minorities has been a major tenet of the rural development strategy in Lao PDR. Over the past ten years, a majority of highland villages have been resettled downhill and the local administrations are planning to move the remaining villages in the coming years. The village resettlement programme was aimed at settling or stabilizing the agricultural practices and accelerating the social and cultural integration of the ethnic minorities (Evrard and Goudineau, 2004: ). 138
160 Table 8.4: Land allocation and resettlement of villages, 2010/11 Location of villages Resettled during last 10 years Percentages of villages Resettlement planned for future Land allocation programmes North Central South Lao PDR Urban Rural with road Rural - No road Lowland Upland Plateau Mixed land Among the provinces, land allocation has been implemented in a high proportion of villages in the Northern provinces of Xayabury (97%), Oudomxay (94%) and Luangnamtha (73%) and the Central provinces of Borikhmamxay (89%), Bokeo (82%) and Vientiane Province (71%). Nearly one-quarter (26%) of all the villages in Oudomxay were resettled between 1998/99 and 2010/11. However, the proportion of villages that were impacted by land resettlement programmes was very low at the national level (10%) with Northern provinces showing a relatively higher percentage (15%) compared to Southern (7.5%) and Central (6%) provinces. While a notable share of villages (13-26%) in five of the seven Northern provinces have been impacted by land resettlement, the proportion was much lower (4-11%) in the Central provinces. Some villages from the two Southern provinces, i.e. Sekong (20%) and Attapeu (17%), also benefited from the land resettlement programmes. Farming environment in the villages Presence of unexploded ordnance It is important to understand the farming environment in the villages, as there are striking differences in the characteristics of farmlands, access to irrigation facilities, soil quality and the persistence of shifting cultivation as well as the presence of UXOs 33 across villages and provinces, which is one of the major problems constraining agricultural development in many villages in Lao PDR (Table 8.5 and Figure 8.4). 33 It is important to note that, even 30 years after the war, UXOs continue to have a major impact on rural lives by affecting livelihoods and food security for a large number of households. UXOs cause loss of life and physical disabilities for many people. According to the Lao National Unexploded Ordnance Programme, accidents usually occur in village centres (32%), upland rice fields (18%), lowland rice fields (13%) and near forests (12%). Furthermore, the contaminated areas represent 50% of all agricultural land. UXO presence still affects access to land, making it more difficult to plant crops, herd animals, and collect fuel, water and nontimber forest products (NTFPs), thus reducing livelihood opportunities for many rural households (LNUPO, 2008). 139
 villages with UXO-affected land UXO-affected land (%) of total Area ('000 ha) land")
161 Table 8.5: Presence of UXOs in the rural villages and potential for land development, 2010/11 Village type/land type (%) villages with UXO-affected land UXO-affected land (%) of total Area ('000 ha) land area Potential agricultural land * ('000 ha) North Central South Lao PDR Rural with road Rural - No road Lowland Upland Plateau Mixed land Note: * The LCA 2010/11 classified this land as non-agricultural land that could be brought under farming. It can be seen that a significant proportion of villages in the Southern (27%) and Central (23%) provinces suffer from the adverse effects of UXOs; the percentage of land area affected by UXOs is approximately 11 percent in both these regions. Villages in the Northern provinces are not as much affected by UXOs, as the proportion of villages and land area affected in these provinces are 6 percent and 3 percent, respectively. Villages in the Central provinces alone account for almost 63 percent of the total land area affected by UXOs ( ha), followed by Southern (27%) and Northern (10%) provinces. Figure 8.4: Number of villages and land area affected by UXO in Lao PDR Mixed land Plateau Upland Lowland Rural - No road Rural with road % Land area % Villages Lao PDR South Central North Villages and area affected by UXOs Compared to villages located in lowlands and mixed lands, larger proportions of upland and plateau villages are affected by the presence of UXOs, with upland villages reporting 19 percent of land area affected by the problem. While the proportion of villages with and without road connectivity were similarly affected by the presence of UXOs, the proportion of land area affected by UXOs was almost three times higher in villages lacking road connectivity (22.6%) than in villages with roads (7.7%). 140
162 Figure 8.5 presents the percentages of villages and land area affected by the presence of UXOs across provinces. In terms of farmland area affected, five provinces reported large village areas disturbed because of UXO presence, i.e. Xiengkhuang ( ha), followed by Saravane ( ha), Savannakhet ( ha), Vientiane Province ( ha) and Khammuane ( ha). Figure 8.5: Villages and land area affected by UXOs across provinces, 2010/11 Villages and area affected (%) Luangprabang Villages (%) Huaphanh Xiengkhuang Vientiane Pr. Borikhamxay Khammuane Savannakhet Saravane Sekong Attapeu Shifting cultivation and land degradation The LCA 2010/11 data presented in Table 8.6 show the extent of shifting cultivation practices in the villages across the three regions. Apparently, shifting cultivation is more prevalent in upland villages and in villages located in the Northern region compared with the Central and Southern regions. Table 8.6: Villages practicing shifting cultivation and affected by soil degradation Percentage of villages affected by Location/type of Soil degradation villages Shifting cultivation Light Moderate Severe North Central South Lao PDR Rural with road Rural - No road Lowland Upland Plateau Mixed land Na Shifting cultivation was also reported from relatively more villages without road connectivity (27.4%) than villages with road connectivity (16%). This may be because the absence of road 141
163 connectivity and consequent lack of access to markets, combined with proximity to forest areas, motivates many villagers in these provinces to practice shifting cultivation. According to the vast body of literature on environment and development in many Southeast Asian countries, soil degradation has been identified as one of the major problems in upland areas, with complex connections to agricultural intensification, government land use policies, shifting cultivation practices, and land use changes (Lestrelin, 2010). In this regard, the LCA 2010/11 showed that moderate to severe levels of soil degradation do exist, especially in villages located in the uplands and plateau areas in the Northern and Central provinces, which also reported higher percentages of shifting cultivation (Table 8.6).Villages reporting shifting cultivation also tend to report moderate to severe levels of soil degradation, especially in four provinces, i.e. Sekong, Oudomxay, Phongsaly and Huaphanh. The proportions of villages reporting shifting cultivation as well as moderate to severe soil degradation were the highest in Sekong (51% and 35%, respectively), followed by Oudomxay (17% and 20%), Phongsaly (22% and 12%) and Huaphanh (34% and 12%). However, it must be noted that the link between shifting cultivation and soil degradation is indirect and highly complex, involving a number of social, political, and economic factors (Lestrelin 2010). Agricultural infrastructure The agricultural infrastructure facilities in the villages are classified as follows: permanent markets or shops selling agricultural inputs, farm machinery, tools and equipment; credit facilities; veterinary clinics; petrol stations; and the presence of traditional as well as community fisheries management. The status of villages with respect to various agricultural and rural infrastructure facilities is presented in Table 8.7. Table 8.7: Agricultural infrastructure status in the rural villages of Lao PDR, 2010/11 Location/type of villages Permanent market Shop Type of agricultural infrastructure (% of rural villages) Shops selling Credit Veterinary facilities clinic Agri. inputs Agri. machinery & tools Petrol Station Traditional/ community fisheries management Northern Central Southern Lao PDR Rural with road Rural No road na na Lowland Upland Plateau Mixed land na 71.4 na na Table 8.7 highlights the severe infrastructure constraints facing villages. While the majority of the villages (62%) reported the presence of generic shops, almost no villages have permanent markets, shops selling agricultural inputs or agricultural machinery and tools, or veterinary clinics. Less than half (44%) of the villages have credit facilities. Of those villages 142
164 without road connectivity, only 31 percent have credit facilities. The majority of villages do not have traditional community fisheries. Irrigation infrastructure While nearly half (48%) of rural villages have irrigation facilities of some kind, the availability of such facilities varies significantly across regions, ranging from 59 percent in the Northern provinces to 40 percent in the Central region and 37 percent in the South (Table 8.8). Table 8.8: Availability of irrigation facilities in villages by region and type of land, 2010/11 Region/village type/land type Irrigation facilities (% of rural villages) Village irrigation groups (VIG) Wet season only Dry season only Both seasons Total Northern na Central Southern Lao PDR Rural with road Rural - No road Lowland Upland Plateau Mixed land Only about one-fifth of the villages have access to irrigation facilities during both the wet and dry seasons, with a somewhat higher proportion in the lowland areas of Southern and Northern provinces. But the majority of villages in Attapeu (85%), Khammuane (76%), Savannakhet (73%), Sarvane (71%) and Luangprabang (63%) had no irrigation facilities at all, as shown in Figure 8.6. Figure 8.6: Irrigation facilities in villages across provinces, 2010/11 Attapeu Champasack Sekong Saravane Savannakhet Khammuane Borikhamxay Vientiane Pr. Xiengkhuang Vientiane Cap. Xayabury Huaphanh Luangprabang Bokeo Oudomxay Luangnamtha Phongsaly Villages with irrigation facilities (%)
, indicates that weirs, both permanent and temporary, together constitute the largest source of irrigation in the villages in the Northern and Central provinces (73% and 28%, respectively).")
165 The distribution of irrigation infrastructure in terms of type of facility, as presented in Table 8.9 (and Figure 8.7), indicates that weirs, both permanent and temporary, together constitute the largest source of irrigation in the villages in the Northern and Central provinces (73% and 28%, respectively). A majority of villages in the plateau and uplands also reported weirs as the major source of irrigation (71% and 50%, respectively).the high proportion of villages where temporary weirs outnumbered permanent weirs suggests that water availability in the weirs is highly seasonal and dependent on the vagaries of monsoon weather patterns. Table 8.9: Major types of irrigation infrastructure in the villages, 2010/11 Type of irrigation facility (% of rural villages) Region/village type/land type Permanent weirs Reservoirs Pump schemes Gates & dykes Temporary weirs Gabions Northern Central Southern Lao PDR Rural with road Rural - No road Lowland Upland Plateau Mixed lands na 14.3 na Figure 8.7: Major types of irrigation infrastructure in the villages Gabions Temporary weirs Gates & dykes Lao PDR Southern Central Northern Pump schemes Reservoirs Permanent weirs While the availability of pump schemes was reported mostly from the lowland villages and villages located in the Southern and Central provinces, gabions 34 formed the major secondary 34 Gabions are wire fabric containers that are filled with stone at the site of use for riverbank slope protection and other protection purposes. The most common civil engineering use of gabions is to stabilize shorelines, stream banks or slopes against erosion. Other uses include retaining walls, temporary floodwalls, silt filtration from runoff, small temporary or permanent dams, river training, or channel lining. They may be used to direct the
166 source of irrigation, after weirs, in villages located in the plateau areas of the Northern provinces. Very few villages have access to reservoirs (7.5% in Central region, 2.4% in the Northern region and 1.5% in the Southern region). Villages without road connectivity are also particularly constrained by lack of irrigation infrastructure; 25 percent of these villages reported temporary weirs as the major source of water supply, with very limited access to pump schemes and permanent weirs. There are notable differences in the availability of irrigation infrastructure across provinces. For instance, a majority of the villages in the Northern and Central provinces have greater access to permanent and temporary weirs, while some villages in three of the Central provinces Vientiane Capital (17%), Vientiane Province (10%) and Savannakhet (8%) as well as in Xayabury (9%) in the North, have somewhat better access to reservoirs. Access to pump schemes is also quite limited. Villages with some such access are located in the Central provinces of Vientiane Capital (36.7%), Khammuane (17%), Savannakhet (19%), Borikhamxay (8.9%) and Vientiane Province (6%), and in the Southern provinces of Champasack (27.5%), Attapeu (8.7%) and Sarvane (7.8%). In the Northern region, 10 percent of villages in Xayabury province have pump schemes in the villages. Financial institutions and credit facilities About 44 percent of rural villages have access to some form of credit facilities, with only marginal variation across the three regions (Table 8.10). Again, the availability of road connectivity is an important factor. While almost 47 percent of the villages with road connectivity have access to credit facilities, only 31 percent of the villages without road connectivity have access to such facilities. Access to credit facilities is also reported to be lower in upland (39%) and mixed land (36%) villages, compared to those in plateau (51%) and lowland areas (45%). The two major sources of credit reported were VDFs (32%) and public banks (17%). Table 8.10: Availability and types of credit facilities in rural villages, 2010/11 Region/village type/ land type Rural villages with credit facilities (%) Type of credit facility (% of rural villages) Public bank Private bank MFI VDF Northern Central Southern Lao PDR Rural with road Rural - No road Lowland Upland Plateau Mixed land na na 35.7 force of a flow of floodwater around a vulnerable structure. Gabions are also used as fish barriers on small streams
167 The largest proportion of villages with access to credit facilities is in Vientiane Capital, and the lowest proportions are found in Sekong, Savannakhet and Huaphanh (Figure 8.8). The vast majority of the rural villages have no access to any formal and informal credit institutions other than public banks and VDFs. Only four provinces reported some proportion of villages with availability of credit support linked to MFIs, i.e. Luangnamtha (17%), Xayabury (14%), Oudomxay (5%) and Vientiane Province (4%). Figure 8.8: Villages with access to credit (%), 2010/11 Villages with access to credit (%) Phongsaly Luangnamtha Oudomxay Bokeo Luangprabang Huaphanh Xayabury Vientiane Cap. Xiengkhuang Vientiane Pr. Borikhamxay Khammuane Savannakhet Saravane Sekong Champasack Attapeu Agricultural marketing facilities Most rural villages in Lao PDR engage in some market transactions and almost 90 percent of the villages sold some part of their agricultural produce (Table 8.11). However, villages located in areas without road connectivity and those in the uplands had relatively fewer market transactions. Table 8.11: Marketing of agricultural produce in the rural villages, 2010/11 Region/village type/land type (%) Villages selling agri. produce Sell directly in village market Agricultural produce marketing (% of villages) Sell directly Contract Sell through brokers in to processing farming companies Own village Other villages North Central South Lao PDR Rural with road Rural - No road Lowland Upland Plateau Mixed land
168 As shown in the above table, marketing of agricultural produce is done through multiple channels: (a) direct sale in the village local market (33% of villages nationally); (b) buy-back arrangements through contract farming (14%); (c) direct sales to processing companies (6%); and (d) selling through intermediaries/brokers in the same village (54%) or nearby villages (71%). The utilization of different channels for marketing of agricultural produce, such as contract farming or direct sales to processing companies, reflects the degree of commercialization of agriculture. Contract farming practices are much more prevalent in the villages in the Northern provinces (25%), compared with Central (7%) and Southern (4.6%) regions. Four Northern provinces Luangnamtha, Bokeo, Phongsaly, Oudomxay have emerged as focal points of contract farming for a variety of reasons. First, since the early 1990s, trade relations with China and Thailand have enhanced the flow of investment and goods into Northern Lao PDR. Second, commercialization of upland agricultural production as an alternative to shifting cultivation is being promoted by the government to alleviate rural poverty among the upland communities. Third, these four provinces, in particular, are currently growing many of the high-value commercial crops, i.e. rubber, soybean, sugar cane, maize, tea, cassava and groundnut, as well as rice, under contract farming systems (Thongmanivong, et al., 2006; Setboonsarng, et al, 2008). Direct selling is quite rare, with only 11.5 percent of villages engaged in such sales in the Southern provinces (11.5%) and an even lower proportion (4%) in the Central and Northern provinces. Agricultural marketing practices in villages without road connectivity differ significantly from those in villages with road connectivity. This contrast can be seen in terms of relatively lower proportions of villages engaged in the following practices: (a) sales of agricultural produce (78% in villages without road connectivity, compared with 92% in villages with road access); (b) direct sale in the village markets (23% compared with 36%); (c) contract farming (5% compared with 16%) and sales to agricultural processing companies (2% compared with 6%); and (d) sales through intermediaries in own village (39% compared with 57%) and other villages (64% compared with 73%). Upland villages reported marginally more contract farming practices (15%) in comparison with lowland villages (10%). The proportion of villages reporting direct sales in the village markets is also relatively lower in upland villages (23%) compared with villages located in other geographical locations, especially the lowlands (44%). The scenario of agricultural marketing practices across provinces is presented in Appendix 7.2. It may be observed that the proportion of villages engaged in contract farming is relatively higher in several of the Northern provinces (up to 52%) compared with Central (up to 25%) and Southern (up to 6%) provinces. The presence of agricultural processing facilities is reported from four provinces; villagers are selling agricultural produce to processing companies in Vientiane Capital (15%), Sarvane (14.7%), Champasack (13%) and Luangnamtha (11.6%). In the remaining provinces, villages selling agricultural produce to processing companies were in the range of 2 percent in Sekong to 7 percent in Borikhamxay. Rural development projects The Government of Lao PDR, through its National Socio-Economic Development Plan
169 (NSEDP), has implemented several development programmes focusing on growth with equity, as well as on poverty reduction, while promoting economic development and regional integration (UNDP, 2007). In addition, a large number of development projects supported by national as well as international development agencies, such as the United Nations Development Programme (UNDP), United Nations Educational, Scientific and Cultural Organization (UNESCO) and the World Health Organization (WHO), are also underway in the country. To record the presence of such development projects in the rural villages, the LCA 2010/11 examined two important aspects: (a) the presence and types of various development projects pertaining to crops, livestock, fisheries, forestry, reduction of slash-and-burn cultivation and environmental protection; and (b) the source of funding for such development projects, e.g. government funds, domestic private funds, foreign private funds, NGOs. The status of development projects reported from the villages is presented in Table Table 8.12: Presence of rural development projects by sector in the villages, 2010/11 Sector (% of rural villages) Region/village Villages type/land type with projects Control of shifting Environmental Crops Livestock Fisheries Forestry cultivation protection North Central South Lao PDR Rural with road Rural No road Lowland Upland Plateau Mixed land na These data indicate that development projects are present in around half of the rural villages, with Central provinces reporting a somewhat higher proportion (55%) and Southern provinces reporting the lowest (43%). A significant number of development projects are present in upland villages (53.6%) and in villages without road connectivity (42%), which suggests that development projects are distributed fairly evenly across villages irrespective of location. A majority of the development projects are focused on agricultural development, specifically crops (34%), livestock (30%), control of shifting cultivation practices (20%) and environmental protection (14%). Across regions, there were some differences with respect to availability of these projects. Projects related to the forestry and fisheries sectors have also been reported from some villages, although these are more limited in scope. Villages without road connectivity have fewer development projects in all sectors, compared with villages that have road access. Furthermore, compared with villages in the lowlands and mixed land terrains, villages in the uplands and plateau reported greater access to

170 development projects, especially those focused on crops, livestock, control of shifting cultivation and forestry. Further investigation is required to ascertain the specific nature and types of development projects undertaken within a sector. Appendix 8.3 illustrates the status of the village development projects across the various provinces. It emerges that, by and large, these development projects cater to the specific requirements of the village communities in the respective provinces. For instance, projects related to crops and livestock are common in all the provinces, while projects related to the fisheries and forestry sectors tend to be concentrated in a few provinces. Development projects intended to promote control of shifting cultivation and environmental protection also show marked difference across provinces and reflect the intensity of the problems in those locations. Figure 8.9: Source of funding for development projects in the villages Government Domestic private Foreign private NGO North Central South Lao PDR Rural with road Source of funding (%) Rural - No road Lowland Upland Plateau Mixed land As illustrated in Figure 8.9, government agencies form the major source of funding for most of the development projects across all regions. Villages in the Northern provinces appear to receive relatively less support from government-sponsored projects, and the majority of the villages that do receive government support are located in villages with road connectivity. Generally, the villages receiving project funds from private domestic and private foreign sources are located in the lowland, upland and plateau terrains and they are also villages with better road connectivity. Development NGOs constitute the major source of project support in a large number of upland and plateau villages and villages without road connectivity. Living standards in the villages Lao PDR has achieved significant economic growth over the past two decades, which resulted in a notable decline in the overall level of poverty. The proportion of the population living in poverty declined from 46 percent in 1992 to 25.6 percent in 2009/10 (GoL/UN 2010). However, despite the improvement in income, the overall living standards in rural 149
.")
171 villages remain still far from satisfactory. 35 In general, poverty levels are higher in rural villages than the cities, and higher in localities without roads than in those with roads. The poorer population is also heavily concentrated in upland areas, which are inhabited largely by ethnic groups (GoL/ UN, 2008). In this section we discuss the assessment of living standards in the villages reported in the LCA 2010/11, based on perceptions of the village heads in reply to the question of whether they considered that living standards in the village had improved over the previous two years. Figure 8.10 summarizes the responses of village heads with respect to changes in living standards in their villages over the two years prior to the LCA 2010/11. Figure 8.10: Changes in living standards in the rural villages, 2010/ North Central South Lao PDR Rural with road Rural - No road Lowland Upland Plateau Villages (%) Mixed lands Improved Remain same Declined Over 80 percent of village heads reported that living standards had improved during the previous two-year period, with a larger proportion holding that view in the Central and Northern provinces, compared with the South. Some village heads, particularly in the Southern region (see Figure 8.11), considered that living standards had actually declined. The perception about improvements in living standards seems to be linked to road connectivity; most of those who considered that living standards had not improved were village heads from villages lacking road connectivity. This is not surprising and highlights the importance of road access for village economies. As described earlier, many developmentrelated factors at village level are also correlated with road connectivity. According to the village heads, gender wage differences tended to be marginal, and there was wage equality in the majority of villages in the country (67%). But the proportion of villages with wage equality was lower among villages without road connectivity, and in upland and mixed-land villages (Figure 8.12). 35 In 2010, per capita GDP stood at USD 1 176, up from USD 326 a decade earlier (WB 2012). Even so, poverty remains an important issue, with 33% of the population living on less than USD 1.25per day (UNDP 2011, as cited in MAF, 2013: 22). 150
 0.0 10.0 20.0 30.0 40.0 50.0 Figure 8.")

172 Figure 8.11: Villages reporting no change or a decline in living standards, 2011 Attapeu Champasack Sekong Saravane Savannakhet Khammuane Borikhamxay Vientiane Pr. Xiengkhuang Vientiane Cap. Remain same Decline Xayabury Huaphanh Luangprabang Bokeo Oudomxay Luangnamtha Phongsaly Villages (%) Figure 8.12: Gender wage equality across regions and type of villages Villages (%) North Central South Lao PDR Rural with road Rural - No road Lowland Upland Plateau Mixed lands While gender wage equality was reported from a majority of the villages in all the Central region provinces (except Xiengkhuang), the scenario in the Southern and Northern provinces was quite different (Figure 8.13). The proportion of villages reporting equality in male and female wages was the lowest in Sekong province (23%) in the South and Huaphanh (41%) in the North. It is noted that these two provinces lag behind the rest of the provinces in most of the indicators at the village level and are the two poorest provinces in Lao PDR, with poverty ratios of 52 percent (Sekong) and 51 percent (Huaphanh) during 2007/08. They also rank as the most deprived in terms of 151
.")
173 year-round road access, access to health facilities, connection to the electricity grid and other infrastructure. Sekong has an average household size of 7.4; in Huaphanh the average household size is 5.7 (national average being 5.4). The two provinces also rank the lowest in terms of annual per capita income: Sekong reported an income of USD 412 per capita/per year and Huaphanh reported USD 397 per capita, in contrast to the national average of during the period Dependency ratios 36 per working age groups (15-64 years) are also very high in these two provinces: 94 in Sekong and 85 in Huaphanh, compared with the national average of 62 (Lao Statistics Bureau, 2012). In contrast, an overwhelming majority of the villages reported high percentages of gender wage equality in four provinces, i.e. Xayabury and Vientiane Capital (91% each), Champasack (87%) and Vientiane Province (86%). While these responses from the village heads are useful, given the importance of this issue, further empirical testing and confirmation is needed, based on micro-level analysis in the context of villages and farm households. Figure 8.13: Gender wage equality in the villages across provinces Villages (%) Phongsaly Luangnamtha Oudomxay Bokeo Luangprabang Huaphanh Xayabury Vientiane Cap. Xiengkhuang Vientiane Pr. Borikhamxay Khammuane Savannakhet Saravane Sekong Champasack Attapeu Constraints and problems faced by farmers The village heads in rural villages were also asked to comment on the major constraints and developmental problems faced by the farmers in their respective villages. As evident from Figure 8.14, the major problems faced by the farmers were: (a) lack of irrigation (59% of villages); (b) lack of farm inputs (43%); (c) lack of livestock vaccination (40%); (d) low agricultural commodity prices (38%); (e) lack of land for expansion of farming (29%); (f) lack of markets (24%); (g) lack of draught animals and farm machinery (16%); and (h) lack of farm labour (10%). 36 Dependency Ratio is an index defined as the percentage of the population in the younger (0-14) and older (65+) age groups to the population in the age group 15-64, i.e. people not supposed to be economically active in relation to people in their economically active years. 152

174 Figure 8.14: Major constraints and problems faced by farmers in the villages Lack of labour Lack of draughts & machinery Lack of markets Lack of land Low commodity prices Lack of vaccination Lack of inputs Lack of irrigation Constraints & problems faced by villages (%) Compared to Northern and Central provinces, a higher proportion of villages in the South reported suffering from lack of inputs, lack of irrigation facilities, lack of labour, lack of draught animals and farm machinery, and lack of livestock vaccination (Table 8.13). Many of these problems tend to be more acute in villages without road connectivity and in upland villages. (Appendix 8.4 presents a more detailed picture of the major constraints and problems faced by the provinces.) Table 8.13: Major constraints and problems faced by farmers in the villages Region/village type/land type Percentage of rural villages reporting constraints/problems related to: Draught animals & Land Farm Inputs Irrigation Labour Markets machinery Vaccination Low commodity prices North Central South Lao PDR Rural with road Rural - No road Lowland Upland Plateau Mixed lands Climatic variability and natural disasters Because Lao PDR faces challenges posed by climate change-induced risks and natural disasters, in the LCA 2010/11 the village heads were asked for their assessments of the changes in weather conditions over the past ten-year period. Table 8.14 presents a summary of the responses. Clearly, most village heads throughout the country felt that there was both lower rainfall and delayed onset of the wet season. Again, these perceptions provide useful information, although they should be further verified through detailed analysis of long-term meteorological data on the patterns of rainfall and its 153
175 temporal distribution to arrive at more meaningful conclusions about changing climate patterns across the country. Table 8.14: Changes in weather conditions in rural villages by region, village and land type, 2010/11 Region/village / land type Recent years' wet season rainfall Recent years' wet season timing 2010 wet season rainfall Wetter Earlier Same time Dryer Same Same as than than as Later than than as normal normal normal normal normal normal normal Dryer than normal Wetter than normal North Central South Lao PDR Lowland Upland Plateau Mixed land The incidence of natural disasters, including floods, droughts and landslides, as well as the occurrence of pests, as reported by the village heads, is presented in Table Most villages (84% nationally, and almost all villages in the Southern region) reported that they were prone to natural disasters, with droughts and pests being the most common of these, followed by floods and landslides. Table 8.15: Incidence of natural disasters in the villages as reported by village heads Region/village/ land Villages prone to Percentage of villages prone to type natural disasters (%) Floods Droughts Landslides Pests North Central South Lao PDR Rural with road Rural - No road Lowland Upland Plateau Mixed land Landslides are more common in the Northern provinces. It was also reported that the frequency of natural disasters, especially floods, droughts and pests, had increased in recent years in a majority of villages. The incidence and frequency of natural disasters in the provinces as reported in the villages are presented in Appendix 8.5. Conclusion In summary, this chapter provides a holistic view of the rural villages in Lao PDR, including: (a) the availability of various infrastructure facilities, such as roads, irrigation, agricultural 154
176 development, rural markets, institutional and financial supports; and (b) the human-induced environmental and natural hazard-related threats and challenges (deforestation, shifting cultivation and presence of UXOs, to mention a few). The discussion clearly brings out important changes in farming practices in the villages, which include a shift towards contract farming as well as the adoption of high-value commercial crops, especially in the Northern provinces, to take advantage of the market opportunities. Agricultural marketing is also being transformed, as a larger share of farm produce is sold in markets within or outside villages. Many villages also reported active participation by government agencies in the implementation of development projects in the areas of crop promotion, strengthening of the fisheries and forestry sectors, control of slashand-burn agriculture and environmental protection. An overwhelming majority of the village heads also reported significant improvement in the living standards of villages in recent times. At the same time, the data also reveal that most villages continue to face severe constraints in terms of availability of infrastructure and institutional facilities. The vast majority of the villages suffer from poor access to public goods, services and facilities such as roads, primary health care, irrigation infrastructure, markets and schools. They lack technical knowledge about new crops and crop varieties, and about farming practices. A low asset base and minimal access to well-developed insurance, financial and agricultural extension support services leave farming communities and households ill-equipped to deal with the changes taking place in the agrarian landscape in the country. The village-level analysis also highlights the growing concerns regarding the changing weather conditions affecting future prospects of agriculture. In this regard, two important challenges affecting the villages are: (a) changes in the rainfall pattern, with lower amounts of wet season rainfall than in previous years; and (b) early or late arrival of the rainy season. Increasing incidences of natural hazards are also widely reported, with a majority of the villages highly vulnerable to frequent floods, droughts, landslides and pest outbreaks. The evolving agrarian scenario indicates immense opportunities and scope for further expansion while also facing challenges from changing climate conditions and the incidence of natural hazards. It is all the more important, therefore, that both national and provincial agricultural development policies and interventions be streamlined to strengthen and equip the rural villages to move forward along the path of sustainable growth. 155
 Deep borehole (closed) in Lao PDR,")
 Rainwater tank/jar in Lao PDR, (4)")

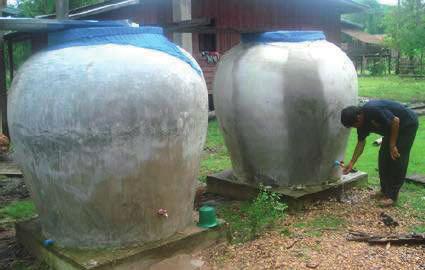
177 Chapter 8 appendices (1) (2) (3) (4) Appendix 8.1: (1) Deep borehole (closed) in Lao PDR, (2) Lao girl collecting water from Mekong, (3) Rainwater tank/jar in Lao PDR, (4) Gravity-fed water tap in Lao PDR Source: 0-%20Rural%20Water%20Supply%20in%20the%20Lao%20PDR.pdf 156
Gender in the Lao PDR on the agriculture sector
 Gender in the Lao PDR on the agriculture sector By: Mr. porha SAYCHOUNORSOUA Staff of the Center for Statistics and Information (CSI), Department of Planning and Cooperation, MAF and Ms Samta Sacktikun
Economic Change in Lao Agriculture: The Impact of Policy Reform
 Page 1 of 5 Economic Change in Lao Agriculture: The Impact of Policy Reform Peter G. Warr 1 Abstract Since implementation of economic reforms in the Lao PDR, beginning about 1990, rice output has grown
Lao PDR Country Paper Current Status of Agriculture Mechanization and Marketing
 Lao PDR Country Paper Current Status of Agriculture Mechanization and Marketing The 2nd Regional Forum on Sustainable Agricultural Mechanization - Enabling Environment for Custom Hiring of Agricultural
Intercropping with Rubber for Risk Management
 Intercropping with Rubber for Risk Management Rubber is expected to become the Lao PDR's number one export. Chinese and Vietnamese investors are involved in a number of projects after consultation with
Lao People s Democratic Republic. Global Agriculture and Food Security Program
 Lao People s Democratic Republic Global Agriculture and Food Security Program (Third Call for proposals) Strategic Support for Food Security and Nutrition Ministry of Agriculture and Forestry, Lao PDR
MAIN REPORT of SOCIO ECONOMIC BASELINE SURVEY (SEBS) AND PARTICIPATORY RURAL APPRAISAL (PRA)
 AND PARTICIPATORY RURAL APPRAISAL (PRA)") FOOD AND AGRICULTURE ORGANIZATION OF THE UNITED NATIONS - ROME Special Programme for Food Security (SPFS Project GCSP/INS/073/JPN) MAIN REPORT of SOCIO ECONOMIC BASELINE SURVEY (SEBS) AND PARTICIPATORY
FOOD AND AGRICULTURE ORGANIZATION OF THE UNITED NATIONS - ROME Special Programme for Food Security (SPFS Project GCSP/INS/073/JPN) MAIN REPORT of SOCIO ECONOMIC BASELINE SURVEY (SEBS) AND PARTICIPATORY
A data portrait of smallholder farmers
 A data portrait of smallholder farmers An introduction to a dataset on small-scale agriculture The Smallholder Farmers Dataportrait is a comprehensive, systematic and standardized data set on the profile
The Central Role of Agriculture in Myanmar s Economic Development
 The Central Role of Agriculture in Myanmar s Economic Development Duncan Boughton, Professor, International Development, MSU Ben Belton, Assistant Professor, International Development, MSU Steven Radelet,
CONTRACT FARMING IN VIETNAM
 CONTRACT FARMING IN VIETNAM Nguyen Ha Hue National Institute of Agricultural Planning and Projection, Ministry of Agriculture and Development, Vietnam CONTENTS 1. BACKGROUND 2. OVERVIEW OF CONTRACT FARMING
Laos Country Report on Environmental Management in the Lao PDR Mining Sector. International Conference A Greater Mekong?
 Lao People s Democratic Republic Peace Independence Democracy Unity Prosperity Laos Country Report on Environmental Management in the Lao PDR Mining Sector International Conference A Greater Mekong? Poverty,
Fact sheet: Mauritania - Women, agriculture and rural development
 Fact sheet: Mauritania - Women, agriculture and rural development Population: 2.1 million Growth rate: 2.7 % Fertility rate: 6.8 IMR: 117/1000 births GNP/head: US$ 530 Source: World Bank Atlas, 1994. Contents
Status of climate change adaptation in agriculture sector for Lao PDR.
 Status of climate change adaptation in agriculture sector for Lao PDR. 1 st Rhine-Mekong Symposium Climate change and its influence on water and related sectors 8-9 May 2014, Koblenz, Germany Vanxay, DDMCC
Agriculture in China - Successes, Challenges, and Prospects. Prof. Zhihao Zheng College of Economics & Management China Agricultural University
 Agriculture in China - Successes, Challenges, and Prospects Prof. Zhihao Zheng College of Economics & Management China Agricultural University I. Success 1. For the past three decades (1978-2010), China
Reconsidering structures in production dynamics: methodological insights from World Agriculture Watch and preliminary elements on Indonesia
 JOURNEE FILIERE PALMIER A HUILE Montpellier, 9 juillet 2012 SPOP ANR 2012 2015 Reconsidering structures in production dynamics: methodological insights from World Agriculture Watch and preliminary elements
Special Seminar on Food Security: Focusing on Water management and Sustainable Agriculture
 Special Seminar on Food Security: Focusing on Water management and Sustainable Agriculture Kyi Myint Ministry of Agriculture and Irrigation Location Latitude 9 58-28 31 N Longitude 92 9-100 10 E Country
Agriculture in Hungary, 2010 (Agricultural census) Preliminary data (1) (Based on processing 12.5% of questionnaires.)
 Preliminary data (1) (Based on processing 12.5% of questionnaires.)") December 2013 Agriculture in Hungary, 2010 (Agricultural census) Preliminary data (1) (Based on processing 12.5% of questionnaires.) Contents Introduction...2 Summary...3 Number of holdings...4 Type of
December 2013 Agriculture in Hungary, 2010 (Agricultural census) Preliminary data (1) (Based on processing 12.5% of questionnaires.) Contents Introduction...2 Summary...3 Number of holdings...4 Type of
Differentiating Four livestock Production Systems
 4 Differentiating Four livestock Production Systems Learning Objectives: Understanding The four major livestock production systems The characteristics of the four major livestock production systems in
Targeting the rural poor. The Participatory Wealth Ranking System
 Targeting the rural poor The Participatory Wealth Ranking System IFAD Cambodia Country Programme: Lessons Learned and Emerging Best Practices Year 2010 Targeting the rural poor IFAD in Cambodia Since 1996,
FORESTS, DEVELOPMENT, AND CLIMATE ACHIEVING A TRIPLE WIN
 FORESTS, DEVELOPMENT, AND CLIMATE ACHIEVING A TRIPLE WIN THE FOREST INVESTMENT PROGRAM (FIP), a funding window of the CIF, provides indispensable direct investments to benefit forests, development and
Country Paper Lao PDR RESILIENCE TO CLIMATE CHANGE IN UPLAND LAO PDR. Presented by Vansy Senyavong
 Country Paper Lao PDR RESILIENCE TO CLIMATE CHANGE IN UPLAND LAO PDR Presented by Vansy Senyavong (Director of MHP) Workshop: Indigenous Women, Climate Change and Reducing Emissions from Deforestation
Agriculture: Engine of Rural Economic Growth in Myanmar. Duncan Boughton, Aung Hein and Ben Belton Yangon, December 8, 2015
 Agriculture: Engine of Rural Economic Growth in Myanmar Duncan Boughton, Aung Hein and Ben Belton Yangon, December 8, 2015 Why focus on rural economic growth? Agriculture makes many contributions to the
Publisher. Design. Distribution
 2 Publisher Federal Office for Agriculture FOAG CH-3003 Bern Phone: -41 (0) 58 462 25 11 Fax: -41 (0) 58 462 26 34 Internet: www.agrarbericht.ch Copyright: FOAG, Bern 2016 Design Panache AG, Bern Distribution
Global Perspectives on Agricultural Injury Prevention: Case Study China
 Global Perspectives on Agricultural Injury Prevention: Case Study China Lorann Stallones, MPH, PhD, FACE Professor, Department of Psychology Colorado State University After 3 days, you need water or you'll
System of Environmental Economic Accounting for Agriculture (SEEA AGRI)
") November 2013 System of Environmental Economic Accounting for Agriculture (SEEA AGRI) A measurement framework for agri-environmental Indicators and analysis Carl Obst, Silvia Cerilli Consultants to FAO
November 2013 System of Environmental Economic Accounting for Agriculture (SEEA AGRI) A measurement framework for agri-environmental Indicators and analysis Carl Obst, Silvia Cerilli Consultants to FAO
G R E E N H O U S E G A S M I T I G A T I O N A G R I C U L T U R E A N D F O R E S T R Y S E C T O R S
 VIETNAM G R E E N H O U S E G A S M I T I G A T I O N A G R I C U L T U R E A N D F O R E S T R Y S E C T O R S Overview of Sector In 2006 agriculture, ry, and fisheries accounted for 20 percent of the
Chakrapong Chaikong (Autor) Comparisons of beef buffalo and beef cattle production systems in northeastern Thailand
 Comparisons of beef buffalo and beef cattle production systems in northeastern Thailand") Chakrapong Chaikong (Autor) Comparisons of beef buffalo and beef cattle production systems in northeastern Thailand https://cuvillier.de/de/shop/publications/708 Copyright: Cuvillier Verlag, Inhaberin
Chakrapong Chaikong (Autor) Comparisons of beef buffalo and beef cattle production systems in northeastern Thailand https://cuvillier.de/de/shop/publications/708 Copyright: Cuvillier Verlag, Inhaberin
Unofficial Translation. The Prime Ministerial Decree on The Organization and Functionalities of the Ministry of Agriculture and Forestry
 The Prime Minister Lao People s Democratic Republic Peace Independence Democracy Unity Prosperity ------xxxx00000xxxx------ No.99/PM Vientiane Capital, dated 09.03.2017 The Prime Ministerial Decree on
FSC Brief No Summary. 2. Introduction and background. 3. Main challenges
 Demand for livestock enterprises for employment creation and food security for farm households in vulnerable regions of Bangladesh Livestock is one of the major assets of rural households for livelihood
Assessment of Economic, Social and Environmental Costs and Benefits of Dak Lak Rubber Plantations: Case Study in Saravan Province
 Assessment of Economic, Social and Environmental Costs and Benefits of Dak Lak Rubber Plantations: Case Study in Saravan Province Prepared by: Photo: NERI International Union for Conservation of Nature
SECTOR ASSESSMENT (SUMMARY): Agriculture and Natural Resources. 1. Sector Performance, Problems, and Opportunities
: Agriculture and Natural Resources. 1. Sector Performance, Problems, and Opportunities") Samoa AgriBusiness Support Project (RRP SAM 46436) SECTOR ASSESSMENT (SUMMARY): Agriculture and Natural Resources Sector Road Map 1. Sector Performance, Problems, and Opportunities 1. Overview. Samoa s
Samoa AgriBusiness Support Project (RRP SAM 46436) SECTOR ASSESSMENT (SUMMARY): Agriculture and Natural Resources Sector Road Map 1. Sector Performance, Problems, and Opportunities 1. Overview. Samoa s
Malawi Agriculture and Food Security
 Malawi Agriculture and Food Security By Timothy Gondwe 1 and Mizeck Chagunda 2 1 Lilongwe University of Agriculture and Natural Resources (LUANAR) 2 SRUC (Scotland s Rural College) Presented at the Scotland
Government of Uganda, United Nations Development Programme (UNDP) And World Bank
 And World Bank") Government of Uganda, United Nations Development Programme (UNDP) And World Bank Brief description Project title: The Poverty and Social Impact Analysis (PSIA) of the Proposed National Land Use Policy
Government of Uganda, United Nations Development Programme (UNDP) And World Bank Brief description Project title: The Poverty and Social Impact Analysis (PSIA) of the Proposed National Land Use Policy
The Livelihoods and Food Security Trust Fund in Myanmar
 The Livelihoods and Food Security Trust Fund in Myanmar ACKNOWLEDGEMENTS LIFT thanks the governments of Australia, Denmark, the European Union, France, Ireland, the Netherlands, New Zealand, Sweden, Switzerland,
September Expert Consultation on Statistics in Support of Policies to Empower Small Farmers. Bangkok, Thailand, 8-11 September 2009
 Agenda item 5 STAT-EMPOWER-8 September 2009 Expert Consultation on Statistics in Support of Policies to Empower Small Farmers Bangkok, Thailand, 8-11 September 2009 STRATEGIES IN MEETING THE STATISTICAL
The Rice Economy in Myanmar and Relevance for the Delta
 The Rice Economy in Myanmar and Relevance for the Delta Keynote Presentation by Francesco Goletti Agrifood Consulting International (ACI) Roundtable Meeting on Rice Sector in the Lower Delta: Creating
Key messages of chapter 3
 Key messages of chapter 3 With GHG emissions along livestock supply chains estimated at 7.1 gigatonnes CO 2 -eq per annum, representing 14.5 percent of all human-induced emissions, the livestock sector
AGRICULTURAL BIODIVERSITY I N L A O P D R
 Photo: FAO/IPM Project AGRICULTURAL BIODIVERSITY I N L A O P D R Photo: FAO/P Balzer its importance and contribution to food security, sustainable livelihoods and nutrition Human beings manage and depend
RESEARCH REPORT YEARLY FUND, 2010 OPTIMALIZATION OF AGRICULTURAL RESOURCES AT DRY LAND AGRO-ECOSYSTEM
 RESEARCH REPORT YEARLY FUND, 2010 OPTIMALIZATION OF AGRICULTURAL RESOURCES AT DRY LAND AGRO-ECOSYSTEM By : Henny Mayrowani Sumaryanto Delima Hasri Azahari Nyak Ilham Supena Friyatno Ashari INDONESIAN CENTER
Unit 3. The primary sector
 Unit 3. The primary sector - Economic activities devoted to obtaining resources directly from nature. Agrarian space - Agrarian space: land where agrarian activities are undertaken - Rural space: non urban
Swiss agriculture, agricultural policy and biodiversity
 Department for Economic Affairs DEA Federal Office for Agriculture FOA Swiss agriculture, agricultural policy and biodiversity BioBio, Engelberg, 21 June 2012 Dominique Kohli, Assistant Director of the
Subnational Purchasing Power Parities: Integrating International Comparison Program and Consumer Price Index in Asia 1
 Subnational Purchasing Power Parities: Integrating International Comparison Program and Consumer Price Index in Asia 1 Eileen Capilit* Asian Development Bank, Manila, Philippines ecapilit@adb.org Yuri
AGRICULTURE CENSUS IN INDIA
 AGRICULTURE CENSUS IN INDIA U.C. Sud Indian Agricultural Statistics Research Institute, New Delhi-110012 Introduction Agriculture sector forms an important component of the Indian economy. The contribution
4.2.2 A survey of adoption of improved forages in Southeast Asia
 4.2.2 A survey of adoption of improved forages in Southeast Asia Contributors: Werner Stür (CIAT), Phonepaseuth Phengsavanh (CIAT / NAFRI), Francisco Gabunada (CIAT/Leyte State University), Peter Horne
YEMEN PLAN OF ACTION. Towards Resilient and Sustainable Livelihoods for Agriculture and Food and Nutrition Security SUMMARY
 YEMEN PLAN OF ACTION Towards Resilient and Sustainable Livelihoods for Agriculture and Food and Nutrition Security 2014 2018 SUMMARY INTRODUCTION Yemen, one of the least developed countries in the world,
Copyright is owned by the Author of the thesis. Permission is given for a copy to be downloaded by an individual for the purpose of research and
 Copyright is owned by the Author of the thesis. Permission is given for a copy to be downloaded by an individual for the purpose of research and private study only. The thesis may not be reproduced elsewhere
NATIONAL UNIVERSITY OF LAOS
 NATIONAL UNIVERSITY OF LAOS 1 BACKGROUND The NUOL was established on 5 th November 1996 There are 11 faculties, 2 institutes, 1 library, 5 centers, 10 offices, 1 hospital, and a talented school The current
Socio-economic Indicators for Vulnerability Assessment in the Arab Region
 Socio-economic Indicators for Vulnerability Assessment in the Arab Region Tarek Sadek Water Resources Section Sustainable Development & Productivity Division-ESCWA Presentation outline Concepts of vulnerability
Investing in rural people in India
 IFAD/Susan Beccio Investing in rural people in India India s population of approximately 1.3 billion people is composed of several ethnic groups, speaking over 1,000 languages and adherent to six major
The Role of Technology in Enhancing Livelihood Support Options
 The Role of Technology in Enhancing Livelihood Support Options Kennedy Onyango Director - Community Initiatives and Social Support Organization (CISSO) cisso@africamail.com BACKGROUND OF THE PAPER: Achieving
Market Overview Vietnam
 MARKET ACCESS SECRETARIAT Global Analysis Report Market Overview Vietnam August 2016 MARKET SNAPSHOT Vietnam had a gross domestic product (GDP) of US$193.4 billion in 2015, which is expected to grow by
Rural Poverty and Agricultural Water Development in Sub-Saharan Africa
 CHAPTER 1 Rural Poverty and Agricultural Water Development in Sub-Saharan Africa 1.1 The Millennium Development Goals, Agricultural Growth, and Rural Poverty In 2, the Millennium Declaration committed
SOUTH AFRICA - Agricultural Survey Main Results
 SOUTH AFRICA - Agricultural Survey 2000 - Main Results Number and area of holdings ( farming operations) Number of holdings Area (ha) Total 1 093 000 315 128 000 Former RSA (Rep. of South Africa) 150 000
Gender Control and Labour Input: Who Controls the Proceeds from Staple Crop Production among Zambian Farmers? Arthur M. Shipekesa and T.S.
 Gender Control and Labour Input: Who Controls the Proceeds from Staple Crop Production among Zambian Farmers? by Arthur M. Shipekesa and T.S. Jayne Working Paper 68 September 2012 Indaba Agricultural Policy
Thematic Studies for Gender in Aquaculture in Cambodia, Lao PDR, Thailand and Vietnam
 Thematic Studies for Gender in Aquaculture in Cambodia, Lao PDR, Thailand and Vietnam Truong Hoang MINH and Nguyen Thi Kim QUYEN College of Aquaculture and Fisheries Can Tho University, Can Tho City, Vietnam
ACIAR POLICY BRIEF. Research findings with policy implications
 ACIAR POLICY BRIEF Research findings with policy implications GROUNDWATER FOR IRRIGATION IN LAO PDR Promoting sustainable farmer-managed groundwater irrigation technologies for food security, livelihood
PAREDD Participatory Land and Forest Management Project for Reducing Deforestation in Lao PDR
 Ministry of Agriculture and Forestry-Lao PDR Japan International Cooperation Agency PAREDD Participatory Land and Forest Management Project for Reducing Deforestation in Lao PDR working together with communities
Thematic Studies for Gender in Aquaculture in Cambodia, Thailand and Vietnam
 Thematic Studies for Gender in Aquaculture in Cambodia, Thailand and Vietnam Dr. Kao Sochivi, Deputy Director General of Fisheries Administration Mr. Sovityea Kao, Research and Climate Change-TOT, FiA
Summary Sheet for Terminal Evaluation
 Summary Sheet for Terminal Evaluation 1. Outline of Project Country: Republic of Benin Issue/Sector: Fishery sector Division in charge: Rural Development Department Period of Cooperati on May 2010 to May
Increasing food security and farming system resilience in East Africa through wide-scale adoption of climate-smart agricultural practices
 Increasing food security and farming system resilience in East Africa through wide-scale adoption of climate-smart agricultural practices Mixed crop-livestock systems provide livelihoods for two thirds
The Agricultural Integrated Survey (AGRIS) Producing cost-efficient data on farms for policymaking
 Producing cost-efficient data on farms for policymaking") The Agricultural Integrated Survey (AGRIS) Producing cost-efficient data on farms for policymaking The Agricultural Integrated Survey (AGRIS) AGRIS: A response to current data needs Better data, to track
The Agricultural Integrated Survey (AGRIS) Producing cost-efficient data on farms for policymaking The Agricultural Integrated Survey (AGRIS) AGRIS: A response to current data needs Better data, to track
Philippine Agricultural and Food Policies: Implications on Poverty and Income Distribution
 Philippine Agricultural and Food Policies: Implications on Poverty and Income Distribution Caesar B. Cororaton (Virginia Tech) Erwin L. Corong (IFPRI) Presented at the Annual Meeting of International Agricultural
Biofuels and Food Security A consultation by the HLPE to set the track of its study.
 Biofuels and Food Security A consultation by the HLPE to set the track of its study. Discussion No. 80 from 8 to 28 May 2012 In October 2011, the CFS has recommended that appropriate parties and stakeholders
Gender impact assessment and hydropower. Assessment understanding - empowerment
 Gender impact assessment and hydropower Assessment understanding - empowerment Michael Simon 13 September 2013 Overview 1. Why gender impact assessment? Basic principles and approach 1. Dam project: Simple
Keynote Presentation David Ameyaw, Director of Strategy, Monitoring and Evaluation, AGRA
 Keynote Presentation David Ameyaw, Director of Strategy, Monitoring and Evaluation, AGRA SUB-SAHARA SMALLHOLDER FARMERS AND CLIMATE CHANGE Keynote Address By Dr. David Sarfo Ameyaw Presented at FARMD Annual
Theme 2: Competing Claims on Natural Resources
 Theme 2: Competing Claims on Natural Resources Problem description Natural resources lie at the heart of social, political and economic life in most developing countries. Agriculture, natural resources
China at a Glance. A Statistical Overview of China s Food and Agriculture. Fred Gale
 China at a Glance A Statistical Overview of China s Food and Agriculture Fred Gale The United States and China are at very different stages of development and have quite different resource endowments that
Agricultural Census In Thailand
 Agricultural Census In Thailand The 25 th Session of APCAS Meeting 18-21 February 2014, Vientiane, Lao PDR Ms. Nongnooch Deetae Expert on Agricultural Statistics System Ministry of Agriculture and Cooperatives
ABRAHAM MASLOW S HIERARCHY OF NEEDS
 ABRAHAM MASLOW S HIERARCHY OF NEEDS (1) What We Eat Tomorrow? : Lower Class = Poor (2) Where We Eat Tomorrow?: Middle Class (3) Who We Eat Tomorrow?: High Class 2 HUMAN RIGHTS DOMENSION OF FOOD SECURITY
Executive Summary. xiii
 Executive Summary Growth is good for the poor, but the impact of growth on poverty reduction depends on both the pace and the pattern of growth. A pattern of growth that enhances the ability of poor women
An Overview on Forest Management in Lao PDR
 An Overview on Forest Management in Lao PDR Total 23,680,000 (100%) Forest and other Land Use Types Land Use Types Dense Forests Potential Forest Other Land Use Types 9,544,000 (40%) 8,272,000 (35%) 5,864,000
Statistics for Transparency, Accountability, and Results
 Statistics for Transparency, Accountability, and Results Executive summary Reliable and accessible statistics provide the evidence needed to increase the transparency of policy making, to document results,
National Adaptation Planning for Agriculture sectors
 National Adaptation Planning for Agriculture sectors UNFCCC LEG Regional Training Workshop National Adaptation Plans (NAPs) for Asian Countries Yangon, Myanmar, 10-14 August 2015 Alessandro Spairani, FAO
Potential Impact of Climate Change on Agriculture in Jamaica: Case Study of Sugar Cane, Yam, Escallion
 Potential Impact of Climate Change on Agriculture in Jamaica: Case Study of Sugar Cane, Yam, Escallion Presentation to SALISES 50-50 Conference, Globalization, Climate Change and Rural Resilience, Pegasus
ZIMBABWE CASE STUDY ZIMBABWE: COPING WITH DROUGHT AND CLIMATE CHANGE DECEMBER Country. Region. Key Result Area. UNDP Project ID 3785
 ZIMBABWE: COPING WITH DROUGHT AND CLIMATE CHANGE DECEMBER 2010 Country Zimbabwe [http://www.adaptationlearning.net/country-profiles/zw] Region Eastern Africa Key Result Area Agriculture/Food Security Disaster
The role of agriculture in closing development gaps of LDCs. Policy Papers on Countries with Special Needs. Clovis Freire CSN/14/01
 The role of agriculture in closing development gaps of LDCs CSN/14/01 Policy Papers on Countries with Special Needs The role of agriculture in closing development gaps of LDCs Clovis Freire 1 Policy Series
Transformation of Agricultural Sector in Malaysia Through Agricultural Policy. Introduction
 1 Transformation of Agricultural Sector in Malaysia Through Agricultural Policy Rozhan Abu Dardak 1 Malaysian Agricultural Research and Development Institute (MARDI), Malaysia Introduction Malaysia is
Build resilient infrastructure, promote inclusive and sustainable industrialization and foster innovation
 Build resilient infrastructure, promote inclusive and sustainable industrialization and foster innovation OUTLOOK Projected investment needs in Asia and the Pacific are substantial. Hundreds of millions
Country Presentation Paper: Fiji Islands PRESENT STATUS AND PROSPECTS OF AGRICULTURAL MECHANIZATION IN FIJI ISLANDS
 Country Presentation Paper: Fiji Islands PRESENT STATUS AND PROSPECTS OF AGRICULTURAL MECHANIZATION IN FIJI ISLANDS Penaia Mua, MSc. Senior Research Officer Agronomy Section, Korinivia Research Station
This project was conducted to support the Netherlands Ministry of Foreign Affair s Inclusive Green Growth aim of increasing water use efficiency by
 October 2016 This project was conducted to support the Netherlands Ministry of Foreign Affair s Inclusive Green Growth aim of increasing water use efficiency by 25% in Dutch financed projects. The project
AGRICULTURAL DIVERSIFICATION AND RURAL INDUSTRIALIZATION AS A STRATEGY FOR RURAL INCOME GROWTH AND POVERTY REDUCTION IN INDOCHINA AND MYANMAR
 MSS Discussion Paper No. 30 AGRICULTURAL DIVERSIFICATION AND RURAL INDUSTRIALIZATION AS A STRATEGY FOR RURAL INCOME GROWTH AND POVERTY REDUCTION IN INDOCHINA AND MYANMAR by Francesco Goletti Markets and
Measuring Aid to Agriculture
 Measuring Aid to Agriculture Statistics presented in this note relate to official development assistance (ODA) for the agricultural sector including forestry and fishing. The DAC statistical definition
Current Status of Economic Statistics in Cambodia
 The 12 th East Asian Statistical Conference, 13-15 November 2008 Tokyo, Japan Topic 2: Economic Statistics including Economic Census and Business Registers I. Introduction Current Status of Economic Statistics
Document of. The International Fund for Agricultural Development. For Official Use Only LAO PEOPLE S DEMOCRATIC REPUBLIC
 Document of The International Fund for Agricultural Development For Official Use Only LAO PEOPLE S DEMOCRATIC REPUBLIC ANNUAL REVIEW OF THE IMPLEMENTATION OF THE RESULTS-BASED COSOP Main Report and Appendices
I ntroduction. Job Creation and Poverty Reduction: Lessons from Ghana. Researcher. Francis Teal
 14 Job Creation and Poverty Reduction: Lessons from Ghana Researcher Francis Teal This policy brief seeks to explain the mechanism by which poverty was reduced in Ghana over the period from 1991/92 to
7.2 Rationale for the research component
 7. RESEARCH COMPONENT 7.1 Introduction While the number of commercial modern farms in Africa has increased significantly, most agricultural production (particularly food crop production) is still done
Empowering women and youth in agriculture and food systems
 G7 International Forum for Empowering Women and Youth in the Agriculture and Food Systems Tokyo, 12 December 2016 Empowering women and youth in agriculture and food systems Clara Mi Young Park Gender Rural
POTENTIAL CHALLENGES FOR BEGINNING FARMERS AND RANCHERS
 2nd Quarter 2011 26(2) POTENTIAL CHALLENGES FOR BEGINNING FARMERS AND RANCHERS Mary Clare Ahearn JEL Classifications: Q12, Q14, Q14, Q18, R12 Keywords: Beginning Farmer and Rancher, Farm Finances, Access
The Outlook for Agriculture and Fertilizer Demand for Urea, Compound and Organic in Indonesia
 11/4/211 The Outlook for Agriculture and Fertilizer Demand for Urea, Compound and Organic in Indonesia Bambang Tjahjono Marketing Director of PT PUSRI Presented in 211 IFA Crossroads Asia-Pacific 2-4 November
Participatory rural planning processes
 Rural Transport Training Materials Module 2: Planning, Design, Appraisal and Implementation Participatory rural planning processes Session 2.1 Part 1 Presentation 2.1a The Training Modules Module1. Policies
Mainstreaming Sex-Disaggregated Data and Gender Indicators in Agricultural Statistics: FAO Guidelines
 Mainstreaming Sex-Disaggregated Data and Gender Indicators in Agricultural Statistics: FAO Guidelines Chiara Brunelli Food Security and Nutrition Officer Gender Focal Point FAO Statistics Division 24 th
IPM programme in Vietnam. Nguyen Van Dinh, Thai Thi Minh and Nguyen Thi Kim Oanh, Hanoi University of Agriculture
 IPM programme in Vietnam Nguyen Van Dinh, Thai Thi Minh and Nguyen Thi Kim Oanh, Hanoi University of Agriculture nvandinh@hua.edu.vn 1. The state extension system Organizational system The Central level
Brief 4: An Analysis of Household Income and Expenditure in Tanzania
 Brief 4: An Analysis of Household Income and Expenditure in Tanzania UNITED REPUBLIC OF TANZANIA Produced by the Research and Analysis Working Group of the MKUKUTA Monitoring System, Ministry of Finance
Swift and coordinated action is needed to halve hunger and extreme poverty everywhere by 2015
 PREPARATORY MEETING FOR 2005 ECOSOC HIGH-LEVEL SEGMENT 16-17 March 2005 Achieving the internationally agreed development goals, including those contained in the Millennium Declaration, as well as implementing
1. Name of the Project 2. Necessity and Relevance of JBIC s Assistance 3. Project Objectives
 Ex-ante Evaluation 1. Name of the Project Country: India Project: Swan River Integrated Watershed Management Project (Loan Agreement: 03/31/2006; Loan Amount: 3,493 million yen; Borrower: The President
Bangkok, Thailand December 2016
 Bangkok, Thailand 7-8-9 December 2016 The International Family Forestry Alliance, with the Asian Farmers Association for sustainable rural development and RECOFTC - The Center for People and Forests and
Demand vs Supply of Food in India - Futuristic Projection
 Published Online on 22 December 2016 Proc Indian Natn Sci Acad 82 No. 5 December 2016 pp. 1579-1586 Printed in India. DOI: 10.16943/ptinsa /2016/48889 Demand vs Supply of Food in India - Futuristic Projection
Vegetable Genebank Management and Seed Production Systems. Training Report
 Vegetable Genebank Management and Seed Production Systems National Agriculture and Forestry Research Institute () Ministry of Agriculture and Forestry Vientiane, Lao PDR 17-21 February 2014 Training Report
The Environmental and Economic Impacts of the Nam Theun 2 Hydroelectric Project on Communities Living in the Xe Bang Fai River Basin 16 March 2004
 TERRA 409 Soi Rohitsuk, Pracharajbampen Road Huay Kwang, Bangkok 10320 Thailand Tel: (66) 02 691 0718/19/20; Fax: (66) 02 691 0714; e-mail terraper@ksc.net.th The Environmental and Economic Impacts of
GEO-DRI Drought Monitoring Workshop, May 10-11, 2010, Winnipeg, Manitoba Drought in Southeast Asia
 GEO-DRI Drought Monitoring Workshop, May 10-11, 2010, Winnipeg, Manitoba Drought in Southeast Asia Orn-uma Polpanich Stockholm Environment Institute Asia Bangkok, Thailand Southeast Asia Is located on
Christian Bobst GENDER MAINSTREAMING IN TANZANIA S CENTRAL CORRIDOR. Lessons from the Rural Livelihood Development Programme Tanzania
 Christian Bobst GENDER MAINSTREAMING IN TANZANIA S CENTRAL CORRIDOR Lessons from the Rural Livelihood Development Programme Tanzania BACKGROUND The Rural Livelihood Development Programme (RLDP) in Tanzania