|
|
|
- Cynthia Warner
- 6 years ago
- Views:
Transcription
1
2
3
4
5
6
7
8
9
10
11
12
13
14
15
16
17
18
19
20
21
22
23
24
25
26
27 Animal Units Calculation Table A B C D E F G Animal Type Type of Operation Proposed Existing Animal Annual Additional Total Animal Number of Units per Confinement Number of Units Animals Head Period (Days) Animals Mature cows (lactating and dry) including associated livestock 2 - Mature cows (lactating and dry) Heifers (0 to 3 months) Dairy 1 Heifers (4 to 13 months) Heifers (> 13 months) Bulls Veal calves Beef cows including associated livestock Beef Backgrounder Summer pasture / replacement heifers Feeder cattle Sows - farrow to finish ( lbs) Sows - farrow to weanling (up to 11 lbs) Pigs Sows - farrow to nursery (51 lbs) Boars (artificial insemination units) Weanlings, Nursery (11-51 lbs) Growers / Finishers ( lbs) Broilers Roasters Chickens Layers Pullets Broiler breeder pullets Broiler breeder hens Broilers Turkeys Heavy Toms Heavy Hens Horses Mares Sheep Other Livestock Ewes Feeder lambs - 15, Type: - Type: - Total AUs Footnotes: 1 There are 2 methods for calculating animal units for dairy (Farm Practices Guidelines for Dairy Producers in Manitoba, 1995). You can enter the total number of mature cows in the milking herd under the "Mature cows (lactating and dry) including associated livestock" category and the animal units will be calculated by multiplying this number by 2. This calculation assumes 85 lactating, 15 dry, 12 heifers (0 to 3 months), 36 heifers (4 to 13 months) and 50 heifers (> 13 months) for an operation with 100 mature cows. "Associated livestock" includes all of the heifer calves and replacement heifers. Alternatively, you can enter animal numbers in the individual categories (mature cows, heifers (0 to 3 months), heifers (4 to 13 months) and heifers (> 13 months)) and they will be summed at the bottom of the table. Bulls and veal calves are always calculated separately. For all other livestock or operation types please inquire with your Manitoba Agriculture, Food and Rural Initiatives GO office to determine the animal units per head. 7/4/2015 9:47 PM
28 Livestock IG/day (Imperial gallons per day) Beef/Dairy/Bison Feeder/heifer/steer (600 lb.) Feeder (900 lb.) Feeder (1250 lb.) Cow/calf pair Dry cow Milking cow Bison Horses Horses Hogs Sow (Farrow/wean) Dry Sow/Boar Feeder Nursery (33 lb.) Chickens Broilers Roasters/Pullets Layers Breeders Turkeys Turkey Growers Turkey Heavies Sheep/Goats Sheep/Goats Ewes/Does 0 3 Lambs/Kids (90 lb.) TOTAL (IG/day) Other consumption values: Water Requirement Calculation Table Number IG/day per animal in winter IG/day per animal in summer For beef, dairy, bison and horse enterprises: Use summer numbers if appropriate for the operation. Otherwise base projections on winter values. Always use the greater of the two values. Enter this number on page 7 of Application Form. Unit Conversions Normal household consumption: IG/day per person or Total per day Total per year Unit ( l/day/person) IG litres Hydrant flow: 10 imperial GPM (45 l/min) cubic decametres (dam 3 ) Enter this number on page 7 of Application Form. Conversion Factor: 1 IGPM = l/m
29 Animal Type (A) Dairy (milking cows 4 and associated livestock) Beef Pigs Animal Type Chickens Turkeys Free Stall Tie Stall Animal Sub-type (B) References (C) Manure Type (D) Daily Manure Production Default Manure Production (ft 3 /animal/day) (E) Operation Manure Production 1 (ft 3 /animal/day) (F) Semi-Solid Solid Liquid Semi-Solid Solid Liquid Loose Housing Solid Milking Parlour Manure and Washwater Liquid 0.5 Beef cows including associated livestock Solid Backgrounder (200 day) pg 117, FPGs for Solid Summer pasture / replacement heifers Hogs 1998 Solid Feeder cattle Solid Sows - farrow to finish ( lbs) Liquid Sows - farrow to wean (up to 11 lbs) MAFRI website, Liquid Sows - farrow to nursery (51 lbs) FPGs for Pigs Liquid Weanlings, Nursery (11-51 lbs) 2007 Liquid Grower / Finisher ( lbs) Liquid Type of Operation Table 6, pg 59, FPGs for Dairy 1995 Yearly Manure Production Default Manure Production (ft 3 /year/bird space) Operation Manure Production 1 (ft 3 /year/bird space) Production Period 2 (Days) Total Manure Volume (ft 3 ) (FxGxH) Total Manure Volume for Semi-Solid and Liquid Manure (Imp Gal) Broilers floor Broiler breeder hens Broiler breeder pullets Roasters floor Layers cage 8 Table 3, pg 85, Layers floor 7 FPGs for Poultry Layers solid pack 9 - Pullets cage Pullets floor Pullets solid pack 9 - Broilers 6 Table 3, pg 85, Heavy toms 6 FPGs for Poultry Heavy hens (G) Production Period 2 (Days) Number of Animals 3 (Capacity) (H) Number of Birds 3 (Capacity) Total Manure Volume (ft 3 ) (F/365xGxH) Total Manure Volume for Semi-Solid and Liquid Manure (Imp Gal) Sizing of a manure storage facility in accordance with all requirements of the Livestock Manure and Mortalities Management Regulation (M.R. 42/98) is the responsibility of the operator. Instructions and footnotes: 1 ENTER the manure production estimate for your operation. If no estimate is available, use the default value provided in colum E. References for default daily and yearly manure production are provided in column C. 2 ENTER the number of days worth of manure that will be produced. For earthen manure storage facilities the minimum storage requirement is 400 days. For steel and concrete manure storage facilities the minimum storage requirement is ENTER the total number of animals or birds that the operation can hold (e.g. barn or feedlot capacity). 4 Milking cows includes all lactating and dry cows. 5 Default manure production estimates for semi-solid and liquid dairy manure include manure and washwater from the milking parlour. 6 2 inches of wood shavings or 4 inches of straw placed on floor. Manure and litter removed from barn at 25% moisture content, with a density of 20 lb/ft 3 7 One-third litter floor, two-thirds slatted floor. Manure and litter removed from barn at 40% moisture content, with a density of 25 lb/ft 3 8 Manure removed from barn at 90% moisture content with a density of 59 lb/ft 3 9 Poultry operations using litter (solid pack) must provide an estimate of yearly manure production
30 MANURE APPLICATION FIELD CHARACTERISTICS TABLE Field A B C D E F G H I J K Soil Soil Net Acreage Agriculture Nitrate Phosphorus Legal Rural (lb) (ppm Olsen P) Description Municipality O/L/A Total Setbacks, including Development for Manure Capability Class Acreage features Plan Designation Application and Subclass 0-24 inches 0-6 inches Zoning 1 NE E Stuartburn O 161 Prop. lines, Water, cl 6, O 18 4M5M LD (Limited Dev. Zone) ZBL 098/ E½-NW E Stuartburn O 78.5 Prop lines, cl 6 soil 57 4M5M 5 25 A1 ZBL 098/ SE E Stuartburn O Prop lines, cl 6 O soils 103 4M 6 16 LD ZBL 098/ SW E Stuartburn O 153 Prop lines, future feedlot 98 4M 7 14 A1 ZBL 098/ N½-SE35-3-8E Stuartburn A 80 Prop. lines, cl M 5 4 A1 ZBL 098/ NW26-3-8E Stuartburn A 160 Prop. lines, cl 6 soil 69 4M 20 5 A1 / LD ZBL 098/ SW26-3-8E Stuartburn A 160 Prop. lines, water, cl 6 3 3MI 2 7 LD ZBL 098/ SW35-3-8E Stuartburn A 160 Prop lines, cl M 2 5 A1 ZBL 098/ W½-NW28-3-8E Stuartburn A 80.5 Prop lines, cl 6 soil 32 4M A1 ZBL 098/ W16-3-8E Stuartburn A 320 Prop lines, surf water, cabin 314 2MP 2 8 A1 ZBL 098/ NE21-3-8E Stuartburn L 160 Prop lines, surf water, bush 85 4M3MI 2 13 LD ZBL 098/ SE21-3-8E Stuartburn L 80 Prop lines, bush 32 4M3MI 2 19 LD ZBL 098/ SE29-3-8E Stuartburn A 80 Prop lines, surf. Water 79 4M5W 2 13 A1 ZBL 098/ NW21-3-8E Stuartburn L 160 Prop lines, surf water, cl M A1 ZBL 098/ SE32-3-8E Stuartburn A 80 Prop lines, surf water, cl M A1 ZBL 098/ Total Net Acreage for Manure Application: 1166 A. Enter the legal description for each parcel of land that will receive manure: Sec, Twp, Rge or River Lot (including parish). B. Identify the Rural Municipality in which the parcel is located. C. Indicate how the land has been secured for manure application: O Own / L Lease / A Agreement D. Enter the total acreage for the parcel. E. Enter setbacks from surface water or groundwater features that reduce the land available for manure application; include identification of type of feature (e.g. 8m, Order 3 F. Enter the net long-term acreage available for manure application for the parcel after taking into account setbacks and excluding Class 6, 7 and unimproved organic soils. G. Enter the agriculture capability class and subclass ratings for the acreage available for manure application. H. Provide soil test results for nitrate-n in lb/ac at the 0-24 inch depth. Soil test results must be no more than 12 months old and must be completed by an accredited soil-testing I. Provide soil test results for phosphorus ppm Olsen P at 0-6 inch depth. Soil test results must be no more than 12 months old and must be completed by an accredited soil- J. Please indicate the Development Plan and its by-law number in addition to the map designation for each field K. Please indicate the Zoning By-law and its by-law number in addition to the zoning for each field
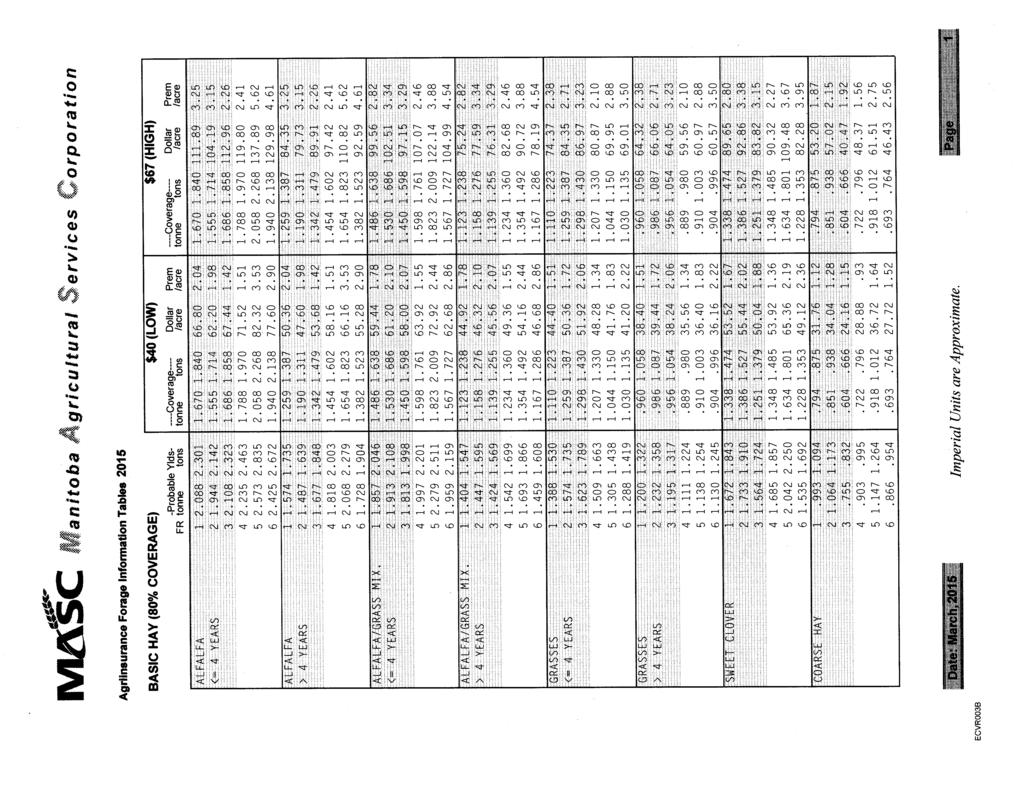
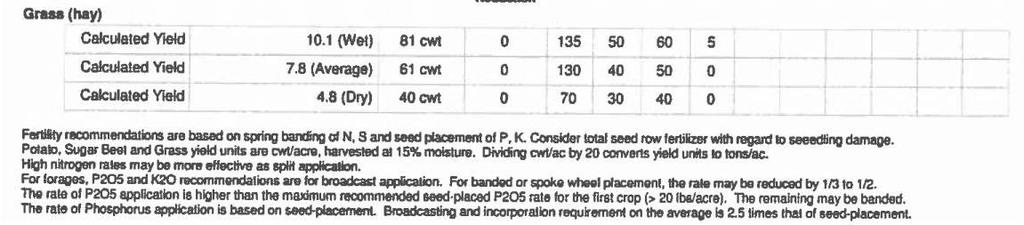
31 CROP ROTATION TABLE A B C D E Expected Crops in the Rotation Acreage Historical Yield Units Source of Yield Information Grass Hay t/ac MMP Variety Yield Data ( ) Corn Grain bu/ac MMP Variety Yield Data ( ) Corn Silage t/ac MMP Variety Yield Data ( ) Soybeans bu/ac MMP Variety Yield Data ( Alfalfa t/ac MMP Variety Yield Data ( Total Net Acreage for Manure Application 1166 acres A. List all of the crop(s) to be grown in the rotation on the acreage that will receive manure. B. Indicate the average acreage for each crop over the rotation. For example, if there are 720 suitable acres available for manure and approximately 40 these acres will be used to grow canola, enter 288. The total of column B should add up to Total Net Acreage for Manure Application provided in the Manure Application Field Characteristic Table. C. Enter the historical yield average for each crop. Long-term yield averages can be determined using MASC data ( or on-farm yield records. If on-farm yield records are used, please provide copies. D. Enter the units for the yields provided (e.g. bu, tons). E. Enter the source of the historical yield average provided.
32 AgriInsurancence Information Tables For Risk Area R.S. WHEAT $ Soil Probable Yldstonne bu/lbs ----Coverage % 70% 80% ----Coverage---- Imperial Units are Approximate. Date: March, 2015 Page Coverage /bu C PED RSW SD $ D E F G H I J /bu C H.W. WHEAT $ D E F G H I J /bu C PED HW WHT $ D E F G H I J /bu C DUR WHEAT $ D E F G H I J /bu C D E F G H I J ECVR0002
33 AgriInsurancence Information Tables For Risk Area PED DU WHT $ Soil Probable Yldstonne bu/lbs ----Coverage % 70% 80% ----Coverage---- Imperial Units are Approximate. Date: March, 2015 Page Coverage /bu C P.S. WHEAT $ D E F G H I J /bu C PED PS WHT $ D E F G H I J /bu C FEED WHEAT $ D E F G H I J /bu C E.S. WHEAT $ D E F G H I J /bu C D E F G H I J ECVR0002
34 AgriInsurancence Information Tables For Risk Area PED ES WHT $ Soil Probable Yldstonne bu/lbs ----Coverage % 70% 80% ----Coverage---- Imperial Units are Approximate. Date: March, 2015 Page Coverage /bu C WINTER WHT $ D E F G H I J /bu C PED WI WHT $ D E F G H I J /bu C FALL RYE $ D E F G H I J /bu C TRITICALE $ D E F G H I J /bu C D E F G H I J ECVR0002
35 AgriInsurancence Information Tables For Risk Area BARLEY $ Soil Probable Yldstonne bu/lbs ----Coverage % 70% 80% ----Coverage---- Imperial Units are Approximate. Date: March, 2015 Page Coverage /bu C PED BLY SD $ D E F G H I J /bu C OATS $ D E F G H I J /bu C PED OATS $ D E F G H I J /bu C MXD GRAIN $ D E F G H I J /bu C D E F G H I J ECVR0002
36 AgriInsurancence Information Tables For Risk Area FLAX $ Soil Probable Yldstonne bu/lbs ----Coverage % 70% 80% ----Coverage---- Imperial Units are Approximate. Date: March, 2015 Page Coverage /bu C PED FLAX $ D E F G H I J /bu C ARG CANOLA $ D E F G H I J /bu C PED ARG CN $ D E F G H I J /bu C POL CANOLA $ D E F G H I J /bu C D E F G H I J ECVR0002
37 AgriInsurancence Information Tables For Risk Area PED POL CN $ Soil Probable Yldstonne bu/lbs ----Coverage % 70% 80% ----Coverage---- Imperial Units are Approximate. Date: March, 2015 Page Coverage /bu C RAPESEED $ D E F G H I J /bu C PED RAPESD $ D E F G H I J /bu C MUSTARD $ D E F G H I J /lbs C OIL SUNF. $ D E F G H I J /lbs C D E F G H I J ECVR0002
38 AgriInsurancence Information Tables For Risk Area OIL SUNF. $ Soil Probable Yldstonne bu/lbs ----Coverage % 70% 80% ----Coverage---- Imperial Units are Approximate. Date: March, 2015 Page Coverage /lbs C AREA ITA D N-OIL SUNF $ E F G H I J /lbs C N-OIL SUNF $ D E F G H I J /lbs C AREA ITA D BUCKWHEAT $ E F G H I J /bu C CANARY SD $ D E F G H I J /lbs C D E F G H I J ECVR0002
39 AgriInsurancence Information Tables For Risk Area FIELD PEAS $ Soil Probable Yldstonne bu/lbs ----Coverage % 70% 80% ----Coverage---- Imperial Units are Approximate. Date: March, 2015 Page Coverage /bu C PED FD PEA $ D E F G H I J /bu C LENTILS $ D E F G H I J /lbs C AREA ITA D WHITE BNS $ E F G H I J /lbs C AREA 2 D WHITE BNS $ E F G H I J /lbs C AREA 3 D E F G H I J ECVR0002
40 AgriInsurancence Information Tables For Risk Area WHITE BNS $ Soil Probable Yldstonne bu/lbs ----Coverage % 70% 80% ----Coverage---- Imperial Units are Approximate. Date: March, 2015 Page Coverage /lbs C AREA ITA D KIDNEY BNS $ E F G H I J /lbs C AREA 2 D KIDNEY BNS $ E F G H I J /lbs C AREA 3 D KIDNEY BNS $ E F G H I J /lbs C AREA ITA D CRAN BEANS $ E F G H I J /lbs C AREA 2 D E F G H I J ECVR0002
41 AgriInsurancence Information Tables For Risk Area CRAN BEANS $ Soil Probable Yldstonne bu/lbs ----Coverage % 70% 80% ----Coverage---- Imperial Units are Approximate. Date: March, 2015 Page Coverage /lbs C AREA 3 D CRAN BEANS $ E F G H I J /lbs C AREA ITA D PINTO BEAN $ E F G H I J /lbs C AREA 2 D PINTO BEAN $ E F G H I J /lbs C AREA 3 D PINTO BEAN $ E F G H I J /lbs C AREA ITA D E F G H I J ECVR0002
42 AgriInsurancence Information Tables For Risk Area BLCK BEANS $ Soil Probable Yldstonne bu/lbs ----Coverage % 70% 80% ----Coverage---- Imperial Units are Approximate. Date: March, 2015 Page Coverage /lbs C AREA 2 D BLCK BEANS $ E F G H I J /lbs C AREA 3 D BLCK BEANS $ E F G H I J /lbs C AREA ITA D SML RED BN $ E F G H I J /lbs C AREA 2 D SML RED BN $ E F G H I J /lbs C AREA 3 D E F G H I J ECVR0002
43 AgriInsurancence Information Tables For Risk Area SML RED BN $ Soil Probable Yldstonne bu/lbs ----Coverage % 70% 80% ----Coverage---- Imperial Units are Approximate. Date: March, 2015 Page Coverage /lbs C AREA ITA D OTHER BEAN $ E F G H I J /lbs C AREA 2 D OTHER BEAN $ E F G H I J /lbs C AREA 3 D OTHER BEAN $ E F G H I J /lbs C AREA ITA D GREENFEED $80.00 E F G H I J /ton C D E F G H I J ECVR0002
44 AgriInsurancence Information Tables For Risk Area OP SIL CRN $ Soil Probable Yldstonne bu/lbs ----Coverage % 70% 80% ----Coverage Coverage /ton C SIL CORN $36.00 D E F G H I J /ton C D E F G H I J Imperial Units are Approximate. Date: March, 2015 Page 13 ECVR0002
45 AgriInsurancence Information Tables For 2015 Risk Area 14 BASE ----Coverage % 70% 80% BASE ----Coverage---- BASE ----Coverage---- GRAIN CORN AREA $ /bu GRAIN CORN AREA $ /bu GRAIN CORN AREA ITA $ /bu OPEN CORN $ /bu OPEN CORN AREA ITA $ /bu PROSO MLLT $ /lbs PED TIMTHY $ /lbs PED ALFALF $ /lbs COM ALFALF $ /lbs ANN RYEGRS $ /lbs PER RYEGRS $ /lbs TL FESC SD $ /lbs Imperial Units are Approximate. Date: March, 2015 Page 14 ECVR0001
46 AgriInsurancence Information Tables For 2015 Risk Area 14 BASE ----Coverage % 70% 80% BASE ----Coverage---- BASE ----Coverage---- HEMP GRAIN $ /lbs FABABEANS $ /lbs SOYBEANS AREA $ /bu SOYBEANS AREA $ /bu SOYBEANS AREA ITA $ /bu PED SOYBNS AREA $ /bu PED SOYBNS AREA $ /bu PED SOYBNS AREA ITA $ /bu POTATO DRY $ /cwt POTATO IRR $ /cwt POTATO TBL $ /cwt RUTABAGAS $ /ton Imperial Units are Approximate. Date: March, 2015 Page 15 ECVR0001
47 AgriInsurancence Information Tables For 2015 Risk Area 14 BASE ----Coverage % 70% 80% BASE ----Coverage---- BASE ----Coverage---- ONIONS $ /ton PARSNIPS $ /ton CARROTS $ /ton ORG RS WHT $ /bu ORG HW WHT $ /bu ORG DU WHT $ /bu ORG PS WHT $ /bu ORG FD WHT $ /bu ORG ES WHT $ /bu ORG WI WHT $ /bu ORG OATS $ /bu ORG FLAX $ /bu Imperial Units are Approximate. Date: March, 2015 Page 16 ECVR0001
48
49 Sheep/Operation Type Storage Type Volatilization Animal Numbers Weight In Weight Out Ave Weight Days on Feed Cycles per Year N Excreted per Flock adjusted for Loss P2O5 Excreted Per Flock lb lb lb lb/flock/yr lb/flock/yr Ewes Field Storage 40% Replacement Ewes Field Storage 40% Rams Field Storage 40% Lambs Field Storage 40% Ewes, plus assoc livestock Field Storage 40% 0 na na na na na 0 0 Feeder Compost 40%
50 Removal Uptake Removal Uptake Crop P2O5 N N Units Yield Units Acreage P2O5 N N (lb) (lb) (lb) Alfalfa lb/ton ton/ac Barley Grain lb/bu bu/ac Barley Silage lb/ton ton/ac Canola lb/bu bu/ac Corn Grain lb/bu 87.6 bu/ac Corn Silage lb/ton 3.11 tons/ac Dry Edible Beans lb/cwt cwt/ac Fababeans lb/cwt cwt/ac Flax lb/bu bu/ac Grass Hay lb/ton tons/ac Lentils lb/cwt cwt/ac Oats lb/bu bu/ac Pasture (grazed) lb/ton 0.5 ton/ac Peas lb/bu bu/ac Potatoes lb/cwt cwt/ac Rye lb/bu bu/ac Soybeans lb/bu 28 bu/ac Sunflower lb/cwt cwt/ac Wheat - Spring lb/bu bu/ac Wheat - Winter lb/bu bu/ac Sub Total Estimated Average Removal/Uptake (lb/ac) Additional Acres Crop Planned on Additional Acres Total Suitable Acres Available for Manure 1166 Note: Additional acres include acres that are suitable and available for manure application but are seeded to crops that are not included in the table. Include the crop to be grown in the row below. Last revised August 20, 2014
51 Species Animal Category/Operation type N P2O5 (lb/year) (lb/year) Pigs Gestating Sow 0 0 Nursing Sow 0 0 Gilts 0 0 Boars 0 0 Sows, farrow to 5 kg 0 0 Sows, farrow to 23 kg 0 0 Sows, farrow to finish 0 0 Weanlings 0 0 Growers/finishers 0 0 Beef Mature Cows (>2 years old) 0 0 Bred Heifer (14 mo - 2 years) 0 0 Replacement Heifers (7 mo-14 mo) 0 0 Unweaned Calves (0-7 mo) 0 0 Bulls 0 0 Mature Cows and Bred Heifers, plus associated livestock 0 0 Feedlot Cattle - long keep 0 0 Feedlot Cattle - short keep 0 0 Backgrounders - pasture 0 0 Backgrounders - confined 0 0 Dairy Lactating cow 0 0 Dry cow 0 0 Calf, 0-3 months 0 0 Calf, 4-13 months 0 0 Replacements, >13 months 0 0 Mature Cows, plus assoc livestock 0 0 Sheep Ewes 0 0 Replacement Ewes 0 0 Rams 0 0 Lambs 0 0 Ewes, plus assoc livestock 0 0 Feeder Chickens Broilers 0 0 Broiler Breeder Pullets 0 0 Broiler Breeder Hens 0 0 Layers Layer Pullets 0 0 Layer Hens 0 0 Breeder Pullets 0 0 Breeder Hens 0 0 Turkeys Broiler Hens (0-9 wks) 0 0 Hens (0-11 wks) 0 0 Heavy Hens (0-14 wks) 0 0 Light Toms (0-12 wks) 0 0 Toms (0-13 wks) 0 0 Heavy Toms (0-15 wks) 0 0 Breeding Hen Growers (0-30 wks) 0 0 Breeding Hens (30-60 wks) 0 0 Breeding Tom Grower (0-18 wks) 0 0 Breeding Tom Grower (0-30 wks) 0 0 Breeding Tom (30-60 wks) 0 0 Total Note: Be sure all livestock species on your farm are represented in this table. Not just the proposed expansion.
52 Nutrients Excreted lbs Nitrogen P2O Crop Nutrient Use lb/ac Nitrogen Uptake P2O5 Removal 28.2 Land Base Requirements acres Acres Available 1166 Acres for Nitrogen Uptake 1016 Acres for 2 x P2O5 Removal 1132 Acres for 1 x P2O5 Removal 2264
 668-9652")
53 N CANADA SHEEP & LAMB N/A SITE PLAN R. FLORES/P.FERRER SOUTH-MAN ENGINEERING UNIT DUGALD ROAD WINNIPEG, MANITOBA PH (204) FAX (204) JUNE 2015 N.T.S. S-P1 R2J 0H3
 668-9652 FAX (204) 668-9204 JUNE 2015 N.T.S. SP-2 R2J 0H3")
54 N LO LO LO A A A A O LO O A A R C C L C C C C L A C A C CANADA SHEEP & LAMB N/A LAND USE & SPREAD FIELD MAP P.FERRER SOUTH-MAN ENGINEERING UNIT DUGALD ROAD WINNIPEG, MANITOBA PH (204) FAX (204) JUNE 2015 N.T.S. SP-2 R2J 0H3
 668-9652")
55 N CANADA SHEEP & LAMB N/A TRUCK HAUL ROUTE P.FERRER SOUTH-MAN ENGINEERING UNIT DUGALD ROAD WINNIPEG, MANITOBA PH (204) FAX (204) JUNE 2015 N.T.S. SP-3 R2J 0H3
56
57
58
59
Agronomy Facts 54 Pennsylvania s Nutrient Management Act (Act 38): Who Is Affected?
: Who Is Affected?") Agronomy Facts 54 Pennsylvania s Nutrient Management Act (Act 38): Who Is Affected? In spring 1993, the Pennsylvania legislature passed and the governor signed the Nutrient Management Act (Act 6) into
Agronomy Facts 54 Pennsylvania s Nutrient Management Act (Act 38): Who Is Affected? In spring 1993, the Pennsylvania legislature passed and the governor signed the Nutrient Management Act (Act 6) into
MINIMUM DISTANCE SEPARATION (MDS 1) GUIDE FOR NEW NON-AGRICULTURAL USES ADJACENT TO EXISTING LIVESTOCK
 GUIDE FOR NEW NON-AGRICULTURAL USES ADJACENT TO EXISTING LIVESTOCK") MINIMUM DISTANCE SEPARATION (MDS 1) GUIDE FOR NEW NON-AGRICULTURAL USES ADJACENT TO EXISTING LIVESTOCK Town of Whitchurch-Stouffville 111 Sandiford Drive, Stouffville, ON L4A 0Z8 905-640-1910 or Toll Free
MINIMUM DISTANCE SEPARATION (MDS 1) GUIDE FOR NEW NON-AGRICULTURAL USES ADJACENT TO EXISTING LIVESTOCK Town of Whitchurch-Stouffville 111 Sandiford Drive, Stouffville, ON L4A 0Z8 905-640-1910 or Toll Free
Livestock Enterprise. Budgets for Iowa 2017 File B1-21. Ag Decision Maker
 Livestock Enterprise Ag Decision Maker Budgets for Iowa 2017 File B1-21 This publication contains estimates of production costs for common livestock enterprises in Iowa. Estimates are intended to reflect
Issues in the Animal Agriculture Industry A. Animal Welfare- the humane treatment of animals. 1. Most animal producers and researchers believe in
 Livestock Products & By-Products A. Products- ruminants and other animals eat feed materials that humans will not eat and convert these materials into food that humans will eat: meat, eggs, milk, etc.
Pennsylvania s Nutrient Management Act (Act 38):
:") Agronomy Facts #54 Pennsylvania s Nutrient Management Act (Act 38): Who Is Affected? In spring 1993, the Pennsylvania legislature passed and the governor signed the Nutrient Management Act (Act 6) into
Agronomy Facts #54 Pennsylvania s Nutrient Management Act (Act 38): Who Is Affected? In spring 1993, the Pennsylvania legislature passed and the governor signed the Nutrient Management Act (Act 6) into
Skills, Competencies and Knowledge
 4. Skills, Competencies and Knowledge This section covers the abilities you developed or things you accomplished as a result of the training and experiences you received through your agricultural education
Standard Animal Weights
 Standard Animal Weights Agricultural Advisory Board April 27, 2017 Frank X. Schneider Director, Nutrient and Odor Management Programs Background Staff would like to update the AAB on changes to the Standard
No-till, Nitrogen and Manure Management
 No-Till is here to Stay! No-till, Nitrogen and Manure Management Jeffrey Graybill, MS, CCA Penn State Extension Lancaster County, PA jgraybill@psu.edu 717-394-6851 It works! In 2009: 1.25 Million acres
National standards for nutrient contents in manure
 National standards for nutrient contents in manure Germany Maximilian Hofmeier Julius Kühn-Institut, Braunschweig Background Nutrient excretions of farm animals determine the fertilization value of animal
SEVERANCE PROPOSAL FORM
 SEVERANCE PROPOSAL FORM PETERBOROUGH COUNTY PLANNING DEPARTMENT Please complete this form with as much detail as possible and provide a rough sketch of what you intend. Completion of this form will help
Environmental Hazard in South Dakota?
 ~m Livestock Manure: a Nonpoint Source Environmental Hazard in South Dakota? D.C. ~ a~lorl and D.H. Flicked2 Departments of Economics and Animal and Range Sciences SDSU CAlTLE 95-1 5 Summary This exploratory
Manure Management. Fundamentals of Nutrient Management. June 2, Jarrod O. Miller, Ph.D. Extension Educator, Agriculture
 Manure Management Fundamentals of Nutrient Management June 2, 2016 Jarrod O. Miller, Ph.D. Extension Educator, Agriculture Fertilizer Options? Manure Legumes Commercial Fertilizer Bio-Solids Chapter 9:
2008 Michigan Cash Grain Farm Business Analysis Summary. Eric Wittenberg And Stephen Harsh. Staff Paper November, 2009
 2008 Michigan Cash Grain Farm Business Analysis Summary Eric Wittenberg And Stephen Harsh Staff Paper 2009-11 November, 2009 Department of Agricultural, Food, and Resource Economics MICHIGAN STATE UNIVERSITY
THE RURAL MUNICIPALITY OF R H I N E L A N D
 TECHNICAL REVIEW COMMITTEE A TECHNICAL REVIEW REPORT PREPARED FOR THE RURAL MUNICIPALITY OF R H I N E L A N D BLUMENGART HUTTERIAN MUTUAL CORP. NE16-02-03W & NW 15-02-03W TRC 12-015 JUNE 3, 2015 A. INTRODUCTION
Animal Science Merit Badge Workbook
 Merit Badge Workbook This workbook can help you but you still need to read the merit badge pamphlet. This Workbook can help you organize your thoughts as you prepare to meet with your merit badge counselor.
Manure Management Facts Managing Manure within Tillage Systems and Crop Rotations
 Manure Management Facts Managing Manure within Tillage Systems and Crop Rotations January 2009 Introduction Manure is a valuable source of nutrients for crop production. Most crop rotations can be designed
2012 STATE FFA FARM BUSINESS MANAGEMENT TEST PART 2. Financial Statements (FINPACK Balance Sheets found in the resource information)
") 2012 STATE FFA FARM BUSINESS MANAGEMENT TEST PART 2 Financial Statements (FINPACK Balance Sheets found in the resource information) Please use the Market Value when making the calculations for the Zimmerman
2012 STATE FFA FARM BUSINESS MANAGEMENT TEST PART 2 Financial Statements (FINPACK Balance Sheets found in the resource information) Please use the Market Value when making the calculations for the Zimmerman
P 2 O 5, tonnes. Beausejour Steinbach Winkler Portage Brandon Melita Roblin NW Interlake. % testing low
 Phosphorus Fertilization Strategies for Long Term Agronomic and Environmental Sustainability John Heard (MAFRD), Cindy Grant (AAFC), and Don Flaten(University of Manitoba) March, Manitoba fertilizer phosphorus
Intensive Livestock Farming: Does Farm Size Matter?
 Statistics Canada Agriculture Division Agriculture and Rural Working Paper Series Working Paper No. 48 Intensive Livestock Farming: Does Farm Size Matter? Prepared by Martin S. Beaulieu, MSc, Analyst Analysis
Crop Production Costs
 Guidelines for Estimating Crop Production Costs 2018 in Manitoba ................................................. Guidelines For Estimating Crop Production Costs - 2018 Date: January, 2018 The following
2007 Michigan Dairy Farm Business Analysis Summary. Eric Wittenberg And Christopher Wolf. Staff Paper December, 2008
 2007 Michigan Dairy Farm Business Analysis Summary Eric Wittenberg And Christopher Wolf Staff Paper 2008-04 December, 2008 Department of Agricultural, Food, and Resource Economics MICHIGAN STATE UNIVERSITY
2007 Michigan Cash Grain Farm Business Analysis Summary. Eric Wittenberg And Stephen Harsh. Staff Paper December, 2008
 2007 Michigan Cash Grain Farm Business Analysis Summary Eric Wittenberg And Stephen Harsh Staff Paper 2008-07 December, 2008 Department of Agricultural, Food, and Resource Economics MICHIGAN STATE UNIVERSITY
Other Unique Components
 Other Unique Components Situation Overview: A. Please detail additional areas that were part of the farm s project. As part of the project, we needed to approximately double our herd size. We were blessed
LONG-TERM WATER MANAGEMENT PLAN (LTWMP)
") Page 1 of 16 Version 5.3 LONG-TERM WATER MANAGEMENT PLAN (LTWMP) Plan Development Package and Instructions Table of Contents 1) Template (Pages 2-5) LTWMP Client Identification form (2 sections) Calculation
Page 1 of 16 Version 5.3 LONG-TERM WATER MANAGEMENT PLAN (LTWMP) Plan Development Package and Instructions Table of Contents 1) Template (Pages 2-5) LTWMP Client Identification form (2 sections) Calculation
Manure Management Manual Revisions
 Manure Management Manual Revisions Jim Spontak PA DEP Farms In PA 63,136 farms in PA 33813 have livestock Average farm is 124 acres, about 75% under 200 acres Women as the primary farm operator increased
The Changing Face Of Manitoba Crop Rotations
 The Changing Face Of Manitoba Crop Rotations Doug Wilcox, Manager, Program Development - Insurance Manitoba Agricultural Services Corporation Presentation to the Manitoba Agronomists Conference U of M,
Act 38 Nutrient Balance Sheet Standard Format Word Version User Guide & Sample Nutrient Balance Sheet October 2017
 Act 38 Nutrient Balance Sheet Standard Format Word Version User Guide & Sample Nutrient Balance Sheet Pennsylvania Nutrient Management Program Pennsylvania's Nutrient Management Act (Act 38, 2005) Introduction
MINNESOTA HISTORIC FARMS STUDY Snapshot of Farming Regions SNAPSHOT OF FARMING REGIONS IN 1940
 MINNESOTA HISTORIC FARMS STUDY SNAPSHOT OF FARMING REGIONS IN 1940 Most Upper Midwestern farmers, including those in Minnesota, were subject to a similar set of broad geographic, economic, technological,
What Hay Is Right For Your Livestock. Tom Gallagher Capital Area Agriculture Horticulture Program Livestock Specialist
 What Hay Is Right For Your Livestock Tom Gallagher Capital Area Agriculture Horticulture Program Livestock Specialist What Have We Learned So Far? Renovate fields Establish new stands Maintain existing
Guidelines for Estimating. Beef Cow-Calf Production Costs 2017 in Manitoba
 Guidelines for Estimating Beef Cow-Calf Production Costs 2017 in Manitoba ................................................. Guidelines For Estimating Beef Cow-Calf Production Costs Based on a 150 Head
AgriStability Agri-Québec Plus
 AgriStability Agri-Québec Plus Guide for Reporting Productive Units for 2016 This guide contains all the information you need to report productive units for the 2016 participation year Guide for Reporting
NATURAL RESOURCES CONSERVATION BOARD
 Guide 1A NATURAL RESOURCES CONSERVATION BOARD Guide 1A: How To Complete an NRCB Application Approvals Registrations Authorizations Confined Feeding Operations, Manure Collection Areas and Manure Storage
Natural fertiliser control and application system in Poland state of the art. The natural manure composition in Poland estimating and verification
 Natural fertiliser control and application system in Poland state of the art. The natural manure composition in Poland estimating and verification Jacek Walczak Department of Technology, Ecology and Economics
AGRICULTURAL OVERVIEW
 Regional District of Central Okanagan CONTENTS Corporate Name Date of Incorporation August 24, 1967 Postal Address 1450 KLO Road, Kelowna, BC, V1W 3Z4 Phone (250) 763-4918 Fax (250) 763-0606 E-mail Internet
ANIMAL DOMESTICATION
 ANIMAL DOMESTICATION ~10,000 years ago in the Near East Nomadic to Stationary Controlled animal movement/reproduction Behavioral modification Breed development Caring for Animals May Have Shaped Human
Crop Rotations Under Irrigation. Irrigation Agronomy Workshop April 9, 2013 Outlook, SK Gary Kruger PA CCA Irrigation Agrologist
 Crop Rotations Under Irrigation Irrigation Agronomy Workshop April 9, 2013 Outlook, SK Gary Kruger PA CCA Irrigation Agrologist Crop Rotation A planned sequence of crops repeated over time on the same
Bulletin 604 OHIO LIVESTOCK MANURE MANAGEMENT GUIDE
 Bulletin 604 OHIO LIVESTOCK MANURE MANAGEMENT GUIDE Authors and Editorial Committee Randall James, Ph.D. Committee Chair and Editor Associate Professor and Extension Educator Ohio State University Extension,
 i'-u --~.-- ~- f /ft,/ I':
 Guidelines for Estimating. Bison Cow-Calf Production Costs 2017 in Manitoba
 Guidelines for Estimating Bison Cow-Calf Production Costs 2017 in Manitoba ................................................. Guidelines For Estimating Bison Cow-Calf Production Costs Based on a 100 Head
Alameda County Eligibility Requirements for Williamson Act Contracts for Agricultural Uses GUIDELINES FOR COMMERCIAL AGRICULTURE
 Alameda County Eligibility Requirements for Williamson Act Contracts for Agricultural Uses GUIDELINES FOR COMMERCIAL AGRICULTURE Introduction These Guidelines are intended to summarize the requirements
Capturing Manure s Value. March 2008
 Capturing Manure s Value March 2008 Outline What are the nutrients in manure worth? Where do you need these nutrients? How do you get the nutrients to where you want them? How do you determine nutrient
Special Bulletin No. 65
 ID~t 11lututr.attg of t&tuut.aota AGRICULTURAL EXTENSION DIVISION Special Bulletin No. 65 University Farm, St. Paul November 1922 Published by the University of Minnesota, College of Agriculture, Extension
LPES Small Farms Fact Sheets* Got Barnyard Runoff? By Chris Henry, University of Nebraska-Lincoln, and Joe Harner, Kansas State University
 LPES Small Farms Fact Sheets* By Chris Henry, University of Nebraska-Lincoln, and Joe Harner, Kansas State University Summary Uncontrolled runoff from barnyards and open lots can contain nutrients and
Estimating Forage Need. Estimating Forage Need. Basic Grazing Numbers. Dr. Dennis Hancock Extension Forage Specialist Univ.
 Stocking Rate vs. Density Pasture-Based Dairy Summit Aiken, SC 5-19-2011 Paddock Sizing and Design Considerations Stocking Rate! Animals per acre over all acres and a period of time (e.g., months, a season,
Grass-fed and Organic Beef: Production Costs and Breakeven Market Prices, 2008 and 2009
 AS 658 ASL R2684 2012 Grass-fed and Organic Beef: Production Costs and Breakeven Market Prices, 2008 and 2009 Denise Schwab Iowa State University Margaret Smith Iowa State University H. Joe Sellers Iowa
Forage Utilization Guidelines for Beef Cattle
 Purdue University Purdue e-pubs Historical Documents of the Purdue Cooperative Extension Service 11-1-1965 Forage Utilization Guidelines for Beef Cattle K. G. MacDonald Purdue University MacDonald, K.
Animal Protein Production Impacts and Trends Dr. Judith L. Capper
 Animal Protein Production Impacts and Trends Dr. Judith L. Capper Feeding 9 Billion and Maintaining the Planet A Sustainability Challenge: Food Security for All NAS Workshop 1: Measuring Food Insecurity
2011 STATE FFA FARM BUSINESS MANAGEMENT TEST PART 2. Financial Statements (FINPACK Balance Sheets found in the resource information)
") 2011 STATE FFA FARM BUSINESS MANAGEMENT TEST PART 2 Financial Statements (FINPACK Balance Sheets found in the resource information) Please use the Market Value when making the calculations for the Zimmerman
2011 STATE FFA FARM BUSINESS MANAGEMENT TEST PART 2 Financial Statements (FINPACK Balance Sheets found in the resource information) Please use the Market Value when making the calculations for the Zimmerman
Poultry in the Chesapeake Bay Program s Phase 6 Watershed Model
 Poultry in the Chesapeake Bay Program s Phase 6 Watershed Model Matt Johnston University of Maryland CBPO CBPO Non-Point Source Data Analyst Gary Shenk USGS CBPO Phase 6 Model Structure How much? Applied
Summary. Scope. 1 Summary 27
 1 Summary 27 Summary The objective of the Yearbook of Agricultural Statistics is to compile a manageable portion of the available statistics relating to agriculture and food. The main part of the yearbook
Walloon agriculture in figures
 Walloon agriculture in figures 2015 Warning : The definition of the survey sample of the DGS (Direction Générale Statistique) has changed in 2011. Therefore, 2011 marks a break in the time series. Production
The Farming World. LIVESTOCK GENERAL The main elements of the national herd are: - Cattle 10m Sheep 32m Pigs 4.7m Poultry 159m
 The Farming World General Statistics 17m of the 24m hectares making up the UK is down to agriculture 6m hectares of this are down to crops of which 50% is cereals There are 222,000 registered farm holdings.
Calculating the fertilizer value of manure from livestock operations J.A. Moore and M.J. Gamroth
 EC 1094 Reprinted November 1993 $1.00 Calculating the fertilizer value of manure from livestock operations J.A. Moore and M.J. Gamroth Livestock producers know that manure can be applied to croplands as
U.S. Beef Production Practices ---
 Sustainable Livestock Development: Closing the Efficiency Gap --- U.S. Beef Production Practices --- by Tamara McCann Thies National Cattlemen s Beef Association U.S.A. --- April 2, 2012 Overview of U.S.
Nutrient Management in Crop Production
 Nutrient Management in Crop Production Dr. John E. Sawyer Associate Professor Soil Fertility Extension Specialist Focus On Agriculture Water Quality Hypoxia Pfiesteria piscicida Nitrate Tile Flow Sediment
BLUESTEM PASTURE RELEASE 2017
 1320 Research Park Dr. Manhattan, KS 66506 Phone (785) 564-6700 BLUESTEM PASTURE RELEASE 2017 Agricultural Land Use Survey Center 304 Waters Hall Manhattan, KS 66506-4026 Phone (785) 532-1517 Released:
2012 ANNUAL REPORT State Averages
 2012 ANNUAL REPORT State Averages North Dakota Farm and Ranch Business Management Education Regional Reporting Areas www.ndfarmmanagement.com North Dakota Department of Career and Technical Education Mr.
PROJECTING CASH FLOWS ON DAIRY FARMS
 January 2002 E.B. 2002-04 PROJECTING CASH FLOWS ON DAIRY FARMS By Eddy L. LaDue Agricultural Finance and Management at Cornell Cornell Program on Agricultural and Small Business Finance Department of Applied
SAMPLE FARM Nutrient Management Plan
 SAMPLE FARM Nutrient Management Plan General Overall, the nutrient management plan for the farm includes these components: 1) use of poultry litter when soil phosphorus (P) content and timing of application
Seed Certification in Canada. By Dale Adolphe, Executive Director Canadian Seed Growers Association (CSGA)
") Seed Certification in Canada By Dale Adolphe, Executive Director Canadian Seed Growers Association (CSGA) Canadian Pedigreed Acres 1994-2010 T housands 1, 4 5 0 1, 4 0 0 1, 3 5 0 1, 3 0 0 1, 2 5 0 1, 2
Seed Certification in Canada By Dale Adolphe, Executive Director Canadian Seed Growers Association (CSGA) Canadian Pedigreed Acres 1994-2010 T housands 1, 4 5 0 1, 4 0 0 1, 3 5 0 1, 3 0 0 1, 2 5 0 1, 2
Friendly Family Farms Ltd. SE E
 TECHNICAL REVIEW COMMITTEE A TECHNICAL REVIEW REPORT PREPARED FOR THE RURAL MUNICIPALITY OF H A N O V E R Friendly Family Farms Ltd. SE 18-07-06E TRC 12-007 Draft January 17, 2014 A. INTRODUCTION The Technical
Livestock and Poultry Environmental Learning Center Webcast Series June 20, From: G. Albrecht P. Ristow
 Nutrient Management Practices for Small Livestock Farms Dr. Michael L. Westendorf Extension Specialist Rutgers University Fred Kelly New Jersey USDA-Natural Resources Conservation Service Basic Nutrient
Diversifying Your Income Streams
 Diversifying Your Income Streams Executive Women in Agriculture Chicago, Illinois December 2015 Innovus Agra Bret Oelke boelke@innovusagra.com LLC. 218.770.2428 Mission Statement To search for and develop
Ekoniva Corporate Social Responsibility of a Russian Agro-Holding. Washington, D.C. April 26 th 2012 Dr. Christian Ebmeyer
 www.ekosem-agrar.de www.ekoniva.com Ekoniva Corporate Social Responsibility of a Russian Agro-Holding Washington, D.C. April 26 th 2012 Dr. Christian Ebmeyer Ag Investments Do Benefit Local Communities!!
Outline of the presentation
 Session 40-2. Author: Lisbeth.Mogensen@agrsci.dk Life cycle assessment of organic milk production in Denmark Lisbeth Mogensen, Marie T. Knudsen, John E. Hermansen, Troels Kristensen, Thu Lan T. Nguyen
Proceedings, The Range Beef Cow Symposium XXII November 29, 30, & December1, 2011, Mitchell, NE
 Proceedings, The Range Beef Cow Symposium XXII November 29, 30, & December1, 2011, Mitchell, NE Implications of the Ethanol Industry for Cow-Calf Producers Ted C. Schroeder 1 Agricultural Economics Kansas
Certified Organic Production in Canada Prepared for Canadian Organic Growers
 Certified Organic Production in Canada 25 Prepared for Canadian Organic Growers By Anne Macey August 26 Certified Organic Production in Canada 25 Published August 26 Canadian Organic Growers Inc. 323 Chapel
Agricultural Virtual Water Trade and Water Footprint of U.S. States
 Agricultural Virtual Water Trade and Water Footprint of U.S. States Stanley Mubako University of Texas at El Paso Acknowledgements: Doctoral dissertation committee at SIUC What is virtual water? Water
Economics of Breeding, Gestating and Farrowing Hogs in Natural Pork Production; Financial Comparison
 Animal Industry Report AS 652 ASL R2165 2006 Economics of Breeding, Gestating and Farrowing Hogs in Natural Pork Production; Financial Comparison Denis Reich Iowa State University James B. Kliebenstein
CENSUS OF AGRICULTURE HIGHLIGHTS New York State, 1997
 APRIL 1999 E.B. 99-06 CENSUS OF AGRICULTURE HIGHLIGHTS New York State, 1997 Number of Farms, 1997 W. Knoblauch L. Putnam B. Stanton Department of Agricultural, Resource, and Managerial Economics College
Monroe Land & Livestock Lovelock, Nevada
 The Opportunity Monroe Land and Livestock is one of the finest agricultural properties in the Western U.S. The property is a 100% deeded, diversified farm and ranch operation. The ranch has been owned
Intro to Livestock Marketing Annie s Project. Tim Petry Livestock Economist 2018
 Intro to Livestock Marketing Annie s Project Tim Petry Livestock Economist www.ndsu.edu/livestockeconomics 2018 ANNIES Feb2018 Always excuses NOT to market! Marketing takes time and planning Look for excuses
Grant County Blake s Point RE, LLC information sheet for a sow farm
 Grant County Blake s Point RE, LLC information sheet for a sow farm February, Purpose: To produce high quality weaned piglets to supply family pork producers located in the Midwest. Why Grant County: Ag
From City to Farm: Greenbin-derived Compost Agricultural Trials. Compost Council of Canada Workshop January 22, 2013
 From City to Farm: Greenbin-derived Compost Agricultural Trials Compost Council of Canada Workshop January 22, 2013 From City to Farm: Greenbin Derived Compost Agricultural Trials Fertilizer value Organic
Manure Management Guidelines
 Manure Management Guidelines 2006 Table of Contents Foreword...3 1. Introduction...4 2. Statement of Intent...5 3. Regulatory Considerations...6 4. Siting of Manure Storage Facilities.........................
The Status of Alabama Agriculture
 SPECIAL LEAFLET DECEMBER 1940 The Status of Alabama Agriculture A By M. J. FUNCHESS, Director Alabama Experiment Station LABAMA is largely a rural state with approximately onehalf the population living
Crops Rotation and Cover Cropping Plan for SAMPLE FARM
 Crops Rotation and Cover Cropping Plan for SAMPLE FARM Field Year Crop 1 Doublecrop Source biomass-n Summer cover Cover Plant Date Cover Kill Date 5a 2014 Corn grain Wheat Rye Cowpea 10.15.2013/9.05.2014
2017 Trends in Nebraska Farmland Markets: Declining Agricultural Land Values and Rental Rates
 University of Nebraska - Lincoln DigitalCommons@University of Nebraska - Lincoln Cornhusker Economics Agricultural Economics Department 2017 2017 Trends in Nebraska Farmland Markets: Declining Agricultural
CME Group Commodity Products. CME Group Livestock Futures and Options: Introduction to Underlying Market Fundamentals
 CME Group Commodity Products CME Group Livestock Futures and Options: Introduction to Underlying Market Fundamentals In a world of increasing volatility, CME Group is where the world comes to manage risk
Sreedhar Patil 5/30/2013
 Farming in India Sreedhar Patil 5/30/2013 Location of India in World Map States in India Bangalore, Karnataka, INDIA 28 states and seven union territories Annual Rainfall in India Rivers in India River
Chapter 2 FEASIBILITY OF ADOPTING PHOSPHORUS-ROTATION LIMITS VERSUS NITROGEN LIMITS FOR MANURE APPLICATION 2.1 INDEX
 Chapter 2 FEASIBILITY OF ADOPTING PHOSPHORUS-ROTATION LIMITS VERSUS NITROGEN LIMITS FOR MANURE APPLICATION John A. Lory 1, Ph. D., Ray Massey 2, Ph.D., Joe Zulovich 3, Ph.D., P.E., Amy Millmier 3, M.S.,
The Vermont Dairy Farm Sustainability Project, Inc.
 The Vermont Dairy Farm Sustainability Project, Inc. The Vermont Dairy Farm Sustainability Project A Collaboration to Improve Dairy Farm Nutrient Balance Greg Weber, Project Coordinator, 2001-2003 Bill
Change FORAGES MORE PEOPLE FORAGES: CHANGE-CHALLENGES- OPPORTUNITIES. Garry D. Lacefield Extension Forage Specialist University of Kentucky
 FORAGES: CHANGE-CHALLENGES- FORAGES OPPORTUNITIES Garry D. Lacefield Extension Forage Specialist University of Kentucky Change-Challenges-Opportunities Change Dr. Garry Lacefield Extension Forage Specialist
FACTORS THAT AFFECT THE PRICE OF MANURE AS A FERTILIZER Ray Massey, Economist University of Missouri, Commercial Ag Program
 FACTORS THAT AFFECT THE PRICE OF MANURE AS A FERTILIZER Ray Massey, Economist University of Missouri, Commercial Ag Program This paper discusses the value of manure as a soil amendment/fertilizer source.
ORGANIC VEGETABLE NUTRIENT MANAGEMENT
 ORGANIC VEGETABLE NUTRIENT MANAGEMENT Headwaters Incubator Program April 6 th, 2016 Nick.andrews@oregonstate.edu (503) 913-9410 Organic nutrient management topics Soil sampling Soil ph and lime P & K sufficiency
THE FUTURE OF NUTRIENT MANAGEMENT IN WISCONSIN
 THE FUTURE OF NUTRIENT MANAGEMENT IN WISCONSIN Susan M. Porter 1 The Department of Agriculture, Trade and Consumer Protection (DATCP) is responsible for promulgating nutrient management rules in Wisconsin
RETUR COSTS A 8 R R. and 96 LI6R R
 U.S. DEPARTMENT OF AGRICULTURE ECONOMIC RESEARCH SERVICE SEPTEMBER 1968 FCR -62 koope roting with KENTUCKY AND TENNESSEE AGRICULTURAL EXPERIMENT STATIONS COSTS A 8 R R. LI6R R and 96 RETUR FARM COSTS AND
Certified Non-GMO by AGW
 Certified Non-GMO by AGW The following Certified Non-GMO by AGW standards are an optional addition to the individual Animal Welfare Approved by AGW livestock standards. In order for products to be approved
regon Agricultural Commodities
 I regon Agricultural Commodities Farm Values and Processed Values H Extension Service and Agricultural Experiment Station, Oregon State University Our cover: For this edition, we feature Oregon green snap
Cattle Market Situation and Outlook
 Cattle Market Situation and Outlook Rebuilding the Cow Herd Series March 28, 2007 Falls City, TX Coordinated by: Dennis Hale-Karnes CEA Ag & Charlie Pfluger-Wilson CEA Ag Prepared and presented by: Larry
Grazing Management Different Strategies. Dr Jim Russell and Joe Sellers Iowa State University
 Grazing Management Different Strategies Dr Jim Russell and Joe Sellers Iowa State University Cattle are important Keeping land in grasses reduces erosion and improves water quality Productive, well managed
Manitoba Flax Production
 the art of research Manitoba Flax Production Executive Summary March 2015 Insightrix Research Inc. 1-3223 Millar Avenue Saskatoon, SK S7K5Y3 1-866-888-5640 (toll free) 1-306-657-5640 info@insightrix.com
Summary of Manure Handling Systems in the Context of Hullcar
 Summary of Manure Handling Systems in the Context of Hullcar A part of the Hullcar Situation Review Nutrient Management Practices - Technical Report October 2017 File No. 631.700-6 Prepared for: POLIS
Horses, donkeys and ducks: identifying key trends in other livestock and poultry
 Catalogue no. 96 325 X ISSN 0-662-35659-4 Canadian Agriculture at a Glance Horses, donkeys and ducks: identifying key trends in other livestock and poultry by Mitra Rostami Agriculture Division Release
Saskatchewan Herd Size Economics June 26, th Annual WBDC Field Day. Kathy Larson WBDC Beef Economist
 Saskatchewan Herd Size Economics June 26, 2012 14 th Annual WBDC Field Day Kathy Larson WBDC Beef Economist 2003 1.32 million 2006 1.56 million 2012 1.29 million Down 17% from peak Down 2% from pre-bse
Characteristics of beef cattle operations in the West. C. Alan Rotz,* Senorpe Asem-Hiablie,* Robert Stout,* and Kathleen Fisher
 BEEF FACTS: SUSTAINABILITY BEEF RESEARCH Characteristics of beef cattle operations in the West C. Alan Rotz,* Senorpe Asem-Hiablie,* Robert Stout,* and Kathleen Fisher In 2011, the Beef Checkoff s U.S.
Economic, Productive & Financial Performance Of Alberta Cow/Calf Operations
 Benchmarks for Cattlemen Economics & Competitiveness Economic, Productive & Financial Performance Of Cow/Calf Operations Southern Fescue land, Mixed land & Moist Mixed land Production Year - 2002 Jan.
EC Estimating the Most Profitable Use of Center-Pivot Irrigation for a Ranch
 University of Nebraska - Lincoln DigitalCommons@University of Nebraska - Lincoln Historical Materials from University of Nebraska- Lincoln Extension Extension 1974 EC74-861 Estimating the Most Profitable
Lesson 21. Sizing Manure Storage, Typical Nutrient Characteristics By Charles Fulhage and John Hoehne, University of Missouri
 LESSON 21 Sizing Manure Storage, Typical Nutrient Characteristics Lesson 21 Sizing Manure Storage, Typical Nutrient Characteristics By Charles Fulhage and John Hoehne, University of Missouri 1 MODULE C