STUDIES AND REVIEWS GENERAL FISHERIES COMMISSION FOR THE MEDITERRANEAN. No
|
|
|
- Stanley Reed
- 6 years ago
- Views:
Transcription

1 GENERAL FISHERIES COMMISSION FOR THE MEDITERRANEAN ISSN STUDIES AND REVIEWS No INDICATORS FOR THE SUSTAINABLE DEVELOPMENT OF FINFISH MEDITERRANEAN AQUACULTURE: HIGHLIGHTS FROM THE InDAM PROJECT
2 STUDIES AND REVIEWS No. 90 GENERAL FISHERIES COMMISSION FOR THE MEDITERRANEAN INDICATORS FOR THE SUSTAINABLE DEVELOPMENT OF FINFISH MEDITERRANEAN AQUACULTURE : HIGHLIGHTS FROM THE InDAM PROJECT FOOD AND AGRICULTURE ORGANISATION OF THE UNITED NATIONS Rome, 2011
3 The designations employed and the presentation of material in this information product do not imply the expression of any opinion whatsoever on the part of the Food and Agriculture Organisation of the United Nations (FAO) concerning the legal or development status of any country, territory, city or area or of its authorities, or concerning the delimitation of its frontiers or boundaries. The mention of specific companies or products of manufacturers, whether or not these have been patented, does not imply that these have been endorsed or recommended by FAO in preference to others of a similar nature that are not mentioned. The views expressed in this information product are those of the authors and do not necessarily reflect the views of FAO. ISBN All rights reserved. FAO encourages reproduction and dissemination of material in this information product. Non-commercial uses will be authorized free of charge. Reproduction for resale or other commercial purposes, including educational purposes, may incur fees. Applications for permission to reproduce or disseminate FAO copyright materials and all other queries on rights and licences, should be addressed by to copyright@fao.org or to the Chief, Publishing Policy and Support Branch, Office of Knowledge Exchange, Research and Extension, FAO, Viale delle Terme di Caracalla, Rome, Italy. FAO 2011 ii
4 PREPARATION OF THIS DOCUMENT This document is the report of the first year of the InDAM Project Indicators for Sustainable Development of Aquaculture and Guidelines for their use in the Mediterranean, funded by the EU DG Mare, and carried out in support to the GFCM CAQ Working Group on Sustainability in Aquaculture (WGSA). It includes a first part containing the project rationale and the description of the activities carried out during the first year, including the results from two pilot studies (in Turkey and in Tunisia), and a second part of annexes reporting selected papers useful for the InDAM Project purposes. The document was prepared by the WGSA, by the national experts who carried out the pilot studies, by Mediterranean experts involved in other projects on sustainability in aquaculture and relative indicators, and compiled and edited by the GFCM Secretariat and by D. Crosetti (ISPRA, Italy). ACKNOWLEDGEMENTS This document could not have been completed without the cooperation and contribution of the experts, research institutes, POs, NGOs and national authorities for the pilot studies. In particular the following are acknowledged: IFREMER Montpellier and the Faculty of Economic Sciences, University of Montpellier, for the I and II Expert meetings; the INSTM (Institute des Sciences et Technologies de la Mer, Tunisia) for the first year final meeting; MARA (the Ministry of Agriculture and Rural Affairs of Turkey) and the Provincial Directorate of Agriculture in Mugla, Turkey, for the Pilot Study in Turkey; the Ministry of Agriculture and Marine Resources of Tunisia for the Pilot Study in Tunisia. iii
5 GFCM, Indicators for the sustainable development of finfish Mediterranean aquaculture: highlights from the InDAM Project. Studies and Reviews. General Fisheries Commission for the Mediterranean. No. 90 Rome, FAO. 2011: 218p. ABSTRACT The document reports the activities carried out during the first year of the InDAM Project Indicators for Sustainable Development of Aquaculture and Guidelines for their use in the Mediterranean in support to the GFCM CAQ Working Group on Sustainability in Aquaculture (WGSA) and funded by the EU DG Mare. The project focuses on the practical use of the indicators for sustainable aquaculture and their adaptation to the Mediterranean Sea. The methodology applied for the identification of the preliminary list of indicators was based on the PCI (Principles, Criteria and Indicators) approach and took into consideration the main outcomes and achievements of the recent projects carried out in the Mediterranean on the identification of indicators for sustainable aquaculture. The principles of sustainability and standards, in their four dimensions: governance, economic, social and environmental, and their relationship with aquaculture and its sustainable development in the coastal areas, are highlighted. The document also reports the results of the workshop on the Selection of indicators for the sustainable development of aquaculture in the Mediterranean Sea (27 th -28 th November 2008, Montpellier, France), the expert meeting on Indicators for the sustainable development of aquaculture in the Mediterranean Sea (24-26 February 2009, Montpellier, France) and the workshop on Guidelines and application of indicators for sustainable development of aquaculture (19-20 November 2009, Salammbô, Tunisia). The recommendations given by the WGSA are also included. The two pilot studies on the selection and evaluation of the indicators for aquaculture sustainable development carried out in Mugla, Turkey, and Monastir, Tunisia, are described. The data base on relevant indicators for sustainable aquaculture and the web portal on the InDAM Project activities hosted on the SIPAM website are presented. iv
6 CONTENTS PREPARATION OF THIS DOCUMENT... iii ACKNOWLEDGEMENTS... iii ABSTRACT... iv CONTENTS... v TABLES... vii FIGURES... vii ABBREVIATIONS AND ACRONYMS... viii 1. INTRODUCTION Mediterranean aquaculture sustainability: problems and issues to be addressed Background The InDAM project framework Project objectives Strategy and methodology Outcome and expected outputs InDAM activities Identification of methodology: the PCI approach Selection of indicators for sustainable aquaculture in the Mediterranean region Identification of the methodology for the pilot studies Guidelines and application of indicators for sustainable development of aquaculture Conclusions and recommendations of the InDAM first year THE PILOT STUDY IN TURKEY Introduction Methodology applied for the selection of indicators Identification and prioritization of attributes to be used in the selection of indicators A rapid appraisal method for the selection of indicators ( Acceptability as only one attribute) Selection of indicators (appraisal) based on prioritized attributes Results Identification and prioritization of attributes to be used in the selection of indicators Governance dimension - DGo Economic dimension - DEc Social dimension - DSo Environmental dimension - DEn General conclusions and recommendations Appendices v
7 3. THE PILOT STUDY IN TUNISIA Introduction Methodology applied for the selection of indicators Results of the questionnaires on the evaluation of indicators Identification and prioritization of the attributes to be used in the selection of indicators Governance dimension DGo Economic dimension DEc Social dimension - DSo Environmental dimension - DEn General conclusions INDICATORS FOR AQUACULTURE SUSTAINABILITY FOR THE MEDITERRANEAN Governance dimension Economic dimension Social dimension Environmental dimension BIBLIOGRAPHIC REFERENCES AND DATABASE ON INDICATORS FOR THE SUSTAINABLE DEVELOPMENT OF MEDITERRANEAN AQUACULTURE Introduction Methodology Design and development of a databank InDAM - SHoCMed Designing and implementing a web search engine Outputs The InDAM databank The InDAM database (InDAM-db) Annex 1 - Key issue and some postulates concerning the use of indicators for sustainable development: the example of aquaculture Annex 2 - Aquaculture sustainable development and governance system Annex 3 - Analysis of the standards and indicators for sustainable development of aquaculture Annex 4 - Analysis of the sustainability of Mediterranean aquaculture: case studies in France and Cyprus Annex 5 - Towards the implementation of sustainable development of aquaculture in the mediterranean: the conditions of governance Annex 6a - Participants to the InDAM project Annex 6b - Participants to the InDAM project meetings and events Annex 7 - InDAM-db bibliographic references Annex 8 - Projects and initiatives on aquaculture sustainability in the Mediterranean region and related issues vi
8 TABLES 1 The terms reported in the EVAD document agreed upon and adopted with minor changes by the WGSA Number of selected principles, criteria and indicators for each dimension Ranking of indicator selection attributes Results of rapid appraisal for the governance dimension (DGo) Results of selection of indicators using prioritized attributes for the governance dimension Ranking of indicators based on thier weighted mean score in terms of prioritized attributes for the governance dimension Results of rapid appraisal for the economic dimension Results of selection of indicators using prioritized attributes for the economic dimension Ranking of indicators based on their Weighted average score in terms of prioritized attributes for the economic dimension DSo/ Results of rapid appraisal Results of selection of indicators using prioritized attributes for the social dimension Ranking of indicators based on their weighted average score in terms of prioritized attributes for the social dimension Results of rapid appraisal for the environmental dimension Results of selection of indicators using prioritized attributes for the environmental dimension Ranking of indicators, based on their weighted average score in terms of prioritized attributes for the environmental dimension Attribute score Results of selection of indicators using prioritized attributes for the governance dimension Ranking of indicators based on their weighted mean score in terms of prioritized attributes for the governance dimension Results of selection of indicators using prioritized attributes for the economic dimension Ranking of indicators based on their weighted average score in terms of prioritized attributes for the economic dimension Results of selection of indicators using prioritized attributes for the social dimension Ranking of indicators based on their weighted average score in terms of prioritized attributes for the social dimension Results of selection of indicators using prioritized attributes for the environmental dimension Indicators of aquaculture sustainability within the 4 dimensions FIGURES 1 InDAM-db: draft search page The InDAM databank InDAM webpage The InDAM database (InDAM-db) layout vii
9 ABBREVIATIONS AND ACRONYMS APFA API APROMAR CAQ CCRF CIPA EAA EC EIA EMS EU FAO FEAP FISHSTAT GFCM ICZM IFREMER INRH ISO ISPRA IUCN NACA NEPAD OECD PCI PO R&D SEAFDEC SIPAM UNDP WGSC WGSA WWF Australian Prawn Farmers Association Associazione Piscicoltori Italiani Federation of Spanish Aquaculture Producers Committee on Aquaculture Code of Conduct of Responsible Fisheries Comité Interprofessionnel des Produits de l Aquaculture Ecosystem Approach for Aquaculture European Commission Environmental Impact Assessment Environmental Management System European Union Food and Agriculture Organisation Federation of European Aquaculture Producers Computer System for Global Catches General Fisheries Commission for the Mediterranean Integrated Coastal Zone Management French Research Institute for Exploitation of the Sea Institut National de Recherche Halieutique du Maroc International Organisation for Standardization Italian Institute for the Environmental Protection Research International Union for Conservation of Nature Network of Aquaculture Centres in Asia-Pacific The New Partnership for Africa s Development Organisation for Economic Co-operation and Development Principle, Criterion, Indicator Producer Organisation Research and Development Aquaculture Department of the Southeast Asian Fisheries Development Center Information System for the Promotion of Aquaculture United Nations Development Programme Working Group on Site selection and Carrying capacity Working Group in Sustainability in Aquaculture World Wide Fund for Nature viii
10 1. INTRODUCTION Mediterranean aquaculture sustainability: problems and issues to be addressed The world-wide expansion of aquaculture has brought a number of environmental and socio-economic issues, which impact the sustainability of the sector. Reaching the status of stable aquaculture industry means insuring that aquaculture is economically, environmentally but also socially sustainable, i.e. that it includes issues such as integrated coastal zone management or consumer confidence in aquaculture products. Mediterranean aquaculture is already facing difficulties related to several factors such as scant production, interaction and space competition with other users of the coastal zone, negative image of its impact on the environment and quality of its product, lack of legislation framework for aquaculture, market competition from imported products and market competition among Mediterranean countries. Indeed sustainability principles and standards in their four dimensions (governance, economic, social and environmental) differ from one country to another, making it difficult to establish the position of Mediterranean aquaculture in terms of marketing and social acceptability, and questioning its sustainable development in the coastal areas at regional and national scale. The importance of the development of sustainable marine and brackish aquaculture within coastal zone management has been discussed at different levels and its relative integration has become one of the major issues in Mediterranean aquaculture. Criteria are needed to describe an agreed level of sustainability of aquaculture activities and to meet economic, social and environmental demands. In this respect the identification of indicators and of relative reference points and standards is considered a priority for the process of harmonizing strategy for Mediterranean aquaculture management and development. 1.2 Background The adoption of the Code of Conduct for Responsible Fisheries (CCRF) during the 28 th Session of the FAO Conference (1995) provided the essential framework for the sustainable management of fisheries and aquaculture. In 1999 (Rome, FAO) a consultation 2 was held to discuss the application of principles of the article 9 of the CCRF in Mediterranean countries. This consultation generated 14 national reports and elements of national action plans for the development of sustainable aquaculture in the GFCM area. Among the actions proposed, a series of activities was identified in support of a better understanding of the criteria and techniques for sustainable aquaculture, such as the design of indicators of sustainability for production systems. The consultation recognized the General Fisheries Commission of the Mediterranean (GFCM) Committee on Aquaculture (CAQ) as the proper body to coordinate the follow up of the activities that were identified. In the GFCM region, raising interest in aquaculture sustainability has led to a number of initiatives, all related to aquaculture sustainability issues. In 2003, a specific expert consultation on Interaction between aquaculture and capture fisheries was held in Rome (5 th -7 th November 2003) 3 under the FAO AdriaMed project. The consultation provided the opportunity to develop a preliminary matrix for the identification of indicators, a first step towards the definition of a set of indicators to monitor the relationship between aquaculture and capture fisheries in the Adriatic region according to the sustainability criteria. The CAQ identified the sustainable development of Mediterranean aquaculture as a priority, and to address it in 2007 the CAQ was reorganised in three Working Groups: one focusing on marketing priorities, one on the interaction between aquaculture and environment, and one focusing specifically 1 Prepared by the GFCM-CAQ Working Group on Sustainability in Aquaculture 2 FAO (1999) Report of the Consultation on the Application of article 9 of the FAO Code of Conduct for Responsible Fisheries in the Mediterranean Region, Rome, July FAO Fisheries Report, No 606, Rome, FAO, 208p. 3 Cataudella, S.; Massa, F.; Crosetti, D. (eds.) (2005) Interactions between aquaculture and capture fisheries: a methodological perspective. Studies and Reviews. General Fisheries Commission for the Mediterranean. No. 78. Rome, FAO, 229p. 1
11 on sustainability. A consensus definition of aquaculture sustainability in the Mediterranean region is a priority on which to develop indicators and relative reference points for a targeted audience (farmers, decision-makers, etc.) with the aim of facilitating individual and collective choices toward a sustainable development of Mediterranean aquaculture. 1.3 The InDAM project framework The InDAM Project Indicators for Sustainable Development of Aquaculture and Guidelines for their Use in the Mediterranean was designed and developed within the Working Group on Sustainability in Aquaculture (WGSA) of the GFCM-CAQ. The project focuses on the practical use of indicators for sustainable aquaculture, their adaptation to the Mediterranean Sea, and on the development of appropriate guidelines. The first formulation of InDAM was prepared in November 2006 during the first meeting of the GFCM-CAQ WGSA and represents the follow up of the request made by the CAQ during its fifth session (June 2006). The project proposal was approved during the 31 st session of the GFCM (January 2007) and it is operative since November It is funded with the contribution of the European Union (EU), DG MARE, and has a duration of four years. The InDAM Project aims at providing countries with a comprehensive decision-support tool for the development of sustainable aquaculture based on a set of indicators, reference points and guidelines adapted to the Mediterranean region. A further aim of the InDAM Project is to establish a regional sustainable reference system for the development of marine aquaculture in the Mediterranean by intergrading the governance, economic, social and environmental dimensions into coastal zone management and by using the Ecosystem Approach for Aquaculture (EAA) in the selection of indicators. The work plan of the project is yearly based and a strategic revision could be performed according to the priorities gaps that will be identified during the project Project objectives The InDAM Project specifically focuses on Mediterranean finfish species, with the aim of developing practical indicators and relative reference points and standards for direct and concrete use by the various stakeholders (farmers, users of the coastal zone, decision-makers, NGOs, etc.) within a shared definition and framework of the sustainable development of Mediterranean aquaculture. InDAM used a participatory methodology involving relevant stakeholders in the process of screening and selecting the indicators 4. InDAM also aims at providing the opportunity to establish proper links between the GFCM and current and future projects pertaining to aquaculture sustainability, to ensure that the GFCM benefits from the most recent results from research and from innovation in the field and to guarantee coherence between the different initiatives (including the GFCM-CAQ SHoCMed 5 and the MedAquaMarket 6. projects). The InDAM development goal is to support and facilitate decision-making toward the sustainable development of Mediterranean aquaculture at all range of scales, from individual to collective, and for a large range of stakeholders (decision-makers, producers, users of coastal zones, NGOs, etc.). 4 FAO (1999). Indicators for sustainable development of marine capture fisheries. FAO Technical guidelines for responsible fisheries. No 8, Rome, FAO, 68p. 5 The SHoCMed Project Developing site selection and carrying capacity guidelines for Mediterranean aquaculture within aquaculture appropriate areas GFCM/CAQ, in support to the activities of the GFCM CAQ, co-funded by European Commission DG-MARE. The SHoCMed Project aims at producing criteria to enhance the integration of aquaculture into coastal zone management by improving site selection and holding capacity and identifying environmental quality standards and reference points 6 The MedAquaMarket Project in Support to the GFCM-CAQ Working Group on Marketing of Aquaculture Products: Development of a Strategy for Marketing and Promotion of Mediterranean Aquaculture, funded by the Spanish Government (Secretaría General de Pesca, Ministerio de Agricultura, Pesca y Alimentación) 2
12 1.3.2 Strategy and methodology The strategy of the project is to assist the GFCM countries in the elaboration of a consensus definition and guidance toward aquaculture sustainability in the Mediterranean region. This included the use of a multi-disciplinary and participatory methodology for the selection of sets of indicators. The tool to develop and select indicators is to elaborate and to take advantages of selected methodologies applied in other similar situations and adapted to the Mediterranean context, taking into account multiple stakeholders, targeted uses of indicators and existing aquaculture systems. Furthermore, the InDAM Project took advantage of the outputs of several projects and initiatives dealing with European/Mediterranean aquaculture sustainability, with the identification of indicators at different levels (EVAD 7, Evaluation of sustainability of aquaculture systems; the IUCN 8 initiative in the preparation of guidelines for sustainable aquaculture in the Mediterranean Region; SEACASE 9, Sustainable extensive and semi-extensive coastal aquaculture in Southern Europe; ECASA 10, An ecosystem approach for sustainable aquaculture; CONSENSUS 11, Defining indicators for sustainable aquaculture development in Europe). Pilot studies for the determination of the different indicators for each dimension are being performed in various Mediterranean sites with different aquaculture typologies, in order to refine the definition of indicators, to prioritize them and to receive feedback from the different stakeholders. The project is structured in two phases: a methodological phase (Phase I) and an extension phase (Phase II). Phase I includes the development, refinement and test of the methodology and sets of indicators. At the end of Phase I, a draft guideline for the use of indicators, including feasibility, practicality, expertise-requirement, cost-effectiveness, etc. will be released. Results will be presented and examined in a workshop where the activities of Phase II will be discussed and planned. Phase II is an extension phase where indicators will be concretely applied in test sites in order to cover the diversities in the Mediterranean region and ensure a good adaptation of indicators to the field and to local needs. This strategy should also ensure a high degree of participation of the countries. Outputs from the test sites will allow the revision, the completion and the refinement of tools and the selection of indicators. 7 EVAD is a research program (CIRAD, INRA, IFREMER, IRD, University Montpellier 1) focusing on methodological questions regarding the evaluation of aquaculture sustainability. It aims at developing a tool to evaluate sustainability based on indicators and taking into account issues shared in aquaculture as well as local specificity related to the territorial dimension (environmental, economic, social and governance context) of aquaculture (Annex 1). 8 IUCN Guides for the sustainable development of Mediterranean aquaculture: 1. Interactions between aquaculture and the environment, Aquaculture site selection and site management, Responsible aquaculture practices and certification, - and Analysis of the standards and indicators for sustainable development of aquaculture (Annex 3) 9 SEACASE: the main goal of this project is to provide added-value to the extensive and semi-extensive sector aquaculture in Southern Europe, by optimising systems and promoting differentiation in the marketed product maintaining sound environmental conditions in coastal zones. Its activities focus on the promotion of new production systems (e.g. polyculture), developing environmental friendly protocols, quality markers and certification. 10 ECASA is an EU funded FP6 project following up several previous programs of the 4th and 5th EU research framework on the effects of aquaculture activities on the environment, with particular reference to the Mediterranean Sea. The objective of the current program is to support the industry in providing guidance and tested tools to minimise environmental impacts whilst maximising productivity. 11 CONSENSUS is an initiative that works towards sustainable European aquaculture by building sustainable aquaculture protocols that are based on low environmental impact, high competitiveness and ethical responsibility with regard to biodiversity and animal welfare. It was funded by the Commission of European Communities under the 6th Framework Programme, thematic priority Food Quality and Safety. 3
13 1.3.3 Outcome and expected outputs The final outcome of InDAM is to provide policy makers with a comprehensive decision support tool regarding sustainable aquaculture development in the Mediterranean. This tool is based on the production of sets of indicators and relative reference points and standards to guide, evaluate and provide incentives towards the sustainable development of Mediterranean aquaculture in its four dimensions (governance, economic, social, and evironmental). Sets of indicators will be produced using a multi-stakeholder, participatory and multi-disciplinary methodology adapted to the Mediterranean context. These indicators should be practical and should provide concrete guidance for multiple stakeholders and different aquaculture systems. InDAM will produce three main outputs, described below, as a result of the activities carried out in four years and two phases: the methodological phase (Phase I) and the extension phase (Phase II). Follow-up activities from the year two to four will be reviewed yearly and detailed on the basis of advanced results and multi-stakeholder workshop outputs in order to secure the achievement of expected outputs. Output 1- A consensus definition of sustainability of aquaculture development in the Mediterranean within the framework of an ecosystem approach to aquaculture is established Output 2 - Relevant documentation on aquaculture sustainability is gathered and regularly updated and proper synergies between other projects related to sustainable development of aquaculture and the Working Group on Aquaculture Sustainability of the GFCM are identified and developed Output 3 - The most suitable and workable sets of indicators and reference points guiding the sustainable development of Mediterranean aquaculture are established as a result of regional multidisciplinary cooperation and also as following the feedback from expert input and stakeholders 1.4 InDAM activities The InDAM Project is operative since November This document mainly refers to the first year of the InDAM Project, during which the activities listed below were carried out. During this period, expert meetings and stakeholders meetings were organized, taking into consideration the contribution and the outputs of the different projects and initiatives operating in the Mediterranean region and taking advantage of the selected methodologies. Reviews were prepared and existing documentation on sustainable aquaculture was gathered. The methodologies for the implementation of the project as well as the definition of sustainable aquaculture were discussed and agreed by the WGSA and the preliminary list of indicators for each one of the four dimensions (governance, economic, social and environmental) of sustainable aquaculture was identified, based on the input from the experts; The two first pilot studies were developed and implemented in order to receive feedback from stakeholders based on the attribution of priorities among the indicators identified; A database on relevant indicators for sustainable aquaculture was implemented and a web portal on the InDAM Project activities was prepared and is at present hosted in the SIPAM website. Within the InDAM Project, the CAQ-WGSA organised a series of meetings and events as follows: The workshop on the Selection of indicators for the sustainable development of aquaculture in the Mediterranean Sea was held in Montpellier (France) from 27 th to 28 th November 2008, with support from IFREMER and was hosted by the Faculty of Economic Sciences, Univesity of Montpellier. The expert meeting on Indicators for the sustainable development of aquaculture in the Mediterranean Sea was also held in Montpellier (France) from 24 th to 26 th February 2009 with the support of IFREMER and was hosted by the Faculty of Economic Sciences, University of Montpellier. 4
14 The workshop on Guidelines and application of indicators for sustainable development of aquaculture was held in Salammbô (Tunisia) from 19 th to 20 th November 2009 and was hosted by the INSTM (Institut National des Sciences et Technologies de la Mer). Two technical meetings were organised to finalize the two pilot studies, respectively in Turkey and in Tunisia. The technical meeting of the Pilot Study in Turkey was held from 28 th to 29 th September 2009 at the Provincial Directorate of Agriculture in Mugla (Turkey). The technical meeting of the Pilot Study in Tunisia was held from 13 th to 14 th October 2009 in Monastir (Tunisia). A selected bibliography and a database on indicators for the sustainable development of Mediterranean aquaculture were prepared (chapter 5 and annex 7). A series of documents prepared by experts are reported as Annexes 1 to 5. An analysis of the standards and indicators for the sustainable development of aquaculture was prepared in the framework of IUCN activities on aquaculture sustainability and is reported as Annex Identification of methodology: the PCI approach The workshop "Selection of indicators for the sustainable development of aquaculture in the Mediterranean Sea 12 aimed at reviewing recent research initiatives and methodologies in the development of aquaculture indicators. Sixteen experts participated to the workshop. Eleven presentations were made on recent experience gained from research and cooperation programmes on the identification and development of sustainable aquaculture indicators. During the meeting the experts discussed and agreed upon the methodological approach and time frame, as well as on the pre-identification of the principle representing the conceptual framework in which sustainable aquaculture should be developed following the Principles-Criteria-Indicators (PCI) approach. Methodological aspects related to the implementation of sustainable development and in particular to some aspects on the PCI method were discussed during the meeting, recalling the experience carried out by EVAD (Table 1) 13. The PCI method is essential to link the indicators to the principles of sustainable aquaculture. Reference was made to the selection of the objectives for the establishment of a reference system for indicators and for their application at local level in the InDAM context. Methodology to identify indicators was agreed upon. The principles and criteria identified for each of the relevant dimensions of sustainable development were presented. Table 1 The terms reported in the EVAD document agreed upon and adopted with minor changes by the WGSA Principles are associated to the different dimensions (or pillars) of sustainable aquaculture (Governance, Economic, Social, and Environmental). Criteria break down the principle into specific themes or characteristics and specify the issue to be addressed through the relevant variables to be monitored. Indicators allow the criteria to be (qualitatively or quantitatively) measured, and are essential to monitor or assess the behaviours of the criteria over time. Reference indicate the particular state of the issue to be monitored. Once an indicator is associated points with its standard it is possible to have a reference point indicating the particular state of the issue to be monitored. Source: Rey Valette et al.(2008) 12 The outcome of the workshop on the Selection of indicators for the sustainable development of aquaculture in the Mediterranean Sea is available at 13 Hélène REY-VALETTE et al. (2008). Guide to the co-construction of sustainable development indicators in aquaculture. EVAD. Cirad, Ifremer, INRA, IRD, UM1 November p. 5
15 The main topics mentioned during the discussion and the main aspects related to the workshop are hereunder summarized: There is the necessity of common criteria and relative indicators to describe the level of aquaculture sustainability in the Mediterranean and the Black Sea areas. Meeting economic, social and environmental demands with common reference systems is an essential condition for the responsible development of marine aquaculture in the GFCM region; The joint exercise on selecting both principles and criteria made by participants following a multidisciplinary approach was important to generate discussion and to achieve the appropriation of the correct terminology and was considered essential toward the implementation of InDAM Project activities; The definition of indicators should continue in a cooperative way and according to the different level of expertise, taking into account the recent progresses made and the outputs obtained by the various research projects and programmes. Stakeholders involvement is fundamental in order to harmonise the strategies for aquaculture management; The cooperation and exchange of knowledge and experience represent the basis in designing indicators for the WGSA purposes. Reviewing and taking advantages from the outputs of the different initiatives prevents duplication and will help countries and stakeholders to design a development strategy for sustainable aquaculture; At present environmental and marketing aspects are the most critical issues to be addressed for sustainable aquaculture. Therefore, cooperation and synergy with the CAQ Working Groups on Site Selection and Carrying Capacity and on Marketing, as well as the proper acknowledgment of their outputs, is fundamental when selecting indicators; Indicators should also be considered for communication between farmers and society. The criteria should respond to the public and consumers concerns about aquaculture and serve to communicate the positive aspects of a responsible sector managed in a sustainable way. The InDAM targets beneficiaries are the farmers and decision makers who will benefit from the use of sustainability indicators Selection of indicators for sustainable aquaculture in the Mediterranean region The identification and selection of sustainable indicators for aquaculture represent an integral part of the InDAM Project programme and were carried out at the expert meeting held in Montpellier in February 2009, with the participation of twelve experts. According to their expertise, the participants were organised into three sub-groups (Social- Governance, Economic and Environmental) to agree upon the principles, the criteria and the indicators for sustainable aquaculture and whenever possible to define measurement parameters and reference points (Table 1). Based on the EVAD approach, a first list of indicators was proposed and discussed. The indicators were associated to the selected Principles for each one of the pillars of sustainability (governance, economic, social and environmental). The indicators selection was not restricted to aquaculture but was also considered within a more integrated approach at territorial level (ICZM for instance). Table 2 Number of selected principles, criteria and indicators for each dimension Dimension Principles Criteria Indicators Governance Economic Social Environmental
16 The participants commented that the indicators identified are too many and that this could represent a limit to their application at local scale. Efforts should be made to reduce their number. For the local community the indicators should not represent an additional overload of work or commitment on existing monitoring schemes; efforts should be made to take advantage of the already existing indicators and adapt them to the concepts of sustainability. The list of indicators identified is the result of the cooperative discussion and exchange of points of view among the experts, as initiated by InDAM. After some discussion the lists of indicators selected were considered by the experts as appropriate for the description of aquaculture sustainability at regional level. Any kind of simplification should be considered as part of the project progress and it could be performed only after having tested these indicators at local level. Participants also recalled that InDAM was also designed to focus attention on the practical use of the indicators and that further definition and finalisation of the indicators identified should continue in a cooperative manner and within the pilot case studies. The participants agreed on the following: The objectives for the use of indicators should be considered within the sustainable reference system identified (Principles-Criteria-Indicators), as well as being specified in a multidisciplinary context of aquaculture development. The indicators selected also take stocks of the different experiences and projects carried out at Mediterranean level as reported during the previous meeting held in Montpellier 1, including the methodological experience deriving from other projects such as EVAD; For the operational aspects of the objectives, their adaptation to the Mediterranean context should take into consideration the peculiarity of this region in terms of aquaculture (species reared, technology applied, local and cultural heritage, etc) and some indicators could be considered valid for the whole region. The indicators selected should be assessed when the standards are set and within the context of an operational objective; Some indicators provide information on certain areas and should be adapted to the appropriate scale within the coastal community and area (socio-economic and environmental aspects); if sustainable aquaculture is considered in the framework of coastal zone management, multistakeholder consensus should be reached a local level. The objective can be different according to the local community and these indicators should be adapted within the InDAM Project following the pilot actions implemented at local level Identification of the methodology for the pilot studies The participants to the Montpellier 2 nd meeting agreed that two pilot studies could be planned to better finalize the table of indicators. The pilot studies should be performed in two selected coastal areas at different level of aquaculture development. After some discussion the participants agreed on the proposal to make one pilot case study in Turkey and one in Tunisia. Selection criteria (such as: data availability, statistical robustness; local acceptability) for the selection of indicators at local level should be chosen and agreed upon. The pilot studies should consist in one or two local multi-stakeholder technical meetings following a bottom-up approach, to be attended by representatives of the different interested parties with the aim to discuss and appraise the work done. In particular the pilot studies should be articulated as follows: Each pilot case study should be lead at local level by a coordinator who has the responsibility to involve the different stakeholders in a technical meeting in which the indicators will be discussed. The meeting should be attended at least by a representative of the administration, local authorities involved in aquaculture activities, scientists from different fields, representatives of the aquaculture sector and if possible from small scale fisheries. Other local stakeholders such as representatives from NGOs or other sectors could be invited as appropriate; 7
17 During the technical meetings participants should be informed about the InDAM activities and should be introduced to the issue of indicators for sustainable aquaculture, as well as on the objectives of the pilot study. The outcomes of the meetings held in Montpellier should be presented, together with the methodology used, and the indicators should be discussed for the full stakeholders consultation; For each indicator a selection process with the different stakeholders should be implemented; selection criteria should be chosen and agreement should be reached; The outcome of the technical meetings should be presented at a meeting to be held at the end of InDAM Phase I, aimed to discuss the outputs and the methodology implemented and to define the activities of Phase II, which should be focused on the duplication of the pilot studies, on draft guidelines for the use of indicators and on steps towards an adoption and consensus phase for the implementation of the use of sustainable indicators at local level Guidelines and application of indicators for sustainable development of aquaculture The guidelines were discussed at a workshop held in Salammbô (Tunisia) in November The workshop aimed at reviewing the experience of recent research initiatives and methodologies in the development of aquaculture indicators. This workshop also represented the final meeting of the first year of the InDAM Project. Sixteen experts participated to the workshop. The following main aspects were underlined: The application and use of indicators for sustainable aquaculture are the most appropriate tools to ensure and to create conditions for sustainable growth of aquaculture and that these are necessary to assess and monitor aquaculture activities. The indicators have different functions, not only to measure aquaculture activities but also as a tool to communicate among different stakeholders. Participants highlighted that the principle of co-construction of indicators means collective involvement of civil society and main stakeholders, and is the correct path towards a common vision of sustainability that should be contextualised at the appropriate level and at the appropriate geographic scale; Such activities may often be difficult to be accepted by society and this behaviour could also be generated by the lack of knowledge on aquaculture and/or by incorrect information on the sector. The image of aquaculture should be improved and indicators could also be considered as essential tools for communication between farmers and society. In this respect the urgency for the application of indicators to be shared among the international community in support of aquaculture development was stressed; The indicators should always take into consideration the four dimensions of sustainability (governance, economic, social and environmental). For a practical use, standards and when possible reference points should be associated to each indicator. The latter will serve not only for those countries in which aquaculture is well developed and in which conflicts exist also for increasing competition for space (such as in Turkey) but also for those countries in which aquaculture is further developing at national level (Tunisia and Morocco). For these reasons the necessity to develop guidelines for the application and use of indicators of sustainable aquaculture remains a priority at Mediterranean level; The participatory approach is also essential for the aspects related to the governance dimension of aquaculture that represents the key to sustainability, though sometimes the definition and quantification of the indicators are not so evident. Some aspects related to governance are different from country to country or from south/north of the Mediterranean Region. The same concept might raise different sensibilities by stakeholders; welfare issues are a typical example. New general rules for aquaculture could impact at local level and sometimes could affect global sustainability. Difference should be made between small and large farms; in particular 8
18 the role played by small farms on sustainability and the concept of artisanal fish farms should be thoroughly discussed and taken into consideration for the conservation of local traditions and to support the local community such as in the case of artisanal fisheries. The issues related to the certification of traditional, organic and environmental productions should be considered within the governance dimension. 1.5 Conclusions and recommendations of the InDAM first year The participants to the InDAM first-year final meeting discussed on the achievements of the pilot studies and identified priorities for the InDAM second year, including some aspects related to the content of the Guidelines for the application and use of the indicators for the sustainable development of aquaculture in Mediterranean countries. This discussion was based on the methodology implemented by the WGSA and the sustainable development reference systems established within the InDAM Project meetings held in Montpellier, France (November 2008 and February 2009) and on the technical contributions from the pilot studies carried out in Turkey and in Tunisia. The main topics addressed during the discussion as well as the main conclusions of the first-year final meeting are hereunder summarized: Pilot case studies Pilot case studies are essential to establish a local reference system for the development of aquaculture sustainability and its integration into coastal zone management, and to have a common understanding on the concept of sustainable aquaculture among different local stakeholders. Participants also considered that additional pilot case studies should be implemented in other Mediterranean countries to strengthen the co-construction of indicators and their application; The results of the pilot case studies could be considered as relevant for the purposes of InDAM and in particular to generate discussion and to test the methodologies applied on the identification of sustainable indicators at local level; The use of indicators for aquaculture should be considered within the sustainable reference system identified (PCI: Principles, Criteria, Indicators), as well as being specified in a multidisciplinary context of aquaculture development; Multi-stakeholder participation and bottom-up approach should remain a priority when carrying out pilot case studies. The involvement of different local stakeholders (administration, farmers and farmers associations, NGOs, scientists) was considered as essential for having a common understanding of the concept of sustainable aquaculture, and this could also be considered one of the major added values towards the identification and the application of indicators for sustainable aquaculture at local scale; The information on PCI provided to participants to the pilot case studies, as well as the identification of the attributes for the indicators, were essential during the process of indicators selection; in this process the indicators selection was considered more transparent; During the pilot case studies, the work performed with the different actors enabled to have different perspectives of aquaculture development. Aquaculture itself was not only considered from the farm point of view but also from the civil society in the wider territorial context of coastal areas; The identification and prioritization of attributes for indicators is a crucial issue in the implementation of pilot case studies. It should be considered as the first logical and methodological step in the indicators selection process; Common understanding and perception of attributes for the indicators for sustainable aquaculture at local level are required in order to achieve consensus on the identification and prioritization of the same indicators. The preparation of a Glossary on attributes for selection of indicators would facilitate this process; 9
19 Functionality and practicability of the PCI approach within the concept of sustainable aquaculture will remain a challenge point (reliable reference points at local level for monitoring purposes) for further pilot case studies; A weighting and scoring table system for the evaluation and contribution of the indicators identified will also contribute to the usefulness of sustainable aquaculture management. A toolbased traffic-light approach on a significant index should be used in the application of indicators and in the monitoring of aquaculture activities. This would allow the evaluation of the sustainability scale of aquaculture activities at different local scales. The following main activities were to be considered for the work plan of the second year of InDAM: Guidelines on the application of indicators for sustainable aquaculture Guidelines on the application of the indicators for sustainable marine aquaculture in the Mediterranean should be drafted according to the methodologies applied and to the agreed schemes. A Glossary of the terms used for the different indicators should also be included in the Guidelines. The number of indicators should also be revised for a better and more comprehensive application. The indicators reference systems for sustainable development of aquaculture disseminated in the Mediterranean also as results of regional cooperation Based also on the interest created in some Mediterranean areas, additional new pilot case studies should be implemented. A preliminary interest was demonstrated for the further case studies to be carried out at local level in Morocco, Italy, Spain and Greece and/or in other interested countries. The new case studies should take advantage from the Tunisian and the Turkish experiences, and should be supported by a multidisciplinary cooperation framework. Indicators reference system tested at local level As follow up of the pilot case studies carried out in Tunisia and Turkey, the indicators reference system should be tested with the participation and involvement of the different stakeholders already involved in the selection process. The activities that will be carried out should also serve to make a first practical evaluation of the selected indicators based on the data available and collected at local level and for the evaluation of the drafted guidelines. Preparation of a programme for the implantation and /or the establishment of a Mediterranean observatory on sustainable aquaculture. A general preliminary content for a document on Guidelines for the use of indicators for the sustainable development of aquaculture and related standard and reference points was adopted. The workshop agreed that the Guidelines document would need to be simple and concise and the use of graphics and drawings would be appropriate to illustrate certain concepts and for their easy grasping. The guidelines should include the following points: Background In this chapter, information should explain the context in which the guidelines were developed. Detailed information should be given on how the document was conceived and on the process leading to its preparation; Target users The target users of the guidelines would need to be well defined, indicating for each user group the purpose and the advantages derived from the use of such indicators as well as the different level of utilisation of the indicators (regional, national, local); 10
20 Selection of indicators The guidelines would provide a series of main governance, economic, social and environmental indicators identified in the various country pilot projects supported through the InDAM Project. However, the guidelines would clearly state that other indicators, not included in the list provided, could be more relevant to certain countries, regions or areas. The guidelines would hence provide information on how such indicators are selected and prioritized. The PCI and co-construction methodology developed and recommended for the identification of the indicators would be included as an appendix to the guidelines document; Value of a single indicator The importance of determining the value of a single indicator (standards and when possible reference points) should be indicated in order to ensure its proper use and interpretation in determining the level of sustainability of any given aquaculture activity, including feasibility, practicability, expertise-requirement and cost effectiveness. Pilot case studies To increase clarity in and usability of the guidelines, one or more pilot case studies could be annexed (or i.e. box tools) to the guidelines in order to provide practical examples on how indicators were identified and prioritized. A series of additional appendices will be also annexed to the guidelines, such as: List of indicators A list of top indicators identified through the project and the pilot studies should be included in the guidelines. Each indicator should be provided in the form of a data sheet where the following information, where appropriate, should be provided: definition, relevance to sustainability, rationale, methodological aspect (i.e. measurement of the indicator), reference value, constraints, implementation level, measurement frequency, information and data required (i.e. data source, availability), references. Full methodology This annex should describe in details, but concisely, the methodology developed in order to allow replicability. 11
21 2. THE PILOT STUDY IN TURKEY Introduction The Turkish pilot study was carried out during 2009 and culminated in the technical meeting held at the Provincial Directorate of Agriculture in Mugla, Turkey, from 28 th to 29 th September The technical meeting was organized by the Ministry of Agriculture and Rural Affairs of Turkey (MARA) through the General Fisheries Commission for the Mediterranean (GFCM) Committee on Aquaculture (CAQ) support project (InDAM). The Mugla technical meeting was attended by 36 participants: namely 18 experts (economists, biologists, aquaculturists and environmental engineers from 4 different national institutions: Ministry of Environment, Ministry of Tourism and Culture, Ministry of Agriculture and Rural Affairs, MARA Research Institutes), 6 fish farmers, 6 academicians, 2 representatives from civil society organizations and 4 from aquaculture s professional organizations. The list of participants is given in Annexes 6a and 6b. The technical meeting was held to encourage communication between various stakeholders including ministries and government institutions, fish farmers, fishermen, local communities and NGOs and provides countries with comprehensive decision-support tools for the development of sustainable aquaculture based on a set of indicators, reference points and guidelines adapted to the Mediterranean region. In particular, it aimed at: sharing the outcomes of Montpellier I and II meetings on PCI approach (Principle-Criterion- Indicator) and use of indicators for the development of sustainable aquaculture in the Mediterranean with the stakeholders at local level; initiating an indicator selection process based on identification and prioritization of attributes for selection of indicators at local level; locally appraising the selection of indicators for environmental, economic, governance and social dimensions of sustainable aquaculture in the Mediterranean. This pilot study contributed to the establishment of a common system of indicators for the sustainable development of aquaculture in Turkey and in the Mediterranean within the framework of coastal zone management. 2.2 Methodology applied for the selection of indicators The methodology and process for the selection of indicators was discussed during the technical meeting with the stakeholders with different background and expertise. It was agreed that before selecting any indicator it was a logical and methodological necessity to identify the attributes that an indicator should possess, and that these attributes should be prioritized by stakeholders at local level and according to the peculiarity and priorities of targeted locations, following a bottom up approach. A three steps process for the selection of indicators was then endorsed by the participants, namely: Step 1: Identification and prioritization of attributes to be used in the selection of indicators Step 2: A rapid appraisal method for the selection of indicators Step 3: A selection process based upon attributes endorsed and prioritized by stakeholders Accordingly, three different questionnaires were prepared and distributed for application at each stage. 14 Prepared by H.Deniz, F.Rad, G. Yucel-Gier (for affiliation, see Annex 6b) 12
22 2.2.1 Identification and prioritization of attributes to be used in the selection of indicators Questionnaire 1 was focused on the scoring of 10 commonly used attributes (OECD, EC, World Bank and related scientific literature) for the selection of indicators. The purpose was a) to facilitate the participation of every stakeholder from different backgrounds in the evaluation process (including the silent ones), b) to convert qualitative assessments on attributes to quantifiable assessments and c) to objectively identify priorities. The following 10 attributes (Table 1) were introduced and participants were invited to allocate a total of 100 points to attributes according to their preference for the use of each attribute in indicator selection process using Questionnaire 1 (Appendix 1). Table 3 Ten attributes for the selection of indicators N attribute definition 1 relevance to criteria and principle it is relevant to goals of endorsed criteria and principles. 2 understandability it is clear and perceived by all stakeholders in the same manner and is easily communicated. 3 reliability it has a sound scientific base and methodology with successful previous use. 4 reproducibility/verifiability it is capable of being reproducible at different time and places with verifiable results. 5 data availability it is estimated/produced using available information/data or can be estimated/produced with reasonable cost/effort. 6 international compatibility it is compatible with other indicators developed by other countries, regions or bodies. 7 transparency it is accessible by all stakeholders. 8 availability of reference values it can be compared/monitored with some readily available reference points. 9 acceptability it is endorsed by different stakeholders. 10 robustness it is difficult to manipulate Source A rapid appraisal method for the selection of indicators ( Acceptability as only one attribute) Questionnaire 2 was focused on a rapid appraisal of indicators for each dimension (Ecological, Economic, Social and Governance), using only one attribute, namely Acceptability. The purpose was to conduct an exercise towards an early and overall assessment. To this end, participants were divided into three sub-groups based on their backgrounds and expertise (social governance, economic and ecological), respectively coordinated by Mr. Deniz, Mr. Rad and Ms. Yucel-Gier, and were asked to fill the dimension-oriented version of Questionnaire Selection of indicators (appraisal) based on prioritized attributes Questionnaire 3 was focused on the selection of indicators for each dimension, using four attributes identified and prioritized during the first stage assessment (Questionnaire 1). Questionnaire 3 was structured for using descriptive statistical assessments. Participants were asked to score each attribute 15 European Commission A framework for indicators for the economic and social dimension of sustainable agriculture and rural development. Liu, W.H. and Ou, C., H., A comparative analysis of sustainable fishery development indicator system in Australia and Canada, Sustainable Development, 15: Parris, T.M. and Kates, R. W Characterizing and measuring sustainable development. Annual. Rev. Environ. Resour. 28: Reed, M. S., and Dougill, A.J Facilitating grass-roots sustainable development through sustainability indicators: a Kalahari case study. Presented at Frontiers 2: European applications in the ecological economics The Word Bank, Selecting indicators, Poverty monitoring guidance note1. 13
23 for every indicator using a scale from 1 to 9 modified from Saaty (2008) and Kumar et. al (2009) 16 as below: Score 1 weak 3 moderate Definition 5 good 7 very good 9 excellent 2,4, 6 and 8 intermediate values Questionnaire 3 was prepared according to outcomes of Questionnaire 1 regarding identification and prioritization of attributes for the selection of indicators. Following discussion on quantitative outcomes of Questionnaire 1 and consensus among stakeholders; understandability, relevance to criteria and principle, data availability and reliability, were used as attributes for selection of indicators in Questionnaire 3. Participants were divided into three sub-groups as before and were asked to fill the dimension-oriented version of Questionnaire 3 (Appendix 3). 2.3 Results Identification and prioritization of attributes to be used in the selection of indicators Statistical results of Questionnaire 1 on prioritization of identified attributes for selection of indicators are presented in Table 2. Scores are the mean values for 28 participants completing Questionnaire 1. The mean scores of ten attributes were found to be more or less similar and within the range of 7-14 points. Relevance to criteria and principle (14 points) was regarded as the most significant attribute for selection of indicators by participants while availability of reference values and acceptability (7 points) were found to be the least significant attributes for selection of indicators. Table 4 Ranking of indicator selection attributes Rank Attribute Mean score (out of 100) 1 relevance to criteria and principle 14 2 reliability 13 3 data availability 11 4 understandability 10 4 transparency 10 4 reproducibility/verifiability 10 4 international compatibility 10 5 robustness 8 6 acceptability 7 6 availability of reference values 7 total 100 Scores allocated to different attributes in Questionnaire 1 reveal that stakeholders with different background and expertise had different priorities and preferences with regard to attributes and their use in selection of indicators. During discussions representatives of civil societies (environment) regarded transparency as a fundamental attribute for selection of indicators whereas fish farmers saw reproducibility/verifiability as a significant attribute. 16 Kumar, S., Parashar, N. and Halem, A., Analytical Hierarchy Process Applied to Vendor Selection Problem. Business Intelligence Journal, 2 (2) Saaty, T., L., Relative Measurement and its Generalization in Decision Making, Why Pairwise Comparisons Are Central in Mathematics for the Measurement of Intangible Factors. Rev. R. Acad. Scientific Series. A. Mat., 102 (2), p
24 However the overall assessment and distribution of mean scores for these ten attributes also demonstrate that to varying degrees stakeholders have dedicated importance to all ten attributes and consider them as important tools in selection of indicators for sustainable aquaculture. The quantitative approach adopted in the Pilot Study and the use of Questionnaire 1 proved to be a reliable tool in prioritization of attributes for the selection of indicators. Open ended debates and discussions do not always allow and encourage the participation of every opinion in the decisionmaking process especially the contribution of silent ones cannot be assured. However participation of every stakeholder and their contribution is assured by the use of the questionnaires and quantitative assessments Governance dimension - DGo A rapid appraisal method for the selection of indicators ( Acceptability as only one attribute) The results of rapid appraisal (Questionnaire 2) using acceptability as a single attribute for selection of indicators for each principle in governance dimension are given in Table 3. The sub-group on governance dimension was composed of seven participants with different background ranging from fish farmers, public administrators, fishermen and NGOs for aquaculture and environment. Results were presented as percentage of yes answers for each indicator, showing the percentage acceptability of indicator by participants. Table 5 Results of rapid appraisal for the governance dimension (DGo) DGo/ PRINCIPLE 1: Strengthen integration of aquaculture in local development N o DGo/ Indicators Acceptability (%) 1 number of areas allocated for aquaculture 70 2 age and historical role of the activity and contribution to the traditional landscape of the area 40 3 number of workers (direct and indirect) percentage of permanent (and seasonal) full time equivalent workers 85 5 percentage of seasonal workers in aquaculture compared to seasonal workers in tourism 70 6 conflicts and opportunities with other activities and uses 85 7 recycling rate of by-product 85 8 existence of subsidies for aquaculture ecologic services number of reports on environmental crises in five years participation rate to the socio-professional political organizations and in local assemblies 85 DGo/ PRINCIPLE 2: Promote participation in decision making process N o DGo/ Indicators Acceptability (%) 11 percentage of fish-farmers and technicians who know the regulations number of control officers percentage of fish-farmers in breach of the law number of participants at consultative meetings number of new co-constructed measures number of fish-farmers taking part in consultative bodies number of conflicts solved at local level number of conflicts due to contradictions between traditional and constitutional legislation number of authorizations granted compared to the number of requests number of new sites created existence of ICZM plan for coastal areas, including aquaculture under head state authority, taking account future evolution of industry 85./. 15
25 DGo/ PRINCIPLE 3: Strengthen research, information systems and extension services N o DGo/ Indicators Acceptability (%) 22 existence of research funds existence of bodies in support to aquaculture training number of partnership contracts existence of an information system existence of extension and dissemination services 70 DGo/ PRINCIPLE 4: Strengthen institutional capacities in relation with sustainable development N o DGo/ Indicators Acceptability (%) 27 existence of a national sustainable development strategy existence of rules and regulations in favour of sustainable development rate of state financial aid compared to other sectors existence of a public plan to support aquaculture development number of concessions and license for aquaculture existence of competent State services existence of funds allocated for training existence of legal recourses 70 Only few indicators (6 corresponding to 18 percent) were fully accepted by participants. Most of the indicators (24) were regarded as percent acceptable by participants. Indicators DGo/2, 18, 29, 32 had the lowest rate of acceptability among the indicators. The outcomes of Questionnaire 2 state obviously that acceptability as a single attribute for selection of indicators does not satisfy very significant results. The acceptability itself is a concept which needs to be associated with some complementary attributes to be defined and dedicated. Selection of indicators (Appraisal) based on prioritized attributes Results of statistical assessments for selection of indicators using prioritized attributes (Questionnaire 3) are presented in Table 10. Questionnaire 3 was distributed in the sub-group on governance dimension and was filled by ten participants with different background ranging from fish farmers, public administrators, and farmer s organizations to suppliers of logistics and equipments. Results indicate the weighted mean score for each indicator in terms of four attributes namely, understandability, relevance to criteria and principle, data availability and reliability. Table 6 Results of selection of indicators using prioritized attributes for the governance dimension DGo/PRINCIPLE 1: Strengthen integration of aquaculture in local development Code Criteria N o Indicators Weighted mean score P1C1 importance of development initiatives 1 number of areas allocated for aquaculture 6.61 P1C2 P1C3 integration of local culture and landscape level of contribution to local employment and to poverty alleviation 2 age and historical role of the activity and contribution to the traditional landscape of the area number of workers (direct and indirect) percentage of permanent (and seasonal) full time equivalent workers percentage of seasonal workers in aquaculture compared to seasonal workers in tourism /. 16
26 DGo/PRINCIPLE 1: Strengthen integration of aquaculture in local development P1C4 P1C5 P1C6 interactions with other sector at local level contribution of the sector to improve the environment. capacity of aquaculture to improve environmental monitoring capacity P1C7 level of social recognition conflicts and opportunities with other activities and uses recycling rate of by-product existence of subsidies for aquaculture ecologic services DGo/ PRINCIPLE 2: Promote participation in decision making process 9 number of reports on environmental crises in five years participation rate to the socio-professional political organizations and in local assemblies Code Criteria N o Indicators P2C1 level of understanding in the industry 11 P2C2 P2C3 P2C4 P2C5 existence of control systems level of participation level of decentralization of decisionmaking level of management and regional planning percentage of fish-farmers and technicians who know the regulations Weighted mean score number of control officers percentage of fish-farmers in breach of the law number of participants at consultative meetings number of new co-constructed measures number of fish-farmers taking part in consultative bodies number of conflicts solved at local level number of conflicts due to contradictions between traditional and constitutional legislation number of authorizations granted compared to the number of requests number of new sites created existence of ICZM plan for coastal areas, including aquaculture under head state authority, taking into account the future evolution of industry. DGo/ PRINCIPLE 3: Strengthen research, information systems and extension services Code Criteria N o Indicators P3C1 P3C2 P3C3 P3C4 importance of research and training in aquaculture level of interaction between research, industry and administration access to aquaculture information systems access to scientific, administrative and technique data 7.83 Weighted mean score 22 existence of research funds existence of bodies in support to aquaculture training number of partnership contracts existence of an information system existence of extension and dissemination services /. 17
27 DGo/ PRINCIPLE 4: Strengthen institutional capacities in relation with sustainable development Code Criteria N o Indicators P4C1 P4C2 P4C3 level of national recognition of sustainable development level of involvement of the state in the implementation of sustainable development level of commitment of the state towards the industry existence of a national sustainable development strategy existence of rules and regulations in favour of sustainable development rate of state financial aid compared to other sectors existence of a public plan to support aquaculture development number of concessions and license for aquaculture Weighted mean score existence of competent state services existence of funds allocated for training existence of legal recourses 5.46 Ranking of indicators based on their weighted mean scores are presented in Table 7. Indicator DGo/21 number of workers was found to have the highest mean (7.83) in terms of four prioritized attributes and consequently the highest rank among 34 indicators for governance dimension. Indicator DGo/2 age and historical role of the activity and contribution to the traditional landscape of the area had the lowest mean score (4.24) and the lowest rank. Table 7 Ranking of indicators based on their weighted mean score in terms of prioritized attributes for the governance dimension N DGo/ 21 Indicators existence of ICZM plan for coastal areas, including aquaculture under head state authority, taking into account the future evolution of industry Weighted mean score Rank number of workers (direct and indirect) number of fish-farmers taking part in consultative bodies existence of bodies in support to aquaculture training existence of a public plan to support aquaculture development existence of extension and dissemination services existence of research funds number of control officers number of new sites created existence of an information system existence of funds allocated for training percentage of permanent (and seasonal) full time equivalent workers number of new co-constructed measures percentage of fish-farmers in breach of the law percentage of fish-farmers and technicians who know the regulations number of participants at consultative meetings number of authorizations granted compared to the number of requests existence of a national sustainable development strategy existence of rules and regulations in favour of sustainable development number of partnership contracts existence of subsidies for aquaculture ecologic services number of areas allocated for aquaculture /. 18
28 N DGo/ 10 Indicators participation rate to the socio-professional political organizations and in local assemblies Weighted mean score Rank existence of competent state services rate of state financial aid compared to other sectors number of concessions and license for aquaculture percentage of seasonal workers in aquaculture compared to seasonal workers in tourism number of conflicts solved at local level number of reports on environmental crises in five years conflicts and opportunities with other activities and uses existence of legal recourses recycling rate of by-product number of conflicts due to contradictions between traditional and constitutional legislation age and historical role of the activity and contribution to the traditional landscape of the area Outcome of discussions for the governance dimension It was expressly agreed that governance compatibility between responsible institutions is very important for sustainable aquaculture. All over sustainability is impossible without coherent laws and regulations even if environmentally, economic and social dimensions are well-organized. It was stressed that lack of consensus or unsatisfactory coordination among authorities has adverse effect on sustainable aquaculture development. For instance, in 2006 there was a change in the Turkish Environmental Law 2872 amended as Law 5491 without having an agreement among institutions. According to this law Marine aquaculture facilities should not be constructed in sensitive areas such as enclosed bays and gulfs and in natural and archeologically protected areas. Fish farms existing in contravention of this article will be closed after one year of the publishing of this law. In connection with this law, the notification which describes criteria for aquaculture site selection in enclosed bays and gulfs was published in If these sensitive areas have high eutrophication risk, marine aquaculture facilities will not be constructed. Fish farms found to be contravening this notice were under threat to be closed. It was highlighted that Integrated Coastal Management plan for coastal areas, including aquaculture under head state authority is one of key component to take into account for the future evolution of the marine aquaculture sector. In addition, the following specific issues regarding indicators were also underlined: Indicators DGo/3, 8, 12, 13, 14, 27 ( number of workers, existence of subsidies for aquaculture ecologic services, percentage of fish-farmers and technicians who know the regulations, number of control officers, percentage of fish-farmers in breach of the law, existence of extension and dissemination services ) were accepted by 100% participants. Indicators DGo/2 and 9 age and historical role of the activity and contribution to the traditional landscape of the area and participation rate to the socio-professional political organisations and in local assemblies were found to be irrelative with Principle 1 on strengthening integration of aquaculture in local development. 19
29 2.3.3 Economic dimension - DEc A rapid appraisal method for the selection of indicators The results of rapid appraisal (Questionnaire 2) using acceptability as a single attribute for selection of indicators for each principle in economic dimension are given in Table 8. The sub-group on economic dimension consisted of ten participants with different backgrounds ranging from fish farmers, public administrators, and farmer s organizations to suppliers of logistics and equipments. Results are presented as percentage of yes answers for each indicator, showing the percentage acceptability of indicator by participants. Table 8 Results of rapid appraisal for the economic dimension DEc/ PRINCIPLE 1. Strengthen consumer responsive and market oriented aquaculture N o DEc/ Indicators Acceptability (%) 1 existence of own-label (y/n and %) existence of quality certification schemes (independent bodies) (y/n and %) existence of a traceability system percentage of value-added products price differential with respect to quality (y/n) 85 6 availability of processing capacity for the sector 85 7 company customer surveys sector market studies existence of company marketing plan marketing costs/total revenue 85 DEc/ PRINCIPLE 2. Strengthen risk assessment and crisis management capabilities 11 number of products (i.e. species, size categories, value-added) integration of core business with complementary activities (eco-tourism, recreational fishing, restaurant) 13 geographic market diversification (number and % share of each market of total sales) 14 share of each customer in total sales number of national feed suppliers (also % imported) number of national hatcheries (also % of fry imported) existence of biosecurity system existence of legislation on biological waste disposal existence of farm health management system (including vaccination program) ratio of R&D expenditure/total sales ratio of national expenditure on R&D/GDP duration of lease of the site no. of site lease renewals per year existence of national legislation for zoning existence national emergency funds (natural disasters) ratio of insurance costs/total sales existence of legislation for monitoring of environmental parameters use of ISO (or other certified system) existence of producer's organizations or cooperatives for sales supply and sales by contract or by market /. 20
30 DEc/ PRINCIPLE 3. Strengthen financial management of enterprises N o DEc/ Indicators Acceptability (%) 31 gross profit margin (gross profit/revenue x100) rate of return on farm assets feed cost/kg fish produced (and % of total cost/kg) fry cost/kg (and % of total cost/kg) labour cost/kg fish produced (and % of total cost/kg) unit production cost (total variable and fixed costs/kg fish produced/operating costs) energy cost/kg fish produced (and % of total cost/kg) transportation cost/kg (and % of total cost/kg) financial costs/kg fish produced (and % of total cost/kg) current ratio (total current farm assets/total current farm liabilities) debt/asset ratio (total farm liabilities/total farm assets) debt/equity ratio (total farm liabilities/total farm equity) environmental monitoring costs/kg fish produced (and as % of total cost/kg) capital investments for environmental protection/kg (and as % of total cost/kg) existence of incentives, direct or indirect, for environmental protection actions existence of national mechanism supporting start-ups (tax-break, subsidies, financing) 100 DEc/ PRINCIPLE 4. Strengthen the role of professional organizations for the economic sustainability of aquaculture 47 sector market studies market data dissemination (annual seminars by federations or authorities) % of annual national federations (producer s organizations) budget allocated to marketing and promotion 50 annual national budget allocated for marketing and promotion of the sector existence of a permanent information/communication programme at sector level existence of training program for sector employees on financial aspects of activity existence of training programme for sector employees on environmental aspects of activity 54 existence of emergency fund existence of crisis management manual (strategy) Most indicators were regarded as acceptable (100 percent) by participants. Indicator DEc/14 share of each customer in total sales had the lowest rate of acceptability among 55 indicators. Indicators DEc/32 and DEc/40 had also low rate (70 percent) of acceptability. The outcomes of Questionnaire 2 clearly indicate that acceptability as a single attribute for selection of indicators does not provide very meaningful results. The acceptability itself is a concept which needs to be associated with some attributes to be definable and judged. The outcomes of Questionnaire 1 regarding prioritization of attributes also support this assertion. Acceptability as an attribute for selection of indicators had one of the lowest score in terms of its significance for use in the indicator selection process. Selection of indicators (Appraisal) based on prioritized attributes Results of statistical assessments for selection of indicators using prioritized attributes (Questionnaire 3) are presented in Table 7. Questionnaire 3 was distributed in the sub-group on economic dimension and was filled by ten participants with different backgrounds ranging from fish farmers, public administrators, and farmer s organizations to suppliers of logistics and equipments. Results indicate the weighted mean score for each indicator in terms of four attributes namely, understandability, relevance to criteria and principle, data availability and reliability. 21
31 Table 9 - Results of selection of indicators using prioritized attributes for the economic dimension DEc/ PRINCIPLE 1. Strengthen consumer responsive and market oriented aquaculture Code Criteria N o Indicators P1C1 use of branding or quality assurance schemes/labels Weighted mean score 1 existence of own-label (y/n and %) existence of quality certification schemes (independent bodies) (y/n and %) P1C2 traceable products 3 existence of a traceability system 6.30 P1C3 level of value enhancement P1C4 processing capacity 6 P1C5 level of knowledge management percentage of value-added products price differential with respect to quality (y/n) 4.57 availability of processing capacity for the sector company customer surveys sector market studies existence of company marketing plan 5.16 P1C6 level of market promotion activities 10 marketing costs/total revenue 4.38 DEc/ PRINCIPLE 2: Strengthen risk assessment and crisis management capabilities Code Criteria N o Indicators Weighted mean score P2C1 P2C2 level of diversification level of input self-sufficiency number of products (i.e. species, size categories, value-added) 5.60 integration of core business with complementary activities (eco-tourism, recreational fishing, restaurant) 5.16 geographic market diversification (number and % share of each market of total sales) share of each customer in total sales number of national feed suppliers (also % imported) 5.14 number of national hatcheries (also % of fry imported) existence of biosecurity system 4.62 P2C3 P2C4 P2C5 P2C6 capability to monitor and challenge pathological hazards increased research & development capabilities and innovation level of property rights over production sites level of awareness of natural hazards P2C7 level of market maturity existence of legislation on biological waste disposal 4.55 existence of farm health management system (including vaccination program) ratio of R&D expenditure/total sales ratio of national expenditure on R&D/GDP duration of lease of the site no. of site lease renewals per year existence of national legislation for zoning existence of national emergency funds (natural disasters) ratio of insurance costs/total sales existence of legislation for monitoring of environmental parameters use of ISO (or other certified system) 4.27 existence of producer's organizations or cooperatives for sales supply and sales by contract or by market 6.70./. 22
32 DEc/ PRINCIPLE 3: Strengthen financial management of enterprises Code Criteria N o Indicators P3C1 P3C2 P3C3 P3C4 level of profitability level of input efficiency level of financial strength level of environmental protection costs P3C5 ease of entry into industry gross profit margin (gross profit/revenue x100) Weighted mean score rate of return on farm assets feed cost/kg fish produced (and % of total cost/kg) fry cost/kg (and % of total cost/kg) labour cost/kg fish produced (and % of total cost/kg) unit production cost (total variable and fixed costs/kg fish produced/operating costs) (excage) energy cost/kg fish produced (and % of total cost/kg) transportation cost/kg (and % of total cost/kg) financial costs/kg fish produced (and % of total cost/kg) current ratio (total current farm assets/total current farm liabilities) debt/asset ratio (total farm liabilities/total farm assets) debt/equity ratio (total farm liabilities/total farm equity) environmental monitoring costs/kg fish produced (and as % of total cost/kg) capital investments for environmental protection/kg (and as % of total cost/kg) existence of incentives, direct or indirect, for environmental protection actions existence of national mechanism supporting start-ups (tax-break, subsidies, financing) DEc/ PRINCIPLE 4: Strengthen the role of professional organizations for the economic sustainability of aquaculture Code Criteria N o Indicators P4C1 P4C2 P4C3 P4C4 level of knowledge management level of collective marketing and actions promotion of training and awareness building increased capability for crisis management Weighted mean score 47 sector market studies market data dissemination (annual seminars by federations or authorities) % of annual national federations (producer s organizations) budget allocated to marketing and promotion annual national budget allocated for marketing and promotion of the sector existence of a permanent information/communication program at sector level existence of training program for sector employees on financial aspects of activity existence of training program for sector employees on environmental aspects of activity existence of emergency fund existence of crisis management manual (strategy)
33 Ranking of indicators based on their Weighted mean scores are presented in Table 8. Indicator DEc/2 existence of quality certification schemes was found to have the highest mean (7.15) in terms of four prioritized attributes and consequently the highest rank among 55 indicators for the economic dimension. Indicator DEc/14 share of each customer in total sales had the lowest mean score (2.31) and the lowest rank. Table 10 Ranking of indicators based on their Weighted average score in terms of prioritized attributes for the economic dimension N DEc/ Indicators Weighted mean score 2 existence of quality certification schemes (independent bodies) (y/n and %) feed cost/kg fish produced (and % of total cost/kg) fry cost/kg (and % of total cost/kg) supply and sales by contract or by market existence of farm health management system (including vaccination program) labour cost/kg fish produced (and % of total cost/kg) existence of a traceability system energy cost/kg fish produced (and % of total cost/kg) number of national hatcheries ( also % of fry imported) unit production cost (total variable and fixed costs/kg fish produced/operating costs) (ex-cage) Rank gross profit margin (gross profit/revenue x100) sector market studies existence of own-label (y/n and %) duration of lease of the site transportation cost/kg (and % of total cost/kg) market data dissemination (annual seminars by federations or authorities) sector market studies number of products (i.e. species, size categories, value-added) percentage of value-added products existence of producer's organizations or cooperatives for sales financial costs/kg fish produced (and % of total cost/kg) availability of processing capacity for the sector rate of return on farm assets existence of national legislation for zoning existence of training program for sector employees on environmental aspects of activity existence of legislation for monitoring of environmental parameters existence of training program for sector employees on financial aspects of activity debt/equity ratio (total farm liabilities/total farm equity) integration of core business with complementary activities (eco-tourism, recreational fishing, restaurant) existence of company marketing plan number of national feed suppliers (also % imported) annual national budget allocated for marketing and promotion of the sector existence of a permanent information/communication program at sector level debt/asset ratio (total farm liabilities/total farm assets) geographic market diversification (number and % share of each market of total sales) existence of national mechanism supporting start-ups (tax-break, subsidies, financing) company customer surveys
34 N DEc/ Indicators Weighted mean score 25 existence of national emergency funds (natural disasters) current ratio (total current farm assets/total current farm liabilities) % of annual national federations (producer s organizations) budget allocated to marketing and promotion Rank existence of biosecurity system ratio of R&D expenditure/total sales ratio of insurance costs/total sales price differential with respect to quality (y/n) existence of legislation on biological waste disposal existence of crisis management manual (strategy) marketing costs/total revenue no. of site lease renewals per year use of ISO (or other certified system) existence of emergency fund ratio of national expenditure on R&D/GDP environmental monitoring costs/kg fish produced (and as % of total cost/kg) existence of incentives, direct or indirect, for environmental protection actions capital investments for environmental protection/kg (and as % of total cost/kg) share of each customer in total sales With respect to scale (1 to 9) used for the evaluation of attributes of indicators and outcomes of Questionnaire 3, it can be concluded that 31 indicators with a mean score of 5 and above should be regarded as acceptable indicators from point of view of Turkish stakeholders. Outcome of discussions for the economic dimension It was widely agreed that economic viability is an essential component of sustainable aquaculture. An environmentally sound aquaculture without economic viability would not generate the anticipated benefits with respect to income, employment and food security. It was stressed that access of financial data at farm level remains to be a challenge for implementation of many indicators for the economic dimension. Even market data regarding sales and customers could be a constraint since many farms regard such data as confidential and would be willing to share. The fact that the rapid development of Turkish aquaculture has been supply oriented and lacked the marketing side was widely acknowledged. It was further argued that even though aquaculture products enjoyed a positive image at local level among customers, the general perception towards farms was negative and needs to be improved. The close link between image of producer and consequent product image was underlined. Meaning that negative image towards farms would not yield a positive product image and that both need to be improved. The role and functionality of producers organization at local level was also a topic of debate. The lack of interest in membership and constraints with regard to national legislation on PO s were also underlined. The most urgent issue which threaten sustainability of Turkish mariculture were said to be feed costs, finance, and relocation of farms to off-shore sites and negative image of farms. The following specific issues regarding indicators were also underlined: Indicators DEc/ 13 and 14: data availability, willingness to share the data would be a constraint at local level. Indicators DEc/ 5 and 16: percentage of imported feed and percentage of imported juveniles as mentioned in indicators should be regarded as separate indicators. Indicators DEc/ 43 and 44: were regarded as irrelative to principle 3. 25
35 Indicator DEc/ 55: was found to be irrelative to principle 4. Indicator DEc/ 15: production of fish meal and oil should also be considered as indicators for sustainable aquaculture. Indicator DEc/ 30 and 36 need further clarification Social dimension - DSo A rapid appraisal method for the selection of indicators The results of rapid appraisal (Questionnaire 2) using acceptability as a single attribute for selection of indicators for each principle in the social dimension are given in Table 9. The sub-group on social dimension is composed of seven participants with different background ranging from fish farmers, public administrators, fishermen and NGOs for aquaculture and environment. Results are presented as percentage of yes answers for each indicator, showing the percentage acceptability of the indicator by participants. Table 11 DSo/ Results of rapid appraisal DSo/ PRINCIPLE 1: Contribute to food security and healthy nutritional needs N o DSo/ Indicators Acceptability (%) 1 annual production quantity of fish produced for domestic markets (self-consumption) and apparent consumption fish price compared with the national minimum wage 30 4 percentage of innovative products proposed each year 30 DSo/ PRINCIPLE 2: Strengthen the role of the Producer Organizations and NGOs to improve image of aquaculture, social awareness and responsibilities N o DSo/ Indicators Acceptability (%) 5 minimum wage of employees compared to national minimum wage 40 6 percentage of fish-farmers with specialized aquaculture training and certificate 70 7 number of professional associations 85 8 existence of a professional status 85 9 existence of ecolabels and product specifications effective participation to decision making process 85 DSo/ PRINCIPLE 3: Strengthen corporate social responsibility N o DSo/ Indicators Acceptability (%) 11 number of monthly hours currently worked by aquaculture workers number of occupational accidents percentage of trade union members among workers percentage of women fish-farmers existence and importance of inter-professional organizations unmarketable fish ratio number of declared pathologies percentage of premium quality fish 55 Only few indicators (3) were accepted by 100 percent participants. Most indicators (19) were regarded as 85 percent acceptable by participants. Indicators DSo/3, 4, 5, 18 had the lowest rate of acceptability among indicators. The outcomes of Questionnaire 2 expressly state that acceptability as a single attribute for selection of indicators does not satisfy very significant results. The acceptability 26
36 itself is a concept which needs to be associated with some complementary attributes to be defined and dedicated. Selection of indicators (Appraisal) based on prioritized attributes Results of statistical assessments for selection of indicators using prioritized attributes (Questionnaire 3) are presented in Table 12. Questionnaire 3 was distributed in the sub-group on economic dimension and was filled up by ten participants with different background, ranging from fish farmers, public administrators, and farmer s organizations to suppliers of logistics and equipments. Results indicate the weighted mean score for each indicator in terms of four attributes, namely: understandability, relevance to criteria and principle, data availability and reliability. Table 12 Results of selection of indicators using prioritized attributes for the social dimension DSo/ PRINCIPLE 1: Contribute to food security and healthy nutritional needs Code Criteria N o Indicators Weighted mean score P1C1 Importance of fish availability 1 Annual production 7.23 P1C2 P1C3 Accessibility for local consumers Commitment to and type of qualitybased approach adopted by the farms Quantity of fish produced for domestic markets (self-consumption) and apparent consumption Fish price compared with the national minimum wage Percentage of innovative products proposed each year DSo/ PRINCIPLE 2: Strengthen the role of Producer Organizations and NGO s to improve image of aquaculture, social awareness and responsibilities Code Criteria N o Indicators P2C1 average salary levels P2C2 level of qualification 6 P2C3 P2C4 P2C5 importance of fish farmer organizations image of aquaculture 5 minimum wage of employees compared to national minimum wage percentage of fish-farmers with specialized aquaculture training and certificate Weighted mean score number of professional associations existence of a professional status existence of ecolabels and product specifications capacity to take part in decision-making 10 effective participation to decision making process DSo/ PRINCIPLE 3: Strengthen corporate social responsibility Code Criteria N o Indicators P3C1 P3C2 P3C3 working conditions (hours and security) level of protection and participation to trade union. women s access to the industry, including salary level P3C4 access to information 15 P3C4 fish welfare 11 number of monthly hours currently worked by aquaculture workers Weighted mean score number of occupational accidents percentage of trade union members among workers 6.35 percentage of women fish-farmers 6.33 existence and importance of interprofessional organizations unmarketable fish ratio number of declared pathologies percentage of premium quality fish
37 Ranking of indicators based on their weighted mean scores are presented in Table 13. Indicator DSo/7 number of professional associations was found to have the highest mean (7.66) in terms of four prioritized attributes and consequently the highest rank among 18 indicators for social dimension. Indicator DSo/3 fish price compared with the national minimum wage had the lowest mean score (3.16) and the lowest rank. Table 13 Ranking of indicators based on their weighted average score in terms of prioritized attributes for the social dimension N o DSo/ Indicators Weighted mean score 7 number of professional associations annual production quantity of fish produced for domestic markets (self-consumption) and apparent consumption Rank existence and importance of interprofessional organizations number of monthly hours currently worked by aquaculture workers percentage of fish-farmers with specialized aquaculture training and certificate percentage of trade union members among workers number of occupational accidents percentage of women fish-farmers minimum wage of employees compared to national minimum wage existence of ecolabels and product specifications unmarketable fish ratio effective participation to decision making process number of declared pathologies existence of a professional status percentage of innovative products proposed each year percentage of premium quality fish fish price compared with the minimum wage With respect to scale (1 to 9) used for evaluation of attributes of indicators and outcome of Questionnaire 3 it can be concluded that indicators with a mean score of 5 and above should be regarded as acceptable indicators from point of view of Turkish stakeholders. Outcomes of discussions for the social dimension It was overemphasized that social acceptability is a key component of sustainable aquaculture. An environmentally and economic sound aquaculture without social agreement would not continue in the long time. It was highlighted that continuous production, quantity of fish produced for domestic markets and apparent consumption are the main indicators to contribute for food supply and food security. It was also stressed that the number of workers in aquaculture is essential to strengthen corporate social responsibility. Aquaculture has developed to such an extent that Turkey is currently one of the largest finfish aquaculture producers in the world and the second largest producer of sea bass, sea bream and rainbow trout. On the other hand, there is a big conflict between marine aquaculture and other coasts related sectors such as tourism, urbanisation, recreation, protection, yachting, navigation etc. There are wrong understanding and competition among sectors. At present, the aquaculture sector and aquaculture products have bad image in the media. Some 28
38 environmentalist and tourism lobbies are against aquaculture and some NGOs have waged smear campaigns saying that aquaculture is polluting the environment and that aquaculture products are not qualitative nor safe enough, without having any significant scientific data proving it. Aquaculture is an important economic activity in the coastal and rural areas in Turkey. It offers opportunities to create employment, helps community development, reduces overexploitation of natural aquatic resources, and contributes to enhance food security. It is estimated that the aquaculture sector in Turkey provides employment for around 25,000 people. In conclusion, social acceptability and responsibility are two key components for sustainable aquaculture in Turkey. Aquaculture sector should complain to opposite sectors and consensus should be provided among aquaculture and other coastal sectors for the future of aquaculture. The following significant points regarding indicators were also accentuated: Indicator DSo/4 percentage of innovative products proposed each year was found irrelative 70% with criteria on commitment to and type of quality-based approach adopted by the farms. It should be redefined to be well connected with the criterion. Indicator DSo/5: minimum wage of employees compared to national minimum wage was found irrelative 60 % to the criterion on average salary levels Environmental dimension - DEn In many ways the harmonization of mariculture with environment focuses on the selection and application of consensus indicators. The communication of basic, and sometimes complex, aquaculture notions to the general public and to stakeholders, as well as within the sector and its governance is vital. This would seem to be best facilitated by the further development of open, transparent, and clearly understood indicators. A number of projects have emerged from Pan-European cooperative structures related to sustainable aquaculture development in the environmental dimension. By the use of jointly negotiated indicators, we can encapsulate and better apply project findings. The following is an outline of major European research events concerning the interaction in the environmental dimension in the Mediterranean between 2003 and A matrix for indicators of interaction between aquaculture and capture fisheries was identified by the FAO AdriaMed Project. ECASA evolved, with indicators, an ecosystem approach to aquaculture and a tool box to show links between environment and aquaculture together with an effective EIA ( SEACASE developed environmentally friendly protocols, quality markers and certification to enhance product value ( An environmentally based case study was undertaken in Mugla for the negotiation and development of a commonly agreed system of indicators. This is to be applied for guidance in the sustainable development of aquaculture in Turkey and in the Mediterranean in the framework of coastal zone management. Such case studies could also serve as a technical contribution to the establishment of a local reference system for the development of aquaculture sustainability and its integration into coastal zone management. A rapid appraisal method for the selection of indicators The results of having applied the rapid appraisal (Questionnaire 2) using acceptability as a single attribute for selection of indicators for each principle in the ecological dimension are given in Table 14. Questionnaire 2 was distributed in the sub-group on environmental dimensions and was filled in by ten participants with different backgrounds, ranging from fish farmers, public administrators, and members of farmer s organizations to suppliers of logistics and equipment. Results are presented as 29
39 percentage of yes answers for each indicator, showing the percentage acceptability of indicator by participants. Table 14 Results of rapid appraisal for the environmental dimension DEn/ PRINCIPLE 1: Minimizing the global impact of aquaculture N o DEn/ Indicators Acceptability (%) 1 food conversion ratio (kg food/ kg fish) demand of pelagic fish (tonnes/year) demand of vegetable products (tonnes/year) 80 4 footprint (Hc) 60 5 life-cycle assessment formula 80 6 tropic level of production (index) 80 7 number of introduced species (n) capture versus quota (tonnes/year) 100 DEn/ PRINCIPLE 2: Respect the ecological service of ecosystem N o DEn/ Indicators Acceptability (%) 9 turbidity/transparency (Secchi disk cm) microbiological indicators (total coliform) algae bloom (n.cell/ml) loss of nursery and spawning grounds (yes/no) recruitment index and spawning stock (biomass) capture modification of target species in the area (monitoring fisheries activities) increase the fishing activities around the farm cages (landing and biomass index) presence of hatchery with native brood stocks (yes/no) monitoring the quality of fish larvae produced carrying/holding capacity of the ecosystem hydrodynamic (cm/sec) depth (m) interchange with open sea (offshore) (distance) percentage of used space (%) volume of water occupied per kg of product (kg/mc) oxygen saturation (%) relationship between exogenous and endogenous nutrient 90 DEn/ PRINCIPLE 3: Minimizing the local impact on environmental conditions and biodiversity N o DEn/ Indicators Acceptability (%) 25 faeces sedimentation (g/day) lost food versus total (%) nutrient balance (kg) kg of antibiotics per tonne fish (kg) antifouling use (y/n) kg of anti-parasites per tonne fish (kg) kg of disinfectant per tonne fish (kg) use of food with chemical antioxidant (y/n) use of organic certified fish food (y/n) redox potential and ph total P (kg) 100./. 30
40 36 sediment structure (%) heavy metal accumulation (microgram) benthic community structure modification (benthic index) total organic carbon (TOC mg/m2) level of degradation of sensitive habitats (monitoring) turbidity (Secchi disk cm) total particle organic matter (mg/m3) total dissolved organic matter (mg/m3) chlorophyll (mg/m3) zooplankton biomass (mg/m3) aggregation of pelagic fish (ind/m2) escapees (ind) use of indigenous species (y/n) use of GMO species (y/n) level of spawning use of native broodstocks (y/n) escapees /number presence of pathogens from farm pathogens 100 Most indicators were regarded as 100 percent acceptable by participants. Indicator DEn/ 4 foot print had the lowest rate 60 percent of acceptability among 53 indicators, probably because the notion was not fully understood. Indicators DEn/3, 5, 6, 12, 13, 14, 15, 16, 17, 25, 26, 27, 34 and 52 also had relatively low rates, 80 percent of acceptability. Indicator DEn/24 scored 90 percent. The outcomes of Questionnaire 2 clearly show that the use of term acceptability as a single attribute for the selection of indicators provides less than fully meaningful results. This is because acceptability in itself is a concept which needs to be associated with some attributes in order for them to be definable and judged. The outcome of Questionnaire 1 regarding prioritization of attributes also supports this assertion. Selection of indicators (Appraisal) based on prioritized attributes Results of statistical assessments for selection of indicators using the prioritized attributes, measured by Questionnaire 3, are presented in Table 15. Results show the weighted mean score for each indicator in terms of four attributes namely, understandability, relevance to criteria and principle, data availability and reliability. Table 15 Results of selection of indicators using prioritized attributes for the environmental dimension DEn/ PRINCIPLE 1: Minimizing the global impact of aquaculture N o DEn/ P1C1 P1C2 Indicators N o Indicators needs of natural resource (pelagic fish and vegetables) consume of energy Weighted mean score 1 food conversion ratio (kg food/kg fish) demand of pelagic fish (t/year) demand of vegetable products (ton/year) footprint index (Hc) life-cycle assessment (formula) tropic level of production (index) 4.15 P1C3 alien species 7 number of introduced species (n) 5.10 P1C4 capture-based aquaculture 8 capture versus quota (t/year) 5.75./. 31
41 DEn/ PRINCIPLE 2: Respect the ecological service of ecosystem N o DEn/ P2C1 P2C2 P2C3 P2C4 P2C5 water quality fisheries and nursery areas Indicators N o Indicators carrying/holding capacity of the ecosystem oceanographic conditions trophic conditions Weighted mean score 9 turbidity/transparency (Secchi disk) microbiological indicators (total coliform) algae bloom (n. cells / ml) loss of nursery and spawning grounds (yes/no) recruitment index and spawning stock (biomass) capture modification of target species in the area (monitoring fisheries activities) increase the fishing activities around the farm cages (landing and biomass index) presence of hatchery with native brood stocks (yes/no) monitoring the quality of the fish larvae produced n/a hydrodynamic (cm /s) depth (m) interchange with open sea (offshore) (distance in m) percentage of the used space (%) volume of water occupied per kg of product (kg / m 3 ) oxygen saturation (%) relationship between exogenous and endogenous nutrients 5.83 DEn/ PRINCIPLE 3: Minimizing the local impact on environmental conditions and biodiversity Code Criteria N o Indicators P3C1 P3C2 input of organic and inorganic wastes use of chemical products and drugs Weighted mean score 25 faeces sedimentation rates (g/day) lost food versus total (%) nutrient balance (kg) kg of antibiotics per tonne fish (kg) antifouling use (y/n) kg of anti-parasites per tonne fish (kg) kg of disinfectant per tonne fish (kg) use of food with chemical antioxidants (y/n) 5.08 P3C3 impact on benthic habitat and communities 33 use of organic certified fish food (y/n) redox potential and ph (ph) total P (kg) sediment structure (%) heavy metal accumulation (micrograms) benthic community structure modification (benthic index) total organic carbon (TOC, mg/m 2 ) level of degradation of sensitive habitats (monitoring) 5.83./. 32
42 DEn/ PRINCIPLE 3: Minimizing the local impact on environmental conditions and biodiversity Code Criteria N o Indicators P3C4 P3C5 impact on pelagic habitat and communities genetic impact P3C6 desease spread from farms 53 Weighted Mean Score 41 turbidity (Secchi disk cm) total particulate organic matter (mg/m 3 ) total dissolved organic matter (mg/ m 3 )) chlorophyll (mg/m 3 ) zooplankton biomass (mg/m 3 ) aggregation of pelagic fish (ind/m 2 ) escapees (ind) use of non indigenous species (y/n) use of GMO species (y/n) level of spawning use of native broodstocks (y/n) escapees (numbers) 4.45 presence of pathogens from farm pathogens (y/n) 5.08 A ranking of indicators based on their weighted mean scores are presented in Table 15. Indicators DEn/19, 1 and 10 ( depth, food conversion ratio, microbiological indicators ), were found to have the highest means ( ), in terms of four prioritized attributes, and consequently the highest rank among the 53 indicators within the ecological dimension. Indicator DEn/16, 6, 4 [ monitoring the quality of the fish larvae produced, trophic level of production (index), footprint (Hc) ] had the lowest mean score. Table 16 Ranking of indicators, based on their weighted average score in terms of prioritized attributes for the environmental dimension N DEn/ Indicators Weighted mean score 19 depth (m) food conversion ratio (kg food/kg fish) microbiological indicators (total) percentage of the used space (%) hydrodynamic (cm/s) interchange with open sea (offshore) distance in m turbidity/transparency (Secchi disk cm) oxygen saturation (%) turbidity/transparency (Secchi disk cm) kg of antibiotics per tonne fish (kg) turbidity (Secchi disk cm) total particulate organic matter (mg/m 3 ) zooplankton biomass (mg/m 3 ) chlorophyll (mg/m 3 ) kg of antibiotics per tonne fish (kg) total dissolved organic matter (mg/m 3 ) relationship between exogenous and endogenous antifouling use (y /n) level of degradation of sensitive habitats (monitoring) kg of anti-parasites per tonne fish (kg) kg of disinfectant per tonne fish (kg) Rank 33
43 N DEn/ Indicators Weighted mean score 22 volume of water occupied per kg of product(kg/m 3 ) capture versus quota (t/year) total P (kg) sediment structure (%) heavy metal accumulation (micrograms) use of non indigenous species (y/n) loss of nursery and spawning grounds (yes/no) recruitment index and spawning stock biomass) Rank demand of pelagic fish (t/year) total organic carbon (TOC mg/m 2 ) presence of hatchery with native brood benthic community structure modification (benthic index) escapees (ind) use of native broodstocks (y/n) use of GMO species (y/n) level of spawning carrying/holding capacity of the ecosystem lost food versus total (%) number of introduced species (n) use of food with chemical antioxidants (y/n) presence of pathogens from farm pathogens (y/n) aggregation of pelagic fish (ind/m 2 ) increase the fishing activities around the farm cages (landing and biomass index) faeces sedimentation rates (g/ day) demand of vegetable. products (t/year) redox potential and ph (ph) capture modification of target species in the area (monitoring fisheries activities) escapees (numbers) nutrient balance (kg) life-cycle assessment (formula) monitoring the quality of the fish larvae produced tropic level of production (index) footprint index (Hc) With respect to the scale (1 to 9) used for an evaluation of the attributes of indicators and outcomes of Questionnaire 3, it can be concluded that indicators with a mean score of 5 and above should be regarded as generally acceptable indicators from the point of view of Turkish stakeholders. In connection with DEn/Principle 2, respect the ecological service of the ecosystem, the criterion DEn/C1 water quality and DEn/C4 oceanographic conditions, were selected as the most valuable by the participants. Participants also found the indicator food conversion ratio of great value (6.7-6). This probably indicates a preoccupation for clean seas and awareness that uneaten fish feed is a major cause of pollution. With DEn/P3C2, the participants were very interested in applying indicators to help minimize the effect on the local environment of the use of chemical products and drugs and they ranked it Moreover, notions such as footprint, trophic level of production (index), the relationship between exogenous and endogenous nutrients and nutrient balance (kg) were not immediately clear to everyone and, perhaps for this reason, were not given high scores. 34
44 Outcome of discussions for the environmental dimension In the course of our discussion on the selection of indicators, it became clear that many of those present had a real desire to learn much more about the scientific and technical concepts important to evaluating the interactions of aquaculture with the environment. It was clear that there is a need to develop a glossary at two levels about the indicators. The first should be very scientific and quantifiable. The second should be able to be understood by everybody. This will be facilitated by further development of open transparent and clearly understood indicators of the principles and criteria of aquaculture analysis under the headings governance, socio-economic matters and environmental notions. The members of the workshop were clearly most interested in water quality, oceanographic condition and protection from improper use of chemical products and drugs as criteria with attached indicators. Whilst everyone was interested in the criteria carrying/holding capacity of the ecosystem, it was very clear that much work is still needed in developing suitable indicators for this. The use of turbidity and of oxygen occurs more than once in the above analytical table of principles, criteria and indicators. This needs further investigation and clarification. There is currently a multi-level image problem for Turkish Marine Aquaculture as a whole, and especially with regard to environmental interaction and human health. It is possible that a close symbiosis of the aquaculture sector and ecological NGOs might be mutually beneficial. In this, environmental indicators, piloted at the InDAM Mugla Technical Meeting, suggest new developmental directions both for the image of aquaculture and for the protection and sustainability of the ecosystem. Great educative effort is needed to correct image problems and to positively market aquaculture in general, and specifically for individual brands. The role of consumer associations and television and other media in broadcasting features and documentaries is very necessary. 2.4 General conclusions and recommendations Constructive discussions on every aspect of the indicator selection process were made during the two day meeting. After wide ranging discussions on methodology it was agreed by all the stakeholders that the first step in the indicator selection process is to find a consensus on identification and prioritization of attributes. These will then be used in the selection of indicators. There are many commonly known attributes to be found in related literature on the selection of indicators. A common understanding and perception of these attributes, followed by the prioritization process with the contribution of local stakeholders and a common consensus is a necessity for the selection of indicators for sustainable development. This process should take into consideration local particularities and conditions. Different stakeholders can have different perceptions of attributes and priorities. For example some participants stressed that transparency as an attribute should be a priority for selection of indicators for sustainable aquaculture, while others focused on reproducibility/verifiability as the main attributes. It was widely accepted that a consensus on the prioritization of these attributes would be a must for developing a consensus on the selection of indicators. It was also underlined that the process of identifying and prioritizing attributes for selection of indicators during the meeting created interaction between stakeholders. This contributed to building awareness on the concept of sustainable aquaculture. It was also recalled that the use of indicators should and could enhance the communication between farmers and society. During the last session of the meeting several other issues were opened. These included the clarity of some of principles, criteria and indicators: the number of indicators for each dimension; the availability of reference points and the use of monitoring tools such as the traffic light approach. Enhancement of institutional capabilities, the use of indicators as a tool for promoting the image of aquaculture and of aquaculture products, the use of indicators for evaluating sufficiency in terms of fish feed ingredients, within the concept of sustainable aquaculture were also discussed. 35
45 The main outcome of the pilot study technical meeting could be summarized as follows: Identification and prioritization of attributes of indicators is a crucial issue. It should be considered as the first logical and methodological step in the selection process of the indicators for the development of sustainable aquaculture in the Mediterranean. A consensus on identification and prioritization of attributes for selection of indicators by stakeholders at local level is crucial. A consensus on identification and prioritization of attributes firstly requires a common understanding and perception of attributes at local level. The preparation of a Glossary on attributes for selection of indicators would facilitate this process. Carrying capacity is a crucial issue within the concept of sustainable aquaculture, but the complexity of the concept means that it is not easy to use it as a criterion. The number of indicators in each dimension is an issue which needs to be addressed as far as practicality and cost-effectiveness of PCI approach is concerned. Functionality and practicability of PCI approach within the concept of sustainable aquaculture will remain a challenge without reliable reference points at local level for monitoring purposes. However such reference points are not always readily available at local level. The use of monitoring tools such as the Traffic Light Approach within the concept of sustainable aquaculture should also be addressed. At local level the emerging issues, which need to be addressed within the concept of sustainable aquaculture, are: site selection and site allocation, environment, the image of aquaculture and of aquaculture products, marketing, transparency and the institutional capabilities of public organizations. Recommendations included the follow-up actions: The process of indicator selection should be further supported and deepened with pilot studies at local level. A second technical meeting or a pilot case study at local level would be useful. A common understanding and perception regarding attributes of indicators is a crucial issue to be addressed. Preparation of a glossary on attributes of indicators is a fundamental target for the PCI approach and needs to be addressed within the activities of an InDAM Project. A common quantitative methodology for selection of indicators by stakeholders needs to be addressed within the activities of the InDAM Project. 36
46 Appendix 1 Appendices Questionnaire 1 - Indicator s attributes Allocate 100 points to below mentioned attributes according to your preference for their use in indicator selection process. Profession Field of expertise: N Attribute Definition Score 1 relevance to criteria and principle is relevant to goals of endorsed criteria and principle. 2 understandability is clear and perceived by all stakeholders in the same manner and is easily communicated. 3 reliability has a sound scientific base and methodology with successful previous use. 4 reproducibility/verifiability is capable of being reproducible at different time and places with verifiable results. 5 data availability is estimated/produced using available information/data or can be estimated/produced with reasonable cost/effort. 6 international compatibility is compatible with other indicators developed by other countries, regions or bodies. 7 transparency is accessible by all stakeholders. 8 availability of reference values can be compared/monitored with some readily available reference points. 9 acceptability is endorsed by different stakeholders. 10 robustness is difficult to manipulate. Total
47 Appendix 2 Part of Questionnaire 2 (Rapid Appraisal) for Social Dimension (3 Principles, 13 Criteria and 18 Indicators) Evaluate the indicators in terms of "Acceptability" as Yes/No DSo/ PRINCIPLE 1: Contribute to food security and healthy nutritional needs 38 Code Criteria N o Indicators P1C1 importance of fish availability 1 annual production P1C2 P1C3 accessibility for local consumers commitment to and type of quality-based approach adopted by the farms 2 quantity of fish produced for domestic markets (self-consumption) and apparent consumption 3 fish price compared with the minimum wage 4 percentage of innovative products proposed each year Acceptability Yes No If no, why?
48 Appendix 3 Part of Questionnaire 3 (Indicator Appraisal) The application of the selected attributes to the final selection of indicators - Social dimension, Principle 1 Evaluate/Score indicators in columns in terms of attributes from 1 to 9 as following: 1 (weak-insufficient), 3 (middle), 5 (good), 7 (very good) and 9 (perfect), 2, 4, 6 and 8 (intermediate values) DSo/ PRINCIPLE 1: Contribute to food security and healthy nutritional needs 39 Code Criteria N Indicator P1C1 importance of fish availability 1 annual production P1C2 P1C3 accessibility for local consumers commitment to and type of qualitybased approach adopted by the farms. 2 quantity of fish produced for domestic markets (selfconsumption) and apparent consumption 3 fish price compared with the minimum wage 4 percentage of innovative products proposed each year Attribute Relevance Data availability Data reliability Understandability Allocate 100 points to below mentioned attributes according to your preference/ranking relevance to criteria and principle understandability data availability Reliability total 100
49 3. THE PILOT STUDY IN TUNISIA Introduction The Tunisian pilot study was carried out during 2009 and culminated in the technical meeting in Monastir, Tunisia, from 13 th to 14 th October Thirty-nine aquaculture stakeholders (representatives of national and regional administration of fisheries and aquaculture of the Ministry for agriculture and marine resources, the Ministry of environment and sustainable development, interprofessional groups, scientists in aquaculture, university members, the World Wildlife Found- WWF) participated to the meeting. The meeting was organized also on basis of results from the first InDAM technical meeting held at Mugla, Turkey, in September Methodology applied for the selection of indicators The process for the selection of indicators was discussed during the technical meeting with the stakeholders with different background and expertise, following the methodology adopted in the Turkish pilot study (collective discussion and compilation of questionnaires). As results, the following attributes were used by the stakeholders for the selection of indicators: data availability (the indicator can be compared/monitored with some readily available reference points); these attributes were considered as the most determinant ones for the selection of indicators in Tunisia. reliability (the indicator has a sound scientific base and methodology); relevance to criteria and principle (the indicator is relevant to goal of endorsed criteria and principles); understandability (the indicator is clear and perceived by all stakeholders in the same manner and easily communicated). Based on the above attributes the indicators selected were prioritized for each one of the 4 dimensions (governance, economic, social and environmental) of sustainable aquaculture. 3.3 Results of the questionnaires on the evaluation of indicators Identification and prioritization of the attributes to be used in the selection of indicators The high number of indicators could represent a constraint in their construction and application at local scale, hence the wish to reduce the number of indicators to a minimum. The absence of a glossary and/or directives for the comprehension of indicators and the algorithm necessary to estimate several of them was at the origin of long discussions. The sustainability of the aquaculture sector and the impact of all management measures taken by the administration could be perceived by the trend analysis of the selected indicators. It is very important to define reliable reference points for each indicator. For most of the other indicators, reference points have relative values (in relation to the mean, the median, etc.). In both cases debate should go on, as data are not always available at local level. The results of the scores to attributes from the 18 participants who filled up the questionnaire show that data availability (36.9 percent) is the most determinant attribute for the selection of indicators in Tunisia (Table 16). It is followed by reliability, relevance to criteria and principles, and understandability. 17 Prepared by S.Ben Salem, A.Elouar, M.Hadjali Salem, M.Zouari (for affiliation, see Annex 6b) 40
50 Table 17 Attribute score Attribute Mean score (out of 100) data availability 36.9 reliability 25.3 relevance to criteria and principles 19.2 understandability Governance dimension DGo 18 A rich debate took place among the different stakeholders, in particular fish farmers, representatives of the local regional and central administrations. Indicators evaluation The statistical analysis was carried out on the scores given to each attribute on the 17 questionnaires compiled, and the mean score is reported in the tables below. Table 18 Results of selection of indicators using prioritized attributes for the governance dimension DGo/PRINCIPLE 1: Strengthen integration of aquaculture in local development Code Criteria N o Indicators Weighted mean score P1C1 importance of development initiatives 1 number of areas allocated for aquaculture 7.33 P1C2 integration of local culture and landscape 2 P1C3 level of contribution to local employment and to poverty alleviation P1C4 interactions with other sector at local level 6 P1C5 P1C6 contribution of the sector to improve the environment. capacity of aquaculture to improve environmental monitoring capacity P1C7 level of social recognition 10 DGo/ PRINCIPLE 2: Promote participation in decision making process age and historical role of the activity and contribution to the traditional landscape of the area number of workers (direct and indirect) percentage of permanent (and seasonal) full time equivalent workers percentage of seasonal workers in aquaculture compared to seasonal workers in tourism conflicts and opportunities with other activities and uses recycling rate of by-product existence of subsidies for aquaculture ecologic services number of reports on environmental crises in five years participation rate to the socio-professional political organizations and in local assemblies Code Criteria N o Indicators P2C1 level of understanding in the industry 11 percentage of fish-farmers and technicians who know the regulations Weighted mean score P2C2 existence of control systems 12 number of control officers /. 18 This section was chaired by M. Mourad ZOUARI, marine aquaculture engineer in the General Directorate for Fisheries and Aquaculture, Turkey. 41
51 DGo/ PRINCIPLE 2: Promote participation in decision making process Code Criteria N o Indicators P2C3 P2C4 P2C5 level of participation level of decentralization of decisionmaking level of management and regional planning percentage of fish-farmers in breach of the law number of participants at consultative meetings Weighted mean score number of new co-constructed measures number of fish-farmers taking part in consultative bodies number of conflicts solved at local level number of conflicts due to contradictions between traditional and constitutional legislation number of authorizations granted compared to the number of requests number of new sites created existence of ICZM plan for coastal areas, including aquaculture under head state authority, taking into account the future evolution of industry. DGo/ PRINCIPLE 3: Strengthen research, information systems and extension services Code Criteria N o Indicators P3C1 P3C2 P3C3 P3C4 importance of research and training in aquaculture level of interaction between research, industry and administration access to aquaculture information systems access to scientific, administrative and technical data 6.10 Weighted mean score 22 existence of research funds existence of bodies in support to aquaculture training number of partnership contracts existence of an information system existence of extension and dissemination services DGo/ PRINCIPLE 4: Strengthen institutional capacities in relation with sustainable development Code Criteria N o Indicators P4C1 P4C2 P4C3 level of national recognition of sustainable development level of involvement of the state in the implementation of sustainable development level of commitment of the state towards the industry existence of a national sustainable development strategy existence of rules and regulations in favour of sustainable development rate of state financial aid compared to other sectors existence of a public plan to support aquaculture development number of concessions and license for aquaculture 8.20 Weighted mean score existence of competent state services existence of funds allocated for training existence of legal recourses 7.27 The classification of the indicators for the governance dimension on their weighted mean scores is reported in Table
52 It is important to report that for all four dimensions of sustainable aquaculture, the indicators were ranked in 3 groups, as follows: Group 1 (dark grey): highly acceptable indicators, weighted mean score > 66th percentile Group 2 (light grey): acceptable indicators, 33rd percentile weighted mean score 66th percentile Group 3 (grey): weakly acceptable indicators, weighted mean score < 33rd percentile Indicator DGo/27 existence of a national sustainable development strategy was considered as the most important as it had the highest score (9.23). The indicator with the lowest score was DGo/ 18 number of conflicts due to contradictions between traditional and constitutional legislation with 3. Among the 34 indicators of the governance dimension, 12 of them (DGo/27, 31, 23, 28, 30, 3, 22, 32, 26, 29, 24 and 33) could be qualified as highly acceptable. Table 19 Ranking of indicators based on their weighted mean score in terms of prioritized attributes for the governance dimension N o Indicators Weighted mean score 27 existence of a national sustainable development strategy number of concessions and license for aquaculture existence of bodies in support to aquaculture training existence of rules and regulations in favour of sustainable development existence of a public plan to support aquaculture development number of workers (direct and indirect) existence of research funds existence of competent state services existence of extension and dissemination services rate of state financial aid compared to other sectors existence of funds allocated for training number of partnership contracts existence of an information system number of reports on environmental crises in five years number of areas allocated for aquaculture existence of legal recourses number of new sites created conflicts and opportunities with other activities and uses percentage of fish-farmers and technicians who know the regulations existence of ICZM plan for coastal areas, including aquaculture under head state authority, taking into account the future evolution of industry. 4 percentage of permanent (and seasonal) full time equivalent workers existence of subsidies for aquaculture ecologic services age and historical role of the activity and contribution to the traditional landscape of the area 12 number of control officers number of participants at consultative meetings Rank /. 43
53 No 5 Indicators percentage of seasonal workers in aquaculture compared to seasonal workers in tourism Weighted mean score Rank number of fish-farmers taking part in consultative bodies number of new co-constructed measures participation rate to the socio-professional political organizations and in local assemblies percentage of fish-farmers in breach of the law recycling rate of by-product number of conflicts solved at local level number of conflicts due to contradictions between traditional and constitutional legislation 33rd percentile = 5.91 & 66th percentile = 7.73 Discussion The remarks which emerged from the debate were as follows: indicator DGo/7 recycling rate of by-product is not clear; more explanations are required as far as the relationship between the indicator and the corresponding criteria is concerned. indicator DGo/8 existence of subsidies for aquaculture ecologic services : it should be specified if it is ecological or organic aquaculture. there is no connection between indicator DGo/12 number of control officers and DGo/13 percentage of fish-farmers in breach of the law with the criterion DGo/P2C2 existence of control systems nor with the principle DGo/P2 promote participation in decision making process. the two indicators DGo/14 number of participants at consultative meetings and DGo/16 number of fish-farmers taking part in consultative bodies could be merged in one single indicator number of fish farmers in relation to the number of participants taking part in consultative organisms Economic dimension DEc 19 Considering the recent settlement of several aquaculture farms in cages, their economic sustainability and their contribution to environmental sustainability in the sites where these farms are located should be seriously considered. Indeed, the experience of other Mediterranean systems shows that several environmental, social, economic, institutional and regulation constraints have seriously affected aquaculture farms and could threaten the sustainability of the Tunisian aquaculture sector. Indicator evaluation The statistical analysis was carried out on the scores given to each attribute on the 17 questionnaires compiled, and the mean score is reported in the tables below. 19 This section was chaired by M. Scander BEN SALEM (for affiliation, see Annex 6b) 44
54 Table 20 Results of selection of indicators using prioritized attributes for the economic dimension DEc/ PRINCIPLE 1: Strengthen consumer responsive and market oriented aquaculture Code Criteria N o Indicators P1C1 use of branding or quality assurance schemes/labels Weighted mean score 1 existence of own-label (y/n and %) n/a 2 existence of quality certification schemes (independent bodies) (y/n and %) P1C2 traceable products 3 existence of a traceability system 6.88 P1C3 level of value enhancement P1C4 processing capacity 6 P1C5 level of knowledge management percentage of value-added products price differential with respect to quality (y/n) 5.00 availability of processing capacity for the sector company customer surveys sector market studies existence of company marketing plan 5.50 P1C6 level of market promotion activities 10 marketing costs/total revenue 5.33 DEc/ PRINCIPLE 2: Strengthen risk assessment and crisis management capabilities Code Criteria N o Indicators 11 number of products (i.e. species, size categories, value-added) Weighted mean score n/a P2C1 level of diversification 12 integration of core business with complementary activities (eco-tourism, recreational fishing, restaurant) geographic market diversification (number and % share of each market of total sales) 5.16 P2C2 P2C3 P2C4 P2C5 level of input self-sufficiency capability to monitor and challenge pathological hazards increased research & development capabilities and innovation level of property rights over production sites 14 share of each customer in total sales number of national feed suppliers (also % imported) 16 number of national hatcheries (also % of fry imported) existence of biosecurity system existence of legislation on biological waste disposal 19 existence of farm health management system (including vaccination program) ratio of R&D expenditure/total sales ratio of national expenditure on R&D/GDP duration of lease of the site no. of site lease renewals per year existence of national legislation for zoning existence national emergency funds (natural disasters) 6.38 P2C6 level of awareness of natural hazards 26 ratio of insurance costs/total sales existence of legislation for monitoring of environmental parameters use of ISO (or other certified system) 7.07 P2C7 level of market maturity 29 existence of producer's organizations or cooperatives for sales supply and sales by contract or by market 5.89./. 45
55 DEc/ PRINCIPLE 2: Strengthen risk assessment and crisis management capabilities Code Criteria N o Indicators Weighted mean score P3C1 P3C2 P3C3 P3C4 level of profitability level of input efficiency level of financial strength level of environmental protection costs P3C5 ease of entry into industry gross profit margin (gross profit/revenue x100) 32 rate of return on farm assets feed cost/kg fish produced (and % of total cost/kg) n/a fry cost/kg (and % of total cost/kg) labour cost/kg fish produced (and % of total cost/kg) unit production cost (total variable and fixed costs/kg fish produced/operating costs) (excage) energy cost/kg fish produced (and % of total cost/kg) transportation cost/kg (and % of total cost/kg) financial costs/kg fish produced (and % of total cost/kg) current ratio (total current farm assets/total current farm liabilities) debt/asset ratio (total farm liabilities/total farm assets) debt/equity ratio (total farm liabilities/total farm equity) environmental monitoring costs/kg fish produced (and as % of total cost/kg) capital investments for environmental protection/kg (and as % of total cost/kg) existence of incentives, direct or indirect, for environmental protection actions existence of national mechanism supporting start-ups (tax-break, subsidies, financing) DEc/ PRINCIPLE 4: Strengthen the role of professional organizations for the economic sustainability of aquaculture Code Criteria N o Indicators Weighted mean score P4C1 P4C2 P4C3 P4C4 level of knowledge management level of collective marketing and actions promotion of training and awareness building increased capability for crisis management 47 sector market studies market data dissemination (annual seminars by federations or authorities) % of annual national federations (producer s organizations) budget allocated to marketing and promotion annual national budget allocated for marketing and promotion of the sector existence of a permanent information/communication program at sector level existence of training program for sector employees on financial aspects of activity existence of training program for sector employees on environmental aspects of activity existence of emergency fund
56 The classification of the indicators for the economic dimension on their mean scores is reported in Table 4. Indicator DEc/22 duration of lease of the site was considered as the most important for the economic dimension as it had the highest score (9.07). The indicator with the lowest score is DEc/5 price differential with respect to quality (y/n) with a score of 5. Among the 52 indicators for the economic dimension, 17 (DEc/22, 16, 46, 23, 15, 21, 28, 2, 27, 3, 29, 19, 33, 50, 25, 34 and 24, ordered by score priority) are among the highly acceptable ones. Table 21 Ranking of indicators based on their weighted average score in terms of prioritized attributes for the economic dimension N Dec/ Indicators Weighted mean score 22 duration of lease of the site number of national hatcheries (also % of fry imported) existence of national mechanism supporting start-ups (tax-break, subsidies, financing) Rank no. of site lease renewals per year number of national feed suppliers (also % imported) ratio of national expenditure on R&D/GDP use of ISO (or other certified system) existence of quality certification schemes (independent bodies) (y/n and %) existence of legislation for monitoring of environmental parameters existence of a traceability system existence of producer's organizations or cooperatives for sales existence of farm health management system (including vaccination program) feed cost/kg fish produced (and % of total cost/kg) annual national budget allocated for marketing and promotion of the sector existence of national emergency funds (natural disasters) fry cost/kg (and % of total cost/kg) existence of national legislation for zoning existence of biosecurity system ratio of insurance costs/total sales sector market studies existence of a permanent information/communication program at sector level labour cost/kg fish produced (and % of total cost/kg) ratio of R&D expenditure/total sales transportation cost/kg (and % of total cost/kg) unit production cost (total variable and fixed costs/kg fish produced/operating costs) (ex-cage) energy cost/kg fish produced (and % of total cost/kg) supply and sales by contract or by market capital investments for environmental protection/kg (and as % of total cost/kg) existence of emergency fund rate of return on farm assets current ratio (total current farm assets/total current farm liabilities) existence of crisis management manual (strategy) market data dissemination (annual seminars by federations or authorities) /. 47
57 N Dec/ Indicators Weighted mean score 39 financial costs/kg fish produced (and % of total cost/kg) existence of training program for sector employees on environmental aspects of activity 18 existence of legislation on biological waste disposal debt/asset ratio (total farm liabilities/total farm assets) % of annual national federations (producer s organizations) budget allocated to marketing and promotion 42 debt/equity ratio (total farm liabilities/total farm equity) existence of company marketing plan integration of core business with complementary activities (eco-tourism, recreational fishing, restaurant) 45 existence of incentives, direct or indirect, for environmental protection actions marketing costs/total revenue company customer surveys availability of processing capacity for the sector geographic market diversification (number and % share of each market of total sales) 8 sector market studies environmental monitoring costs/kg fish produced (and as % of total cost/kg) share of each customer in total sales percentage of value-added products existence of training program for sector employees on financial aspects of activity price differential with respect to quality (y/n) existence of own-label (y/n and %) n/a n/a 11 number of products (i.e. species, size categories, value-added) n/a n/a 31 gross profit margin (gross profit/revenue x100) n/a n/a Rank Discussion The remarks which emerged from the debate were as follows: indicators DEc/10,11,12: it was suggested to include another indicator relative to the number of species with a closed life cycle in captivity, according to criterion DEc/P2C1 level of diversification, indicator DEc/38 transportation cost/kg (and % of total cost/kg) : the participants, especially representatives of fish farms, said that transport costs are often included in fry or food costs. They wished to clarify the advantage of these costs. it is important to signal two repetitions of indicators: - indicators DEc/7 and DEc/44 both concern the realisation of sector based market studies, - indicators DEc/23 and DEc/51 both concern the existence of emergency funds for crisis management, the participants suggested eliminating indicator DEc/48 market data dissemination (annual seminars by federations or authorities) as another indicator (DEc/51 existence of a permanent information/communication program at sector level has the same meaning. 48
58 Social dimension - DSo The participants indicated that the most important principle is the contribution of aquaculture to food security and safety. Indicator evaluation The statistical analysis was carried out on the scores given to each attribute on the 18 questionnaires compiled, and the weighted mean score is reported in the tables below. Table 22 Results of selection of indicators using prioritized attributes for the social dimension DSo/ PRINCIPE 1: Contribute to food security and healthy nutritional needs Code Criteria N o Indicators Weighted mean score P1C1 importance of fish availability 1 annual production 7.54 P1C2 P1C3 accessibility for local consumers commitment to and type of quality-based approach adopted by the farms quantity of fish produced for domestic markets (self-consumption) and apparent consumption fish price compared with the national minimum wage percentage of innovative products proposed each year DSo/ PRINCIPLE 2: Strengthen the role of the Producer Organizations and NGO s to improve image of aquaculture, social awareness and responsibilities Code Criteria N o Indicators P2C1 average salary levels 5 P2C2 level of qualification 6 P2C3 importance of fish farmer organizations P2C4 image of aquaculture 9 P2C5 capacity to take part in decision-making 10 DSo/ PRINCIPLE 3: Strengthen corporate social responsibility minimum wage of employees compared to national minimum wage percentage of fish-farmers with specialized aquaculture training and certificate Weighted mean score number of professional associations existence of a professional status 5.45 existence of ecolabels and product specifications effective participation to decision making process Code Criteria N o Indicators P3C1 P3C2 P3C3 working conditions (hours and security) level of protection and participation to trade union. women s access to the industry, including salary level P3C4 access to information 15 P3C5 fish welfare 11 number of monthly hours currently worked by aquaculture workers Weighted mean score number of occupational accidents percentage of trade union members among workers percentage of women fish-farmers 5.91 existence and importance of interprofessional organizations unmarketable fish ratio number of declared pathologies percentage of premium quality fish 5.28 The classification of the indicators for the social dimension on their weighted mean scores is reported in Table
59 Through the local perception of the indicators for the social dimension, indicator GSo/1 annual production has the highest score (7.54) and it is therefore the most important among the 18 indicators in this dimension. The indicator GSo/16 unmarketable fish ratio has the lowest score The indicators considered highly acceptable are 6: GSo/1, 2, 3, 6, 11, and 12. Table 23 Ranking of indicators based on their weighted average score in terms of prioritized attributes for the social dimension Discussion N Dso/ Indicators Weighted mean score 1 annual production fish price compared with the minimum wage percentage of fish-farmers with specialized aquaculture training and certificate 11 number of monthly hours currently worked by aquaculture workers 2 quantity of fish produced for domestic markets (selfconsumption) and apparent consumption Rank number of occupational accidents number of professional associations percentage of women fish-farmers existence of ecolabels and product specifications existence of a professional status effective participation to decision making process percentage of premium quality fish existence and importance of interprofessional organizations percentage of trade union members among workers percentage of innovative products proposed each year minimum wage of employees compared to national minimum wage number of declared pathologies unmarketable fish ratio rd percentile = 5.22 and 66 th percentile = 6.14 The remarks which emerged from the debate were as follows: indicator DSo/2 quantity of fish produced for domestic markets (self-consumption) and apparent consumption : it is necessary to clarify the formula for the apparent consumption and the data required for its calculation. indicator DSo/5 minimum wage of employees compared to national minimum wage : this indicator should be replaced by minimum wage of employees to be compared to national minimum wage indicator DSo/9 existence of ecolabels and product specifications : it is recommended to split this indicator in two, one relative to the existence of ecolabels, the other to the existence of product specifications. indicator DSo/14 percentage of women fish-farmers : women in aquaculture should include managers, technicians and clerks, workers. indicators DSo/16, 17, 18: there is no agreement between criterion DSo/P3C5 fish welfare [and the indicators associated to it (DSo/16,17,18)] and the principle DSo/P3 strengthen corporate social responsibility. 50
60 Environmental dimension - DEn 20 The participants showed a great interest for this subject. They stressed the importance of the interactions between aquaculture activities and the ecosystem components (biotopes, biological diversity, anthropic activities) in which they are located. Indicator evaluation The statistical analysis was carried out on the scores given to each attribute on the 18 questionnaires compiled, and the mean score is reported in the tables below. Table 24 Results of selection of indicators using prioritized attributes for the environmental dimension DEn/ PRINCIPLE 1: Minimizing the global impact of aquaculture Code Criteria N o Indicators Weighted mean score P1C1 P1C2 needs of natural resource (pelagic fish and vegetables) consume of energy 1 food conversion ratio (kg food/kg fish) demand of pelagic fish (t/year) demand of vegetable products (t/year) footprint index (Hc) life-cycle assessment (formula) tropic level of production (index) 3.86 P1C3 alien species 7 number of introduced species (n) 6.43 P1C4 capture-based aquaculture 8 capture versus quota (t/year) 6.03 DEn/ PRINCIPLE 2: Respect the ecological service of ecosystem Code Criteria N o Indicators Weighted mean score P2C1 water quality 9 turbidity/transparency (Secchi disk) microbiological indicators (total coliform) algae bloom (n. cells / ml) loss of nursery and spawning grounds (yes / no) recruitment index and spawning stock biomass) 4.12 P2C2 fisheries and nursery areas capture modification of target species in the area (monitoring fisheries activities) increase the fishing activities around the farm cages (landing and biomass index) presence of hatchery with native brood stocks (yes/no) monitoring the quality of the fish larvae produced 6.11 P2C3 carrying/holding capacity of the ecosystem 17 n/a n/a 18 hydrodynamic (cm /s) 7.48 P2C4 oceanographic conditions 19 depth (m) interchange with open sea (offshore) (distance in m) percentage of the used space (%) 3.85./. 20 This section was chaired by M. Ali EL OUAER, research scientist in aquaculture 51
61 DEn/ PRINCIPLE 2: Respect the ecological service of ecosystem P2C5 trophic conditions 22 volume of water occupied per kg of product (kg / m 3 ) oxygen saturation (%) relationship between exogenous and endogenous nutrients DEn/ PRINCIPLE 3: Minimizing the local impact on environmental conditions and biodiversity Code Criteria N o Indicators P3C1 P3C2 P3C3 P3C4 P3C5 input of organic and inorganic wastes use of chemical products and drugs impact on benthic habitat and communities impact on pelagic habitat and communities genetic impact P3C6 disease spread from farms Weighted mean score 25 faeces sedimentation rates (g/day) lost food versus total (%) nutrient balance (kg) kg of antibiotics per tonne fish (kg) antifouling use (y /n) kg of anti-parasites per tonne fish (kg) kg of disinfectant per tonne fish (kg) use of food with chemical antioxidants (y/n) use of organic certified fish food (y/n) redox potential and ph (ph) total P (kg) sediment structure (%) heavy metal accumulation (micrograms) benthic community structure modification (benthic index) total organic carbon (TOC mg/m 2 ) level of degradation of sensitive habitats (monitoring) turbidity (Secchi disk cm) total particulate organic matter (mg/m 3 ) total dissolved organic matter (mg/mc) chlorophyll (mg/m 3 ) zooplankton biomass (mg/m 3 ) aggregation of pelagic fish (ind/m 2 ) escapees (ind) use of non indigenous species (y/n) use of GMO species (y/n) level of spawning use of native broodstocks (y/n) escapees (numbers) 3.76 presence of pathogens from farm pathogens (y/n) 6.08 The classification of the indicators for the environmental dimension on their weighted mean scores is reported in Table 24. Indicator DEn/19 depth (m) is considered as the most important with a score of The indicator with the lowest score is DEn/40 level of degradation of sensitive habitats (monitoring) with a score of
62 Indicator DEn/17 relative to the criterion DEn/P2C3 carrying/holding capacity of the ecosystem, a very important factor for aquaculture sustainability, was not defined, and participants did not score this indicator. It is a priority to define coherent indicators linked to this criterion. Among the 53 indicators of the environmental dimension, 18 (DEn/19, 23, 1, 22, 34, 18, 15, 35, 2, 48, 44, 32, 49, 36, 10, 51, 31 and 28) could be qualified as highly acceptable. Table 25 Ranking of indicators, based on their weighted average score in terms of prioritized attributes for the environmental dimension N o Den/ Indicators Weighted mean score Rank 19 depth (m) oxygen saturation (%) food conversion ratio (kg food/kg fish) volume of water occupied per kg of product(kg/m 3 ) hydrodynamic (cm/s) redox potential and ph (ph) presence of hatchery with native brood kg of anti-parasites per tonne fish (kg) demand of pelagic fish (t/year) use of non indigenous species (y/n) chlorophyll (mg/m 3 ) use of food with chemical antioxidants (y/n) use of GMO species (y/n) sediment structure (%) microbiological indicators (total) use of native broodstocks (y/n) kg of disinfectant per tonne fish (kg) kg of antibiotics per tonne fish (kg) turbidity/transparency (Secchi disk cm) number of introduced species (n) kg of anti-parasites per tonne fish (kg) total particulate organic matter (mg/m 3 ) demand of vegetable products (t/year) use of organic certified fish food (y/n) antifouling use (y /n) interchange with open sea (offshore) distance in m turbidity/transparency (Secchi disk cm) turbidity (Secchi disk cm) zooplankton biomass (mg/m 3 ) monitoring the quality of the fish larvae produced presence of pathogens from farm pathogens (y/n) lost food versus total (%) capture versus quota (t/year) /. 53
63 N o Den/ Indicators Weighted mean score Rank 43 total dissolved organic matter (mg/m 3 ) footprint index (Hc) relationship between exogenous and endogenous increase the fishing activities around the farm cages (landing and biomass index) capture modification of target species in the area (monitoring fisheries activities) faeces sedimentation rates (g/ day) total organic carbon (TOC mg/m 2 ) nutrient balance (kg) loss of nursery and spawning grounds (yes/no) recruitment index and spawning stock (biomass) benthic community structure modification (benthic index) aggregation of pelagic fish (ind/m 2 ) escapees (ind) tropic level of production (index) percentage of the used space (%) level of spawning life-cycle assessment (formula) escapees (numbers) level of degradation of sensitive habitats (monitoring) carrying/holding capacity of the ecosystem n/a n/a 33 rd percentile = 5.10 & 66th percentile = 6.58 Discussion The remarks which emerged from the debate were as follows: oxygen % saturation should be added as indicator for criterion DEn/P2C1 water quality, indicator DEn/18 should be called current instead of hydrodynamic (cm /s) indicator DEn/22 should be called rearing density instead of volume of water occupied per kg of product (kg/m3) the unit in indicator DEn/46 aggregation of pelagic fish (ind/m2) should be replaced by individuals/m2, indicator DEn/52 escapees (number) repeats indicator DEn/47 escapees (ind.), indicator DEn/17 carrying/holding capacity of the ecosystem of the criterion DEn/P2C2 called carrying/holding capacity of the ecosystem should be described in more details. 3.4 General conclusions Constructive discussions on every aspect of the indicators selection process were made during the two days meeting. The process of identifying and prioritizing attributes for the selection of indicators during the meeting and discussion on the priorities of the indicators, as in the case of Mugla (Turkey), represented an important moment of debate and of interaction among stakeholders (from farms, administration, research institutions, NGOs). This assumes a great relevance in Tunisian areas such as Monastir where aquaculture has recently been developed. 54
64 In particular the following considerations and conclusions were made by the participants: For having a consensus and a common perception on sustainable aquaculture among the different stakeholders, indicators should be understandable. The lack of a glossary and/or directives for the comprehension of indicators and the algorithm necessary to estimate several of them was at the origin of long discussions and represent a limiting factor during the discussion. The sustainability of the aquaculture sector and the impact of all management measures taken by the administration and other stakeholders could be also perceived by the analysis of the trends of the selected indicators. It should therefore be necessary for many indicators to have a data series to make any comparison and determinate reference points. For some indicators data are not always available or are not available at local level. However the high number of indicators could represent a constraint in the application at local scale in terms of data availability, time consumption and cost effectiveness. The number of indicators should be reduced and analysis should be made to evaluate any redundancy. The participants suggested the preparation of a glossary and/or directives for the explanation of indicators with a protocol of their measurement including references values. For each quantitative indicator, a reference point should be indicated and for all indicators a methodology for the use of indicators in the process of sustainable development, such as trend analysis, traffic light methods, and others, should be defined. Participants stressed that discussion on indicators for sustainable aquaculture should continue also to strengthen the cooperation among the different stakeholders created during the Monastir technical meeting, and suggested to organise other technical meetings in Tunisia and in other Mediterranean countries to refine the process of selection and evaluation of indicators for sustainable aquaculture at local scale. The results of the Turkish and Tunisian pilot projects were presented and discussed at the final meeting of the InDAM Project first-year of activities (19-20 November 2009, Salammbô, Tunis, Tunisia). 55
65 4. INDICATORS FOR AQUACULTURE SUSTAINABILITY FOR THE MEDITERRANEAN 21 (as identified in the Montpellier II meeting and the InDAM pilot studies) 4.1 Governance dimension (4 principles, 19 criteria, 34 indicators) DGo/ PRINCIPLE 1: Strengthen integration of aquaculture in local development 56 Code Criteria N o Indicators P1C1 importance of development initiatives 1 number of areas allocated for aquaculture P1C2 integration of local culture and landscape 2 P1C3 level of contribution to local employment and to poverty alleviation P1C4 interactions with other sectors at local level 6 P1C5 P1C6 P1C7 contribution of the sector to improve the environment capacity of aquaculture to improve environmental monitoring capacity level of social recognition age and historical role of the activity and contribution to the traditional landscape of the area 3 number of workers (direct and indirect) Farm/sector Level Local Level x x National Level x x x percentage of permanent (and seasonal) full time equivalent workers x x x percentage of seasonal workers in aquaculture compared to seasonal workers in tourism x x x conflicts and opportunities with other activities and uses x x x recycling rate of by-product x x x existence of subsidies for aquaculture ecologic services x x x number of reports on environmental crises in five years x x x participation rate to the socio-professional political organizations and in local assemblies x x x x x 21 Prepared by the GFCM-CAQ Working Group on Sustainability in Aquaculture (WGSA)
66 DGo/ PRINCIPLE 2: Promote participation in decision making process 57 Code Criteria N o Indicators P2C1 level of understanding in the industry 11 P2C2 P2C3 P2C4 P2C5 existence of control systems level of participation level of decentralization of decisionmaking level of management and regional planning Farm/sector Level Local Level National Level percentage of fish-farmers and technicians who know the regulations x x 12 number of control officers x x 13 percentage of fish-farmers in breach of the law x x 14 number of participants at consultative meetings x x 15 number of new co-constructed measures x x 16 number of fish-farmers taking part in consultative bodies x x 17 number of conflicts solved at local level number of conflicts due to contradictions between traditional and constitutional legislation number of authorizations granted compared to the number of requests x x 20 number of new sites created 21 existence of ICZM plan for coastal areas, including aquaculture under head state authority, taking into account the future evolution of industry. x x x x x x x x DGo/ PRINCIPLE 3: Strengthen research, information systems and extension services Code Criteria N o Indicators P3C1 P3C2 P3C3 P3C4 importance of research and training in aquaculture level of interaction between research, industry and administration access to aquaculture information systems access to scientific, administrative and technique data existence of research funds Farm/sector Level Local Level National Level existence of bodies in support to aquaculture training x x number of partnership contracts existence of an information system x x x x existence of extension and dissemination services x x x x
67 DGo/ PRINCIPLE 4: Strengthen institutional capacities in relation with sustainable development Code Criteria N o Indicators P4C1 P4C2 P4C3 level of national recognition of sustainable development level of involvement of the state in the implementation of sustainable development level of commitment of the state towards the industry Farm/sector Level Local Level National Level existence of a national sustainable development strategy x existence of rules and regulations in favour of sustainable development x rate of state financial aid compared to other sectors x existence of a public plan to support aquaculture development x x number of concessions and license for aquaculture x x 32 existence of competent state services 33 existence of funds allocated for training 34 existence of legal recourses x x x x x x 58
68 4.2 Economic dimension (4 principles, 23 criteria*, 55 indicators* 22 ) DEc/ PRINCIPLE 1: Strengthen consumer responsive and market oriented aquaculture 59 Code Criteria N o Farm Indicators Level 1* existence of own-label (y/n and %)* use of branding or quality assurance x P1C1* schemes/labels existence of quality certification schemes 2 (independent bodies) (y/n and %) x P1C2 traceable products 3 existence of a traceability system 4 percentage of value-added products x P1C3 level of value enhancement 5 price differential with respect to quality (y/n) x availability of processing capacity for the P1C4 processing capacity 6 sector x 7 company customer surveys x P1C5 level of knowledge management 8 sector market studies x x 9 existence of company marketing plan x P1C6 level of market promotion activities 10 marketing costs/total revenue x x Sector Level National Level DEc/ PRINCIPLE 2: Strengthen risk assessment and crisis management capabilities Code Criteria N o Indicators Farm Level Sector Level National Level 11 number of products (i.e. species, size categories, value-added)* x P2C1 level of diversification 12 integration of core business with complementary activities (eco-tourism, recreational fishing, restaurant) x 13 geographic market diversification (number and % share of each market of total sales) x 14 share of each customer in total sales x 22 * 1 criteria and 3 indicators were added in the Turkish pilot study
69 DEc/ PRINCIPLE 1: Strengthen consumer responsive and market oriented aquaculture Code Criteria N o Indicators P2C2 P2C3 P2C4 P2C5 level of input self-sufficiency capability to monitor and challenge pathological hazards increased research & development capabilities and innovation level of property rights over production sites Farm Level Sector Level National Level number of national feed suppliers (also % imported) x number of national hatcheries (also % of fry imported) x 17 existence of biosecurity system x x 18 existence of legislation on biological waste disposal x 19 existence of farm health management system (including vaccination program) x 20 ratio of R&D expenditure/total sales 21 ratio of national expenditure on R&D/GDP 22 duration of lease of the site 23 no. of site lease renewals per year 24 existence of national legislation for zoning x x x x x 25 existence of national emergency funds (natural disasters) x 60 P2C6 level of awareness of natural hazards 26 ratio of insurance costs/total sales x 27 existence of legislation for monitoring of environmental parameters x 28 use of ISO (or other certified system) x P2C7 level of market maturity 29 existence of producer's organizations or cooperatives for sales x 30 supply and sales by contract or by market x
70 DEc/ PRINCIPLE 3: Strengthen financial management of enterprises Code Criteria N o Farm Indicators Level gross profit margin (gross profit/revenue 31 P3C1 level of profitability x100)* x 32 rate of return on farm assets x Sector Level National Level 61 P3C2 P3C3 P3C4 level of input efficiency level of financial strength level of environmental protection costs P3C5 ease of entry into industry feed cost/kg fish produced (and % of total cost/kg) x 34 fry cost/kg (and % of total cost/kg) x 35 labour cost/kg fish produced (and % of total cost/kg) x unit production cost (total variable and fixed costs/kg fish produced/operating costs) (excage) energy cost/kg fish produced (and % of total cost/kg) x 38 transportation cost/kg (and % of total cost/kg) x 39 financial costs/kg fish produced (and % of total cost/kg) x current ratio (total current farm assets/total current farm liabilities) x debt/asset ratio (total farm liabilities/total farm assets) x debt/equity ratio (total farm liabilities/total farm equity) environmental monitoring costs/kg fish produced (and as % of total cost/kg) x capital investments for environmental protection/kg (and as % of total cost/kg) x existence of incentives, direct or indirect, for environmental protection actions x existence of national mechanism supporting start-ups (tax-break, subsidies, financing) x x x
71 DEc/ PRINCIPLE 4: Strengthen the role of professional organizations for the economic sustainability of aquaculture 62 Code Criteria N o Indicators P4C1 P4C2 P4C3 P4C4 level of knowledge management level of collective marketing and actions promotion of training and awareness building increased capability for crisis management Farm Level Sector Level National Level 47 sector market studies x x 48 market data dissemination (annual seminars by federations or authorities) x x % of annual national federations (producer s organizations) budget allocated to marketing and promotion annual national budget allocated for marketing and promotion of the sector x existence of a permanent information/communication program at sector level existence of training program for sector employees on financial aspects of activity x existence of training program for sector employees on environmental aspects of activity 54 existence of emergency funds x 55 existence of crisis management manual (strategy) x x x x x
72 4.3 Social dimension (3 principles, 13 criteria, 18 indicators) DSo/ PRINCIPLE 1: Contribute to food security and healthy nutritional needs Code Criteria N o Indicators P1C1 importance of fish availability 1 annual production P1C2 P1C3 accessibility for local consumers commitment to and type of quality-based approach adopted by the farms quantity of fish produced for domestic markets (self-consumption) and apparent consumption Farm/sector Level Local Level x x National Level fish price compared with the national minimum wage x x percentage of innovative products proposed each year x x DSo/ PRINCIPLE 2: Strengthen the role of the Producer Organizations and NGO s to improve image of aquaculture, social awareness and responsibilities x x 63 Code Criteria N o Indicators P2C1 average salary levels P2C2 level of qualification 6 P2C3 P2C4 P2C5 importance of fish farmer organizations image of aquaculture 5 Farm/sector Level Local Level National Level minimum wage of employees compared to national minimum wage x x percentage of fish-farmers with specialized aquaculture training and certificate x x 7 number of professional associations x x 8 existence of a professional status x 9 existence of ecolabels and product specifications x capacity to take part in decision-making 10 effective participation to decision making process x x
73 DSo/ PRINCIPLE 3: Strengthen corporate social responsibility Code Criteria N o Indicators P3C1 P3C2 P3C3 working conditions (hours and security) level of protection and participation to trade union women s access to the industry, including salary level P3C4 access to information 15 P3C4 fish welfare 11 number of monthly hours currently worked by aquaculture workers 12 number of occupational accidents percentage of trade union members among workers percentage of women fish-farmers existence and importance of interprofessional organizations 16 unmarketable fish ratio 17 number of declared pathologies 18 percentage of premium quality fish Farm/sector Level Local Level National Level x x x x x x x x x x x x x Environmental dimension (3 principles, 14 criteria, 53 indicators) DEn/ PRINCIPLE 1: Minimizing the global impact of aquaculture Code Criteria N o Indicators P1C1 needs of natural resource (pelagic fish and vegetables) 1 food conversion ratio (kg food/kg fish) 2 demand of pelagic fish (tonnes/year) 3 demand of vegetable products (t/year) Farm/sector Level Local Level National Level 4 footprint index (Hc) P1C2 consume of energy 5 life-cycle assessment (formula) 6 tropic level of production (index) P1C3 alien species 7 number of introduced species (n) P1C4 capture-based aquaculture 8 capture versus quota (tonnes/year)
74 DEn/ PRINCIPLE 2: Respect the ecological service of ecosystem Code Criteria N o Indicators 9 turbidity/transparency (Secchi disk) Farm/sector Level Local Level National Level P2C1 water quality 10 microbiological indicators (total coliform) 11 algae bloom (n. cells / ml) 12 loss of nursery and spawning grounds (yes / no) recruitment index and spawning stock biomass) P2C2 fisheries and nursery areas 13 capture modification of target species in the area (monitoring fisheries activities) 14 increase the fishing activities around the farm cages (landing and biomass index) 15 presence of hatchery with native brood stocks (yes/no) 16 monitoring the quality of the fish larvae produced P2C3 carrying/holding capacity of the ecosystem 17 n/a 18 hydrodynamic (cm /s) 65 P2C4 oceanographic conditions 19 depth (m) 20 interchange with open sea (offshore) (distance in m) 21 percentage of the used space (%) 22 volume of water occupied per kg of product (kg / m 3 ) P2C5 trophic conditions 23 oxygen saturation (%) 24 relationship between exogenous and endogenous nutrients DEn/ PRINCIPLE 3: Minimizing the local impact on environmental conditions and biodiversity Code Criteria N o Indicators Farm/sector Level Local Level National Level 25 faeces sedimentation rates (g/day) P3C1 P3C2 input of organic and inorganic wastes use of chemical products and drugs 26 lost food versus total (%) 27 nutrient balance (kg) 28 kg of antibiotics per tonne fish (kg) 29 antifouling use (y /n) 30 kg of anti-parasites per tonne fish (kg) 31 kg of disinfectant per tonne fish (kg) 32 use of food with chemical antioxidants (y/n) 33 kg of antibiotics per tonne fish (kg)
75 Code Criteria N o Indicators P3C3 impact on benthic habitat and communities 34 redox potential and ph (ph) 35 total P (kg) 36 sediment structure (%) 37 heavy metal accumulation (micrograms) 38 benthic community structure modification (benthic index) Farm/sector Level Local Level National Level 39 total organic carbon (TOC, mg/m 2 ) 40 level of degradation of sensitive habitats (monitoring) 41 turbidity (Secchi disk cm) 42 total particulate organic matter (mg/m 3 ) 43 total dissolved organic matter (mg/m 3 )) P3C4 impact on pelagic habitat and communities 44 chlorophyll (mg/m 3 ) 45 zooplankton biomass (mg/m 3 ) 46 aggregation of pelagic fish (ind/m 2 ) 47 escapees (ind) use of non indigenous species (y/n) 49 use of GMO species (y/n) P3C5 genetic impact 50 level of spawning 51 use of native broodstocks (y/n) 52 escapees (numbers) P3C6 disease spread from farms 53 presence of pathogens from farm pathogens (y/n)
76 5. BIBLIOGRAPHIC REFERENCES AND DATABASE ON INDICATORS FOR THE SUSTAINABLE DEVELOPMENT OF MEDITERRANEAN AQUACULTURE Introduction The activities of the WGSA and the WGSC enabled the collection of a large amount of information from bibliographic references been used for the realisation of two databases, InDAM-db and SHoCMed-db. The first database, InDAM-db, created within the framework of the InDAM Project Indicators for sustainable development of aquaculture and guidelines for their use in the Mediterranean, stores the most significant scientific documents on indicators of sustainable aquaculture. An annotated selected bibliography on the same topics was also prepared. The second database, SHoCMed-db, created in the framework of the SHoCMed project ( Developing site selection and carrying capacity for Mediterranean aquaculture ), is restricted to the Environmental dimension of the InDAM-db, with more fields and detailed information on site selection and carrying capacity of aquaculture activities. 5.2 Methodology Design and development of a databank InDAM - SHoCMed A databank was designed by the GFCM Secretariat, and prepared by referring to the most significant scientific literature, collecting and compiling the information from various sources (documents and projects). Data were organized according to the four dimensions of sustainable aquaculture (Governance, Economic, Social and Environmental), referring to the most important scientific literature of the last 10 years and to the most relevant scientific issues on the subject. The process was developed in two steps: The first step was to collect the most important scientific literature on the InDAM and SHoCMed topics. References were searched in the database: ASFA (Aquatic Sciences and Fisheries Abstracts), ABAFR (Aquatic Biology, Aquaculture & Fisheries Resources) and through the search engines Google and Google Scholar and selected according to the content of the abstract/article. The list of references is reported as Annex 7. List of key words and queries used for searching references: - indicator, sustainable, aquaculture; - indicator, aquaculture, med; - indicator, aquaculture, economics. References were also collected from the reference list in reviews and/or key publications. The selected references were inserted as records in MS-ACCESS, a new multi-use data access into Structure Query Language server environment, divided into fields, containing the following information: - Title - Author - Year - Publication type - Source - Abstract - Issue (keywords from the ASFA thesaurus and term list) - Cultured species (scientific and common name) - Group of species 23 prepared by F. Salucci, GFCM Secretariat 67
77 - Structure of culture (cages, ponds, raceways, hatchery, etc.) - Country - Geographical Area - GSA (Geographical Sub-Areas) - Indicators. In the InDAM-db the field of indicators were divided into the four dimensions of sustainability: - Governance - Economics - Social - Environmental. The field of environmental indicators forms the SHoCMed-db, with the addition of the following information/fields: - Oxygen - Turbidity - Nutrient - Sediment Organic Matter - Macrofauna - Redox Potential - Sediment. It also provides data, if available, relating to standards and reference points for each parameter considered Designing and implementing a web search engine 24 During the preliminary phase of the development process, a thorough analysis concerning the User Interface and the features to be included has been undertaken (Figure 1). As a result, a UI mock-up has been realised using the program Balsamic Mockups. The web application being referred was intended to provide the user with an accurate search engine for the reference/bibliographic data collected. Following the development of the core features, a complete beta-testing phase has been run in order to apply the necessary optimisations. User Interface and Usability have been improved while taking in consideration the items emerged during the Beta-Testing phase. 24 The database was developed in collaboration with F. De Rossi, R. Emma, N. Milone and V. Zeuli (GFCM Secretariat, AdriaMed Project) 68

78 Figure 1 InDAM-db: draft search page 5.3 Outputs The InDAM databank 239 records were inserted in the InDAM databank, divided into the four dimensions of sustainability: - Governance (31 records) - Economics (24 records) - Social (32 records) - Environmental (231 records). Each record can provide information on more than one dimension. Figure 3 shows an example of the information reported for each record. The main indicators used for the analysis and description of each dimension of sustainability are reported in Table 1.The indicators are not to be considered as final. They can be subject to modifications and/or other indicators can be added in the future. Some of the 231 records reported in the InDAM-db environmental dimension were inserted in the SHoCMed-db, and represent a starting test with different functional characters to be futher implemented. 69
79 Table 26 Indicators of aquaculture sustainability within the 4 dimensions Governance Indicators Territorial integration Performance indicator Governmental policy recommendations Aquaculture policy, administration, legislation Management actions Economic Indicators Market Price Risk assessment Supply vs demand Capacity Efficiency Social Indicators Worker safety Social acceptability Job availability Consensus building Compensation rates benefits Eating habits Environmental Indicators Benthos Nutrients Posidonia oceanica Oxygen Genetic structure Plankton Mortality Biomass Environment Impact Assessment (EIA) Stock dynamics Chlorophyll Ammonium Suspended solids The InDAM database (InDAM-db) The InDAM-db can be accessed through the InDAM web page 25 which describes InDAM activities, and is been continuously updated to help users to find related and useful information on Sustainability on Mediterranean Aquaculture (Figure 2). The result of this project was the creation of InDAM-db, a database on the Indicators for sustainable development of aquaculture and guidelines for their use in the Mediterranean. It is possible to search references for: Sustainability dimension (Governance, Social, Economic, Environmental), Cultured species and related Structure of culture (cages, ponds, raceways, hatchery, etc.), Country, GSA (Geographical Sub-Areas), Bibliographical Indicators (Figure 3 and 4)
80 Figure 2 The InDAM databank 71
81 Figure 2 (cont.d) 72

")
82 Figure 3 InDAM webpage Figure 4 The InDAM database (InDAM-db) layout 73
83 74
84 Annex 1 Key issue and some postulates concerning the use of indicators for sustainable development: the example of aquaculture Syndhia Mathé*, Hélène Rey-Valette* and Eduardo Chia# *Montpellier 1 University, #INRA-Cirad 1. Introduction Following the numerous studies on the effects of sustainable development, interest is now focusing on its appropriation, in particular as regards governance of sustainable development. After having addressed scientific conditions for the elaboration of indicators for sustainable development, current studies now deal with the use of these indicators, their informative and normative nature, as well as their contribution to learning processes related to the appropriation of sustainable development (Rey- Valette et al., 2007). The objectives of this document are to illustrate the importance of learning and governance systems and processes for the appropriation of sustainable development. Example is given of a research project on the elaboration of a set of indicators on sustainability of aquaculture systems. The document addresses the elaboration and use of indicators, analyses the profusion of reference systems and of initiatives to elaborate sustainable development indicators for aquaculture, discusses the advantage of implementing co-construction, and presents 4 postulates related to conditions of and modalities of sustainable development appropriation. 2. «Construction» and use of indicators for sustainable development The concept of sustainable development has become an essential reference, which concerns all public policies, and which is becoming increasingly assimilated by actors and firms. At the same time, a profusion of institutional initiatives were implemented by international organizations in order to set up indicators for sustainable development, by means of working groups made of experts. This abundance of initiatives and associated lists will grow while studies at national, regional, as well as sectoral or local scales are multiplying. These applications will provide a diversity of approaches, in particular in the context of local Agendas 21 or urban ecology charters. These different approaches of sustainable development relay on the elaboration of reference systems or sustainable development indicators or sometimes both. The use of indicators may be carried out with either composite indicators or a set of indicators. Composite indicators provide a synthetic view of sustainability, however they are subjective. Moreover, because they are synthetic, there may be the disadvantage of losing information. The elaboration of sets of indicators is more common, however the excess of information could prevent from having a global vision. Reducing the number of indicators is sound; however the question of providing an optimal list of indicators is widely discussed and appears as a scientific mirage. These remarks underline the complex problem of the use of indicators. It is complex, as it depends on the diversity of exerted functions, in a more or less simultaneous manner, in response to several generic types of requests: coordination, communication, crisis management, warning, monitoring of conditions and pressures, evaluation of reaction capacities, etc. The indicator is also used to generate a problem or an issue, and thus has a summarising function which is fulfilled by indicators elaborated on the basis of pillars of sustainability. 75
85 Initially, indicators are especially designed according to sustainable development pillars (Environmental, Economic, Social, and then Institutional pillars), based on a relatively exhaustive approach. Nowadays, interactions occurring between pillars are favoured by considering key issues, thus enabling to account for the values and priorities of relevant populations. The indicator will act as a mediation tool towards other audiences. It is possible to assume that the use of indicators may be considered as a problem of supply and demand. Consequently, this relationship can be examined from two points of view (Rey-Valette et al., 2007): From demand to supply: in a rather procedural logic, by considering various questions that groups of actors and decision makers may ask, in order to provide the most appropriate indicators (according to available knowledge and data as well as needs identified beforehand). This logic involves all questions related to indicator social demand, types of actors, users and needs, as well as governance methods, etc. From supply to demand: in a rather normative logic, by considering representations (models) available or under development, and by considering that indicators are the parameters of these models (or a limited number of simple functions of these parameters, for example current points of reference). This dimension of the question corresponds to a set of more technical research issues, for which knowledge has to be quantified, and which refers to a set of questions related to quantification; thus, satisfying the demand often appears as a secondary issue. Most experiences underline the lack of expression of sustainable development indicator demand. Users are unaware of the products which can be provided by scientists; this restricts the expression of their needs, particularly when new types of information are involved. Therefore, in most cases it is the supply which creates the demand. Crisis management situations represent a favourable opportunity for expressing a demand, which is then generally targeted. Most papers concerning these questions point out that the plurality of actors formulating the demand complicate the elaboration of a common integrated representation. Difficulties related to knowledge plurality, and to the diversity of media and knowledge access routes, should be taken into account. The co-elaboration, participative approach and research-action may also lead to developing an indicator based on a consensus or coordination between the supply and demand. Associating or comparing indicators proposed by researchers and other co-products based on a process shared by researchers and actors, is a common practice; this leads to approaches aiming to combine the respective advantages of both types of logics that can be considered as mixed (top-down and bottomup) in order to take into account the fact that generic models (representations) must be adapted to local specificities (Chamaret et al., 2007). Furthermore, elaborating and evaluating indicators becomes an increasingly complex and difficult task. Thus, the indicator may contribute to creating a speech, making a policy operational, and enable to assess / justify public policies, and even become a manipulation tool. Reflections about the social role played by indicators lead to considering indicators as a tool for government policies, which is necessarily related to the development of these policies. Initially, indicator supply is taken over by the government and the great supranational institutions: indicators are a government attribute and a way for expressing its power as well as being a management tool for its policies. 3. The abundance of reference systems and initiatives in aquaculture Several recommendations, suggestions, codes of conduct were issued to promote the implementation of sustainable development principles as new reference system. A reference system is defined as being able to report on public policy as societal intellectual production of common images that contributes to the evolution of social and ideological representations and as analysis tool of the mediation processes between global society and its components (Faure et al., 1995). Several forms of reference systems coexist and are reported here specifically for aquaculture. First initiated by Reference International Institutions, actions generalised following diverse approaches. 76
86 The analysis of the reference systems for aquaculture (Mathé et al., 2006) allows classifying the approaches according to 2 criteria: degree of constraint and decentralisation of decisions. Together with the reference systems, various initiatives to elaborate sustainable development indicators were undertaken. Numerous simple, composites, sectorial or territorial sustainable indicators were therefore created and more or less used. From the operational point of view, the variety of indicators is rather a constraint, as it does not provide a synthetic enough overview for the actors to understand and use. Yet, the principles of indicators parsimony and of stakeholder s participation in the definition of indicators condition the efficiency of any information system. Indeed, according to Boulanger (2006), the legitimacy of an indicator that measures an evolution towards a political objective depends on the definition of that objective through a transparent and democratic procedure that allows for participation. Along the same line, Gadrey and Jany-Catrice (2005) underline that an indicator is likely to eventually become the keystone of a sustainable and unprescribed convention if it is transparent (values, criteria, sources, methods) and if it can generate variants that can be discussed beyond the narrow circle of its designers. Thirty-two reference systems for sustainable development of aquaculture were studied 26. An evaluation grid was designed to compare their adaptation to conditions and principles of sustainable development. The criteria chosen to evaluate the indicators partly correspond to those proposed by Gadrey and Janey-Catrice (2005), in particular as regards the institutional origin, application scales, types of approach, forms of participation and completeness of dimensions seized (Table 1). Information on reference systems and experiences carried out was analyzed at meta data level. Qualitative analysis of each criterion was made along 3 modalities that correspond to increasing agreement with sustainable development. Table 1 Analysis grid for reference systems claiming to be in line with sustainable development of aquaculture Topics Type of institution originating the approach Type of approach Action mode Topic of the reference system Participating stakeholders Participation mode of stakeholders Level of application 1 Environment 2 Socio-economics 3 3 dimensions 1 Institution or international community 2 Institution or national organism, regional networks 3 Institutions, local organisms (OP) or organizations 1 Normative 2 Procedures 3 Normative and procedures 1 Centralised initiative (Government or central institution) 2 Decentralised initiative with low level of constraint 3 Decentralised initiative with high level of constraint 1 Production factors (real, work...) 2 Production (marketing, price ) 3 Both 1 Scientific (or institutional) 2 Scientific and producers 3 Scientific and stakeholders 1 Consultation 2 Survey 3 Dialogue 1 by Sector 2 Territorial 3 Both 26 This research was carried out within the Project «Évaluation de la Durabilité des Systèmes Aquacoles» (EVAD), funded by the ANR in the framework of the French Programme Fédérateur Agriculture et Développement Durable 77
87 This analysis allowed scoring the reference systems for each criterion to identify the field that needs to be to be strengthened and calculating a global score without weighting the scores. It was then possible to calculate annual averages for the global score to analyze the qualitative temporal trend and identify a possible learning effect (Figure 1). Figure 1 Evolution of average annual scores of reference systems claiming to be in line with sustainable development of aquaculture Vanguard initiative carried out by researchers in collaboration with producers Normative Procedural Atypical initiative on sustainable food The analysis of the reference systems trend shows a global increase of the scores between 1991 and 2006 (from 13 to 20 with a maximum of 24). Specific trajectories according to the types of approaches show a higher scoring for procedures (iterative and adaptive as defined by Clément and Madec, 2006). The trend shows that reference systems increasingly take into account the multidimensional and complex feature of sustainable development, in particular social and territorial aspects. However, despite this conceptual improvement in the approaches, it is to be underlined that the durability and efficiency of sustainable aquaculture, as well as the use of indicators for monitoring are weak. This highlights a need of appropriation and professionalism of the approaches. 4. Inventory of conditions and procedures for the appropriation of sustainable development According to Aggeri et al. (2005), there are 3 ways of adopting sustainable development: (i) (ii) (iii) coercion when change is imposed by a hierarchical authority, mimetism pertaining to an endogen process, and professionalism related to internal voluntary process of a community and that depends on its structure and professional cohesion. Sustainable development, as reference and value system, implies a gradual change, on the way thanks to an infinite number of small changes, on the margins of the system and following percolation logic (Loinger, 2006) that should come along with translating process to make the appropriation easier (Rudlof, 2006). New knowledge should have a certain familiarity with common knowledge. This notion of familiarity takes back to gradual learning advocated by Droz and Lavigne (2006) as translating mode that they describe as specification. It is a qualitative adjustment of norms to particular cases; this approach seems the most appropriate to sustainable development. These statements testify that the implementation of sustainable development should be thought of as a 78
88 hybridizing process with the co-construction of durability indicators. For professionalism sake (type (iii) mentioned above) advocated by Aggeri et al. (2005) and without substituting for stakeholders, it would be relevant to create a framework to facilitate the implementation of co-production situations and collective learning requested for the appropriation of sustainable development. The logic of the process favouring a territorialized approach of sustainable development takes into account the durability of shared objectives that are clearly identified, as well as their contribution to the emerging culture of sustainable development. Four postulates allowing generalizing the conceptualisation and the logic of co-construction of indicators for sustainable development through recommendations for the appropriation of sustainable development were considered. POSTULATE 1: An indicator is not just a measuring tool The driving force of the approach suggested here is to integrate the multiple functions of the indicators which are the key tools of any evaluation approach in sustainable development. These indicators give the situation (state) or the trend of a variable. Hence, they are traditionally considered as a measuring tool. However, looking at the definition of an indicator shows that all indicators also fulfil an inventory function, highlighting the variable, amongst other possibilities, that must be monitored. It establishes priorities between variables and identifies models or representations of the important factors to be taken into consideration. The history of statistical systems (such as the development of national accounts) is a reminder that the choice of indicators is the result of negotiations between actors. The fact that these indicators can become promotional tools in the hands of certain lobbies through strategic communication approaches should also be noted. Once selected, an indicator becomes the standard which symbolically determines positive and negative situations thereby designating the guilty and the innocent. It then becomes the signal that may lead to penalties for situations which, beyond some threshold, are considered negative. Taken together these functions imply that an indicator system may be considered not only as a technical but also as a social arrangement, which reflects a social structure and a compromise at a given time. If the diversity of the indicators functions is taken into account: controversies between actors around the standard that these indicators define can be better understood and managed, opportunities to re-discuss and further agree on standards can be taken, multiple constraints related to information, whether its access or presentation, that determine their dissemination and their use can be integrated. POSTULATE 2: As implementing sustainable development is an innovative process, it is based on organizational learning and a specific joint approach. The implementation of sustainable development implies profound changes in production and consumption methods, in ways of thinking and in the objectives to be achieved. A new way of representing society is being developed and therefore a new frame of reference must be adopted. Innovations originate from learning processes which differ according to the nature of these innovations. Argyris and Schön (1996) in their book on organisational learning distinguish between simple changes related to practices or actions (single loop learning) and those which involve changes to the fundamental rules and norms underlying action and behaviour (double loop learning). This distinction is useful to highlight the specific pace and needs of the double loop learning process. The changes in values brought about by sustainable development imply a development of the profession which concerns not only the way of working but also the objectives and the image of the activity. For the indicators of sustainable aquaculture development produced by the approach to be adopted and used by the actors, the working methods and the forms of relationships between actors must be adapted to take into account the significant changes introduced by sustainable development. These changes also imply new coordination arrangements and a wider range of stakeholders. It is therefore important to promote openness and participation as a broader range of stakeholders increases the 79
89 multiplicity of representations and, in order to facilitate their convergence, requires that the implicit reference frameworks adopted by the actors be transparent. This process may be a strategic opportunity facilitating change in the relationships between actors and their relative strengths. Generally speaking, professionals who are already committed to quality schemes such as AFNOR or ISO are more likely to think of indicators as norms and therefore to extend this type of approach to new variables expressing sustainability. Small-scale operators are more suspicious of norms and have a more inward-looking approach seeking primarily to use indicators as internal management tools for their farming. Broadening the debate to all the dimensions of sustainable development (environmental, economic, social and institutional) has always been a new approach for producers who have often limited sustainable development to its environmental dimension. The inclusion of the social and institutional dimensions is often a novelty and requires clarification and examples. In Southern countries, professionals are more aware of these aspects but are used to approach them separately through specific programmes (for example the poverty reduction programme). POSTULATE 3: The joint approach to building indicators promotes organizational learning and helps dialogue. It should be recalled that the distinctive innovative nature of sustainable development as a new mode of production implies a learning process to build a new related reference framework and related norms. This learning process requires a reflexivity process between actors. By reflexivity, we mean here the fact that actors learn from the action from the moment that they are able to view it in perspective and draw some lessons. These conditions require the organized participation of actors, for example through a joint approach. Many evaluations of sustainable development indicators stress the role of dialogue support and of mediation in the collective development of these indicators. In some cases, this property is in fact the main objective being sought. Indeed, the technical debate about the criteria for, and indicators of, sustainability naturally leads to in-depth discussions about the objectives and the content of sustainable development. The joint approach to building indicators can then constitute a deliberative and participatory construction system (Rudlof, 2006) where the lists of indicators are not only end-products of information systems but also "intermediate objects" 27 (Vinck, 2000) used to define a reference framework and a common project for sustainable development, in the sense that they are progressively created and that they promote dialogue. Any joint approach to building indicators implies a break from the expert opinion approach, where science defines the lines of action or from the hierarchical approach, where institutional authorities impose a procedure. On the contrary, the aim is to implement an approach based on the sharing of information, knowledge and points of view. The joint approach to building indicators for sustainable development is a shared approach based on several conditions: to create a discussion mechanism bringing together several categories of key actors (researchers, producers and producer groups, administrators - managers, NGOs, associations, consumers and other resource users); to include the future users of indicators as much as possible and more generally the stakeholders in various ways (depending on the phase) in order to compare different opinions according to the type of actor or the different scales (national, regional or local); to organize the dialogue phases using various methods (surveys, interviews, focus groups, role-play, participatory multi-criteria techniques, etc.) in order to create suitable conditions for dialogue and mutual learning. 27 This notion originates from work on the sociology of science and innovation. It conveys the idea of a collective process in building objects which promotes the learning process within a group. The main function of an intermediate object is thus to facilitate exchanges between actors and to shape the dynamics of the collective action. Hence, a table, a list of indicators, a plan, a map, a diagram might constitute intermediate objects during the joint-building process as they can be used to specify and define objectives or rules for the group, i.e. they can help to create sense. In this way, an intermediate object may be a significant component within a management or governance mechanism. 80
90 The most elaborate form of joint-building approach implies a shared vision of issues resulting from a discussion and mediation process between the actors. POSTULATE 4: The joint-building approach is an opportunity and often generates organisational innovation. The joint approach to building a system of sustainable development indicators is a way to create new standards in a decentralised way within a group of actors. It is no longer the optimum which is sought but a compromise and this is reached by a dynamic process of progressive adjustment. This type of approach where practices which are considered to be positive or innovative are institutionalised is more likely to suit the diversity of actors values (Cheron and Ermisse, 2008). They then have an opportunity to communicate their specificities and their constraints and improve the design of the standard. This also provides an opportunity to develop the image of the profession, for example by suggesting codes of behaviour and good practice. Such a pro-active approach to sustainable development can also help to place the industry within more global approaches to sustainable development implementation, such as national sector based approaches, international ecolabels or local agenda 21 strategies. However, the implementation of these positive outlooks depends on the evolution of governance systems. Hence, the proximity between actors which has developed progressively during the joint process can be institutionalized within a system or an institution (organisational and institutional innovation). However, in order to achieve this it is necessary that: the pioneering group have legitimacy with respect to the entire group of actors as well as the appropriate skills and resources, the professional organizations, whether associations or regional in nature, must have sufficient institutional capacity (notion of empowerment ). The fact that the suggested approach takes into account not only the sustainability of aquaculture systems but also the evaluation of their contribution to local sustainable development is of interest in several ways. It provides producers and professional groups with pro-active approaches as well as the means for dialogue with local managers. Moreover, it also provides a means to communicate about the positive outcomes of the activity. In this way, this approach constitutes a facilitating element for the inclusion of the activity into integrated management systems and local planning. In any case, the mere fact of putting into place a group working jointly to produce principles, criteria and indicators and the accompanying learning process that it implies, helps to structure and institutionalize this system. This is an essential contribution to stronger governance and sustainable development. The recommended local-global linkage of the Bellagio principles rejects any fractal or homothetic method of operation preferring the local application of the common principles established by the Rio convention in This local focus in response to specific challenges is favoured over an automatic application regardless of the place and over the use of fixed standards whether international, national or related to the certification approach. 5. Conclusion: towards the use of indicators by the sector Learning and appropriation processes of sustainable development appear to be endogenous to a group (of variable size) and/or a territory (at variable scales). However, for comparison sake, there is a need of common indicators at larger scales, requesting convergence approaches. This can be achieved a posteriori, according to comparison needs and through a gradual mimetic reconciliation. This process can be strengthened by going to consultants and experts who share the same vision of sustainable development. Convergence could also be sought a priori and following the professionalism logic as defined by Aggeri et al. (2005). In this case, the implementation is supported by guidelines providing a set of references from which the stakeholders select and choose the most appropriate to the issues they deal 81
91 with. Therefore, not only know-how should be transformed, but this should be done consistently with communication so as to inform on what is carried out and hence gradually broaden the application field of new standards. This approach represents a break with respect to traditional scientific experience, as it favours an inductive approach. Comparison and harmonization of local approaches show a hybridising process occurring at a larger scale and where local approaches are spreading. 6. References Aggeri, F., Pezet, E., Abrassart, C. and Acquier, A Organiser le développement durable. Expériences des entreprises pionnières et formation de règles d action collective. Vuibert Ademe ed. Paris, 278 p. Argyris, C. et Schön, D.A Apprentissage organisationnel. Théorie, méthode, pratiques. DeBoeck Univ. Ed. Paris, 380 p. (French version of the 1996 paper) Benhayoum, G., Lazzeri, Y. et Mousiter, E., Elaboration d un référentiel d indicateurs territoraiaux de développement durable. In les indicateurs territoriaux de développement durable. Questionnements et expériences. Lazzari Y. ed. Sci. L Harmattan Ed., Paris : Boulanger, P.-M., Political uses of social indicators : overview and application to sustainable development indicators. International Journal of Sustainable Development. 10: Chamaret A., O Connor M., Récoché G., Top-down/Bottom-up approach for developing sustainable development indicators for mining: application to the Arlit uranium mines. International Journal of Sustainable Development. 10: Cheron and Ermisse, Repères sur l évaluation au regard du développement durable. Ateliers de l Observatoire 28 juin - 20 décembre Observatoire national des Agendas 21 Locaux et des pratiques territoriales du développement durable. Les Cahiers de l Observatoire N 2, Octobre 2008, 84 p. Clément O. et Madec P Un outil pour la construction d indicateurs de développement durable : la méthode Delphi. Une expérience en aquaculture. Natures, Sciences, Sociétés.14 : Faure, A., Pollet, G. et Warin, Ph., La construction du sens dans les politiques publiques. Débats autour d la notion de référentiel. L Harmattan Ed., Paris, Coll. Logiques politiques, 192 p. Gadrey, J. et Jany-Catrice, F., Les nouveaux indicateurs de richesse. La Découverte Ed., Paris Coll. Repères. Girardin, Ph. et Rosnoblet, J., Analyse de 15 ans de méthodes d évaluation de la durabilité agricole. Bilan des travaux de l équipe INRA Colmar, Projet INRA ADD Impacts. Document de travail Inra Colmar, 11 p. Godard, O., Hubert, B., Le développement durable et la recherche scientifique à l INRA. Rapport à Mme La Directrice Générale de l INRA, 58 p. Goxe, A. et Rousseau, S., L empreinte écologique: nouvel indicateur, ancienne approche? Mise en perspective et analyse territoriale de l empreinte écologique. In Les indicateurs territoriaux de développement durable. Questionnements et expériences. Lazzeri Ed. Sci. L Harmattan Ed. Paris, Lazzeri, Y., Les indicateurs territoriaux de développement durable. Questionnements et expériences. L Harmattan, 323 p. Loinger, G., Leçons des expériences récentes d élaboration d indicateurs territorialisés du développement durable dans le champ de la gouvernance locale. In La dynamique de l évaluation face au développement durable. Offredi C. Ed. Sci. L Harmattan Sté Française d évaluation: Mathé, S., Brunel, O., Rey-Valette, H. et Clément, O Recensement des initiatives en faveur de la durabilité de l aquaculture. Rapport CEP/UICN, 80 p. Prabu, R., Colfer, C. et Dudley, R., Directives pour le développement, le test et la sélection de critères et indicateurs pour une gestion durable des forêts. Cirad Ed, Montpellier, 158 p. Rey-Valette, H., Laloë, F et Le Fur, J., Introduction to the key issue concerning the use of sustainable development indicators. International Journal of Sustainable Development, 10:
92 Rudlof, F Indicateurs de développement durable et processus de modernisation. In Les indicateurs territoriaux de développement durable. Questionnements et expériences. Lazzeri Ed. Sci. L Harmattan Ed., Paris, Vinck, D., Approches sociologiques de la cognition et prise en compte des objets intermédiaires. 7 école d été de l ArCo Bons, France, juillet 2000, 24 p. 83
93 Annex 2 Aquaculture sustainable development and governance system Eduardo Chia*, Hélène Rey-Valette # and Syndhia Mathé # *INRA-Cirad, # Montpellier 1 University 1. Introduction - Sustainable development: problems of coordination between actors Taking into account sustainable development objectives and principles involves changing the rules and coordination procedures between actors, in particular within the operation of "institutions" included in local regulation and governance systems. Sustainable development and governance are closely related. Governance methods are defined as a series of devices the organization of which depends not only on rules and subsidiary mechanisms but also on convergences and divergences between representations. Studying these divergences helps to understand the causes, intensity and types of conflicts related to institutional changes due to the introduction of sustainable development. From this point, the implementation of sustainable development includes a collective action learning dimension based on an increased participation of stakeholders and a greater transparency in collective decision-making, in particular for defining the principles and local issues related to sustainable development. These learning elements partly address the "empowerment" issue. Institutional devices and incentive structures are to be modified for this type of association between private and public actors during the different decision-making stages. This change concerns all of the rules and institutions involved in the regulation process. As a result, if actors implement sustainable development at local and/or sector level, taking into account normative rules at a local scale would be an interesting solution for analyzing the governance process (tools, devices, instruments, and processes) according to the regulatory system structure in which these normative principles are applied. Based on the example of aquaculture farms 28, the construction of an appropriate grid to analyse governance implementation conditions and devices is described. In this respect, within the aim to optain a specific vision of the harmonization of principles, norms and criteria developed by political decision-makers and of the representations of stakeholders and "citizen" actors, the way to take into account actors representations and how these representations change according to contexts, type of actors and, in the case of actors involved in institutional systems, according to the role and position of their own institution in the institutional network (centralized or decentralized administration, producer organizations, Research, NGOs)., are determined. Particular attention will be given to territorial governance by analyzing aquaculture territorial integration procedures based on potential synergies between action routes promoting sustainable aquaculture and the contribution of this activity to territory sustainability. The proposal is to study aquaculture according to Integrated Coastal Zone Management (ICZM). These synergies provide conditions favouring the integration and participation of the aquaculture sector to territorial governance systems and processes, which have been analyzed in this paper. The conclusion will include a discussion about the idea that the development of aquaculture sustainability represents a good opportunity for its territorial integration. This would be possible if this activity can structure the necessary changes of its reference systems at an internal level and its integration in the governance mechanisms at an external level. 28 These aquaculture farms were involved in the Aquaculture System Sustainability Assessment (EVAD) project funded by the Agriculture and Sustainable Development program of the ANR (French National research Agency) between 2005 and
94 2. The conditions for sustainable development implementation: regulatory systems and governance as institutional 2.1. The role of regulatory system and governance analysis in the appropriation of Sustainable Development As sustainable development is a value system, a progressive change process is necessary. As it represents a vision of things and the world, its transposition into operating principles is not obvious and involves an infinite number of small changes at the borders of the system according to a percolation approach (Loinger, 2006). This is the condition of incremental change suggested by North (2005) concerning institutional change. This progressive implementation must be associated to a translation process, as developed in the Sociology of translation, involving the development of correspondences (equivalences/similarities) between distinct realities in aim of constructing common goals (Akrich et al., 2006). This is possible based on a reflexive approach or the position of actors in the justification of their actions. In 1996, Lafferty underlined the need for transforming global constraints and objectives into sectorial and local actions and policies by using a language and general format which can be understood by actors according to general social needs and not to the needs of a particular institution or actor. It is necessary to develop new knowledge for the translation process conditioning appropriation. New knowledge must comply with common knowledge so that it can be easily understood by actors. This determines sustainable development learning and training procedures. The compliance concept is related to a step-by-step learning process based on the creation of hybrid worlds. Sustainable development implementation must therefore be considered both as a "fabricated" hybridization process and as a progressive step-by-step construction process related to different fields. Both processes mutually reinforce each other and appeal to actors as citizens, stakeholders, renewable resource users, consumers, workers, inhabitants, etc., relate. This approach refers to the institutionalization process conditions defined by Aoki (2006) as belief convergence processes generating a dynamic equilibrium which in turn reinforces these beliefs. According to Aoki (2006), as a meta-rule or meta-standard, sustainable development institutionalization involves a specific process due to the fact that meta-rules are difficult to change. These propositions are similar to those developed by Godelier (2002) for explaining the change affecting organizations, i.e. the construction of organisational myths to which agents can refer without questioning the relevance of their actions. These propositions refer both to the property of collective cognitive devices proposed by Favereau (1989) for describing the convention coordination function and to the definition of institutions provided by Aoki (2006) as collective beliefs. These devices are considered as cognitive insofar as they represent knowledge, in particular tacit knowledge. On this account, they facilitate individual action ability and behaviour convergence. Furthermore, these devices are collective in the sense that they are generally based on a collective behaviour framework. This is a procedure knowledge which is constructed collectively based on the accumulation of experiences and which is transferred as common knowledge for society in which it represents a collective good. In order to implement sustainable development, it is necessary for objectives to be defined at a collective level. For this purpose, the general principles of the approach are to be determined on a common basis (in relation to a territory and/or actor group) according to the specific stakes of the intervention scale at which actions have to be implemented. Consequently, sustainable development is obviously related to territory governance and is used as a tool for increasing participation and opening conditions which are co-substantial with the sustainable development logic. Accounting for sustainable development requires re-defining conditions and methods as regards decision-making assistance and assessment (Rey-Valette and Roussel, 2006) in order to rise above the rational trade-off based on a scientific and technocratic logic defined by a superior rational and abstract interest in favour of a general interest currently defined as a compromise between private interests (Calame and Talmant, 1997). In this type of context, governance has to take into account and improve the various points of view and situations while ensuring their interdependence. This involves two conditions (whatever the fields and scales under study): defining a partnership and combining areas and temporalities. Such a stake centralizes the mediation issue and obviously contributes to increasing the range of actors which are involved, interviewed or considered. Thus it appears that the 85
95 familiarization process with the new reference system, which is introduced by sustainable development, is a complex process (Rey-Valette and Chia, 2007) and involves various information, familiarization and institutionalization phases. Analyzing this process requires understanding the actors training and information conditions (human capital), and how they are integrated in social networks (social capital). It also requires understanding the transmission and impacts of normative frameworks and general rules, which depend on regulatory tools and directives and more generally on the epistemic community. It is then necessary to construct an institutional analysis and assessment grid for public policies which can be used for describing the role and situation of these various factors within a systemic logic. In this logic, figure 1 shows a structural representation of regulatory systems which contribute to the governance process analysis. This figure particularly emphasizes on the combination of the various elements and three components are defined: decision process, implementation device(s) and information system. It partly represents the distinction introduced by Institutional Economics between the institutional environment level (formal and informal) defining the rules of the game (standards, representations, formal rules in the decision-making process) and the institutional arrangement level enabling to understand implemented instruments and practices. However, it should be noted that aquaculture regulatory systems are superimposed or linked with other regulatory systems developed in close or more general sectors. In the case of fish farming, the regulatory system is often linked to that of fishing, agriculture, protected marine areas, etc., and to the national or even international regulatory system, including more or less formal dimensions according to fields of study. This analysis grid underlines regulatory measure implementation conditions, in particular the nature, legitimacy and efficiency of institutions which are at the origin or in charge of applying theses measures. Consequently, this grid refers to Ostrom s work (1990) and in particular to the structural representation of the management process ( Institutional Analysis and Development framework (IAD)) applied by Rudd (2004) to fishing management. During the 90s, public policy assessment works have shown that the efficiency and impact of policies and measures depend on the conditions in which they are designed and applied. A management measure is not systematically efficient as its efficiency depends on its adaptation to local conditions and on what institutional arrangement it is based on. The legitimacy of the institution in charge of its implementation and construction process is as relevant as its results regarding efficiency. Consequently, participating in these processes and considering institutional devices in which these policies are designed and managed are key steps in the governance issue. This leads to analyzing the behaviour of groups of actors, their history, how they are mobilized, their organisational and institutional learning abilities, their proximity and familiarity with objects and reference systems. This type of approach is used for taking into account the role played by actors' networks (whether it is structured or not). Actors are located on a given territory and are directly or indirectly involved in the management process whatever their legitimacy. In this aim, the analysis grid schedule focuses on the following points: Morphology of the actors' system: the aim is to identify the actors which are involved and how they are integrated in the decision-making process (rule construction) and in regulatory mechanisms (application and supervision). Actors legitimacy is a decisive factor for applying measures. Interactions between actors dynamics and information. The interactions existing between actors are organized based on agreements, rules and more generally institutional devices. The structure of information transmission (general, technical and strategic information) is partly based on these devices and vice-versa The role of representations in sustainable development appropriation Social representations have a decisive role in regulatory systems. They may act as filters both for constructing and applying regulatory devices. This action depends on the type of governance being implemented as sustainable development requires the implementation of governance structures based on actors participation. This implies a new political partnership between private actors and public authorities. The fact that actors applying measures are not involved in the decision-making process 86
96 generates conflicts at the implementation level due to the potential gap existing between the management measure content and its mode of application. As a result, the choice of actors involved in decision-making is of great importance. In reality, each of them must comply with the common representations of the group which they represent. However, based on general sustainable development reference systems, private and public actors have their own views regarding this concept and a different understanding of the hierarchy of objectives, implementation procedures and possible solutions. The actors participation in decision-making processes is more or less active and gives social representations a significant role as the decision which is to be made will include the transposition of general reference systems resulting from the convergence (more or less significant) of the stakeholders social representations (assessment of constraints, risks, issues, etc.). Moreover, the application of national and local decisions depends on representations and also on the governance system implemented upstream, i.e. at the decision-making level. The speed at which new regulations will be applied and above all make up a new reference system not only depends on their fairness or legitimacy but also on how actors will view them (as action guidelines and as a reference system). For example, some regulations will encounter a certain opposition from agents responsible for their application or implementation insofar as they modify their practices, positions, etc. As a result, defensive routines (Argyris and Schön, 1996) will develop. These behaviours depend on the situation of agents and above all on the representations they have of regulations and their position in the new situation. This underlines the need for understanding the speed at which sustainable development is accepted and implemented and for studying representations that actors have of sustainable development and of its application. We have assumed that the representation analysis will contribute to exploring the relationships and conflicts existing within a regulatory system as well as the adaptation conditions of governance to new sustainable development issues. These relationships and conflicts are a priori expressed at every level, they are diversified and have various and complex origins. Representations are defined as forms of knowledge, which have been socially constructed and shared, with practical designs and which are employed for the construction of a reality shared by a social group (Jodelet, 1989). This definition refers to a form of practical common knowledge allowing actors to act according their personal views of the world. They include opinions, information, beliefs, pictures, etc., i.e. a combination of semantic and cognitive references which are activated in a specific context according to the goals and interests of social actors for communication, understanding and environmental control purposes. Social representations constructed by individuals are shared by more or less large groups and give these groups collective identity cohesion. They represent understanding and interpretation systems for the social environment as well as behaviour assessment systems which are employed for developing reference action models. Particular attention is given to the way sustainable development can increase the territory and social identity of the fish farming sector in its operating areas. This local and territorial sustainable development appropriation process requires specific translation, participation and involvement procedures for the actors (Callon and al., 2001). As noted by Jodelet (1989), the aim is to "create new from old", i.e. modifying representations required for the convergence between actors involves a prior deconstruction phase. The following figure is a brief description of the four-step process which involves specific research issues at each stage. Thus, the first construction phase entails studying existing reference systems, how the sustainable development application initiative is introduced and where (scale and status of the source organization) in the regulatory system, and lastly, what are actors' representations. These different knowledge characteristics and elements can then contribute to developing representations towards sustainable development objectives which will have been discussed and confronted during the first phase. 87
97 Figure 1 Structural organization of regulatory systems Informal Institutional Environment Standard reference system Formal Institutional Environment (Epistemic community) Institutional framework and regulatory tools Decision making System (Arena designing rules) Operating rules (vote procedure) Regulation devices Institution(s) responsible for implementation Technical measure arrangement Types of actors and participation (organisation level of actors) Information management device and tools (Observatories or other devices used for decision making and monitoring) Social networks (actors social capital, legitimacy and influence ) Actors Know how and private information R E P R E S E N T A T I O N S Monitoring device Institutional arrangements Research institutions Information system 88
98 Figure 2 Sustainable development reference system appropriation process Sustainable Development How is it developed and imposed? SD implementation Participating in SD (re)definition (PCI) Desconstruction (Re)construction Representations the actors have of the SD and how it will impact the situation, and individual and collective projects Collective devices Developing a new representation of SD complying with their project and situation 3. Application to aquaculture systems The proposed analysis grid is used for identifying key subjects for sustainable development appropriation and for organizing surveys into several complementary components concerning the analysis of regulatory systems and representations. The number of surveys has been determined according to the significance of aquaculture systems at the scale of each site. Face-to-face interviews were conducted based on surveys which gave rise to various statistical data analysis processing operations as well as to textual analysis (only for representations). 3.1 Governance and aquaculture regulatory system analysis The structure of regulatory systems has been analyzed according to (formal and informal) arrangements, the degree of constraints as well as to the role and origin of information. A specific section of the survey for agriculture farms has been used for understanding this problem. For all of the sites, 128 surveys have been conducted overall for different types and sizes of agricultural farms. A reference classification has been defined previously based on an expert opinion, by researchers and local project partners (national research centres in aquaculture or professional organizations). Three to four categories have been identified overall on each site. As these surveys are framework surveys carried out over a relatively long period and due to organisational and financial constraints, the number of surveys has been restricted. Each reference category has been completed and the variability within each of these categories has been taken into account. Thus, a high sampling rate on sites with a relatively low number of farms shows the existence of significant particularities. Table 1 Description of farms surveys by country Brittany Cameroon Indonesia Mediterranean area Philippines Number of fish farms Number of surveyed farms Data collected from surveys have been used for determining a typology for regulatory devices based on Multiple Correspondence Analyses (MCA) (Lazard et al., 2009). Based on 32 initial qualitative variables characterizing regulatory systems (constraint level, organization level, social networks, conflicts, access to information), the statistical analysis was used for identifying 4 key variables according to which the typology of regulatory systems was determined (Table 2). 89
99 Table 2 Characterization of aquaculture systems according to regulatory procedures Unregulated systems (liberal logic) Regulated systems (in an informal manner) Regulated systems (in a formal manner) Strong formal regulation 1. Farms do not belong to cooperative or professional organizations 2. No formal or informal constraints 3. No inspection 1. No formal constraints 2. A few inspections 3. Low informal constraints 4. Farms do not belong to cooperative or professional organizations 1. An average number of farms belong to cooperative or professional organizations 2. Low or average formal constraints 3. A few inspections 4. No informal constraints 1. High formal constraints 2. Many farms belong to cooperative or professional organiszations 3. Regular inspections The four types of regulatory systems are differentiated based on their size related to the increasing involvement of formal devices as well as by the level of professional organization of the sector by formal institutions acting as formal regulatory tools. It should be noted that the distribution of farms included in the survey from the different groups shows that they are transversal regarding divisions per site and the distinction between developing countries and developed countries. Table 3 Distribution of farms according to the type of regulatory systems identified Unregulated systems (liberal logic) Regulated systems (in an informal manner) Regulated systems (in a formal manner) Strong formal regulation 75 exploitations (50% of exploitations) 25 exploitations (8% of exploitations) 10 exploitations (12% of exploitations) 30 exploitations (30% of exploitations) Cameroon: from 10 to 13 Philippines: from 30 to 30 Indonesia: from 35 to 56 Cameroon: from 2 to 13 Mediterranean area: from 3 to 21 Indonesia: from 8 to 56 Mediterranean area: from 8 to 21 Brittany: from 2 to 8 Mediterranean area: from 10 to 21 Cameroon: from 1 to 13 Brittany: from 6 to 8 Indonesia: from 13 to Representation analysis The analysis of actors representations has been completed by characterizing current reference systems concerning sustainable aquaculture. Accessing representations is difficult because it requires understanding actors "action modalities" and not the "justification model" which they tend to underline at first during interviews (Argyris and Schön, 1996). In order to analyze aquaculture systems, specific surveys have been carried out. These surveys have taken into account the actors representations regarding (i) their current activity and perception of the aquaculture sector, (ii) their definition of sustainable development and (iii) the means to be implemented for developing a sustainable aquaculture branch. Overall, 168 surveys were carried out in different countries (Table 4). All stakeholders involved in aquaculture have been surveyed. A large sample of actors belonging to the production industry and to various institutions related to the implementation and application of sustainable development (Ministries, administrative services, NGOs, producer organizations, local governments, trade unions, etc.) have been surveyed. The aim was to underline representation differences based on the type of actors and on a functional typology according to the institutional position of actors and their familiarity with the industry and sustainable development. Only a few fish farms, which had been surveyed initially, have been included in this second survey. The most representative and receptive farms were chosen. The aim was to understand the actors position and action logics: Who are they? What are they talking about? These surveys were followed by a textual analysis enabling to characterize the perceptions expressed by surveyed actors using key notions. The different types of perceptions were accounted for by classifying these notions in several synthetic categories. Then a statistical analysis was conducted with the data used for identifying general types of representation in each country and for all countries under study. Lastly, 90
100 based on correlation analyses, a study was carried out on the relationships existing between these types of representation and actors statuses. Table 4 Description of representation surveys by country and type of actor Brittany Cameroon Indonesia Mediterranean Sea Philippines Industry actors Institutional actors Fish farmers Total Total These analyses have been used for accounting for representations that actors have of aquaculture and their profession, thus of the routes via which aquaculture could be developed towards sustainable aquaculture. However, questions regarding their perception of sustainable development could not be used due to a very high non-response rate. On average, only 65 percent of actors answered the survey which shows that they do not know very much about sustainable development and that they are not very familiar with it. However, it is interesting to underline that the non-response rate distribution is strongly linked to actor categories. It only varies between 20 percent for farmers and 80 percent or institutional actors whereas professional aquaculture actors (suppliers and distributors) have an intermediate position (63 percent of them have answered the survey). Concerning sustainable aquaculture, three main types of representation have been identified and they cover the three pillar of sustainable development: a socially and territorially integrated aquaculture focusing on aquaculture nutritional and landscape functions, a managed economic vision of the industry focusing on activity durability conditions, product quality and environmental impact control, an ecological view of the activity which participates in water quality preservation and in the multi-functionality based on the environmental "supervisor" role played by producers. Survey results show that fish farmers have diverse points of view: they do not have (or do not share) a common representation of their activity. This situation could be due to cultural and historical individualism and/or to the geographical dispersion of the activity and/or even to a lack of professional organization. These representation differences increase when professional responses are compared with the responses of other stakeholders. Representation differences between actors involve divergences in coordination devices (forums, arenas, institutions, etc.) aiming to define decentralized institutionalization modalities for sustainable development. Due to the significance of representations in decision-making, their convergence or combination is positive for actor coordination. In the case of aquaculture, actors are positioned in relatively conflict arenas (Mediterranean area and Brittany) or in cohesion areas (Indonesia, Cameroon, and the Philippines). Based on these distinctions, developing and developed countries are divided according to the different significance levels of formal regulatory systems and to the conflicts existing between techniques employed in aquaculture areas. As noted before, it is obvious that these perceptions depend on the status of stakeholders. For example, in Brittany, institutional actors and producers have conflicting points of view about the environmental impacts of aquaculture. Institutional actors consider aquaculture as a polluting activity with use conflicts (resources and areas) and producers consider it as part of landscape and water quality (monitoring). However, actors share a common representation in which aquaculture plays a significant social role in food security and social cohesion. The analysis of these results underlines that there is no common vision and/or professional cohesion between producers. However these two fully interactive factors are decisive conditions for sustainable development appropriation. The fact that industry is insufficiently structured is a constraint as regards 91
101 information transparency; information is often incomplete and rarely shared. From a dynamic point of view, actors participation to these arenas can contribute to changing their individual representations (if they are not conflicting) and to creating a progressive coordination process favouring the convergence of individual representations with respect to a median representation constructed collectively. Information production and training may also contribute to collective learning processes and provide a common diagnosis for a problem of global interest. 4. Integrated Coastal Zone Management (ICZM) and aquaculture The sustainable development aquaculture must also be analyzed according to implementation territories based on an integrated ecosystem management approach by considering all current uses and activities. The local scale is the most operational level for implementing sustainable development (Piraux et al., 2006). This is due to the fact that sector interactions, relationships existing between nature and society, synergies and links between various public policies are easier to analyze at a local scale. This particularly applies to economic incentives and legislations favouring species, habitat or water resource conservation, for example Natura 2000 network conservation policies which provides a European eco-label to territories implementing these policies. As regards coastal zones, since the Rio Summit, Integrated Coastal Zone Management (ICZM) approaches aiming to apply sustainable development principles to coastal zones have been promoted. ICZM policies are an opportunity to define and to make relationships between aquaculture activities and other activities on the territory evolve. Indeed aquaculture farms have severe constraints for the access to sites wherever there is strong request for land. Request for the creation or the extension of a farm are examined case by case, according to procedures where aquaculture is considered as a conflicting and polluting activity. At the same time, looking at the excessive development of urbanisation and of a residential economy on the coast, strategic schemes for sustainable development elaborated at different scales give rise to the interest to maintain productive activities and the need to consider ecosystemic services produced by primary activities. Some application initiatives of this approach in aquaculture have been realised, giving rise to the concept of Ecosystem Approach for Aquaculture (EAA), which requires an enlargement of research fields and a renewal of practices towards an interdisciplinary approach, co-construction methods which integrate traditional and scientific know-how, and a multiscale approach. These initiatives are still few and recent (Fleetcher et al., 2004, FAO-UIB, 2007) and too often thought in a sector-based way, independently from the perspectives offered by the ICZM policies. Indeed, as soon as a sector evolves towards sustainable aquaculture, the realisation of an ICZM constitutes a strategic opportunity to rebuild the image of aquaculture and its contribution to the territories where farms are located, and therefore to remove the present blocks to land access, within a concerted spatial planning. It is therefore important to define the logics and the means for ICZM policies in which sustainable aquaculture should be integrated. 4.1 Brief synthesis on ICZM and its implementation in the Mediterranean Several initiatives were undertaken and recommendations were provided for the realisation of the ICZM, under the push of international organizations who defined its key principles. Several methodological guides were published to favour their adoption (UE 1999, UNESCO 2001, UE, 2002, IUCN 2004). In France, following a report by DATAR (2004) in parallel to thoughts from the Ministry of Ecology and Sustainable Development and an evaluation of the Commission Environnement Littoral in 2002, a report was prepared by DIACT (2006), following the Consultation of member states on the application budget for the Recommendation of the European Parliament and Council dated 30 May 2002 relative to the realisation of an integrated management strategy of European costal zones. 92
102 In the Mediterranean, concerns on sustainable development started in 1994, with the PAP/CAR protocol, realised by the PAM and the Mediterranean Commission for sustainable development since Several initiatives followed the elaboration of directives for the ICZM in the Mediterranean by the PNUE in 1995, the evaluation of experiences of ICZM of the METAP and of the PAM in 1997, a practical guide for the PAC projects in 2000 and a White Book on the management of coastal zones in the Mediterranean in 2001 (PNUE/PAM/PAP, 2001). More generally, a trend for the construction of sustainability indicators for the Mediterranean coastal zones in 1999 and the elaboration of a management strategy at Mediterranean level in 2005, associated to the budget of the Blue Plan (Plan Bleu) defining the perspectives for the environment and the development, could be seen. In 2001, an evaluation of the ICZM experiences was performed with the project «Principles of best practices for the integrated management of coastal zones in the Mediterranean» of the Mediterranean Action Plan. Finally following various working groups (PAM/PNUE, 2006), a protocol relative to the ICZM in the Mediterranean was elaborated by the PAP/RAC (Priority Actions Programme/Regional Activity Centre) (UNEP/PAP/RAC, 2008), with the aim of establishing a guide to help Mediterranean countries to define their national strategies for ICZM. 4.2 Land planning and the voluntary agreements for the realisation of ICZM ICZM cannot be associated to a standard definition, it is defined as an integrated and concerted management, the coherence of which should be thought of at territorial scale and that necessitates the pooling of experiences from experimentations with guidelines for good practices rather than standardised regulation. It is a land policy, the realisation of which has an experimental character following the principle: think globally, act locally, which favours local arrangements within the respect of general principles. There is an important pluralism of the definition produced and taken as references according to the areas (Bodiguel et Rey-Valette, 2006; Rolland, 2005, Rey-Valette et al., 2005). In all cases, the accent is placed on the importance of dynamic, adaptive, participative and interactive aspects; the integrated character applies to the aims, the tools, the action domains, the spaces and naturally the different topics in order to adapt the analysis grids (CEL, 2002). In the Mediterranean the collection of principles for the ICZM policies apprehends it as a «permanent, proactive and adaptive process of management of resources for the sustainable development in coastal zones» (PNUE/PAM/PAP, 2001). In order to be realised, ICZM policies require respecting the following properties: As integrated policy and in the long term, ICZM should be developed within a conceptual framework of spatial planning. The DATAR (2004) definition locates ICZM as a policy for land management which enables the protection of certain areas, as response to environment conservation aims. The entrance through the land enables: (i) (ii) to push inter-sector synergies while beneficiating from positive externalities linked to the proximity and to locally coordinate public policies measures, to manage conflicts between uses and/or populations, the increasing mobility of which leads to divergent perceptions and expectations, and (iii) to consider the plurality of the stakeholders and of the present interests while favouring the participation of population to the policies. The work prior to the Mediterranean ICZM protocol (PAM/PNUE, 2006) identified two constraints or conditions prior to a good functioning of the ICZM: (i) (ii) capacities of realisation laying on an experience of land management and the absence of a too strong pressure of the local lobbies. 93
103 Two operational tools were presented for their contribution to these ICZM policies and local planning, that is: (i) (ii) integration of the obligation of the environmental evaluation in all projects and use of traditional tools for land management. The accent placed on spatial planning leads to favour the tools for land management in various situations. As concerted policy, ICZM implies processes of engagement and voluntary agreement. The pluralism of the present expectations and values calls into question the management for ideas of the conflicts for a functional specialization of space. ICZM policies are affected by a second generation of land management tools based on the elaboration of a chart for sustainable development for a collective and sustainable project for the areas concerned and which necessitates voluntary agreements. This dynamic is inscribed in a more general framework of the transformation of the philosophy of areas development tools and more generally of environment management that evolved towards more pragmatic tools from the collective action, with a particular development of procedures from voluntary agreements, in particular in the process emerged from negotiation actions. The devices for voluntary engagement cover different forms of devices according to which the industry voluntarily agrees to improve the environmental performance, through voluntary agreements, environmental charts, codes of good practices, progress contracts... This type of tool often derives from an engagement on a common principle by creating obligations and duties among members of a group. Also in the case of ICZM in the Mediterranean, practices based on voluntary agreements of the stakeholders are presented by the evaluation of pilot projects (PNUE/PAM/PAP, 2001), as a path favourable to the realisation of ICZM procedures. Various projects therefore propose to favour the evolution of activities toward sustainable practices, especially sustainable tourism (training for the project relative to Venice Lagoon, realisation of a guide book for sustainable tourism for the Project Ulixes 21), ecotourism, or organic agriculture within the SFAX project. The accent set on the participation requires tools to share information and suitable institutional governance devices. As far as the realisation of the ICZM is concerned, the institutional context represents the main factor, often as a constraint conditioning actions coordination, whereas issues on access to information, insufficiency of local authorities coordination and balance of sector representations are considered as decisive. Though still very few, the evaluation steps for the realisation of the ICZM which have been realised (UE, 1999, PNUE/PAM/PAP, 2001, CEL, 2002, Hénocque et Billé, 2005, Hénocque, 2006) stress the weakness of the institutional dimension of the realisation. The report of the Commission Environnement Littoral (CEL) (2002) puts forward the institutional dimension of the ICZM. Some ICZM projects in the Mediterranean, such as the PAC Syria, evoke the need to create favourable conditions for the introduction of tools and techniques of ICZM and underline the difficulty of the administrations to introduce innovative tools and actions. Exchange of and access to information is also a strategic and determinant issue. The elaboration of suitable information tools also represents one of the essential tools for ICZM. The protocol relative to ICZM in the Mediterranean (UNEP/PAP/RAC, 2008) puts forwards some balance notions (cautious exploitation of natural resources and environments), of equity (harmonious sharing of uses) and anticipation (beforehand risk identification). It stresses the need to establish a common base of necessary information, the need to establish guidelines and codes of practices for all the sectors and on the realisation of suitable governance facilitating the participation, the strengthening of inter-sector organizations and more generally the recourse to policies of local planning. The conditions for the realisation of a suitable governance were debated within the working groups, especially three articles of the project (PAM/PNUE, 2006) protocol relative to the institutional coordination (article 6), to the participation (article 12) and to the awareness and training actions (article 13). Table 15 reports in details the recommendations and the discussions about these recommendations. 94
104 Table 5 Recommendations and discussion relative to the realization of ICZM in the Mediterranean Institutional coordination Recommendations of the project for the ICZM protocol - develop a global approach enabling a inter-sector coordination - reinforce the coordination between land and marine domains - push towards the coordination between steps Participation - secure the participation of populations in the elaboration and the realisation of the ICZM, - create consultative organs, public enquires, partner making - realise means of access to the information, of the procedures of intermediation and conciliation - check and protect the existence of resort Synthesis of discussions for the realisation of recommendations - to control the applicability while considering political structures in the different countries - to strengthen experience. - to extend the coordination measures to the civil society and ONGs - to be stock-taking of the issues concerned and to avoid the creation of new institutions - to develop an institutional culture on the steps to be undertaken and the recommendations to be followed while avoiding normative measures. -to reactivate Barcelona Convention of the public participation to decision making (strengthened by the Aarhus convention and the Maputo protocol) -to accompany the recommendations with examples in order to facilitate the appropriation of these steps and not to scare off -to help in the definition of the stakeholders -to spur on the innovation in the process of partnership, especially with the public Sensibilisation training and extension - foresee communication and research actions - foresee training of the public at different scales - favour multidisciplinary research -to favour cooperation between research and stakeholders -to favour the sharing of data with accessible synthesis for the complex processes. -to restructure existing research centres with ICZM issues 4.3 Consequence for aquaculture: example of EVAD s results With this new integrated territorial management approach, aquaculture (as well as fishing and other industries) is moving from sector logic to an industry-based logic. The aim is then to determine how aquaculture can be integrated in these devices (in countries where these orientations have given rise to formal regulations for territorial management) or more generally to analyze territorial dialogue conditions of the activity with other activities and uses. Our survey results show contrasting situations according to the various contexts (Figure 3) depending on restrictive dialogue factors. Whatever the situations, a lack of sector (and industry) transparency and integration is observed in these new arenas and local governance systems. Three cases are described in the following diagram showing the diversity of constraints encountered: in the case of France and Cyprus, a low participation of fish farmers to ICZM devices was observed. In Cyprus, this is due to the lack of real and institutional organizations. As regards integrated management approach, European regulations are more a prescription than a reality. In France, the geographical distribution of professionals is too significant for impacting local arenas. Furthermore, their environmental image viewed by public and local institutions is not good even though it is often unfairly overrated. This territorial division is due to legal constraints relative to the environmental impact assessment (EIA) obligation in the context of Environment Classified Facilities procedures limiting farm extensions and new installations when there are significant urban and tourist conflicts. In France, professional organization and dialogue with institutions remain at national and sector-based levels. Professional representation modes at the local scale must be discovered. In the Philippines, regulatory systems are less developed and/or remain informal. Due to its significance, the sector could impact area planning. However, the outlines and territorial dialogue devices likely to support area planning policies are non-existent. Each case shows the need for collective action on local governance devices and professional organization levels and forms. 95
105 Figure 3 Comparative analysis of interactions between sectorial and territorial organisations according to the context Territorial governance devices Aquaculture production systems Cyprus The size of the sector is significant; territorial governance devices are less developed in spite of European regulatory frameworks France Aquaculture is geographically dispersed; territorial governance institutions are in operation but few are called upon by fish farmers. This activity is organized at a national scale. The Philippines Aquaculture is significant; informal governance devices are very important at a local level and insignificant at a national level 5. Conclusions Analyzing sustainable development appropriation conditions and procedures in the case of aquaculture underlines the significance of socio-technical and organisational learning processes. In this paper, governance seems to be closely related to sustainable development and can be considered as its 4 th pillar. Various methods, approaches and procedures facilitating this translation mechanism can be considered for sustainable development. These approaches must be supported by groups of actors at a territorial scale based on general reference systems. The specificities of the learning process described above are based on the assumption that there are interactions between down normative reference systems distribution and bottom up appropriation actions via the progressive integration of this process in various projects. By studying the representations that fish farmers have of sustainable development and its impacts on their production system, we have attempted to understand the contextualization process, and in particular, the governance devices of sustainable development. Our first results show that fish farmers have not often heard about sustainable development and that national strategies and regulations are either non-operational or unknown to fish farmers. Thus, they do not yet represent an action framework for the implementation of sustainable development. Actors are to determine collectively what should be done at a collective, as well as individual, level at which they shall decide how this (re)definition of "values" and strategies (Argyris and Schön 1996) will prompt them to modify their practices and action models. The aim is to verify the collective character of the governance process, and in particular that devices favour the equity and representativeness of actors subject to a collective organization and the construction of a common vision of the fish farming activity. If this is not implemented, local governance shall remain a vain dream. 96
106 6. References Akrich M., Callon M. et Latour B., A quoi tient le succès des innovations? L art de l intéressement, Gérer et comprendre, Annales de mines, 11: Aoki M., Fondement d une analyse institutionnelle comparée. Albin Michel Ed. Coll. Économie, Paris, 604 p. Argyris C., Schön D.A Apprentissage organisationnel. Théorie, méthode, pratiques. DeBoeck Univ. Ed. Paris, 380 p. (French version of the original published in 1996) Bodiguel C., Rey-Valette H., Gestion intégrée du couple pêche-tourisme sur le littoral : réflexion prospective selon le degré de spécialisation des territoires. In «Pêche et Aquaculture. Pour une exploitation durable des ressources vivantes de la mer et du littoral». Presses Universitaires de Rennes Ed., Rennes, Calame P., Talmant A., L Etat au cœur. Le mécano de la gouvernance. Desclée de Brouwer Ed. Paris, Coll. Gouvernances démocratiques, 242p. Callon M., Lascoumes P. and Barthes Y., La controverse comme apprentissage, et traduction. Extraits de :Agir dans un monde incertain. Essai sur la démocratie technique. Seuil Ed. Paris, Commission Environnement Littoral (CEL), Pour une approche intégrée de gestion des zones côtières. Initiatives locales, stratégie nationale. Ministère de l Écologie et du Développement Durable (MEDD) / DATAR / IFREMER Rapport au gouvernement, Paris, 82 p. DATAR, Construire ensemble un développement équilibré du littoral. La documentation Française. 155p. Délégation Interministérielle à l Aménagement et à la Compétitivité des Territoires (DIACT), Rapport français d application de la Recommandation du parlement européen et du Conseil du 30 mai 2002 relative à la mise en œuvre d une stratégie de gestion intégrée des zones côtières en Europe, 87 p. FAO-UIB, Applying an ecosystem-based approach to aquaculture: definition, principles and scales. Expert meeting Mallorca, Spain, 10 p. Favereau O., Valeur d'option et flexibilité : de la rationalité substantielle à la rationalité procédurale. In Flexibilité, Information et Décision. Cohendet P et Llerena P Eds. Sci. Economica, Paris: Fletcher W.J.; Chesson, J. Fisher M., Sainsbury K.J., Hundloe, National ESD reporting Framework: the How to Guide for aquaculture. Version 1.1 FRDC, Canberra, Australia. ( Godelier E., James March, une pensée gestionnaire au coeur des sciences sociales. Revue Française de gestion. 3-4, 139: Hénocque Y., Leçons et futur de la gestion intégrée des zones côtières dans le monde. Vertigo 17: 11 p. Hénocque Y. et Billé R., Gestion Intégrée du Littoral : analyse des processus à l œuvre et mesure des progrès accomplis dans le cadre d une approche incrémentielle de l intégration. Communication au Colloque International «Prospective du littoral Prospective pour le littoral : un littoral pour les générations futures». Ministère de l Ecologie et du Développement Durable (MEDD), mars 2005 Paris, 15 p. Jodelet D., Représentations sociales : un domaine en expansion. In Les représentations sociales, Jodelet D. Ed. Sci. PUF Ed. Paris, Coll. Sociologie d aujourd hui : Lafferty W.N The Politics of Sustainable Development: Global Norms for National Implementation, Environmental Politics, 5: Lazard J., Baruthio A., Mathé S. Rey-Valette H., Chia E., Clément O., Morissens P. Mikolasek O. Legendre M. Levang P. Aubin J., Blancheton J.P. et René F., Adaptations des typologies d exploitations aquacoles aux exigences du développement durable. Cahiers Agricultures, John Libbey Eurotext pp
107 Loinger G., Leçons des expériences récentes d élaboration d indicateurs territorialisés du développement durable dans le champ de la gouvernance locale. In La dynamique de l évaluation face au développement durable, Offredi C. Ed. Sci. L Harmattan Sté Française d évaluation: North D., Le processus du développement économique. Ed. d Organisation. Paris, 237p. Piraux M., Chia E., Dulcire M., De la situation de gestion au territoire actionnable. Des enseignements en matière de politique territorialisée. Le cas des Contrats Territoriaux d exploitation dans les Départements d Outre Mer. Canadian Journal of Regional Science/Revue canadienne des sciences régionales, 29: OSTROM E., Governing the commons. The evolution of Institutions for Collective Action. Cambridge University Press, 280 p. PNUE/PAM/PAP, Principes de meilleures pratiques pour la gestion intégrée des zones côtières en Méditerranée. Split, PAP/CAR, 55 p. PAM/PNUE, Rapport de la deuxième réunion du groupe de travail d experts désigné par les parties contractantes sur le projet de protocole relatif à la gestion intégrée des zones côtières. Réunion de Loutraki (Grèce), 6-9 septembre 2006, 19 p. + annexes Rey-Valette H., et Chia E., Modes et conditions d appropriation du concept de développement durable. Colloque Éducation à l environnement pour un développement durable. Informer, former ou éduquer? 7-8 Juin 2007 Montpellier, 10 pages Rey-Valette H., Bodiguel C., Antona M., Identification des «faits porteurs d avenirs» des dynamiques et systèmes littoraux comme condition d une gestion intégrée des territoires littoraux. Actes du Colloque International «Prospective du littoral Prospective pour le littoral : Un littoral pour les générations futures», Ministère de l Ecologie et du Développement Durable (MEDD). mars 2005, Coll., Paris, L Environnement en débat, La Documentation française, 15 p. Rey-Valette H., et Roussel S., L évaluation des dimensions territoriale et institutionnelle du développement durable: le cas des politiques de Gestion Intégrée des Zones Côtières (GIZC) Revue Développement Durable et territoire n 8, 20 p. Rolland G., Synthèse bibliographique sur la Gestion Intégrée des Zones Côtières (GIZC). État des lieux en France dans son contexte européen et international. Rapport Rivages de France, 0p Rudd M.A., An institutional framework for designing and monitoring ecosystem-based fisheries management policy experiments. Ecological Economics, 48: UE, Vers une stratégie européenne d aménagement intégré des zones côtières (AIZC). Principes généraux et options politiques. Document de réflexion. 28 p. + annexes UE, «Recommandation du Parlement européen et du Conseil du 30 mai 2002 relative à la mise en œuvre d une stratégie de gestion intégrée des zones côtières en Europe», Journal Officiel des Communautés Européennes, L 148/24, , 4 p. UICN, La conservation du littoral. Eléments de stratégie politique et outils réglementaires. Shine C. et Lefebvre C. Eds. Sci. UICN Ed. Paris, 112 p. UICN, Développement durable de l aquaculture méditerranéenne. Conclusions de l atelier de Sidi Fredj, Alger, Algeria, juin 2005, 14 p. UNEP/MAP/PAP, Protocol on Integrated Coastal Zone Management in the Mediterranean. 89 p. UNESCO/Commission Océanographique Intergouvernementale (COI), Des outils et des hommes pour une Gestion Intégrée des Zones Côtières (GIZC). Guide méthodologique. Vol II. Coll. Manuels et Guides n 42, 64 p. 98
108 Annex 3 Analysis of the standards and indicators for sustainable development of aquaculture 29 Syndhia Mathe #, Hélène Rey-Valette #, Olivier Brunel, Olivier Clement*, François René,, Jean-Paul Blancheton, # Montpellier 1 University, *INRA-Cirad,, IFREMER 1. Background and objectives 1.1 The emergence of sustainable development as a frame of reference In 1972, the Club of Rome published The Limits to Growth (Meadows et al., 1972). In view of the overexploitation of natural resources associated with economic and demographic growth, this private international association founded in 1968 advocated zero growth. Economic development was presented as incompatible with the long-term protection of the planet. It was in this climate of confrontation rather than conciliation between the environment and development that the United Nations Conference on the Human Environment was held in Stockholm in It was there that the concept of sustainable development was first put forth, termed ecodevelopment at the time. Figures such as Maurice Strong, the Conference organiser, as well as Professor René Dubos, Barbara Ward and Ignacy Sachs, insisted on the need to incorporate social equity and ecological prudence into the economic models of both the developed and the developing world. This conference gave rise to the creation of the United Nations Environment Programme (UNEP) and the United Nations Development Programme (UNDP). In 1980, the IUCN coined the expression Sustainable Development (translated into French at the time as développement soutenable ). Nonetheless, the term went virtually unnoticed until it was used in the report by Gro Harlem Brundtland, Our Common Future, published in Prime Minister of Norway and Chair of the World Commission on Environment and Development at the time, Gro Harlem Brundtland endeavoured to define the concept of Sustainable Development as "development that meets the needs of the present without compromising the ability of future generations to meet their own needs. This report gave a decisive impulse to disseminating the notion of sustainable development on a world-wide level. It was politically recognised and adopted at the Earth Summit in Rio de Janeiro (1992) through the Rio Declaration, which established 27 universally applicable principles of sustainable development, as well as through two legally binding international conventions one on climate change (ratified by 154 countries) and the other on biological diversity (ratified by 168 countries) and a set of non-binding yet internationally accepted principles for the protection and sustainable use of forests. A document advocating a programme of action, Action 21 or Agenda 21, was drawn up at this summit as well and has come to constitute the framework for applying the principles of sustainable development in the 21 st Century (hence the term Agenda 21). At the Rio Summit, the majority of countries, including France, committed to take stock of their initiatives to implement measures in favour of sustainable development and to define their national strategy for sustainable development. In the case of France, this strategy was not really defined until the Johannesburg Summit held in September of 2002 (a preliminary strategy had been defined in 1997, but had not been implemented as it was deemed unfeasible). The Johannesburg Summit following the World Summit for Social Development that advocated a global, integrated approach to social issues in 1995 reinforced the legitimacy of sustainable development by insisting on the social aspect, the goals of equity and the struggle against poverty. A Political Declaration and an Action Plan were adopted, leading to a series of initiatives and measures to be undertaken in order to meet the standards of sustainable development. For developing countries, these objectives are part of the Millennium Development Goals defined by the UN in the year In the framework of IUCN activities on Sustainability in Aquaculture 99
109 Such initiatives were accompanied by studies attempting to define information systems suitable for the programming and monitoring policies promoting the principles and goals of sustainable development. Thus, a variety of initiatives to develop indicators were undertaken by the majority of international and national commissions or organizations specifically concerned with sustainable development. By way of example, consider the United Nations Commission on Sustainable Development (UNCSD) and the Mediterranean Commission on Sustainable Development (MCSD). Once completed, these often pioneer studies were followed by more operational ones carried out by more focused institutions or by commissioned statistical organizations such as Eurostat at the European level or the French Institute for the Environment (IFEN) for France. These institutes produced long lists of indicators (over 50) for measuring progress towards sustainable development goals. The majority of these initiatives follow an approach defined in 1993 by the OECD for measuring the pressures exerted on a system and the corresponding answers, as well as for monitoring progress with regard to the different domains or pillars of sustainable development (framework known as PER or DPSIR). This framework, highly relevant for the environmental dimension of sustainable development, became and remained a standard, at least until the past few years, when the concern on social and territorial aspects increased. The most recent studies demonstrated a regression of the range of indicators proposed. The sets of indicators originally put forward, which sought to be relatively exhaustive and precise, have been substituted by more limited sets. Not only are the latter more operational, but they also combine the functions of measurement and emblematic communication to the benefit of sustainable development. Hence, in France, the initial list of 45 national sustainable development indicators divided into 12 categories (Ayong, le Kama, 2005) was reduced to only 8, more focused categories two years later (Ayong, le Kama, 2006). 1.2 Objectives and methodology The objective of this study is to map and assess initiatives to develop indicators for sustainable aquaculture, in particular at the Mediterranean level. It necessitated inventorying and classifying initiatives based on the bibliography available and requires the creation of a tailored analysis grid. Applying this approach to the Mediterranean requires, moreover, an overview of the sector in the region and of the key factors of sustainability at the aquaculture company level. In order to compile this inventory of initiatives, extremely hard work has gone into the drafting of a summary file describing the main characteristics of the initiatives recorded, the point being to establish a structured database facilitating the study of this experience. Note that this has involved analysing two major types of measures or initiatives: those seeking to define principles or strategies promoting the sustainable development of aquaculture (therefore called: Standards for Sustainable Aquaculture) and those primarily focusing on developing sustainability indicators and making them available (called: Initiatives to Develop Sustainability Indicators for Aquaculture). The latter can be an expression of the former, or a different measure altogether Standards for sustainable aquaculture The analysis of these standards involves studying both the institutional origin of measures, their degree of implementation, the types of measures, their scope of application and the main results obtained. Above and beyond the traditional problems of access to information cropping up in any inventory attempt, the main difficulty encountered at this stage was the multiplicity of the types of measures undertaken. We have chosen to report these measures based on their institutional status, adopting the typology put forth by Clément (2001), which distinguishes between: codes of conduct, best practice guides, laws, programmes, action plans, charters and declarations (cf. Table 1). 100
110 Table 1 Means of fostering sustainability Code of Conduct Best Practice Guide Charter Seal of Approval and Certification Convention Action Plan Programme of Action & Territorial Strategy Law A voluntary, often sectoral, non-legally binding document (also known as soft law) drawn up in response to the development of self-regulation in a sector to define the manner in which the actors should behave. Document defining best practice more in detail than a code of conduct and in a more interventionist way. Its aim is to stipulate what actors should do. It is based on the initiatives and active involvement of the actors. In this category, it is possible to integrate the guidelines (not in the sense of EU directives) and principles whose more or less operational content provide instructions on the behaviour and practices to follow. Morally binding commitment that involves signature by the stakeholders and the publication of protocols. Endorsement is not legally binding. Specifications providing instructions on the practices to adopt in production. Obligation is based on delivery and not on certification, but also on the company s rating insofar as its efforts towards attaining sustainable development goals. Assessment is often done by an external organization. Agreement that involves commitment by a number of States and that can be preliminary to the establishment of an action plan. Programme of measures that can be launched by State institutions, professional groups or interprofessional groups. Provisional timetable and co-ordinated action plan established on the State or Institutional scale. Rule issued by a State entailing the obligation of individuals to abide by it on pain of punishment. These different forms of action can be classified according to two criteria: the degree of obligation they entail and the level of decentralisation of the decisions from which they derive. In sum, we thus obtain the following matrix: Table 2 Typology of the means of fostering sustainability low level of obligation high level of obligation Decentralised Initiative Recommendations Declaration Code of Conduct Best Practice Guide Charter Seal of Approval and Certification Centralised Initiative (launched by the State or a centralised institution) Convention Action Plan Programme of Action Territorial Strategy Law The Charter and Seal of Approval procedures can be implemented on different scales: between producers and actors in the industry; or internally, within a company as part of measures for sustainable development and / or corporate social responsibility (CSR). This approach aiming at involving individuals in sustainable development can resort to different procedures that regulate their involvement: a succession of activities related to auditing (assessing the subject), certification (validating action), communication (informing all partners) and training (effecting in-house training and implementing a process of continuous improvement). This is an interpretation of sustainable development that is currently very common in enterprise (social responsibility) but which is neither widespread nor well-known among aquaculture companies. The corporate charter can be included in this approach. Along these lines, the voluntary steps towards certification and corporate environmental and / or social management (of the ISO 9001 or 9004 types, referring to quality; ISO 14001, regarding the environment; OHSAS 18001, on hygiene and safety; or SA 8000, on society) can also be considered as means for fostering sustainable development. Many experiences and examples exist in this domain, with different standards and codes according to the country (Brodhag et al. 2004), brought to the international level by the Global Reporting Initiative of 1997 and the World Compact initiative launched by the Secretary-General of the United Nations in Davos in 1999, aiming to 101
111 encourage companies to commit to the 9 major international principles. With regard to aquaculture, in the USA, industry and the authorities have succeeded in conceiving global HACCP plans for certain cultures, namely turbot, crayfish and mollusc farming. Australia, Chile, Norway, New Zealand and Thailand have adopted a similar approach. In this regard, the Hazard Analysis and Critical Control Points (HACCP) system is about to become obligatory in several countries Initiatives to develop sustainability indicators for aquaculture For these initiatives, we used the same approach based on file analysis (with certain changes in the categories,). In particular, the degree of success and maturity of the measure has been ascertained on the basis of the three major categories distinguished by Madec (2003): Reflection and conception stage Selection and informing of indicators stage Dissemination and routine use stage 2. Extent to which sustainable development is considered in aquaculture In aquaculture, sustainable development began to be considered in 1995, with the FAO s Code of Conduct for Responsible Fisheries, which contains a specific article on aquaculture development (Article 9). Later, in 1998, a version of this code specifically applied to aquaculture gave rise to a set of technical guidelines for responsible aquaculture development (FAO, 1998). This inquiry into sustainability in aquaculture was motivated by a serious crisis experienced by the shrimp culture industry in 1993, after a period of exponential growth (Clément, 2005). The image of aquaculture was seriously damaged by this crisis: the activity came to be associated with the destruction of fragile ecosystems (in particular, mangrove), poorly stabilised zootechnical accomplishments and deplorable social consequences for the poverty levels of local populations (Clément, 2001). This crisis ( the red blood of the blue revolution ) led to condemnation of the shrimp aquaculture industry by international NGOs. Within the context of the Rio Summit, it has played a significant awareness-raising role fostering the inception of several international initiatives that were originally strongly polarised around the shrimp industry (Clément, 2001). As with the general standards for sustainable development, initiatives relative to aquaculture have been divided into different levels going progressively from general international standards to industryspecific applications and finally, to the development of the decentralisation approach and the participation of actors at the local geographical level. 2.1 Industry-specific initiatives for sustainable aquaculture development On a general level At the global level, following the FAO Code, two cornerstone initiatives had a structuring effect. The first is the Responsible Aquaculture Programme, initiated in 1996 by the Global Aquaculture Alliance (GAA). Within the framework of this programme, the GAA established Codes of Practice to advance practices fostering responsible aquaculture, in particular with regard to shrimp farming. The establishment of general guidelines organised according to 9 topics (reduction of ecological impact, conservation of water quality, improvement of feed and medication, reduction of waste products, etc.) was designed to facilitate the subsequent establishment of regional and national codes. From the start, at the initiative of Norwegian research centres at the Holmenkollen Symposium in 1994, a document on the principles of sustainability in shrimp farming developed in 1994 and expanded in 1997 to all aquaculture species led to the adoption of the Holmenkollen Guidelines for Sustainable Aquaculture, consisting of 17 general recommendations for complying with the principles of sustainable development, precaution and ethical behaviour in aquaculture operations. These principles were addressed to all actors in the aquaculture business. Various types of initiatives were implemented thereafter on different geographical scales and launched by a variety of institutions (syndicates, international organizations, NGOs and research institutions). 102
112 Providing an exhaustive inventory, in particular with regard to local initiatives, would be beyond the scope of this document. A variety of experiences were recorded in different countries, particularly in Asia, in response to the questions posed by the crisis and criticism of the impacts of tropical shrimp farming. Figure 1 shows the main standards in chronological order while Table 3 presents them according to the above classification matrix (cf. Table 2). The presentation of these initiatives is limited to institutional programmes and plans in applied research. We have therefore not included, for instance, the case of Canada, where the Department of Fisheries and Oceans created the Office of Sustainable Aquaculture in August of 2000, in order to supervise the rapid development of coastal aquaculture (with a 15% annual growth rate) by launching a five-year research and development programme - biological and environmental sciences, human health, sanitation and quality of water, management and regulatory framework, safety and coherence of policies and programmes. Figure 1 Timeline of emergence of the principal standards for sustainable aquaculture International principles for responsible shrimp farming (FAO, NACA, UNEP, WB, WWF) FEAP Code of Conduct Planning management for sustainable coastal aquaculture development (FAO) ASEAN Regional Directive EurepGAP Quality Standard New project for promotion of sustainable freshwater aquaculture for rural communities starts (SEAFDEC) Guide for the sustainable development of Mediterranean Aquaculture (UICN) Japanese Sustainable Aquac. Law Code of Conduct for Australian Aquaculture General Criteria of Norway CIPA Action Plan Practice guidelines for sustainable Shrimp farming (BFAR) Regional guidelines for responsible aquaculture in southeast Asia (SEAFDEC) Sustainable Aquaculture in Egypt IUCN Mediterranean Action Plan NEPAD Africa Action Plan Principles for responsible Tilapia aquaculture (WWF) 103
113 Table 3 The principal standards according to obligation and decentralisation levels Low Level of Obligation High Level of Obligation Decentralised Initiative Sustainable Aquaculture in Egypt General Criteria of Norway Holmenkollen Principles CIPA Action Plan Declaration of Bangkok 2000 (FAO, NACA) Abuja Declaration on Sustainable Fisheries and Aquaculture (NEPAD) FEAP Code of Conduct EurepGAP Quality Standard Code of Conduct for Australian Aquaculture Regional guidelines for responsible aquaculture in southeast Asia (SEAFDEC) New project for promotion of sustainable freshwater aquaculture for rural communities starts (SEAFDEC) Code of Practice of the British Columbia Farmers Association Codes of Conduct and Practice established by the Brazilian Association of Shrimp Producers Code of Practice for the Production of Rainbow Trout of the British Trout Association ICES Code of Practice Code of Good Practice for Scottish Aquaculture Directive for the Sustainable Development and Management of Aquaculture in Shallow Waters, India Code of Practice for Sustainable Use of Mangrove Ecosystems for Aquaculture SEAFDAC and ASEAN Thai Code of Conduct for Shrimp Farming HACCP Principles MSC Certification Mangrove Charter drawn up by ISME Code of Practice for the Sustainable Use of Mangrove Ecosystems for Aquaculture in South-East Asia (August 2005) Centralised Initiative (launched by the State or a centralised institution) GAA Initiative Responsible Fisheries Code of Conduct Mediterranean Action Plan NEPAD Action Plan IUCN Mediterranean Action Plan Guide for the sustainable development of Mediterranean Aquaculture (UICN) Planning management for sustainable coastal aquaculture development (FAO) Action Plan for Aquaculture Sustainability (NACA, ADB) International principles for Responsible Shrimp Farming (World Bank, NACA, WWF, FAO, UNEP) Japanese Sustainable Aquaculture Law Principles for responsible Tilapia aquaculture (WWF) Canadian Sustainable Aquaculture Programme European Sustainable Aquaculture Strategy The situation in the Mediterranean region Sustainable development of marine activities and costal zones in the Mediterranean began to be taken into account in 1994, within the framework of the PAP/RAC protocol established as part of the Mediterranean Action Plan or MAP (UNEP, 1995). Since the establishment of the Mediterranean Commission for Sustainable Development in 1996, several evolution steps may be identified. The most important developments have been the construction of sustainability indicators for Mediterranean coastal areas in 1999 and the drafting of a strategy on a Mediterranean-wide scale in 2005, consisting of the Plan Bleu assessment report defining the perspectives for the environment and development. 104
114 With regard to aquaculture per se, the only initiative targeting this aspect on a Mediterranean scale was launched by the IUCN in General initiatives carried out on a national scale (CIPA Action Plan for France) or on a European scale (FEAP Code of Conduct) concerned also European Mediterranean producers. Some regional and local initiatives were undertaken, as for example, the recent initiative carried out by Corsican producers to study the sustainability conditions of their companies, or the study carried out by the Conurbation Committee of Toulon-Provence-Méditerranée within the framework of integrated coastal management. At the local level, such measures should be industry-based to territorially-based initiatives, becoming under the auspices of the sustainable management plans for coastal areas and maritime territories set up by local authorities. 2.2 Joint development of sustainable aquaculture and coastal areas The territorial integration approach in natural resource management policies has, for aquaculture as well as fisheries, progressively led from a sectoral or industry-based approach to an integrated management approach taking into account all the activities and uses of the seaboard or coastal zones. It gave rise to a new planning concept called ICAM. After development and conservation policies, Integrated Coastal Area Management (ICAM) marks the beginning of a new approach. This management concept aims to harmonise the pillars of sustainable development by taking into account the representations and interests of the stakeholders involved. In addition, the participation imperatives of public policy introduce an additional level of integration 30. Definitions of Integrated Coastal Area Management emphasise its dynamic and integrative aspects concerning objectives, uses, actors and disciplines within a concern for sustainable development. One of the most commonly cited examples is that of B. Cicin-Sain and R.W. Knecht (1998), who consider ICAM a dynamic process that brings together government and society, scientists and decisionmakers, and public and private interests for the purpose of protection and development of coastal systems and resources; this process aims to optimise long-term decisions, favouring resources and their reasoned and reasonable use. Among the texts with regulatory goals, those of the European Union present integrated management as a public policy allowing the implementation of sustainable development and the improvement of democracy. The emphasis is placed on in-depth knowledge of the mechanisms and local situations, synergy with natural processes and flexibility in decisionmaking. It is defined as a dynamic, continuous and iterative process designed to promote sustainable management by striking a balance between the advantages of economic development and the protection, conservation and regeneration of coastal areas, while taking into account diverging objectives and opinions (EU, 2002; EU, 1999; IUCN, 2004). Several conclusions can be drawn from this necessary interrelation of sustainable aquaculture and ICAM: i) The need for a common perception of the objectives of sustainable development This new integration approach requires going beyond the stage of cohabitation of uses and implies implementation of consensus processes. For a long time, planning measures were based on measures for the territorial specialisation of activities so as to reduce conflicts. The pluralism of the actors involved requires firstly the development of concerted or common perceptions of a territory. These objectives are quite difficult to achieve, since coastal areas are the object of significant migratory flux leading to a mixed population (residents and tourists, local, long-time residents and newcomers, working and non-working population ) with different expectations and needs with regard to environmental protection, human environment, quality of habitats and landscapes. The prospective study on use conflicts (Manon 2004; Perrier-Cornet and Soulard, 2003) carried out by the Commissariat au Plan (Economic Plan Commission), emphasises these differences in perspective. The 30 Integrated management was first defined as part of a rational approach relying on economic evaluation and on measuring the weight and value of activities to provide mediation for use in conflicts. In a second stage, it evolved into a concept of the so-called joint or common management, designed to provide mediation for conflicts of interests, and establish governance plans adapted to the entire structure of actor mobilisation, as well as consultation and negotiation devices that would at once be legitimate, equitable and effective (Rey-Valette, 2002). 105
115 preferences of newcomers for heritage and environmental values lead to increasing conflicts with productive activities. ii) The emergence of a new scale of approach This developing integrated method is resulting in a new scale of approach to aquaculture sustainability: it is no longer a question of simply promoting sustainable aquaculture, but also of ensuring the sustainability of the territories where aquaculture is practiced. This condition is even more important if we consider that these territories often comprise, among others, fragile habitats such as wetlands, saltwater marshes (as per the Natura 2000 network) and mangroves, among others. The sustainability of territories depends on public planning policies implemented by local management actors, in particular territorial authorities. Therefore, in order to better conform to these management plans, aquaculture actors must adapt the new approach, particularly by diversifying the indicators of sustainable development relative to their activity. Decentralised territorial policies are established by territorial authorities, which imply close relations between the actors of the aquaculture sector, these territorial structures and the projects they are implementing. Concerning sustainable development, local Agenda 21 policies have significant potential putting the sustainable aquaculture project into practice. Nonetheless, the latter policies are as yet little developed and the ICAM policies are therefore based on the ensemble of tools and procedures for territorial planning (SCoT, SAGE, SMVM, Contrat lagune or Lagoon Agreements, etc.). iii) An approach involving contracting multiple partners These territorial planning policies arise from a contract and project approach associating several partners, both public and private, generally coming under the frameworks previously established by European Union directives and structural funds. The multiplication of these policies on the local or regional scale calls for the integration of a series of general objectives and principles prescribed by various laws 31 or planning policies in favour of sustainable development, in particular those of the Coastal Law. In the case of France, apart from the SAGEs, highly used on a watershed scale and the less frequent SMVMs, the SRU Act provides new integrated planning tools called SCoTs 32, which tend to multiply and foster the territorial consideration of sustainable development. The most representative priorities that these different policies have in common are the following: Reduction of social and environmental inequalities (standard of living, habitat quality, health, security, access to territorial resources, community services) Conservation of environments Improved management of territories through the implementation of local Agendas 21 in relation to the SCoTs (evaluation of cultural heritage, control of urban sprawl and development, analysis of the vulnerability of specific territories / energy constraints, multifunctional approach to natural and rural areas) These new policies provide an advantage in terms of conflict resolution, however the procedures implemented, usually involve highly detailed reports and consensus processes often entail significant delays. 31 For France, we can cite: the Act on Town and Country Planning and Sustainable Development (LOADDT Act, from 25/06/99); the Act on the Simplification of Inter-Municipal Co-operation; the Urban Solidarity and Renewal Act (SRU Act); and the Participative Democracy Act 32 The SCoT or Territorial Coherence Scheme (Act from 13/12/2000, SRU Article L122-1), constitutes a strategic planning document that establishes town planning policy objectives. It harmonises sectoral policies (urban planning, habitat, displacement, commercial facilities) on a conurbation level within a sustainable development perspective and prescribes environmental evaluation. 106
116 iv) Management on the ecosystem level with new zoning rationale In general, the evaluation of aquaculture sustainability has to be carried out at the level of the territories where aquaculture exists, taking into account all directives, in particular European Union Directives, in addition to the national legislation on environmental protection. One can therefore cite those directives concerning species and their habitats, water, wild birds and urban waste water, in particular the conservation policies of the Natura 2000 network, which provide an European stamp of approval to the territories implementing them. Thus, we are increasingly moving from programs integrating technical measures to ecosystem management policies establishing conservation measures through the reservation of part of these areas. Hence, halieutic ecosystems are no longer managed solely through the monitoring of stocks and the regulation of fishing efforts, but also through the establishment of marine reserves. These territorial planning policies are therefore complementary to the previous forms of management based on the regulation of environmental impact that led to conventional measures to regulate waste and pressure. The majority of these policies entail a generalisation of diagnostics and impact studies, both ex ante and ex post. Thus aquaculture in France is subject to the obligation of environmental impact studies within the framework of Installation Classée Pour l Environnement (Facility Scheduled for Environmental Protection or ICPE) procedures. With regard to the development of information and observation systems upon which these policies rely, the territorial scale has led to the development of new cartography and modelling tools such as GIS (Geographic Information System), which have the dual advantage of being more operational for spatial planning decisions and facilitating consensus among actors, while they necessarily entail spatialisation of data and therefore of indicators. The analysis described here primarily concerns France, though the majority of European countries have also enacted national policies that interpret sustainable development goals in a decentralised way. Regardless of the regions or countries, ICAM policies are being developed; in France, for instance an experimental programme devised by the DIACT (Interministerial Delegation for Planning and Competitiveness of Territories, formerly DATAR) was implemented. At the European Union level, a framework directive based on the results of a new European project covering nearly all Member States is being developed. Moreover, the policies mentioned above, in particular those relating to territorial planning, refer to land resource management tools. Concerning the maritime environment, the same approaches and principles exist, but in a somewhat different context, as such an environment entails additional constraints. In fact, highly complex procedures can be observed for the marine environment. Despite a lower overlap of uses, tools and policies, the public nature of the maritime domain entails a plurality of supervisory authorities, with a strong ascendancy of maritime Departments. Thus cage aquaculture tends to move increasingly farther from shore in order to avoid use conflicts. Nonetheless, the granting of licences in these zones remains highly restrictive as knowledge concerning currents and interaction processes for instance is lacking at this scale. The definition of the actors concerned is as difficult to isolate as that of the borders of ecosystems and management units. The regulation of space via a mechanism of allocation and licensing is only possible when legitimate management zones have been defined, both on the ecological and the social levels. In the case of France, consideration is being made of the transposition of such tools as the SMVMs or the Lagoon Contracts to a concept such as that of the EGLA (Espace Littoral de Gestion Associé or Jointly Managed Coastal Area (Pary, 2002)), which has yet to be defined. 3. Initiatives relative to sustainability indicators in aquaculture As with the standards, the inventory of initiatives to develop sustainability indicators has given rise to the creation of a database in the form of standardised files. It is difficult to evaluate how exhaustive this inventory actually is. In any case, the principal initiatives to develop indicators have been ascertained and studied. Only some initiatives for their generalised scale or for the impulse they have provided will be briefly mentioned here. 107
117 3.1 Summary of initiatives recorded The main international initiatives After the Code of Conduct for Responsible fisheries, the FAO has drawn up a list of criteria and indicators to establish new practices for shrimp production. Forty indicators, some of which are not yet available, were defined through expert research. Some indicators were thereafter expanded and validated by a survey among management entities from different countries. The process was done thematically, in accordance with the sustainable development pillars, the indicator categories being: biophysical and ecosystem-based, economic and social, legal and institutional and those of the producers themselves. Similarly, at the World Conservation Congress held in Bangkok from 17 to 25 November 2005 as part of an IUCN programme promoting improved co-ordination between aquaculture and environmental conservation, a number of international organizations (WWF, NACA, World Bank, SEAFDEC) evaluated the progress of procedures and put forth 26 sustainability indicators based on 8 major principles, the majority of which concerned the environment. Finally, another significant case is the initiative called CONSENSUS, launched by the European Aquaculture Society (EAS) and the Federation of European Aquaculture Producers (FEAP), which brought together multiple partners of research, professional organizations, consumer organizations and the European Commission (EC). This project aimed to develop sustainability indicators for aquaculture, distinguishing the production systems according to the types of fish aquaculture (freshwater, open-circuit, re-circulated systems, cage systems) and mollusc aquaculture. It aimed at supporting activities and the point of view of consumers. The procedure followed was based on an objective criteria indicators approach Other initiatives Twelve initiatives (thirteen counting the indicators included under Japanese law) to develop indicators for sustainable aquaculture were implemented. 46% of them were carried out on an international level, 39.5% of them on the national or local levels, the remaining being initiatives carried out in specific zones. Figure 2 Timeline of the major initiatives to develop indicators for sustainable aquaculture FAO shrimp farming indicators ICLARM - Integrated management of water resources Workshop - World Conservation Forum CONSENSUS Project Ecological footprint for tilapia - University of Norway Semiintensive shrimp culture - Mexico (research institutes) South US Aquaculture University of Louisiana General aquaculture indicators Germany and British Columbia Ecological impact of salmonids - INRA, France EVAD - generic process initiated by French researchers Aquaculture in Aquitaine INRA / CIPA Pond aquaculture in the Philippines Univ. Reading, Food Standards Agency and CIRAD 108
118 3.2 Analysis of the initiatives with regard to methodology The procedures for developing sustainability indicators for aquaculture follow the most generalised approach used in building indicators for sustainable development. International organizations and countries produce standards and lists of indicators designed to be adapted to smaller scales and more focused objectives, thus promoting the adaptation of sustainable development policies. These procedures were already mentioned in the introduction (cf. 11); they have had a strong influence, both on methodological procedures and on the nature of some indicators. The procedures may be distinguished firstly according to their aim. The aim of many experiences is simply to produce checklists in the sense of standards and thus to contribute to the convergence of territorial initiatives. In this case, there is no measurement of the indicator. At most, the feasibility of the measure is ascertained by checking existing information systems and the availability of appropriate data. The proposed indicators are accompanied by a technical file which generally covers the following spheres: nature of the indicator, objective sought precise definition of the concepts and criteria used for developing the indicator, measurement methodology, available or necessary databases and institutional status of these databases form of comparison, bibliographical references. Each of these methodological files constitutes a sort of metadata set for the proposed indicators. In comparison to Madec s sequential typology (2003), which distinguished between procedures according to their maturity or level of success (1) reflection and conception, (2) selection and informing of indicators and (3) dissemination and routine use), it seems that certain initiatives, in particular, the standards produced at first by the international institutions, essentially fall under the category of reflection and conception stage. The study of the 12 initiatives inventoried according to their level of progress demonstrate a relatively balanced division between the categories, with one third (31%) in the reflection / conception stage and 38% in the selection and informing stage. From a methodological point of view, concerning the forms for developing the indicators, two major types of procedures are traditionally distinguished (IFEN, 1999): (i) those called normative, which can be qualified as top down, where indicators are defined on the basis of expert procedures; and (ii) those called procedural, which arise from interaction among actors in collective definition processes or processes of joint construction of these indicators according to a more bottom up logic, although the latter are often informed by checklists produced by experts. The participation of scientists is highly structuring in the sense that they intervene in all initiatives. However in two thirds of the cases (66%), this is done through open partnership with the various actors of aquaculture systems (farms, the administration, consumers...). The following chart provides an overview of the types of procedures used in each stage. Figure 3 Types of procedures followed to develop indicators 1. Reflection conception Analysis of Production Systems and Interaction Reference Lists > 300 indicators Bibliographical Evaluation Approaches According to Experts 2. Selection and Informing Aims or Principles Criteria Indicators Indicators 3. Routine Use Indicators to Monitor Progress Towards Sustainability and Implementation of Sustainable Development Policies 109
119 Depending on the initiative, the reflection conception stage relies on three major types of procedures (which are not exclusive but often complementary). The development of indicators can proceed from an analysis of the forms of production and their strengths and weaknesses vis-à-vis the sustainability of the activity and of the territory (inductive approach based on observation). Otherwise, it can also proceed from methods relying on bibliography or the mobilisation of experts (deductive approach) based on previously existing lists of indicators that can be quite significant (up to 296 for the INRA / CIPA study in Aquitaine, which is the most exhaustive and whose indicators have been used for the CONSENSUS project), with various selection and classification procedures according to both the philosophies behind each approach and the scale upon which they are carried out. Two formal procedures of consultation with experts or indicator selection are cited: the Delphi Method and multicriteria analysis. Depending on the procedures used, the pertinence and legitimacy of indicator choice made hinges on the diversity of actors involved (procedural approach) and/or on the level of competence of the experts consulted (normative approach). The development of indicators requires a standard allowing the nature of indicators to be precisely defined. The reference framework is most often the one produced by the OECD in 1993 (PER or DPSIR, cf. Table 4), which proposes distinguishing indicators according to their nature, i.e. the type of information they should provide. This approach is quite rare in the case of aquaculture. Table 4 Nature of indicators according to the DPSIR assessment framework of the OECD Driving Forces Pressure State Impact Response Indicators relative to processes, behaviour and determining factors allowing analysis of pressure exerted Indicators for monitoring the evolution of the state of ecosystems and social systems Indicators used to report on management measures and the reaction capacity of society to reverse trends According to this typology, a strong polarisation of studies and indicators concerning the monitoring of states of affairs and impacts can be observed. A review of the initiatives tends to show that there are few precise, integrated analyses on processes based on the following two main lines: the impact of aquaculture on the environment (approach analysing pressure exerted); and the consequences of environmental change for aquaculture (approach focusing on vulnerability). The definition of pressure criteria or driving forces calls for an extended analysis of the interactions and processes concerned. These are complex processes reflecting the issue of interaction between nature and society and few standards are available in this sphere. One example we could cite is proposed by Garcia and Cochrane (2005) for fishery, which constitutes a benchmark in this domain. This type of approach requires a framework of a more inductive type, with observation-based analyses. 110
120 Figure 4 Framework for analysis of processes for fishery pressure indicators CLIMATE Global change ABIOTIC Bottom Fluctuations Water Weather Topography Impacts OTHER ACTIVITIES Habitat Survival Impacts BIOTIC Target species Other species Living habitat Predators Preys Interactions MARKETS Working conditions Demand Supply Competition Gear impact Pollution Clues Risks FISHING Capture Processing Protection Restoration Removals Depletion Behavior Attraction Protection Rehabilitation Management INSTITUTIONS Development Conventions Regulations Information Financing Lobbying Organization Process Votes OTHER ECOSYSTEMS POLICY VALUES Source: Garcia and Cochrane (2005) In the case of indicators of state, the methodological needs arise from the classification framework for the variables to be monitored. In the case of fishery, and in particular, ecosystem indicators (Rey- Valette et al. 2005), the standards produced by Fleetcher et al. (2000) for Australia are becoming generalised. The following figure shows an example of a reference analysis grid allowing the categorisation of the elements to be taken into account in monitoring of states. 111
121 Figure 5 Example of approach matrices for structuring indicators of state Source: Fleetcher et al With regard to the specific stage of indicator development, the initiatives studied reveal two types of procedures: either an extent list of indicators directly employed; or indicators defined by iterative deduction according to a sequential form of development consisting of three stages, namely Principles Criteria Indicators (PCI). Indicators are used for estimating criteria showing objectives associated with the general principles of sustainable development. One thus moves from principles to criteria and then to indicators, which not only allows a list of indicators to be produced but also allows them to be related to the values making sustainable development adaptable to a sectoral or territorial level. Altogether, the number of stages in the development of indicators varies from 1 to 3, though half of the initiatives studied here only used a single stage, directly defining indicators. 112
122 Finally, one must also distinguish procedures according to their philosophy, consisting of: On the one hand, those that seek to produce more or less restricted panels of indicators, generally associating the three major pillars of sustainable development, to which the pillar of governance lately tends to be added. Over half (54%) of the initiatives studied considered the three pillars of sustainable development in building indicators and 18% added the institutional facet; On the other hand, those that seek to produce aggregated synthetic indicators, on the model of the ecological footprint, which expresses human impact in terms in necessary surface area. The ecological footprint has been applied to various aquaculture systems by Swedish researchers (Kautsky et al. 1997; Roth et al. 1997). They estimated the surface area of ecosystem necessary for a shrimp farm in a mangrove in Colombia, for the cage production of tilapia on a large scale and for semi-intensive pond farming of tilapia on a small scale in Lake Kariba in Zimbabwe. In the same vein, life cycle analysis develops an aggregate indicator of the environmental impact of aquaculture. This analysis has been used, for instance, to study the environmental impact associated with feeding rainbow trout in France. To summarise, this overview shows that there is: An overabundance of indicators with a multiplication of lists (cf. Figure 6), often difficult to inform and not always suitable to local specificities and the demand of users with a low degree of association. The number of indicators developed within the framework of an initiative varies from 1, for integrated indicators such as ecological footprint or ACVs, and 73 at most, with an average of between 15 and 20, these differences not having any real relation to the scale of application. Greatly disproportionate sets of indicators classed according to the pillars of sustainable development, with a predominance of environmental impact indicators, which are either the only ones addressed (cf. initiatives on a grey background in Figure 6) or the most developed and operational. Figure 6 Number of indicators proposed by different initiatives FAO shrimp farming 40 indicators ICLARM - Integrated management of water resources 4 indicators Workshop - World Conservation Forum 26 indicators CONSENSUS 10 to 13 indicators according to type of aquaculture Ecological footprint, Norway 1 indicator Shrimp culture - Mexico 17 indicators Southern US aquaculture 31 indicators Germany and British Colombia 11 indicators ACV INRA 1 indicator Aquaculture in Aquitaine 73 indicators Pond aquaculture in the Philippines 6 indicators Those indicators restricted to environmental aspects are placed on a grey background. 113
123 3.2 Typology and presentation of the indicators inventoried Comparison of the different lists (cf. Figure 6) leads to the identification of 142 indicators, some of them having been the object of validation and measurement. One can obviously classify these indicators according to the pillars of sustainable development to which they refer. We then obtain the following breakdown, which confirms the preponderance of the environmental domain: Table 5 Breakdown of inventoried indicators according to their domain of reference Environmental Economic Social Institutional Without making an extended analysis of these indicators, in any case they could be analitically classified according to their position and contribution with regard to the approach to aquaculture sustainability. In this sense, the following figure presents a functional typology of the levels of interaction, allowing types of indicators to be identified according to their functional position with relation to sustainability analysis. Figure 7 Typological classification of the indicators inventoried SOCIETY 3. Socio- Economic Impact 7. Governance 2. Socio- Economic Vulnerability AQUACULTURE INDUSTRY 6. Response 1. Ecological Vulnerability 5. Production Method ENVIRONMENT 4. Pressure on Environment 114
124 Table 6 Typological classification of the indicators inventoried N Type ecological vulnerability socio-economic vulnerability socio-economic impact pressure on environment production method Number of topics Definition characteristics of the elements of the natural environment that constitute a constraint to aquaculture sustainability characteristics of the elements of the socio-economic environment that constitute a constraint to aquaculture sustainability indicator to monitor the state and impacts on the socio-economic system environmental impact in terms of pressure associated with aquaculture activities indicators referring to the aquaculture production method 6 response 2 indicator measuring the efforts implemented (schemes or mechanisms) to attenuate pressure 7 governance 3 indicators regarding processes of steering and regulation of the industry or the territory On the basis of these categories, the 142 indicators identified can be arranged according to analysed initiatives, some of the indicators being listed several times, others only mentioned by a single initiative. Table 7 Inventory of indicators according to the types identified ecological vulnerability socio-economic vulnerability socio-economic impact pressure on environment production method Availability of inputs: dependence on fish stock; conflicts / access to water; origin of fry; number of local land owners; net use of primary industry product; Water quality: frequency of sale bans; water composition; % of protected area; oxygen demand Training: dependence on external knowledge; availability of qualified personnel; level of education; literacy rate; Interaction with other users: population density; intensity of conflicts; pressure of water demand; weight of recreational fishing; aquaculture image and local perception of the industry; competition among activities; complaints relating to water quality; Access to information: knowledge of hydrological resources (water flow ); market studies; specific mapping of risks; weight of local research Economic impact: use of fuel; local weight of the sector and of the industry; participation in ecotourism; importance of the revenue distributed; importance of importation and balance of payments for the farms; % of aid to the sector; Social impact: number of jobs; % of local employment; job security; income level / local average; connections to medical service; average ages and reemployment rates; inter-sectoral and intra-zone equity; place of residence (distance / urban centres) and access to personal services; social services Pressure on aquatic environments: stock escape rate; water composition and chemical concentration (ammonia, phosphorus, particles in suspension, pesticides, fertilisers, dissolved oxygen; sulphite, benthos, chemicals ); eutrophication rate; acidification rate; quantity of water and rate of use of water resources, exceeding the water reserve limits; % of recycled circuits, % of exotic and imported species; % of water from drilling and diversion; Pressure on terrestrial environments: rate of real estate pressure; specific land uses: protected areas, wetlands, natural areas and mangroves; weight of aquaculture farms / zone; Global pressure and energy consumption: CO2 emission and contribution to climate change; ecological footprint; energy consumption Marketing: product diversity (types, processing rate ); added value of by-products; share of types of circuits and markets; % consumption and repopulation; % of products with artificial colouring; quality of products; % local sales; % of quality or ecological contracts; number of complaints relating to product quality; Animal health and welfare: animal health and welfare; quantity of antibiotics and medicine; consideration of this notion by producers; Feed: addition of proteins; origin of protein; type of feed (pressed or extruded); artificial colouring; % GMOs in feed; food conversion rate and net protein production; Profitability: weight of feed expenses; ratio of fixed / variable expenses; economic efficiency; investment returns, profit and profit margin; variability of inter-annual results; weight of taxes and ecological expenses relating to compliance; number of businesses closing, number of farms without buyers, added product value; Production technique: diversity, efficiency of technique and productivity; number of recycled flows; weight of recycled circuits; diversity of species; portion of triploid animals; genetic growth potential 115
125 response governance Control at the farm level (individual response): sanitary barriers, technological innovation rate, farming density, treatment of rejects, waste products and wastewater; output rate; energy consumption rate; % control measures on producer s initiative; Collective management: number of quality measures; procedures to foster sustainability (guides); link between research and the sector (rate of farms working with external experts or rate of farm openness); sector stability with respect to changes; reuse of products in integrated aquaculture Openness of the sector: % participation of the industry in territorial management schemes; investment in quality communication; transparency of the sector; relations with other actors; Compliance with regulations: complaints relating to water quality and non-compliance with decrees; Institutional maturity: efficacy and representativeness of socio-professional structures 4. Conclusion This analysis demonstrated the existence of significant progress regarding measures fostering sustainable aquaculture, with recent initiatives showing an attempt towards inclusion and standardisation of the results of past measures. Nonetheless, this type of bibliography-based study can only provide a global overview of the situation. It does not provide details on the problems encountered in the real state of progress of certain measures, or on local initiatives carried out by producers associations. Thus, for the Mediterranean, where there is no structure federating producers on a global level (apart from the GFCM Committee on Aquaculture), it is difficult to gain such an overview. The analysis carried out, above and beyond the bibliography, sought to mobilise intermediary actors such as representatives of national aquaculture federations. The majority of contacts made by mail have not produced more detailed information. Only on-site surveys will allow the identification of: Examples of aquaculture sustainability and determining factors; The interest of actors in sustainable aquaculture certification measures; The number and knowledge level of existing initiatives. As a result of this analysis, a number of recommendations can be formulated to encourage greater dissemination and definition of initiatives fostering sustainable aquaculture in this geographical area: The adaptation of measures demands the definition of common principles on the basis of which indicators are developed: measures aiming to compile indicators directly from preexisting check-lists should therefore be avoided or restricted to the early stage of the implementation of the measure; measures to develop policies and/or indicators for sustainable development should be agreed upon by all actors concerned; Protocols should be defined that take into account the diversity of the aquaculture systems concerned. Thus in the case of the Mediterranean, the different species and types of aquaculture sites should be taken into account, as well as and above all the differences in farm size so as to consider the issue of maintaining small-scale, businesses; The profusion of indicators available limits their usefulness: their use should be considered and their number restricted to few benchmark indicators with a significance that can easily be adapted by the actors involved and that can also serve a communication tools. Function should be developed; It is important to strike a balance relative to all pillars of sustainable development and economic, environmental, social and institutional aspects. The last two being currently underrepresented, should be taken into greater account; Studies should not be limited to ascertaining impacts and states of affairs, but should also analyse processes and interactions, which requires the availability of analysis grids adapted to aquaculture systems (productive and regulatory systems); 116
126 It would be best to go beyond the sector or industry-based approach to investigate the territorial scale within the framework of more global policies of sustainable development; It is important that the issue of adapting information systems be addressed from the start in considering indicator definition procedures, with a view to sharing the existing information on the different sustainable development policies carried out on a territorial level and therefore fostering their effectiveness and durability; And finally, it would be best to accompany procedures of important initiatives with communication on several levels, the point being not only to ensure that these procedures contribute to the promotion of the sector and the improvement of its image among different types of public (local decision-makers, the public at large, coastal inhabitants, consumers ), but also to foster the image of sustainable development as an opportunity for action and innovation and not as a constraint among producers and stakeholders in the aquaculture industry. 5. References Angel D., Chabali A., Christofiligannis P., Courtois de Vicose G., De la Gandara F., Tabraue R.H., Kara M.H., Izquierdo M., Arenas A.M., Mathé S., Omana C.H., Vitores D.M., Nhhala H., Gonzalez-Posada J.O., Pergent C., Rad, Remiro Perlado J. René F., Reyes E., Simard F., Symons D., Torrent F.,Toledo M.V., Watters J., Yucel-Gier G., Guide pour le développement durable de l'aquaculture méditerranéenne. Interactions entre l'aquaculture et l'environnement. UICN, Gland, Suiza y Malaga, Espana. VI+114 p. Aubin J., Van der Werf H.M.G., Petit J., La contribution de l analyse du cycle de vie au développement durable de l aquaculture. Académie d Agriculture de France. 2p, Arrow, K., Bolin, B., Costanza, R., Dasgupta, P., Folke, C., Holling, C.S., Jansson, B-O., Levin, S., Maler, K.-G., Perrings, C., and Pimentel, D., Economic Growth, Carrying Capacity, and the Environment. Science, 268: Ayong Le Kama A., Indicateurs de développement durable nationaux : où en est-on? Paper presented at the International Coonference, Usages des indicateurs de développement durable, 3-4 April 2006, Montpellier, 12 p. Ayong Le Kama A., Horizon 2020 : L État face aux enjeux du développement durable. Rapport Provisoire du groupe de travail Equilibres. Commissariat Général au Plan, Paris, 187 p. Benoit G., Comeau A., Méditerranée, les perspectives du Plan Bleu sur l environnement et le développement. Edition de l aube, La tour D Aigues, France, 427 p. Brodhag C., Gondran N. and Delchet K Du concept à la mise en œuvre du développement durable: théorie et pratique autour du guide SD VertigO La revue en sciences de l Environnement, 5, 11 p. Bryceson Coastal Aquaculture Developments in Tanzania: Sustainable and Non-sustainable Experiences. Western Indian Ocean. J. Mar.Sci. 1: Caffey R.H., Kazmierczak R.F., Avault J.W., Developing Consensus Indicators of Sustainability for South-eastern United States Aquaculture. Louisiana State University, Agricultural Center. Bulletin 879, 40p Christofillogiannis P., National Aquaculture Sector Overview. Inland Water Resources and Aquaculture Service. 13p. CIFOR, Ensemble générique des critères et indicateurs du CIFOR. Manuels de critères et indicateurs pour la gestion durable des forêts. Cicin-Sain B. and Knecht R.W Integrated Coastal and Ocean Management: Concepts and Practices. Washington, D.C., Island Press, 517 p. Clément O., Démarches pour le développement durable de l aquaculture. Power Point Presentation, Académie d Agriculture de France, 12 October
127 Clément O., 2001a. Modes d actions possibles pour un développement durable de l aquaculture. Note presented to the members of the Sustainable Aquaculture Commission of the CIPA. Clément O., 2001b. Codes de conduites et Codes ou Guides de pratique. Note. Clément O., 2001c. Développement durable et aquaculture : un survol de la littérature. Note. 9pp. Clément O., Lazard J., Aubin J., Le développement durable de l aquaculture. Académie d Agriculture de France. 2p Coudert Elisabeth, Rapport environnement et développement en Méditerranée. Partie 2 : le littoral. Présentation. De Monbrison, Mediterranean Marine Aquaculture and Environment. Identification of issues. IUCN. 34p Donovan D.J., Environmental Code of Practice for Australian Prawn Farmers. July p. El-Gayar O.F., Aquaculture in Egypt and Issues for Sustainable Development. Aquaculture Economics & Management 7 (1/2), pp EU, Vers une stratégie européenne d aménagement integré des zones cotières (AIZC). Principes généraux et options politiques. Document de reflexion. 28 p. + annexes EU, Recommandation du parlement Européen et du conseil du 30 mai 2002 relative à la mise en œuvre d une stratégie de gestion integrée des zones cotières en Europe. Journal officiel des Communautés Européennes, l 148/24, , 4 p. FAO Le rôle de l aquaculture dans l amélioration de la sécurité alimentaire et de la nutrition. Comité de la sécurité alimentaire mondiale. 16p. FAO. Directives techniques pour une pêche responsable. No. 5, Suppl. 1. Rome, FAO, p. FAO/NACA/WHO. Food Safety Issues Associated with Products from Aquaculture. Report by a mixed FAO/NACA/WHO research group, Bangkok, Thailand, July WHO Technical Report Series No WHO, Geneva. (in press) FAO, Code of Conduct for Responsible Fisheries, FAO. Fletcher et al., National ESD Reporting Framework for Australian Fisheries: the 'How To' Guide for Wild Capture Fisheries. FRDC Project 2000/145, Canberra, Australia. Franzic A., Integrated Coastal Management & Sustainable Aquaculture Development in the Adriatic Sea. Republic of Croatia, Center for Coastal Resources Management. Virginia Institute of Marine Science, College of William & Mary, USA. 81 p. Gonzales O.H.A., Beltran L.F., Caceres-Martinez C., Ramirez H., Hernandez-Vazquez S., Troyo- Dieguez E. and Ortega-Rubio A., Sustainability Development Analysis of Semi-intensive Shrimp Farms in Sonora, Mexico. Sustainable Development 11, Gordin H., Mariculture in Israel. The Israeli Journal of Aquaculture: Harmuth G., Huber K., Rink D., Operationalization of sustainability at the local level. Sustainable development, 16 : Hildén M., Rosentröm U., The use of indicators for sustainable development. Sustainable development, 16 : Hubert B., 2004, Le développement durable et la recherche scientifique: opportunisme ou refondation? Des indicateurs, pourquoi et comment? Power Point Presentation, BSIAE. Institut Français de l environnement, indicateurs de développement durable: une contribution de l Ifen. Etudes et travaux No. 41. IUCN, Minutes of the workshops on aquaculture held within the framework of the World Conservation Forum (Bangkok, November 2005). 5 p. IUCN, Développement durable de l aquaculture méditerranéenne. Conclusions of the Workshop by Sidi Fredj, Algiers, June Long version. 14 p. 118
128 Kautsky N., Berg H., Folke C., Larsson J., Troell M., Ecological Footprint Concept for Assessment of Resource Use and Development Limitations in Shrimp and Tilapia Aquaculture. Aquaculture Research, 28: La acuicultura, Factores clave de los sectores de la pesca y acuicultura en Espana, 14p Lacroix D., National Aquaculture Sector Overview (France) Lacroix D., Ferlin P., L aquaculture en Méditerranée. Document Ifremer. 7p Lem A., Eurofish. Fishinfo Network Market Report on Seabream and Seabass Lem A., 2006, Eurofish. Fishinfo Network Market Report on Seabream and Seabass Lequesne C , L'Europe Bleu. A quoi sert une politique communautaire de la Pêche. Presses de Sciences PO, Paris, France. Madec P., Les indicateurs de développement durable. INRA-Université de Montpellier II. 118 p. Malta, National Aquaculture Sector Overview (DRAFT) Manon, (2004). Les conflits d usage dans les espaces ruraux et périurbains : un enjeu de débat public. premiers résultats du groupe. Groupe MANON. Les Quatre Pages. Commissariat Général au Plan, No. 1 March 2004, 5 p. Mathe S., Recensement des initiatives de définition de normes et d'indicateurs de développement durable appliquées à l'aquaculture. Meadows D.H., D. L. Meadows, J. Randers, and W. W. Behrens III The Limits to Growth. Universe books, 205p Ministère des pêches et des ressources halieutiques, National Aquaculture Sector Overview. (DRAFT) Algeria. Ministerio de la agricultura, pesca y acuicultura, 2004, Vision general del sector acuicola national. 16p NACA/FAO, Aquaculture Development Beyond 2000: The Bangkok Declaration and Strategy. Conference on Aquaculture in the Third Millenium, February 2000, Bangkok, Thailand. NACA, Bangkok and FAO, Rome. 27p. Norwegian Academy of Technological Sciences, The Holmenkollen Guidelines for Sustainable Aquaculture. In Proceedings of the Second International Symposium on Sustainable Aquaculture, Oslo, 2-5 November Norwegian Academy of Technological Sciences, Trondheim, Norway. Nejiba M., Rapport national sur l aquaculture en Tunisie. 10p. Ofimer, Les chiffres clefs de la filière pêche et aquaculture en France. Edition p. Papatryphon, E., Petit, J., Kaushik, S.J., van Der Werf, H.M.G Environmental Impact Assessment of Salmonid Feeds Using Life Cycle Assessment (LCA). Ambio, 33: Pary B Les récifs artificiels : un outil d aménagement de la bande côtière pour soutenir la pêche professionnelle. L exemple de la pêche en Languedoc-Roussillon, in Droits de propriété, économie et environnement : Les ressources marines, Dalloz, Paris, pp Perez Sanchez E., James F. Muir, Lindsay G. Ross, Coastal aquaculture and sustainable livelihoods in Mexicoacan, Tabasco, Mexico. Universidad y ciencia. 18: Perrier-Cornet P. and Soulard C., Prospectives des espaces ruraux français à l horizon Inra-Sciences Sociales, 4 p. Rey-Valette H., Revue des questions et des travaux relatifs aux lagunes Méditerranéennes. La composante sciences sociales. In Environnement, politiques publiques et dynamique des activités littorales. Travaux et questions des sciences sociales. Rey-Valette H., Cormier-Salem M.C., Point P. And Antona M., Scientific Eds. Oceanis, 28: Rey-Valette H., Bodiguel C. and Cunningham S., Review of the usage of socio-economic indicators on the environmental impact of fishing activities. Report on European Union Concerted Action INDECO - Development of Indicators of Environmental Performance of the Common Fisheries Policy. 51 p. 119
129 Rey-Valette H., Morand P., Mikolasek O. and Le Fur J., Indicateur de développement durable et durabilité. Summary IFR Report, Armand Sabatier and PNEC. Rey-Valette H., Morand P., Mikolasek O. and Le Fur J., Indicateur de développement durable et durabilité. Technical Annexes. IFR Report, Armand Sabatier and PNEC. Rey-Valette H., Clément O., Aubin J., Mathé S., Chia E., Legendre M., Caruso D., Mikolasek O., Blancheton J-P., Slembrouck J., Baruthio A., René F., Levang P., Morissens P., Lazard J, Guide to the co-construction of sustainable development indicators in aquaculture. Cirad, Ifremer, INRA, IRD, Université Montpellier 1. Diffusion Cirad-Montpellier, 144 p. Rey-Valette, H, Chia, E., Mathé S., Aquaculture and sustainable development: between regulation and governance systems.international Journal of Sustainable Development, 11: 16 p. Roque d'orbcastel, E., Blancheton, J.P., Aubin, J., Towards environmentally sustainable aquaculture: comparison between two trout farming systems using Life Cycle Assessment.Aquacultural Engineering, vol. 4, issue 3, pp Soto D. (eds), Integrated mariculture. A global review. No Rome, FAO. 183p. Soto D., Aguilar-Manjarrez J., Bermúdez J., Brugère C., Angel D., Bailey C., Black K., Edwards P., Costa-Pierce B., Chopin T., Deudero S., Freeman S., Hambrey J., Hishamunda N., Knowler D., Silvert W., Marba N., Mathé S., Norambuena R., Simard F., Tett P., Troell M. and Wainberg A.. Applying an ecosystem-based approach to aquaculture: principles, scales and some management measures 15. In : Soto, D.; Aguilar-Manjarrez, J.; Hishamunda, N. (eds) Building an ecosystem approach to aquaculture. FAO/Universitat de les Illes Balears Expert Workshop. 711 May 2007, Palma de Mallorca, Spain. FAO Fisheries and Aquaculture Proceedings. No. 14. Rome, FAO. 221p. Stevenson J.R., Irz X., Morissens P Les indicateurs de durabilité en aquaculture : l exemple des bassins côtiers aux philippines. Bordeaux aquaculture 2004, 3 pp The tuna ranching intelligent unit. Special November 2005, ICCAT Sevilla-Spain Meeting Edition. 99p. IUCN, La conservation du littoral. Eléments de stratégie politique et outils réglementaires. Shine C. and Lefebvre C., Scientific Eds. UICN Ed. Paris, 112 p. University of Stirling, 2004, Study of the market for aquaculture produced seabass and seabream species. Report to the European Commission DG Fisheries. 84p UNEP Action Plan for the protection of the marine environment and the sustainable development of the coastal areas of the Mediterranean (Map Phase II). 31p Williot P., Rôle de l aquaculture dans la conservation des espèces : exemple des esturgeons. Cemagref. UR ressources aquatiques continentales. Aquaculture et environnement. 8p. Wolowicz K., The Fishprint of Aquaculture. Can the Blue Revolution be Sustainable? Redefining Progress. 21p. WWF, International standards for responsible tilapia aquaculture. Tilapia aquaculture dialogue, 37p Millennium Ecosystem Assessment, Ecosystems and Human Well-being: Synthesis.Island Press, Washington, DC, USA, 137 pp. Zeijl-Rozema A.V., Cövers R., Kemp R, Materns P., Governance for sustainable development: A framework. Sustainable development, 16:
130 Internet sites consulted A) Websites Concerning Reference Frameworks for Sustainable Development Methodology.pdf pipk: ~thesitepk:469372,00.html
131 B) Websites Concerning Procedures for Establishing Sustainable Development Indicators
132 Annex 4 Analysis of the sustainability of Mediterranean aquaculture: case studies in France and Cyprus 33 Emmanuelle Roques, Quiterie Sourget, Hélène Rey-Valette #, Syndhia Mathé #, Edouard Geoffrey, Eva Moisset, François René, Jean-Paul Blancheton IFREMER, # Montpellier 1 University 1. Introduction From the typology of fish farms of the French Mediterranean and Cyprus, three types of farms using cage culture systems can be identified: small-scale farms producing less than 100 tonnes per year and large-scale farms producing over 500 tonnes per year. These farms are divided into two categories, according to whether their capital is familial or open. The aim of the study is to propose an analysis of sustainability of the Mediterranean aquaculture (considering two case studies, in Cyprus and France) that relies on this typology. 2. Materials and method The list of indicators selected for the Mediterranean is provided in Table 1. They consist in the indicators selected by Mediterranean actors and those coming from the list of indicators constituting a common base to the areas studied within the framework of the project. The description of their measure is provided in Table 2. Among all the farms surveyed, five provided the information requested, allowing for the quantification of 45 indicators selected during the surveys. Three are smallscale farms in France, and two are large-scale farms with familial capital, one located in France and the other in Cyprus. The analysis therefore relies on this information in addition to the information concerning a large-scale farm with open capital (a quantification of indicators according to experts), particularly well known by experts. The quantified indicators, taken from the enterprise or territory, were used for the analysis. The indicators of a common base, which had not been selected during the surveys on the Mediterranean Sea, were established according to experts. The ranking of the criteria was obtained by calculating the average scores of the corresponding indicators. The principles were ranked by calculating the average [mean] scores of the corresponding criteria. The principles, criteria and indicators (PCIs) were attributed to four pillars: economic, environmental, institutional and social. 3. Results 3.1 The indicators Forty-five quantified indicators, related to the enterprise or territory (marked E or T in Table 3), were used to establish the analysis. They consist of 13 indicators specific to the Mediterranean Sea. In total, 71 percent of the Mediterranean indicators consist of common indicators: 25 percent of Mediterranean indicators related to the territory and 53 percent related to the enterprise, and 22 percent related to both the enterprise and the territory. 33 The works presented here were carried out within the EVAD project of the ANR: 'Evaluation de la durabilité des systèmes de production aquacoles' ( ). 123
. Figures 1, 2, 3 and 4 show a radar representation, per pillar, of the values of the criteria values for the three types of farms.")
133 3.2 The criteria Overall analyses These indicators allowed to assign a score to the 34 corresponding criteria (Table 4). There are between 1 to 3 indicators per criterion, the average being 1.3; some of them have only one indicator (Table 5). Figures 1, 2, 3 and 4 show a radar representation, per pillar, of the values of the criteria values for the three types of farms. According to the economic pillar (or dimension) (Figure 1), the two large-scale farms seem more solid than the small-scale farms, with, albeit, three weak points regarding P2C3, P6C2 and P6C5, which correspond to the price differential according to quality, the practice of resource pooling of factors of production, and the fry coverage rate and average price. None of farms pool resources of factors of production. The strong points of the large-scale farms are, in particular, the nature and level of the investment earmarked for improving the environmental security of the farms (P6C6), which is understandable because the investment and amortization of such measures assume economies of scale that only exist in large structures. For similar reasons, the same distinction will be made for the percentage of innovative products proposed (P6C1). Figure 1 Overall Economic Analysis In the environmental pillar (Figure 2), the three types of farms are similar, with, nevertheless, a lower average for small-scale farms (with the exception for the improvement of strains, P4C512). With respect to P4C5I1 (Food Conversion Index), the difference noted between the different types of farms (large-scale, on the one hand, and medium- and small-scale, on the other) expresses the capacities of innovation and higher investment among the large-scale farms, in material (offshore installations) and in manpower and methods (better conversion rate linked to breeding practices such as automated food distribution management). Small-scale farms, for the most part confined to the coast (due to lack of investments), have more marked environmental impact (Self-purification Index and velocity under the lower cages, P3C6) than do large-scale farms, which could move towards the open sea (better renewal of the water column, thus dilution of wastes). 124
.")
134 Figure 2 Overall environmental analysis With respect to the social pillar (Figure 3), only small-scale farms are multifunctional, pluri-active (P10C5) and show a good participation to professional workshops (P9C5). They have the particularity of supplying local markets and having significant own consumption (P10C5); however, they provide a low quantitative contribution of fish supply (P1C1) and due to their size, a low impact on the number of permanent local jobs (P10C3). Figure 3 Overall social analysis Social P10C5 P1C1 4 3 P1C3 P10C5 P10C P1C4 P8C3 P10C3 P8C7 P10C3 P8C8 P9C5 With respect to the institutional pillar (Figure 4), the large-scale farms are, on average, in a better situation than the small-scale ones: however, small-scale farms are in a better position with respect to sustainable development strategies (P13C1) and research, training and support funds to the sector (P13C3). In this case Te, the weakness of the large-scale farms relies mainly on their autonomy through the internalization of research-training with respect to the small- and medium-sized structures. In addition, the privileged relationships (often having common training) between the managers of the large-scale farms and public research allows for a good circulation of information and innovation. 125


135 Figure 4 Overall institutional analysis Analysis of criteria related to the territory This analysis was conducted on the farms average (Figures 5 and 6). Figure 5 Analysis of economic and environmental criteria related to the territory The weak point in the economic and environmental pillar is the practice and resource pooling of factors of production (P6C2). 126
 and their compliance with a quality-based approach (P1C3).")

136 Figure 6 Analysis of social and institutional criteria related to the territory With respect to the social and institutional pillars, the weak points of the Mediterranean average mean concerns the level of the contribution to the local economy (P10C5) and their compliance with a quality-based approach (P1C3). Indeed, most of the production is for the export market: only a few small-scale enterprises have begun a quality-based approach. The lack of corruption and the duration/solidity of the current authorizations to farm (P13C2 and P7C7) are some of the strong points of the farms Analysis of criteria related to the enterprise This analysis was conducted per type of enterprise (small-sized and the average size among largesized). With regard to the economy and the environment, the predominance of large-scale farms can be observed with respect to the overall established criteria. In the Mediterranean space, which is highly dominated by the logic of a single and freely competitive market, economic and environmental survival relies on the large-scale enterprises. Figure 7 Analysis of the economic and environmental criteria related to the enterprise 127
; P4C5 (Improvement and selection of strains); P6C2 (Practice of resource pooling of factors")

137 Figure 8 Analysis of social and institutional criteria related to the enterprise In general, the large-sized enterprises have a better sustainability than the small ones, irrespective of the pillar of interest, except as concerns aspects related to criteria P2C3 (Price differential according to quality); P4C5 (Improvement and selection of strains); P6C2 (Practice of resource pooling of factors of production); and P9C5 (Participation of fish farmers in professional workshops). In fact, this is deceptive because, as mentioned above, it can be noted that although large-scale farms do not take part in workshops, they are nevertheless in a relatively close symbiosis with research due to the cultural background of their managers and the partnerships they have with public research. 3.3 The principles The score of each of the principles is obtained by the average of scores of the corresponding criteria. Figure 9 shows the number of criteria (from 1 to 7) having contributed to the final score of each of the principles. Figure 9 Number of criteria per principle 128
138 The number of criteria in principles P6, P7 and P8 reflects the fact that in this European Mediterranean framework, the predominance of the economy on which these three principles largely depend is observed everywhere. Figure 10 indicates the contribution of each of the principles to the different pillars. It can be observed that Principle 1 is found in three of four pillars. Figure 10 Number of times that each of the principles contributes to the four pillars 3,5 3 2,5 2 1,5 1 0,5 0 P1 P2 P3 P4 P5 P6 P7 P8 P9 P10 P11 P12 P13 Figures 11, 12, 13 and 14 represent the sustainability of the Mediterranean farms considered in this study, based on the principles. The economic, environmental and social sustainabilities only rely on four of the five principles, whereas institutional sustainability relies on six principles. Here, the predominance of the pillars related to the economy aptly expresses the unique market context that prevails in the entire Mediterranean dominated by Europe. In the economic dimension, the hierarchy is respected for four of the five principles (P1, P5, P6, P7: only P2 completely reverses this hierarchy at the level of local valorization) (locally added value per kg of product). This apparent reversal, however, comes from an economic choice in the specialization of the large-scale enterprises on a segment of the production cycle in order to benefit from the scale of this segment, at the risk of losing out on margin opportunities of locally added value. The analysis of the sustainability by principles confirms the trends of the analysis by criteria: the large-sized enterprises show, on average, a better sustainability profile than the small-sized ones, with the exception of principles 9 and 13 (social investment of enterprises and the role of the state and public actors in the implementation of sustainable development). 129


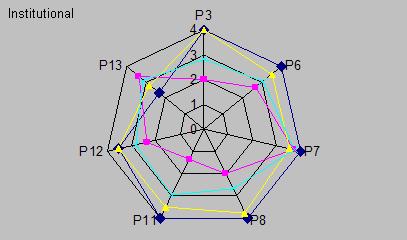
139 Figure 11 Representation of the economic sustainability of the Mediterranean farms studied Figure 12 Representation of the environmental sustainability of the Mediterranean farms studied Figure 13 Representation of the institutional sustainability of the Mediterranean farms studied 130
140 Figure 14 Representation of the social sustainability of the Mediterranean farms studied Social P10 P1 4,0 3,0 2,0 1,0 0,0 P8 P9 The analysis of the sustainability by principles confirms the trends of the analysis by criteria: the large-size enterprises show, on average, a better profile, with the exception of Principles 2, 9 and 13. Table 1 List of indicators of the Mediterranean region Code Pillar Indicators P1C1 / S and T Ec and soc Importance of availability of fish (quantitative contribution of the supply) P2C3 / S Ec Price differential according to quality P5C4 / S Ec Survival rate of well-conformed fish without lesions P6C1 /S Ec % of innovative products proposed each year P6C2 / S and T Ec Practice of resource pooling of production factors P6C3 / S Ec Frequency of extension operations and the importance of field actions /T P6C5 / S Ec Fry survival rate P6C5 / S Ec Fry coverage rate and average price P6C5 / S Ec Price per kg of commercial feed P6C6 / S Ec Nature and level of investments for improving the environmental security level of the farms P6C8 / S Ec Presence of a biological warning system P7C1 / S Ec Duration of the production cycle P7C2 / S Ec Average mortality rate of the stock P7C4 / S Ec Net result/e P7C4 / S Ec Own capital/ (own cap. and long-term loans) Self-financing/E P1C4 / S and T Env Weight of active substances (health products)/t of fish products P3C4 / S and T Env % of enterprises using prohibited products that are dangerous to the environment P3C4 /S and T Env Nutrient and suspended waste matter loads P3C6 / T Env Self-purification Index (environments capacity for resilience) P3C6 / S Env Average velocity of the current under the cages P4C1 / S and T Env Energy yield (kw/kg)/e P4C5 / S Env Food Conversion Index/E./. 131
141 P4C5 / S Env Enhancement and selection of strains /E P5C1 / T Env % of fish lost per escapement P3C7 / T Inst Existence of aqua-environmental measures (on the territory) P6C2 / S and T Inst and soc Participation in cooperatives and producer associations/ T P7C7 / T and S Inst Duration/solidity of current authorizations to farm P8C3 / S Inst and soc % of fish farmers trained by specialized training/t P8C5 / S Inst Discussions among fish farmers technical and scientific frameworks P11C2 / T Inst Number of controls per year and efficiency of control P12C3 /S Soc Number of partnership contracts P12C5 / S Inst Number of communication supports and extension services P13C1 / S Inst Presence of a sustainable development strategy P13C2 / S and T Inst Absence of corruption/t P13C3 / T Inst Presence of training, research and support funding to the sector/t P1C1 / S and T Soc Importance of availability of fish (quantitative contribution of the supply) P1C3 / S and T Soc Compliance and type of quality approach on the farms P1C4 / S and T Soc Concentration of preservatives and heavy metals P8C3 / S Inst and soc % of fish farmers trained by specialized training /T P8C7 / S Soc Number and nature of associations P8C8 / T Soc Number of sector representatives in the regulatory mechanisms P9C5 / S Soc Participation of fish farmers in professional workshops P10C3 / T Soc Number of permanent local jobs/t P10C3 / T Soc Number of permanent local aquaculture jobs P10C5 / T Soc Quantity produced for the local markets and own consumption P10C5 / T Soc Degree of development of local products/t P10C5 / T Soc Pluri-activity Pillars: Ec: economy Env: environment Inst: institutional Soc: social /S: indicators related to the enterprise /T: indicator related to the territory Table 2 Description of indicators and their measures Indicators Importance of availability of fish (quantitative contribution of the supply) Price differential according to quality t/year per persons employed Measures euros/kg (Price of high quality fish Price of standard fish) Survival rate of well-conformed fish without lesions Survival rate % of innovative products proposed per year Number of new products in % per year Practice of resource pooling of factors of production Frequency of extension operations and the importance of field actions/t Common tools Number per year Fry survival rate (Number of deaths/total number farmed) x 100 Fry coverage rate and average price Price per kg of commercial feed Nature and level of investments to improve the environmental security level of the farms Presence of a biological warning system Duration of the production cycle % of fry purchased (not belonging to the farm) x average price of an fry euros/ kg Euros invested/10 years Yes/no Number of months for one cycle (average) 132
142 Average mortality rate of the stock (Number of deaths/total number farmed) x 100 Net result/e Own capital/ (own capital + long-term loans) Self-financing capacity/e Weight of active substances (health product)/t of fish products % of enterprises using prohibited products that are dangerous for the environment Nutrient and suspended waste matter loads Self-purification Index (environments resilience capacity) Energy yield (kw/kg)/e Feed conversion Index/E Enhancement and selection of strains/e Net result/e Self-financing capacity/e Litres of health product used/t of fish product Frequency of use Rate of dilution Organic matter deposits no deposit of organic matter but modification of the flora no modification of the flora beneath the cages increase in the biodiversity under the cages Energy per kg of fish produced Food conversion ratio Genetically selected fry % fish lost per escapement (Number of fish lost per escapement/number of fish farmed)x100 Average velocity of the current under the cages Existence of aqua-environmental measures (on the territory) Participation in producer cooperatives and associations/t Duration/solidity of current authorizations to farm % of fish farmers trained by specialized training/t % Discussion among fish farmers technical and scientific frameworks m/h Yes/ no Number of cooperations and associations Number of years Number per year Number of controls per year and efficiency of the control Number of partnership contracts Number of communications supports and extension services Presence of a sustainable development strategy Absence of corruption/t Presence of research, training and support funding to the sector/t Number of controls per year of the chemical and biological quality, carried out by the producer Number of partnership contracts per year Number of supports Yes/no Number of research jobs and amount of funding earmarked per producer Importance of availability of fish (quantitative contribution of the supply) Compliance and type of quality approach on the farms Concentration of preservatives and heavy metals Number of fish farmers trained by specialized training/t % Number and nature of associations Number of sectoral representatives in the regulatory mechanisms Participation of fish farmers in professional workshops Numbers of permanent local jobs/t t/year (Production under a quality approach/total production)x100 mg/g of fish Number of associations on the territory with respect to aquaculture (fish farming) Average number of producers per meeting Number of participants per year Permanent local jobs per t produced Number of permanent local aquaculture jobs Quantity of product for the local markets and own consumption Degree of local product development/t Pluri-activity (Number of local, permanent aquaculture jobs/number of local jobs) * 100 Quantity produced for the local/national markets (% of total production) (euros spent for locally produced products/total euros spent for the products) x 100 Percentage of time dedicated to aquaculture 133
143 Table 3 The indicators of the Mediterranean region and average scores obtained per type of farm Code Pillar Large-scale open capital Small-scale Large-scale familial capital Mean for the Mediterranean P1C1 Ec and soc P2C3 Ec P5C4 Ec P6C1 Ec P6C2 Ec P6C3 Ec P6C5 Ec P6C5 Ec P6C5 Ec P6C6 Ec P6C8 Ec P7C1 Ec P7C2 Ec P7C4 Ec P7C4 EcTe P1C4 Env P3C4 Env P3C4 Env P3C6 Env P3C6 Env P4C1 Env P4C5 Env P4C5 Env P5C1 Env P3C7 Inst P6C2 Inst and Soc P7C7 Inst P8C3 Inst and Soc P8C5 Inst P11C2 Inst P12C3 Soc P12C5 Inst P13C1 Inst
144 Code Pillar Large-scale open capital Small-scale Large-scale familial capital Mean for the Mediterranean P13C2 Inst P13C3 Inst P1C1 Soc P1C3 Soc P1C4 Soc P8C3 Inst and Soc P8C7 Soc P8C8 Soc P9C5 Soc P10C3 Soc P10C3 Soc P10C5 Soc P10C5 Soc P10C5 Soc Table 4 Average score of criteria per type of farm Code Pillar Criteria Open Capital Largesized Smallscale G. C. F Closed capital largesized P1C1 / S and T Ec and soc Importance of availability of fish P2C3 / S Ec Level of development P5C4 / S Ec Type of farming and slaughtering practices [according to animalspecies] Average P6C1 /S Ec Level of diversification P6C2 / S and T Ec Existence of innovations P6C3 / S Ec Nature of relationship with research P6C5 / S Ec Control of supplies P6C6 / S Ec Control over access to sites P6C8 / S Ec Level of sensitivity to pathological risks P7C1 / S Ec Level of valorization of products and factors P7C2 / S Ec Level of production costs P7C4 / S Ec Level of financial autonomy P1C4 / S et T Env Presence of xenobiotics P3C4 / S et T Env Level of physico-chemical quality of the effluents P3C6 / S et T Env Respect for the carrying capacity P4C1 / S et T Env Energy control P4C5 / S Env Presence and level of strain selection P5C1 / T Env Importance of genetic pollution
145 Code Pillar Criteria Open Capital Largesized Smallscale G. C. F Closed capital largesized P6C7 / S Env Level of sensitivity to natural hazards P3C7 / T Inst Existence of management mechanisms P6C2 / S et T Inst Existence of innovations P7C7 / T et S Inst Transmission capacity of the enterprises P8C3 / S Inst and Soc Level of training P8C5 / S Inst Access to information P11C2 / T Inst Existence of control mechanisms P12C3 /S Inst Level of interaction between research and profession [industry?] Average P12C5 / S Inst Access to scientific and administrative data P13C1 / S P13C2 / S and T P13C3 / T Inst Inst Inst Level of national recognition of sustainable development Level of state involvement in sustainable development Level of state commitment with respect to the profession P1C1 / S and T Ec,Te and Soc Importance of availability of fish P1C3/ S and T Soc Nutritional level P1C4 / S and T Soc Presence of xenobiotics P8C3 / S Inst and Soc Level of training P8C7 / S Soc Existence and influence of unions P8C8 / T Soc Capacity of participating in decision-making P9C5 / S Soc Access to information P10C3 / T Soc Level of contribution to local employment and poverty reduction P10C5 / T Soc Level of contribution to the local economy Table 5 Principles, criteria and indicators (PCIs) selected in the Mediterranean Principle Criteria No. of criteria No. of indicators Indic./criteria P1 C1, C3, C P2 C P3 C4, C6, C P4 C1, C P5 C1, C P6 C1, C2, C3, C5, C6, C P7 C1, C2, C4, C P8 C3, C5, C7, C P9 C P10 C3, C P11 C P12 C3, C P13 C1, C2, C Total (average) 136
146 Table 6 Identity cards of the indicators (established for 27 indicators, including all those specific to the Mediterranean) Indicator Indicator number Measurement unit Source (principle; criteria: possibly, field) Traceability (if relevant) e.g. pillar linked to sustainable development Meaning of this indicator Interpretation of its variation Limits of the indicator Link with other data or indicators Internal sustainability within the systems or a contribution to sustainable development? Data source, availability and possible cost Annual production P1.C1.I1 T/ year per persons employed P1: Contribute to feeding society P1.C1: Fish availability Social pillar: 3 Economic pillar: 1 Environmental pillar: 3 The annual production of an enterprise allows to classify it in the typologies and thus understand the main objectives. The quantity produced provides an idea of the availability of this product on a given territory. When comparing this production to the number of persons employed, an idea of the economic profitability of a farm is provided. The growth of the indicator shows greater production (economic wealth) and a larger availability of food products on the markets. This criteria only deals with the total quantity produced independently of the profitability of the enterprise: a large production does not necessarily mean a profitable enterprise and thus a sustainable activity. An overly large production can be harmful to the environment and thus not sustainable in this pillar. Similarly, it is necessary to avoid overproduction by the farmers. Volumes exported (high level, processing) Internal sustainability and contribution to sustainable development Income statement of farms CIPA. DDAM Scale of the measure From 5 to 1000 Variation and trend Value of the indicator with the date reference Periodicity of the data A increasing trend towards increasing support to compensate for decrease in to the reduction of fish. capture fisheries Year The current purpose of the data Objective to reach Category of indicator Other comments Assess the production capacity of a farm Adaptation of production according to market demands. An increased production per person employed to ensure better economic profitability of the farms. Status indicator 137
147 Indicator Indicator number Measurement unit Use of antibiotics and veterinary products P1.C4.I1 mg/g Source (principle; criteria: possibly, field) Traceability (if relevant) e.g. pillar linked to sustainable development Meaning of this indicator Interpretation of its variation Limits of the indicator Link with other data or indicators Internal sustainability within the systems or a contribution to sustainable development? P1: Contribute to feeding society P1.C4: Presence of xenobiotics Social pillar: 1 Economic pillar: 2 Environmental pillar: 2 Xenobiotics are undesirable in the food because they have harmful effects on human health. The presence of xenobioltics in the product reduces the sustainability of the aquacultural system. The lowering of the indicator indicates a better quality of product. If the indicator oscillates, the cause of the xenobiotic arrival must be found. Does not take into account all the toxic molecules Internal sustainability of the system and contribution to sustainable development Data source, availability and possible cost Scale of measure Variation and trend Value of the indicator with the date reference Periodicity of the data Farm, Veterinary services From 0 to xx (value undetermined) Trend towards reduction in recent years (as a result of harsher laws and controls) Year Current purpose of the data To know the quality of the product. To ensure people s health. Objective to reach Reduction to 0 Category of indicator Status indicator Other comments 138
148 Indicator Indicator number Measurement unit Weight of active substances (health products)/kg of fish produced P1.C4.I2 Litres of health product used/t of fish product Source (principle; criteria: possibly, field) Traceability (if relevant) e.g. pillar linked to sustainable development Meaning of this indicator Interpretation of its variation Limits of the indicator Link with other data or indicators Internal sustainability within the systems or a contribution to sustainable development? Data source, availability and possible cost P1 : Contribute to the feeding of societies P1C4: Presence of xenobiotics Social pillar: 3 Economic pillar: 2 Environmental pillar: 1 The health products allow to control diseases; however, they pollute the natural environment. A reduction of health products leads to a greater environmental sustainability, but can reduce technical-economic sustainability. A compromise must be found according to the type of production and site. Does not take into account the active substances declared Internal sustainability, but above all, contribution to sustainable development Farm Scale of the measure 0 to 1 Variation and trend Value of the indicator with the date reference Periodicity of the data Current purpose of the data Objective to reach Category of indicator Other comments Control of the use of health products and reduction. Year Reduce to the minimum the use of health products and waste disposal in order not to disperse them in the natural environment. Response indicator 139
149 Indicator Indicator number Measurement unit Source (principle; criteria: possibly, field) Traceability (if relevant) e.g. pillar linked to sustainable development Meaning of this indicator Interpretation of its variation Limits of the indicator Compliance and type of quality approach. P2.C3.I1 % of production (production from a quality approach/total production approach) * 100 P2: Develop approaches to promote quality P2.C3: level of development Social pillar: 3 Economic pillar :1 Environmental pillar :1 The trend of efforts made with the quality approach is towards contractualization, i.e. an even better organization. This is considered to consolidate the sustainability of aquaculture system If the indicator increases, then sustainability increases. If the indicator oscillates throughout the years, it is necessary to more closely consider the reason for the variations and possibly revise the interpretation. The quality approaches differ and presents different commitments according to nature. The approach is more or less constrained and quite sustainable. Links with other data or indicators Compliance to quality approaches in the farms and type of quality approach (specifications, quality labels, etc.) Presence of a label and specifications Number of labels or approaches. % of labelled production Internal sustainability to systems or contribution to sustainable development? Data source, availability and possible cost Scale of the measure 0 to 100% Variation and trend Internal sustainability Farms, retailors, producers organization Increase in number of approaches and labels Value of the indicator with the date reference French Mediterranean: 3 producers/ 12 Periodicity of the data Current purpose of the data Objective to reach Category of indicator Other comments Cyprus: 0 Year Neither available, nor used Objectives are different according to the retailors and producer unions. Increase in approaches and meaningful labels. Response indicators 140
150 Indicator Indicator number Measurement unit Source (principle; criteria: possibly, field) Price differential according to quality P2.C3.I2 euros/kg (price of high quality fish price of standard quality fish) P2: Develop approaches promoting quality P2.C3 : Level of valorization Traceability (if relevant) e.g. pillar linked to sustainable development Meaning of this indicator Social pillar: 3 Economic pillar: 1 Environmental pillar: 3 Development of good quality products resulting from good farming techniques: respect for the environment Interpretation of its variation Limits of the indicator Link with other data or indicators Internal sustainability within the systems or a contribution to sustainable development? Source of the data, availability and possible cost Scale of the measure Variation and trend Value of the indicator with the date reference Periodicity of the data Current purpose of the data Objectives to reach Category of indicator Other comments Increase the difference between high quality products and standard or low quality products in order to encourage good farming practices, while keeping the product accessible to the market. A price difference is a sign of sustainability to promote the products of a quality approach. It is necessary, however, for the products of the quality approach to remain accessible to consumers. Foreign competitions can cause a drop in prices Internal sustainability and contribution to sustainable development retailors 0 to 10 Implementation of quality approaches in recent years with a price difference Year Stabilization of the indicator Status indicator 141
151 Indicator Indicator number Nutrient and suspended waste matter loads P3.C4.I1 Measurement unit kg of N dissolved N/year + Source (principle; criteria: possibly, field) Traceability (if relevant) e.g. pillar linked to sustainable development Meaning of this indicator Interpretation of its variation Limits of the indicator Link to other data or indicators Internal sustainability to systems or contribution to sustainable development? Data source, availability and possible cost kg of P dissolved P/year P3: Ensure that natural resources are respected and adapted to the environments capacity P3C4: Physico-chemical quality of the effluents Social pillar: 3 Economic pillar : 2 Environmental pillar: 1 Great quantities of nutrients and suspended matters of waste impact on the environment and are the cause of eutrophization of the environments. The wastes therefore must be controlled by filters and settling basins, among others. Further, the indicator can change according to the given food,. A reduction of the indicator indicates an increase in sustainability. The environmental impact is largely dependent on the characteristic of the site. Contribution to sustainable development Farm Scale of the measure 0 to 2 Variation and trend Value of the indicator with the date reference Periodicity of the data Current purpose of the data Objective to obtain Category of indicator Other comments Reduction under harsher regulations and thus the reduction of the use of poorer feed. Year To assess the impact of fish farming on the environment and the contribution of organic matter supplied in the environment Reduction of this indicator Status indicator 142
152 Indicator Indicator number Measurement unit Source (principle; criteria: possibly, field) Traceability (if relevant) e.g. pillar linked to sustainable development Meaning of this indicator Interpretation of its variation Limits of the indicator Link with other data or indicators Internal sustainability to the systems or contribution to sustainable development? Data source, availability and possible cost Scale of the measure Variation and trend Value of the indicator with the date reference Periodicity of the data Current purpose of the data Objective to obtain Category of indicator Other comments Self-purification Index (capacity of the environmental resilience) / Modification of the flora under cages P3.C6.I1 Deposit of organic matter M.O. beneath cages/no deposits but flora modification/no modification of flora/increase in biodiversity under cages P3: Ensure respect for the natural resources and adaptation to environmental capacity P3.C6: Respect the carrying capacity Social pillar: 3 Economic pillar: 3 Environmental pillar: 1 Capacity of the environment to regenerate itself, to use fish culture nutrients for its development A strong Self-purification Index indicates an increase in sustainability No or very few data available Internal sustainability but above all, contribution to sustainable development Farm (notice of environmental impact) Depends on the environment Year Adapt to the production load of a farm Status indicator 143
153 Indicator Indicator number Measurement unit Source (principle; criteria: possibly, field) Traceability (if relevant) e.g. pillar linked to sustainable development Meaning of this indicator Interpretation of its variation Limits of the indicator Link with other data or indicators Internal sustainability to the systems or contribution to sustainable development? Data source, availability and possible cost Scale of the measure Variation and trend Value of the indicator with the date reference Periodicity of the data Current purpose of the data Objective to obtain Category of indicator Other comments Dilution Index/average velocity of the current under the cages P3.C6.I2 m/h P3: Ensure respect for natural resources and adaptation to the environmental capacity P3.C6: Respect the carrying capacity Social pillar: 3 Economic pillar: 2 Environmental pillar: 1 Capacity of the environment due to the current water flow to dilute the waste, not to leave it concentrated in a certain area An increase in this Index increases the sustainability of a territory because in a given area the environment is less loaded. Calculating it is difficult. No available data. Contribution to sustainable development Not available Depends on the environment Season Status indicator 144
154 Indicator Indicator number Measurement unit Source (principle; criteria: possibly, field) Traceability (if relevant) e.g. pillar linked to sustainable development Meaning of this indicator Interpretation of its variation Limits of the indicator Link with other data or indicators Internal sustainability within the systems or a contribution to sustainable development? Data source, availability and possible cost Scale of the measure Variation and trend Value of the indicator with the date reference Presence of an aqua-environmental measure P3.C7.I1 Yes/no P3: Ensure respect for the natural resources and adaptation to the environmental capacity. P3.C7: Presence of management mechanisms Social pillar: 2 Economic pillar : 3 Environmental pillar: 1 The aqua-environmental measures allow for a better consideration of the natural and environmental milieu in order not to degrade it. The presence of such a measure on a territory increases the sustainability of the territory and aquaculture production systems. Effectiveness of the measure should be taken into account. The measures can be without effect or too limiting. Contribution to sustainable development Local authorities Yes/No Implementation under the effect of the EU and national regulation on water quality Periodicity of the data Current purpose of the data Objective to obtain Category of the indicator Other comments Year Presence of an aqua-environmental measure in all the sea territories Pressure indicator 145
155 Indicator Indicator number Measurement unit Source (principle; criteria: possibly, field) Traceability (if relevant) e.g. pillar linked to sustainable development Meaning of this indicator Interpretation of its variation Limits of the indicator Link with other data or indicators Internal sustainability within the systems or a contribution to sustainable development? Data source, availability and possible cost Number of accidents/loss of stock per escape eventment (tonnage, % production, value) P5.C1.I1 (Number of escapee fish lost per escapement/number of fish farmed) x100 P5: To protect the biodiversity and to respect animal welfare P5.C1: Importance of genetic pollution Social pillar: 3 Economic pillar: 1 Environment pillar: 1 The loss of stock causes an economic loss to the enterprise. Further, the farmed fish interact with the wild fish that do not present the same genotypes. This indicator is both an indicator of economic sustainability of the farm and of the environmental sustainability of the territory. The reduction of this indicator is directed towards an increase in sustainability. Not measured because it is considered negligible Internal sustainability and contribution to sustainable development Farm Scale of the measure 0 to 100 Variation and trend Reduction of losses due to more robust cages Value of the indicator with the date reference Periodicity of the data Current purpose of the data Year Statement of accounts of the farms Objective to obtain Category of indicator Other comments Reduction of the indicator to 0 in the short term Status indicator 146
156 Indicator Indicator number Measurement unit Source (principle; criteria: possibly, field) Number of innovative products proposed P6.C1.I1 Number of products (for a species) + number of species P6.C1: Level of diversification P6: Increase the capacity to cope with uncertainties and crises Traceability (if relevant) e.g. pillar linked to sustainable development Meaning of this indicator Interpretation of the variation Limits of the indicator Link with other data or indicators Internal sustainability within the systems or a contribution to sustainable development? Data source, availability and possible cost Social pillar: 3 Economic pillar: 1 Environmental pillar: 2 A high number of products proposed position the farm on several types of markets, which contributes to its sustainability. This indicator reflects the technico-economic sustainability of the farm. Increasing the number of products proposed allows them to adapt to the market, to cope with possible crises affecting a specific type of product, and to satisfy the client. The increase of the indicator increases sustainability. P6.C1.E2: Number of products P6.C1.E1: Number of species produced Internal sustainability Farm Scale of the measure 1 to 20 Variation and trend Value of the indicator with the date reference Periodicity of the data Current purpose of the data Objective to obtain Category of indicator Other comments Reduction in the number of products proposed for certain types of specialized farms Year Statement of accounts of the farms Increase the number of products proposed according to the size of the farms Status indicator 147
157 Indicator Indicator number Measurement unit Source (principle; criteria: possibly, field) Traceability (if relevant) e.g. pillar linked to sustainable development Meaning of this indicator Interpretation of its variation Limits of the indicator Link with other data or indicators Internal sustainability within the systems or a contribution to sustainable development? Data source, availability and possible cost Fry coverage rate and average price P6.C5. I1 % fry bought x average price of a fry P6: Increase the capacity to cope with uncertainties and crises P6.C5: Control of supplies Social pillar: 3 Economic pillar: 1 Environment pillar: 3 The indicator assesses the expenses made to supply fry (of external hatcheries). A low price and weak dependence on hatcheries is a sign of sustainability. Reduction of the Indicator increases the sustainability of the farm system. Access to hatchery services Internal sustainability Farm Scale of the measure 0 and 10 Variation and trend Value of the indicator with the date reference Periodicity of the data Current purpose of the data Objective to obtain Depends on farms Year Assess the expenses of a farm Category of indicator Other comments Status indicator 148
158 Indicator Indicator number Measurement unit Source (principle; criteria: possibly, field) Fry and larvae survival rate P6.C5. I2 Number of fry of the first phase of the cycle / number of fry farmed x 100 P6: Increase the capacity to cope with uncertainties and crises P6C5: Control of provision. Traceability (if relevant) e.g. pillar linked to sustainable development Meaning of this indicator Interpretation of its variation Limits of the indicator Link with other data and indicators Internal sustainability within the systems or a contribution to sustainable development? Data source, availability and possible cost Social pillar: 3 Economic pillar: 1 Environmental pillar: 3 The quality of the fry is an important indicator of good farming productivity. A good fry survival rate improves a farm. The increase of the indicator indicates an increase in the sustainability of production systems. A poor fry survival rate may be due to a poor fattening farm and not to the poor quality of fry Internal sustainability Farm Scale of the measure 0 to 100 Variation and trend Value of the indicator with the date reference Periodicity of the data Current purpose of the data Increase in survival rate due to improved control of the fry production Year To assess the performance of a hatchery. To assess the performance of a fattening farm. Objective to reach Increase the survival rate to 100% Category of the indicator Other comments Status indicator 149
159 Indicator Indicator number Measurement unit Source (principle; criteria: possibly, field) Price of 1 kg of commercial feed P6.C5.I3 euros/ kg P6: Increase capacity to cope with uncertainties and crises P6.C5: Control of supply Traceability (if relevant) e.g. pillar linked to sustainable development Meaning of this indicator Interpretation of its variation Social pillar: 3 Economic pillar: 1 Environmental pillar: 3 Proportion of feed costs in the farm budget. Indicator of the financial sustainability of a farm. Stabilization or reduction of feed prices so that all farms access to quality feed. Limits of the indicator Link with other data or indicators Internal sustainability within the systems or a contribution to sustainable development? Data source, availability and possible cost When the indicator lowers, sustainability increases. Internal sustainability Farm Scale of the measure 0.5 to 5 Variation and trend Value of the indicator with the date reference Periodicity of the data Current purpose of the data Objective to obtain Category of Indicator Other comments Year Statement of accounts of farms and feed producing plants enterprises Reduction of prices Status indicator 150
160 Indicator Indicator number Measurement unit Source (principle; criteria: possibly, field) Traceability (if relevant) e.g. pillar linked to sustainable development Meaning of this indicator Interpretation of its variation Limits of the indicator Link with other data or indicators Internal sustainability within the systems or a contribution to sustainable development? Data source, availability and possible cost Scale of the measure Variation and trend Value of the indicator with the date reference Periodicity of the data Current purpose of the data Objective to obtain Category of indicator Other comments Investments to improve the level of environmental safety of fish farms (displacement of cages) P6.C6.I1 euros invested/ten years P6: Increase capacity to cope with uncertainties and crises P6.C6: Control of access to sites Social pillar: 3 Economic pillar: 1 Environmental pillar: 2 Economic capacity and viability of the enterprise for investing. Commitment of the farm in complying with the necessary environmental conditions for its smooth operations. The investment made can provide better production results and thus a good return on investment. Internal sustainability Farm 0 to infinitely Depends on farms Year Statement of account of the farms Increase in the level of investment to improve the environmental security of the cages Response indicators 151
161 Indicator Indicator number Measurement unit Source (principle; criteria: possibly, field) Traceability (if relevant) e.g. pillar linked to sustainable development Meaning of this indicator Interpretation of its variation Limits of the indicator Link with other data or indicators Internal sustainability within the systems or a contribution to sustainable development? Data source, availability and possible cost Scale of the measure Variation and trend Value of the indicator with the date reference Periodicity of the data Current purpose of the data Objective to obtain Category of indicators Other comments Presence of a biological warning system P6.C8.I1 Yes/no P6: To increase the capacity to cope with uncertainties and crises P6.C8: Level of sensitivity to pathological risks Social pillar: 3 Economic pillar: 3 Environmental pillar: 1 Fish farming can play the role of biological warning: wild species diseases contaminate the farm species. The presence of a biological warning system increases the sustainability of the territory. Contribution to sustainable development Farm, Veterinary service Yes/No Year To detect diseases of wild species The presence of a biological warning system Response indicator 152
162 Indicator Indicator number Measurement unit Source (principle; criteria: possibly, field) Traceability (if relevant) e.g. pillar linked to sustainable development Meaning of this indicator Interpretation of its variation Limits of the indicator Link with other data or indicators Internal sustainability within the systems or a contribution to sustainable development? Data source, availability and possible cost Scale of the measure Variation and trend Value of the indicator with the date reference Periodicity of the data Current purpose of the data Objective to obtain Category of indicator Other comments Duration of the production cycle P7.C1.I1 Average number of months for one cycle P7: Strengthen the sustainability of the farms P7.C1: Better valorize the production factors Social pillar: 3 Economic pillar: 1 Environmental pillar: 3 The control of the production cycle represents the management of an aquaculture enterprise. The reduction of the production cycle improves the technical performance of enterprises and produces an economy benefit. An increase in the indicator increases the sustainability of farming systems. Respecting the duration of the production cycle is interpreted as a sign of animal welfare. An excessive reduction of the production cycle can be negatively perceived. Seabass: 20 months Sea bream: 30 months Internal sustainability Farm Depends on species produced A reduction influenced by the use of genetically modified organisms that grow faster in less time. Cycle Reduction of the cycles Response indicator 153
163 Indicator Indicator number Measurement unit Source (principle; criteria: possibly, field) Traceability (if relevant) e.g. pillar linked to sustainable development Meaning of this indicator Interpretation of its variation Limits of the indicator Link with other data or indicators Internal sustainability within the systems or a contribution to sustainable development? Data source, availability and possible cost Average mortality rate of the stock P7.C2.I1 (Number of deaths/total number farmed) x 100 per cycle P7: Strengthen the sustainability of the farms P7.C2: Reduce production costs Social pillar: 3 Economic pillar: 1 Environmental pillar: 2 Low mortality rates indicates good farm management. This indicator reveals an aspect of economic viability of the enterprise. Mortality rate is also an indicator of the state of the environmental milieu, which influences animal welfare The reduction of the mortality rate makes it possible to have a better economic return of an enterprise, which increases the farm s sustainability. An improvement in the production technique allows for this reduction in the mortality rate. It does not describe the mortality profiles (acute or chronic) Fish sold (out of refusal)/ fish farmed Internal sustainability Farm Scale of the measure 0 to 100 Variation and trend Value of the indicator with the date reference Periodicity of the data Current purpose of the data Reduction influenced by a better quality of fry and a better control of diseases Cycle Objective to obtain Reduction to 0 Category of indicator Other comments Assessment of the performance of a farm Status indicator 154
164 Indicator Indicator number Measurement unit Source (principle; criteria: possibly, field) Traceability (if relevant) e.g. pillar linked to sustainable development Meaning of this indicator Interpretation of its variation Limits of the indicator Link with other data or indicators Internal sustainability within the systems or a contribution to sustainable development? Data source, availability and possible cost Duration of current authorizations to farm P7.C7.I1 Number of years P7: Strengthen the sustainability of enterprises P7.C7:Transmission capacity of enterprises Social pillar: 3 Economic pillar: 1 Environmental pillar: 3 The duration of authorizations to farm is decided by the administration. An authorization request must be renewed at the end of each control and this renewal is accompanied by a notice of environmental impact. The increase in the duration of authorizations to farm ensures a stronger sustainability of the enterprises, above all, in the countries where it is difficult to obtain an authorization to farm on the public maritime domain. Internal sustainability Farm, DDAM Scale of the measure 10 to 100 Variation and trend Value of the indicator with the date reference Periodicity of the data Current purpose of the data Objective to obtain Category of indicator Reduction of the duration of authorizations to farm due to concerns of environmental impacts Year At the legislative level Stabilization or increase in the duration of authorizations Status indicator 155
165 Indicator Indicator number Measurement unit Source (principle; criteria: possibly, field) Traceability (if relevant) e.g. pillar linked to sustainable development Meaning of this indicator Interpretation of its variation Limits of the indicator Link with other data or indicators Internal sustainability within the systems or a contribution to sustainable development? Data source, availability and possible cost Number of sectoral representatives in the regulatory measures P8.C8.I1 Average number of products/meetings P8: Strengthen the organization and the identity of the sector P8.C8: Participation capacity in decision-making Social pillar: 1 Economic pillar: 3 Environmental pillar: 3 Taking into account the professional milieu by the institutions and producers interest in these institutions. The enrollment of sector representatives allows for the creation of acceptable standards by all and thus applicable by all. The increase of this indicator increases sustainability. Contribution to sustainable development Producer organization, administration Scale of the measure 0 to 100 Variation and trend Value of the indicator with the date reference Periodicity of the data Current purpose of the data Objective to obtain Category of indicator Other comments Increase in the number of producers invited by the institutions Year Representation of all the types of professionals in all the types of meetings Response indicator 156
166 Indicator Indicator number Measurement unit Source (principle; criteria: possibly, field) Specialized training/participation of fish farmers in professional workshops P9.C5.I1 Frequency number of participants/year P9.C5: Access to information P9: Strengthen professional identity of the aquaculture profession Traceability (if relevant) e.g. pillar linked to sustainable development Meaning of the indicator Interpretation of its variation Limits of the indicator Link with other data or indicators Internal sustainability within the systems or a contribution to sustainable development? Data source, availability and possible cost Social pillar: 1 Economic pillar: 3 Environmental pillar: 3 Producers investment in the social identity of the profession and in the development of their activity. An increase in participation increases sustainability. Internal sustainability Farm Scale of the measure 0 to 10 Variation and trend Value of the indicator with the date reference An increase in the number of workshops and thus the participation of professionals Periodicity of the data Current purpose of the data Objective Indicator category Other comments Year Ensure a minimum frequency of workshops (1/month) in all the aquacultural regions Status indicator 157
167 Indicator Indicator number Measurement unit Source (principle; criteria: possibly, field) Traceability (if relevant) e.g. pillar linked to sustainable development Meaning of this indicator Interpretation of its variation Limits of the indicator Link with other data or indicators Internal sustainability within the systems or a contribution to sustainable development? Data source, availability and possible cost Number of permanent local aquaculture jobs P10.C3.I1 (Number of permanent local aquaculture jobs/number of local jobs)x100 P10: Strengthen the role of aquaculture in the development of the territory P10.C3: Level of contribution to local employment and poverty reduction Social pillar: 1 Scale of the measure 0 to 100 Variation and trend Value of the indicator with the date reference Periodicity of the data Current purpose of the data Objective to obtain Category of indicator Other comments Economic pillar: 2 Environmental pillar: 3 Estimate of number of jobs due to aquaculture in the region; size of aquacultural economy in the region. The decline in the number of direct jobs is not a positive sign, especially if it continues or increases. A sector depends on the diversity of its jobs and the complementarity between direct and indirect jobs. The origin of the employees in the aquaculture field (nationality, training, etc.) Contribution to sustainable development Employment administration services Depends on territories Year Estimate of number of jobs provided by a sector. Increase in the number of jobs in the region where aquaculture should be developed. Stabilization of the number of jobs in the regions where aquaculture is already highly developed. Status indicator 158
168 Indicator Indicator number Measurement unit Source (principle; criteria: possibly, field) Traceability (if relevant) e.g. pillar linked to sustainable development Meaning of this indicator Interpretation of its variation Limits of the indicator Link with other data or indicators Internal sustainability within the systems or a contribution to sustainable development? Data source, availability and possible cost Degree of valorization of local products (fry, feed, agroindustrial subproducts) P10.C5.I1 (euros paid for products of local production/total euros paid for the products) x 100 P10: Strengthen the role of aquaculture in the development of the territory P10.C5: Level of contribution to the local economy Social pillar: 1 Economic pillar: 1 Environmental pillar: 3 Availability of quality products of the farming sector in the region This indicator expresses a dynamic in the region. An increase of this indicator shows an aquaculture sector that is well integrated in the region and generates income: an increase in sustainability. Marketed quantity per hatchery per species per territory Contribution to sustainable development Farm Scale of the measure 0 to 100 Variation and trend Value of the indicator with the date reference Periodicity of the data Current purpose of the data Objective to obtain Category of indicator Other comments Year Increase in the indicator Status indicator 159
169 Indicator Indicator number Measurement unit Source (principle; criteria: possibly, field) Traceability (if relevant) e.g. pillar linked to sustainable development Meaning of this indicator Interpretation of its variation Limits of the indicator Link with other data or indicators Internal sustainability within the systems or a contribution to sustainable development? Data source, availability and possible cost Number of controls/year of the chemical and biological quality of the environment P11.C2.I2 Number/year of chemical and biological controls per farmer P11: Promote participation and governance P11.C2: Presence of control mechanisms Social pillar: 3 Economic pillar: 2 Environmental pillar: 1 Expresses the involvement of the producer in the smooth operations of his or her enterprise. A degradation of the environment indicates a threat of a pathological crisis. An increase in the number of controls of the environment, especially during periods that are susceptible to environmental degradation. An increase of the indicator contributes towards an improvement in sustainability. Susceptibility to degradation of the quality of the environment varies according to where the farm is located Contribution to sustainable development Farm Scale of the measure 0 to 50 Variation and trend Value of the indicator with the date reference Periodicity of the data Current purpose of the data Objective to obtain Category of indicator Other comments Depends on farmers Year Increase in the number of controls to one per week Environmental pressure indicator 160
170 Indicator Indicator number Measurement unit Source (principle; criteria: possibly, field) Traceability (if relevant) e.g. pillar linked to sustainable development Meaning of this indicator Interpretation of its variation Limits of the indicator Link with other data or indicators Internal sustainability within the systems or a contribution to sustainable development? Data source, availability and possible cost Number of partnership contracts P12.C3.I1 Scale of the measure 0 to 10 Variation and trend Value of the indicator with the date reference Periodicity of the data Current purpose of the data Objective to obtain Category of indicator Other comments Number of partnership contracts/year P12: Strengthen research and information related to the sector P12.C3: Level of interaction between research and industry Social pillar: 1 Economic pillar: 2 Environmental pillar: 3 The partnership contracts allow the producers and scientists to work in cooperation in order to try to respond to the needs of the farms with the help of science. An increase in the indicator leads to an increase in sustainability. Internal sustainability Farm, research organization Creation and increase of cooperation Year Not available Extend participatory trials and the partnership contracts to all of the farms in the short term Response indicator 161
171 Indicator Indicator number Measurement unit Source (principle; criteria: possibly, field) Traceability (if relevant) e.g. pillar linked to sustainable development Meaning of this indicator Interpretation of its variation Limits of the indicator Link with other data or indicators Internal sustainability within the systems or a contribution to sustainable development? Data source, availability and possible cost Number of communication supports and extension services of the sector P12.C5.I1: Presence of an extension service Number/year Scale of the measure 0 to 30 Variation and trend Value of the indicator with the date reference Periodicity of the data Current purpose of the data Objective to obtain Category of indicator Other comments P12: Strengthen research and information related to the sector P12.C5: Access to scientific and administrative data Social pillar: 1 Economic pillar: 2 Environmental pillar: 2 Extension and communication allows the producers to know the advancements in the field and also to raise awareness of aquaculture among the public at large. The increase of the indicator shows an increase in sustainability Internal sustainability and contribution to sustainable development Farm, producer organization, new organizations. Strengthening extension services on producers request Year Increase the indicator in the short term to promote the development of the activity Response indicator 162
172 Indicator Indicator number Measurement unit Source (principle; criteria: possibly, field) Traceability (if relevant) e.g. pillar linked to sustainable development Meaning of this indicator Interpretation of its variation Limits of the indicator Link with other data or indicators Internal sustainability within the systems or a contribution to sustainable development? Data source, availability and possible cost Scale of the measure Variation and trend Value of the indicator with the date reference Periodicity of the data Current purpose of the data Objective to obtain Category of indicator Other comments Implementation of sustainability approaches P13.C1.I1 Yes / No P13: Strengthen to role of the state of public actors in the implementation of sustainable development P13.C1 : Level of National recognition of sustainable development Social pillar: 2 Economic pillar: 2 Environmental pillar: 2 Involvement of the producer in sustainable development, and the will to develop his or her farm sustainability. This approach reduces conflicts with stakeholders. The implementation of a sustainable development approach increases sustainability. Effectiveness of sustainability approaches. They can have no effect or can be too constraining. Internal sustainability Farm Yes / No Implementation of the approach in some farms Year Implementation of a sustainability approach in all the farms in the short term Response indicator 163
173 Annex 5 Towards the implementation of sustainable development of aquaculture in the Mediterranean: the conditions of governance Syndhia Mathé and Hélène Rey-Valette Montpellier 1 University 1. Introduction Due to its cross-cutting character, sustainable development leads to the delimitation of new institutionalized zoning and thus new territories. This leads to recompositions with respect to public actions processes, power relations among actors and multiple structures of cooperation between territories, which raises our interest in territorial governance. And yet, the territory-based implementation of sustainable development already occurs within a context of territorialization and contractualization of public policies. This has led to the multiplication of decision-making units and territories, both at the infra- and supranational level, even in structures of coordination having a territorial competence (Allaire, 2006). By advocating for the development of integrated approaches, sustainable development requires the designing of project territories as relevant frameworks for its implementation. Due to its integrated character, sustainable development poses the question of the coordination of this plurality of areas, beyond the traditional issues of coordination between socio-economic and environmental areas. The challenges of integration and participation therefore tend to produce, or allow to emerge, new regulatory and administrative territorial planning tools, but also more spontaneous forms of the institutionalization of places of exchange (committees, commissions, etc.) and the creation of mechanisms to promote voluntary commitment. The professions, the trades, and generally, the sectoral coordination instruments (industry collective agreements, committees of industrial standardization, etc.) are institutional orders that create the market space, while the structures of territorial coordination linked to sustainable development participate both in the structuring of sectors and the organization of public spaces. These characteristics strengthen the development of public action and the coordination towards new institutional logics that rely on organizational and institutional community mechanisms. A territory could then be defined by the established competences that make up their limits and a government capacity. Each territory has government capacities and measures or instruments of public action (Allaire, 2006). This is analogous to the approaches that consider organizations as creators of specific competences relying on learning processes, in which the territory is considered a place for cooperation, and a producer of collective capacity and innovation dynamics (Allaire, 2006). It is therefore appropriate to pay particular attention to the regulatory systems or more generally, governance. Further, sustainable development, through its emphasis on taking into consideration stakeholders understood as an undelineated collective, raises the issue of borders between organizations in order to promote the processes of collective coproduction of objectives and rules governing the regulation of the relations between actors and institutions. This is part of a logic of territorial collective action and requires specific tools and mechanisms so that the actors will interpret, be involved, mobilize and be recruited. Their presence and form of these mechanisms reflect the local interpretation of governance. They consist in arenas for transmitting information, negotiation and collaboration, and for common reflection on integrated and sustainable development of a territory. According to their type and methods of their application, these structures, which are more or less institutionalized and formalized, involve stakeholders to a certain extent. They carry out the institutional changes that involve sustainable development and require the learning of new forms of collective action by the actors. Through these new forms of collective action, we can highlight the role of the mechanisms of co-construction and the assessment of the sustainable development indicators. Actors discussions of the principles, criteria and indicators of sustainable development generate learning that not only promotes a cross-cutting vision, but also an integrated vision of sustainable development. The actors will be led to discuss what makes sense for them and the compatibility 164
174 between what makes sense for them and which makes sense for others. In situations where there is no significant conflict, this type of mechanism encourages a convergence of viewpoints and the construction of a common vision. 2. The co-construction of Principles Criteria Indicators (PCIs) for the sustainable development of aquaculture in the Mediterranean 2.1 Analysis of choices made in the selection of PCIs The implementation of sustainable development requires the collective definition of objectives. Therefore, the general principles must be defined on a common basis, while taking into account what is specifically at stake with respect to the scope of the desired implementation of sustainable development. The construction of PCIs of sustainable development of Mediterranean aquaculture needs to take into account, on the one hand, the geographical extension of the area, the diversity of the contexts and the diversity of types of aquaculture farms. Therefore, the Mediterranean requires the construction, on the one hand, of a common set of indicators and, on the other hand, country-specific indicators. The meeting for the launching of the InDAM project (27 to 28 November 2008) allowed to construct a first draft of principles and criteria. They were selected on 27 November by the experts present, including ten researchers, two institutional experts, one producer and one representative of civil society organizations (NGOs). The experts carried out the selections from a list containing 13 principles and seven criteria the principles and criteria that seemed to them to be priority important secondary or to be integrated later. Following this classification, a mathematical treatment was carried out. It consisted in constructing scores for each principle and criteria by attributing weights to each qualifier (Priority: 8, Important: 4, To be integrated later: 2, Secondary: 1), which were attributed to them by the experts. The highly selected principles and criteria, i.e. those that have the highest scores, have therefore been highlighted. In sum, ten principles and 32 criteria are part of this category. The second day of the meeting started with the presentation of this work. The list of criteria and principles served as the basis for discussions to construct the list of PCIs of sustainable development of aquaculture in the Mediterranean. The participants essentially discussed the principles, which allowed for their reintegration, but also reformulation, thus establishing a new list of 13 principles. The second meeting of the InDAM project (24 th to 26 th February 2009) aimed to continue the discussions on the principles and criteria by setting up three focus groups: the first on the economic pillar, the second on the environmental pillar and the three combining the social and institutional pillars. These two meetings led to the construction of a list of PCIs for the sustainability of aquaculture in the Mediterranean (Figure 1). Here, we would first like to carry out a comparative analysis of the principles and criteria selected, and then compare the selected principles with the recommendations of the referential concerning sustainable development of aquaculture. 165
175 Figure 1 Traceability of the PCIs of sustainable development of aquaculture First InDAM meeting The starting list taken from the EVAD Guide; 13 principles 78 criteria Selection, then mathematical treatment 10 principles 32 criteria 13 principles Collective discussion Second InDAM meeting Discussions per focus group 14 principles 67 criteria 156 indicators The overall processing of selections shows that a balance occurs between the pillars when working on the viewpoints of several types of actors. Indeed, a levelling occurs when it is observed that the actors, due to their role and knowledge of sustainable development, will favour one or two dimensions of sustainable development. The experience of the EVAD project shows that the actors very rarely have a cross-cutting vision of sustainable development. In general, they have an access per pillar, which is conditioned by the improvement of their professional or social situation. Therefore, the producers in general select the principles and criteria corresponding to the environmental pillar, while the institutional actors select the aspects concerning regulation and the environment. The vision of sustainable development of the participants opens to other dimensions following discussions with actors having different viewpoints. This situation results in a form of consensus that can be consolidated due to the sustainability, that is, the institutionalization of the participants discussions into the mechanisms. The same process can be observed in the selection carried out during the InDAM project (Figure 2). When the selection of principles is considered according to categories of participants, 34 it can be observed that the institutional pillar was highly selected by the actor-producer, the institutional actors and the researchers. The environmental pillar was favoured by the representative of civil society and researchers. However, the technico-economic pillar was more highly selected by the civil society actor than by the producer, which is explained by the latter s particular status and position. 34 Ten research scientists, two institutional experts, one producer and one civil society representative 166
176 Figure 2 Representation of pillars of sustainable development according to categories of participants TECH_ECO 8,0 6,0 4,0 2,0 INST 0,0 ENV SOC ADMIN PROD RECh SOCIV Mean Changes and additions were made following collective discussions on the principles during the first and second meetings. In sum, four principles were reintegrated and the principles of the economic and environmental dimensions were reformulated (Table 1). Table 1 List of the principles throughout the various stages of the construction of the list of PCIs for sustainable development of the Mediterranean First meeting First discussion on principles Second meeting Increase the capacity to cope with uncertainty and crises Strengthen farm sustainability Develop approaches that promote quality Economic dimension Increase the adaptation capacity to cope with uncertainties and crises (risk assessment and strategies to meet challenges) Strengthen the long-term future of the enterprise Promote market-oriented aquaculture activities Strengthen risk assessment and crisis management capabilities Strengthen financial management of enterprises (ST and LT) Strengthen consumer response and market-oriented aquaculture Strengthen the role of professional organizations for the economic sustainability of aquaculture./. 167
177 Ensure respect for the natural resources and adaptation to the environmental capacity. Improve the ecological yield of the activity Contribute to fulfilling the nutritional needs of societies. Strengthen the role of aquaculture in regional development Promote participation and governance Strengthen research and sectorrelated information Strengthen the role of the state and of public actors in implementing sustainable development Environmental dimension Respect the carrying capacity, assess and control the environmental impact Improve the ecological footprint of the activity Respect biodiversity Social dimension Contribute to food security and healthy nutritional needs Strengthen the role of the professional organization in improve image of aquaculture, social awareness, and responsibilities Strengthen corporate social responsibility (respect animal well-being) Governance dimension Strengthen integration of aquaculture in local development Promote participation in decision- making processes Strengthen research, information systems and extension services Strengthen institutional capacities with respect to sustainable development Minimize the global impact of aquaculture Minimize the local impact on environmental conditions and biodiversity Respect the ecological service of ecosystem Contribute to food security and healthy nutritional needs Strengthen the role of the producer organizations and NGOs to improve image of aquaculture, social awareness, and responsibilities Strengthen corporate social responsibility Strengthen integration of aquaculture in local development Promote participation in decision-making processes Strengthen research, information systems and extension services Strengthen institutional capacities with respect to sustainable development At first, the comparative analysis of the selected criteria shows a strong reintegration of criteria in the technico-economic, environmental and social dimensions (Table 2). Indeed, during the first InDAM meeting, the results of the criteria selections showed an overabundance of institutional aspects (Figure 3). These aspects refer to governance and constitute one of the main challenges for Mediterranean aquaculture today, particularly through the development of integrated coastal zone management (ICZM) measures (Chia et al., 2008b). The experience of the EVAD project shows that the actors tend to make a selection according to aspects whose sustainability is the weakest. The approach is perceived by the actors as a management and programming tool to make it possible to positively change their aquaculture systems. 168
178 Table 2 Number of PCIs selected during the first and second InDAM Montpellier meetings according to their dimensions First meeting Principle Criteria Indicators Second meeting First meeting Second meeting First meeting Second meeting Social Governance Economic Environmental Total Figure 3 Distribution of principles and criteria selected according to the dimensions of sustainable development 100% 90% 80% 70% 60% 50% 40% 30% 20% 10% 0% First meeting Second meeting Principles First meeting Second meeting Criteria Environmental Economic Governance Social The comparative analysis of criteria according to whether they concern the sustainability of aquaculture systems or whether they concern the contribution of aquaculture to sustainable development of the areas shows that the re-integrations essentially dealt with the criteria that take into account two levels of sustainability (Table 3). 169
179 Table 3 Distribution of a number of criteria selected during the first and second InDAM Montpellier meetings according to dimensions and the scale of sustainability to which they correspond Sectoral level Territorial level Both First meeting Second meeting First meeting Second meeting First meeting Second meeting Economic Social Environmental Governance Total The comparative analysis of selections shows some of the conclusions that resulted from the EVAD project with respect to the strategies used by the actors to make their choices during the selections. At first, they make their choice according to their status. Then, following collective discussions, they make their choice according to the issues of sustainability emerging on the territory. Thus, this approach shows the procedural and local character of the actors strategy and strengthens interest in a social construction of sustainable development. Another noteworthy point is the development of a cross-cutting vision of sustainable development by the actors throughout the collective discussions. This point allows to stress once more that in the approach to the co-construction of sustainable development, the priority is not centred on a statistic representiveness of participants, but on the representatives of the widest possible diversity of points of view. Along the same lines, the importance of a representation of types of enterprises should be pointed out: the assessment of sustainable development of aquaculture leads to the consideration not only of the overall sustainability of the sector, but also consideration of sustainability profiles that can be diversified according to strengths, constraints and weaknesses of the enterprises. These profiles can be, according to the types of enterprise, either very homogenous, i.e. expressed by actions rather than cross-cutting types, or more contrasting, in which case, the improvement of sustainability must undergo targeted policies (Figure 4). 170
180 Figure 4 Profiles of sustainability according to types of enterprise (Cyprus and France) Large size - private capital small size Large size - familial capital average P13 State and public actors P12 research and sector related P11 governance information P1 nutritional needs 4,0 3,5 3,0 2,5 2,0 1,5 1,0 0,5 0,0 P2 quality P3 carrying capacity P4 ecological yield P10 local development P5 biodiversity and welfare P9 social investment P8 sectorial organisation P6 crisis P7 long term future Source: Blancheton et al., Comparing the selected principles to the recommendations for sustainable development of aquaculture This is a review of the issues and recommendations found in the referentials and initiatives of sustainable development not only in aquaculture (Mathé et al., 2009), but also with respect to overall referential indices of sustainable development, such as Agenda 21, World Food Programme (WFP), integrated coastal zone management (ICZM), the national strategy of sustainable development, the Mediterranean strategy of sustainable development. These recommendations and exhortations must be taken into account in order not to disassociate the principles of sustainable development from the regulatory frameworks. Therefore, in these paragraphs, we suggest to compare the principles with different recommendations and exhortations of regulatory frameworks on sustainable development and on the sustainable development of aquaculture. In total, 120 recommendations and issues of global and aquaculture sustainable development were listed, which were reduced to 37 by grouping three fields of intervention, and then per theme (Figure 5). 171
181 Figure 5 Thematic organization of recommendations and exhortations for sustainable development of aquaculture Intervention on the ecological and socioeconomic environment Socio-economic vulnerability Socio-economic impact Recommendations and exhortations for the sustainable development of aquaculture Intervention in the enterprise Method of production Individual action Sustainable development strategy Adaptability of laws Intervention on the institutional capacity Access to information and communication Institutional maturity Implementation of the participation It is important, therefore, in each country, and specifically, in each of the pilot sites, to study the regulatory frameworks, but also the rules of law allowing for compliance of the principles of sustainable development of aquaculture. This would allow, on the one hand, to confirm whether or not they are contradictory, and, on the other hand, to link the representations of the actors to the rules that govern and influence their behaviour and their value systems. Therefore, Table 4 shows the compatibility of principles with the recommendations, despite the integration and modifications on the original principles that were built according to the actors representatives and regulatory frameworks (Rey-Valette et al., 2008). Also, this comparison allows us to note that four important aspects were not taken into account first, the aspects concerning assessment and monitoring other than environmental, but also those aspects concerning producers self-control. They were stressed as being important by the producers when the surveys were carried out under the EVAD project in In addition, in France, a response to this request was provided by the implementation of CIPA self-assessment indicators (IDAqua Project). The second aspect that has not been taken into account refers to adapted development through skills and training according to the development of aquaculture. This point was particularly emphasized in the CONSENSUS project, but also in the recommendations for sustainable aquaculture in Egypt (El-Gayar, 2003). The third aspect concerns development and use of new technologies highlighted in the Holmenkollen Guidelines for sustainable aquaculture. Finally, the fourth aspect is highlighted by the International Union for Conservation of Nature (IUCN) and concerns the encouragement of private initiatives. 172
182 Table 4 The compatibility of principles of sustainable development of the Mediterranean aquaculture with recommendations for sustainable aquaculture Principle of sustainable development of Mediterranean aquaculture Recommendations and exhortations on sustainable development of aquaculture Organization/geographical area Economic dimension Strengthen risk assessment and crisis management capabilities Promote the diversification of production Maximize technical efficiency Brittany region Philippines Support regional trade originating from aquaculture products NEPAD 173 Strengthen the financial management of enterprises (ST and LT) Improve the efficiency of the activity Guarantee the sustainability and development of aquacultural enterprises CONSENSUS Brittany region, Philippines Strengthen consumer response and marketoriented aquaculture Produce quality products at all stages of the aquacultural process Use management procedures that can improve the quality of aquacultural production FEAP, Holmenkollen Holmenkollen Strengthen the role of professional organizations in economic sustainability of aquaculture Strengthen and pursue the structuring of the production chain of the sector and overall coordination Promote and strengthen the structuring of socio-professional organizations Brittany Region, ASEAN- SEAFDEC IUCN, FEAP
183 Environmental dimension Minimize the global impact of aquaculture Ensure the sustainable management of resources fished for fish farming IUCN, Holmenkollen, Philippines, NACA, WWF, Holmenkollen Minimize the local impact on environmental conditions and biodiversity Respect the ecological services of the ecosystem Protect the environment: waste management, conservation, develop local ecological diversity and maintain water quality CIPA, APFA, EU, IUCN, Brittany Region, NACA, WWF, Holmenkollen, Philippines, CONSENSUS, Egypt Social dimension 174 Contribute to food security and healthy, nutritional needs Contribute to providing food at the global level (food security) Ensure food safety and product quality Holmenkollen NACA, WWF, CONSENSUS, CIPA Strengthen the role of the producer organizations and NGOs to improve the image of aquaculture, social awareness, and responsibilities Improve mutual understanding to improve the image of aquaculture CONSENSUS, FEAP, Brittany region, Holmenkollen, CIPA, APFA Promote equality between men and women UICN Develop and manage the farms in a socially responsible manner NACA, WWF Strengthen corporate social responsibility Manage the health and welfare of the species farmed (diseases, mortality, etc.) CONSENSUS, NACA, FEAP, WWF, CIPA, APFA, EU Establish, implement and enforce appropriate laws and regulations to ensure responsible aquaculture Holmenkollen, CONSENSUS, Egypt
184 Governance dimension Strengthen integration of aquaculture in local development Contribute effectively to rural and local development (economic weight, employment) Give priority to integrated development NACA, WWF, CIPA, CONSENSUS, Holmenkollen, IUCN, Philippines, EU Holmenkollen, NEPAD, United Republic of Tanzania Place aquaculture as a structuring element of the development of the territory Brittany region, CIPA 175 Promote participation in decision-making processes Ensure the participation of all stakeholders in decision-making Respect and take into account the interests and values of all resource users Canada, Holmenkollen, ASEAN-SEAFDEC, FEAP, CIPA Canada Acquire and disseminate knowledge with the aim of promoting innovation, continued learning and effectiveness Canada Strengthen research, information systems and extension services Share and disseminate data related to aquacultural activity Cooperate with research ASEAN-SEAFDEC FEAP, IUCN, Brittany region Develop new strategies of communication and promotion by the representatives of European producer associations, at the sector level CONSENSUS Strengthen institutional capacities with respect to sustainable development Establish a national plan/strategy on aquaculture development Holmenkollen, NEPAD, ASEAN-SEAFDEC, UICN, Canada, FEAP, NACA, WWF
185 3. The assessment of governance for the implementation of sustainable development: issues, current conditions and problems The review of the literature on the assessment of governance (Rey-Valette and Antona, 2009) shows an overabundance of monographic studies at the expense of comparative approaches or approaches that have a more theoretical than generic scope. If one is interested in assessing governance, it is important that its outlines be defined, since governance by its multiform and multi-actor characters (Zeijl-Rozema et al., 2008) leads to varied semantics. Indeed, governance refers to, on the one hand, good governance, which consists in the improvement and quality of national institutions, as mentioned by donors. On the other hand, governance also refers to a method of government where the state no longer has a monopoly on decisions taken following the participation, of various degrees of importance, by other actors, such as civil society and the enterprises. This type of governance thus ranges from providing information directly to the actors to joint decision-making, i.e. the involving all the actors in the decision-making process. The governance assessment therefore leads to defining a framework that would allow both to measure governance as a tool (Zeijl-Rozema et al., 2008) and also as an objective allowing to achieve the objectives of sustainable development, that is, as the fourth pillar of sustainable development (Goxe, 2007, Rumpala, 2008). 3.1 The value of measuring governance Decentralization and, at the same time, globalization will increase the need for governance indicators. Abundant literature underlines the importance of governance assessment (Arndt and Oman, 2006). Van De Walle (2005) found three uses: (i) by the donor community in order to justify their support to development; for investment decisions by enterprises who seek to assess the risks and the competitiveness in the host countries starting from the data provided by rating agencies; and finally (ii) by academic research to study the links between institutions, growth and economic development. The diversity of uses is one of the factors that contribute to explaining the heterogeneity of the initiatives and the indicators. According to Van Dooren and Lonti (2010), with reference to the efficiency of the public administrations, the assessment allows to highlight the major role played by the administration and its services. In our case, the assessment of governance represents the double challenge of showing, on the one hand, that governance is one of the components of the sustainability of aquaculture and, on the other hand, that it allows to improve this sustainability. 3.2 The governance indicators: a review of the literature criticism and assessment The state of art regarding the initiatives and the indicators We carried out an inventory on initiatives related to this category in order to be able to examine the available indicators with the aim of applying them to our case study, i.e. to the aquaculture regulatory system. We listed around 60 initiatives of constructing and assessing governance (ICEGs) that allowed us to list over 360 indicators, when the indicators were available. It is difficult to establish their subjective or objective character as the methodology of constructing the indicators is not always subject to available and accessible information. We classified these initiatives in order to be able to analyse the aspects of governance that they allow to clarify. However, it is difficult to establish a typology of the initiatives that process governance indicators because there are almost as many types of methods. Therefore, as in the case of social indicators, there is no real consensus on the methodology of developing governance indicators. This has direct consequences on the indicators since each initiative develops its own criteria and indicators according to the elements of governance that they would like to approach. We can, nonetheless, draw some characteristics of methods that we have listed according to the use and aims of the data, the type of initiator organizations, type of data collection and the scale of governance taken into account. It was near the end of the 1990s, under the World Bank initiative and its Research Department, that initiatives to develop governance indicators began to emerge. These types of initiatives would 176
186 experience an important growth following development of thought about the role of institutions in growth and economic development (World Bank, 2002, UNDP, 2002), and international trade and investment (ODI, 2007), thus placing emphasis on the business component of governance. These considerations explain their significant development at the national level and, above all, in the developing countries 35. The construction and assessment of ICEGs can be classified into six groups that are representative of the different elements of governance approached and the purposes of the ICEGs: (i) the banks and other international donors; (ii) the intergovernmental organizations and the expert, national and international support organizations; (iii) NGOs, private interest groups and foundations; (iv) the statistics institutes; (v) research, universities and think tanks): and (vi) the rating agencies. Since these groups have different aims, together they will construct varied indicators. In fact, the aim of the assessment of governance is for these organizations to carry out comparisons, monitor any progress (competiveness, capacity, human development, Millennium Development Goals, etc.), assess variables of attractiveness, improve the methodology of the assessment of governance; and improve governance by establishing recommendations. There are numerous governance indicators of different types, fields and natures. Despite this variety, many of these indicators are similar and others tend to become true institutions. However, as previously mentioned, there are no governance indicators that create consensus as there are for the social indicators. The complexity of the situation to be assessed does not make it possible to develop indicators that are as unifying as the GDP. Therefore, in the ICEGs, the indicators are divided both according to a thematic classification and according to a classification linked to the principles resulting from the implicit hypotheses on governance. Indeed, some ICEGs measure different components of governance, by distinguishing, for example, public or political governance of economic governance (Manasan et al., 1999) and social governance (UN, 2007). Other classifications such as those of the UNDP (2007) treat the dimensions of governance that divides the governance indicators into ten components: (i) accountability and strengthening of civil society; (ii) communications, the press and the media; (iii) decentralization; (iv) the electoral system; (v) strengthening capacities to manage; (vi) the parliamentary system; (vii) peace and stability; (viii) public administration; (ix) the rule of law and human rights; and (x) socio-economic management. The other type of classification of indicators in the ICEGs do not focus on the nature of governance, but on the existence or non-existence of a specific number of priorities or principles of governance: responsibility, participation, transparency and information, predictability, presence of a legal structure, efficiency of the public sector, social development, economic management, decentralization of decision-making, competitiveness, flexibility, variety of trajectories and institutions, and anticipation. These assessments thus give greater importance to the assumed impact of governance than on the process itself. With respect to other indicators (economic, environmental, social), one sees very little of the monetarization approach in the assessment of governance. Nonetheless, despite this, these indicators are often subject to aggregation in order to construct synthetic indices that sometimes call to question the opacity of aggregation methods used and the theoretical basis of these aggregations. The best known and most cited aggregated indicators are the six indicators of the World Bank, 36 the worldwide indicators of governance (Apaza, 2008). 35 They will be developed later within the enterprises (Stern and Holder, 1999) and for the urban areas (Holzer and Kim, 2004, UNDP, 2009) Voice and Accountability (VA) capturing perceptions of the extent to which a country's citizens are able to participate in selecting their government, as well as freedom of expression, freedom of association, and a free media. 2. Political Stability and Absence of Violence/Terrorism (PV) capturing perceptions of the likelihood that the government will be destabilized or overthrown by unconstitutional or violent means, including politically motivated violence and terrorism. 3. Government Effectiveness (GE) capturing perceptions of the quality of public services, the quality of the civil service and the degree of its independence from political pressures, the quality of policy formulation and implementation, and the credibility of the government's commitment to such policies. 4. Regulatory Quality (RQ) capturing perceptions of the ability of the government to formulate and implement sound policies and regulations that permit and promote private sector development. 5. Rule of Law (RL) capturing perceptions of the extent to which agents have confidence in and abide by the rules of society, and in particular the quality of contract enforcement, property rights, the police, and the courts, as well as the likelihood of crime and violence. 6. Control of Corruption (CC) capturing perceptions of the extent to which public power is exercised for private gain, including both petty and grand forms of corruption, as well as "capture" of the state by elites and private interests (Kaufmann and al., 2008). ( 177
187 These indicators refer to the processes of democratization, institutional environments at the macroeconomic level and the level of economic activities, as well as the efficiency of the public authorities. The Organisation for Economic Co-operation and Development (OECD) is concerned with indicators that are larger than those relating to the efficiency of the tasks of the public sector, that is, linked to the process, inputs, outputs and outcomes of the public sector and to the previous situations and constraints that explain the efficiency and effectiveness of the public sector. They appeared in October 2009 and concerned three OECD countries. These ICEGs concern the general aspects of governance, whereas other initiatives can base the indicators on aspects such as democracy, freedoms (Polity IV, Freedom House, etc.), accountability, performance of public administration, as well as corruption. A distinction is made between major corruption that concerns the relationships between the state-and business, and minor corruption, which affects the relationships between citizens and administrations (Meisel and Ould Aoudia, 2007). We have surveyed the governance indicators that we classified by category and subcategory to make them coincide with our governance study grid, that is, that of regulatory systems (Chia et al., 2008a). Table 5 Current situation of the categories covered with respect to governance assessment Categories ENVIRONMENTAL INSTITUTIONAL MACRO-ECONOMIC INSTITUTIONAL ENVIRONMENT OF THE ECONOMIC ACTIVITY Subcategories Macro-economic conditions, operations of institutions, the judiciary system, transparency/opacity, corruption, political stability, national security and conflicts, decentralization Regulations (credit, accounting, contacts, markets, competition), right of ownership, shareholding, risk, the financing system and the banking system Number of indicators FREEDOMS AND EMPOWERMENT LIVING AND WORK CONDITIONS Economic and civil freedoms, freedom of the press, and empowerment of civil society and local actors. Education, health, well-being and security, work POLITICAL EFFECTIVENESS AND PUBLIC ORGANIZATIONS Accountability, coherence and efficiency of public policies, quality of the administration/bureaucracy, action of the state in economic activity 69 DEMOCRATIZATION PROCESS AND PARTICIPATION Openness of the administration, participation and trust, means of communication and information, governance devices, partnerships, dialogue and relationships 36 TOTAL
188 The available governance indicators are sometimes considered as too generic and macro-economic with respect to our case study, but their study has allowed us to identify a direction towards the study of governance at the local scale and to establish the link between the local and national levels. The indicators of the process of democratization and participation are those indicators that are closest to our conception of governance, but they only represent 10 percent of the indicators identified Criticisms of the governance indicators Some articles and works deal with criticism on the best known indicators including the works of Arndt and Oman (2006) on the use of governance indicators. More recently, Apaza (2008) reviewed the debates on the three main criticisms related to governance indicators of the World Bank, which are essentially methodological. The first concerns questions the reliability of comparing indicators insofar as this entails aggregated indicators coming from different sources that have different measuring objectives. The second criticism concerns the transparent character of the different data sources of governance indicators and their accessibility, even though these two elements are indeed characteristics of governance. The third concerns the predominant role occupied by subjectivity in the assessment of governance indicators (Malik, 2002), and the question of impartiality in treatment with respect to national contexts, i.e. the levels of development (Court et al., 2002). Other methodological criticism that belongs more to problems, concern the loss of precision linked to the use of aggregation and to the lack of indicators for certain elements of governance (Kaufmann et al., 1999). Baslé (2004) questions the method of developing the World Bank indicators, which are defined in terms of international benchmarking by postulating a harmonization of good governance models and thus not taking into consideration multiculturalism. The construction of governance indicators clashes with the same problems as those faced by the social sciences in constructing social indicators due to the difficulty in assimilating the reality of governance in one that is directly measureable. For Desrosières (1997) The indices and indicators are the indirect and imperfect expressions of an overly complex reality. [ ] The social indicator is a presentation on society. Therefore, as with the social indicators, one cannot justify the choice of a system of governance indicators on a conceptual construction that is as stable and universal as the construction that is the basis for economic indicators (Perret, 2002). The objectives of governance are many, and quantification must be subject to a consensus, which should therefore rely on a social choice of indicators. This social choice could concern two levels: that of experts and that of governance stakeholders. The choice of experts refers to the issue of the theoretical foundations in the selection of governance indicators, which, up until now, has been largely neglected to the benefit of the formulation of hypotheses on good universal practices (international benchmarking), encouraging the countries to compare themselves to good students. This choice also poses the question of the quality of the indicators, i.e. their univocal character (lack of ambiguity), their representativeness (a figure represents several phenomena), their regulatory clarity, their reliability, regularity and comparability (time and space) (Perret, 2002). The second level of choice promotes the contingency of governance indicators, but underlines the question of the existence of a common numeraire allowing to make comparisons. Baslé (Ibid.) proposes the creation of a common background but with a regional benchmarking approach (Europe, USA, etc.) by thus considering the context, the values and the institutions, and by using multicriteria and compared methods of analysis (cross-examination). Another solution is to use the measure of common criteria (where the choice would be left essentially to experts), taking into account the theory of governance and based on contextualized indicators (where the choice would be jointly decided with the actors). 3.3 Assessment of the governance indicators: towards a change in paradigm The assessment of governance therefore raises the question of the methods of assessing the institutional dynamics implemented and created by applying measures linked to sustainable development. This assessment must take into account different institutional functions of the measures thus created, i.e. learning, organizational innovation, a co-construction of standards, and the reduction of management costs. These functions refer to those of indicators that do not merely constitute an object to be measured (Hildén and Rosenström, 2008). The assessment of the processes of governance 179
189 implies qualifying the new methods of public action from the point of view of their composition and their operations. According to Conan (1998), this entails studying the operating principles, the time and approaches, to which it is appropriate to add, for territorial governance, the scale and the territories. Therefore, the assessment of governance processes must take into account aspects that are both external (i.e. between the mechanism and its environment) and internal (the mechanism itself). The assessment of governance processes generally requires a change in the level of assessment in order to consider the overall aspects that relate to governance, particularly the objectives. The inventory of types of approaches concerning the assessment of governance shows the inadequacy of the analysis of the effects of these processes. The hypotheses could be made that this lack is partly due to the difficulty in mobilizing the referential or the variables that account for the types of impacts. Then, an explanation of these aspects is necessary to strengthen the assessment of governance processes. The complexity and the diversity of governance processes together with the necessary flexibility of the co-constructed approaches lead, on the contrary, to maintaining and promoting the necessarily incomplete character of the indicators and the procedures. Indeed, this pluralistic and procedural concept of the assessment is particularly adopted to the diversity of the strategies and practices of the governance processes. As a result, it would be futile to try to construct a unified body of practices and indicators of governance assessment. It is appropriate, rather, to determine a change of the strategy for a more participatory assessment to the learning of actors, as much in the field of assessment as in governance. Thus, it no longer only concerns assessing the governance processes, but rather, strengthening them by assessing them. In fact, as underlined by Cadiou (2007), expertise now tends to be considered as a collective knowledge production process represented in the open plans to be included in the re-composition of local actor systems. It increasingly appears that beyond the issue of appropriating the assessment results, the latter constitute a useful resource for all of the actors. This explains the emphasis placed on the formative dimension of the assessment, which is then perceived as a process of learning and mobilization, and which comes closer to the notion of empowerment. According to Baslé (2008), the assessment becomes a support practice of coaching and advice for co-constructed political solutions. Therefore, the participatory assessment (Baslé, 2008; Baron and Monnier, 2003) of governance, due to the properties of collective learning that it involves, in fact consists of a tool for strengthening governance, which must institutionalize these protocols and assessment measures within a logic of reflexivity. These approaches therefore have promising implications in terms of the procedural approach of collective action (Perret, 1996) and the strengthening of the actors autonomy and capacity. As mentioned by Baslé (2008), assessment can give rise to an agreement as soon as it allows to demonstrate, to provide proof and to enrich the debate. It is therefore, according to this author, the key to good government in the sense that to assess is to jointly construct the direction, to construct by choosing the path, and by learning to do it by collaborating together. This allows to quantitatively and qualitatively increase the knowledge shared by the actors involved in its process (Baslé, 2008), thus leading this author to speak of collective intelligence. Similarly, for Bourdin et al. (2004), Assessment is more than just an instrument or service of a more effective public management. It is the political approach that will allow to revitalize the method of governance of our country if it is truly independent, pluralistic, transparent and efficient. Therefore, as Conan (1998) underlines, the assessment of public policies can contribute to collective research on the common wellbeing and deepen the critical awareness of actors by facilitating the development of knowledge owned by the actors and by promoting the expansion of their capacity to act. This entails creating the conditions of a collective work that develops mutual understanding, the contents of contradictions and the conflicts, and the forms of action (Conan, 1998). All of these characterizations show the value of assessment as a tool of the communicational logic advocated by Habermas (1981). According to Conan (1998): participatory assessment is the opportunity to launch debates on the meaning of the common good linked to the object assessed and thus consists in a form of dialogue allowing to produce a shared point of view on the common good to pursue." It allows, in the case of integrated policies that characterize the territorial projects, to question the traditional situation of the fragmentation of the principles of sectoral legitimation of public action, which is identified by Conan 180
190 (1998) as a constraint to assessment. These proprieties are strongly observed when sustainable development is being assessed (Rey-Valette et Mathé., 2009). Indeed, defining common meaning to the sustainable development concept is fundamental for its appropriation, due to the change in the referential and the arbitration that it assumes and that should be carried out within public debate. 4. The indicators of governance for the sustainable development of aquaculture 4.1 A scarcity of institutional sustainability indicators The institutional sustainability indicators are rarely found in the literature on the sustainable development indicators of aquaculture. The survey of sustainable development indicators carried out resulted in nine institutional indicators out of 142 surveyed (i.e. 6 percent of the indicators against 51 percent for the environmental indicators). Although we have previously shown the importance of institutional aspects, this result shows the weak significance given to the institutional sustainability indicators for the aquaculture sector. The nine institutional indicators resulted from either research initiatives (Madec, 2003; Gonzales et al., 2003) or initiatives based on large participation of actors (Consensus, IUCN/FAO). The indicators can be divided into three topics: the openness of the sector (participation) and compliance with the rules and institutional maturity (Table 6). It appears that the topic mostly approached in terms of number of indicators was that of participation, while the most cited indicators concerns compliance with the rules through the number of complaints linked to product quality and safety. OPENNESS OF THE SECTOR Table 6 Institutional sustainability indicators Number of agents in the sector participating in integrated catchment management Number of regional communication activities on the methods of production and benefits of the product on health Development of regional, specific approaches (union or non-union): recommendation guidelines, etc. newsletters, Concern for the transparency of actors in the sector: regular presentation of the results of analyses on the concentration of toxic components and antibiotic residue in fish flesh Ratio of farms working with the public services Participation of stakeholders COMPLIANCE WITH THE RULES Number of written statements established for the non-compliance of prefectoral decrees Number of complaints linked to product quality and safety INSTITUTIONAL MATURITY Number of professionals subscribed to the local producer unions and for CIPA Source: Mathé et al., 2006 Other indicators were constructed following the IADQUA project (a French project brought by the CIPA profession). It highlights the openness of the sector through the indicators of local integration of the site (raise awareness on the activity and to communicate), network density (strengthen the links between farms, suppliers and clients) and professional involvement (exchange information between professionals and participate in the development of policies and standards related to the sector). It also highlights the organization of the space with an indicator on Efforts in integrating the site (maintaining the site and architectural integration). These four indicators of institutional sustainability 181
191 represent 13 out the total number of project indicators. The integration of this dimension arises from the need for a strong territorial integration of French aquaculture. The results of the institutional sustainability indicators highlight the need to strengthen this dimension through the proposal of coconstructed indicators, thus allowing for the construction of contextualized institutional sustainability indicators. Considering the low number of institutional sustainable indicators for aquaculture, the indicators of the EVAD project were identified by going beyond the aquaculture context and relying on other projects related to fishing, GIZC, Agenda 21, the Scheme of Territorial Consistency (SCOT), etc., but also by applying the proposals made by the actors interviewed. The list of PCIs from the EVAD project (Rey- Valette et al., 2008) includes four principles, 24 criteria and 75 institutional sustainability indicators (Table 6.11), which represent around 30 percent of the reference list that consists of 13 principles, 81 criteria and 234 indicators. Therefore, the institutional dimension is largely represented. The indicators are both qualitative and quantitative, and are measured both from the point of view of the sustainability of the aquacultural sector (S) and according to the contribution of aquaculture to the sustainability of the territories (T). 4.2 The assessment of governance indicators and the comparison of profiles of institutional sustainability of the areas of study in the EVAD project The EVAD approach to developing institutional sustainability indicators with respect to aquaculture allowed to develop indicators that are both territorialized and also respond to a logic of genericity and adaptability. When these indicators were measured on the six study areas, it was shown that there is no profile type of institutional sustainability, but that these profiles are highly dependent on territorial issues. This result is in line with works carried out up on the governance indicators, most of which are focused on a macro social scale, and on the general indicators relating to the logic of benchmarking to a very global scale, leaving little room for possibilities of institutional diversity and the influence of institutional profiles of the countries (De Crombrugge et al., 2009). For each study areas, institutional indicators were measured through surveys and according to experts on a scale of growing sustainability ranging from 1 (weak sustainability) to 5 (strong sustainability). The measure corresponds to the change in the situation with respect to the objective of the sustainability to be achieved (principles). These measures make it possible to establish an analysis of institutional sustainability in each study area. Starting from criteria that are common to the different study areas, we were able to make comparisons. In order to facilitate the interpretation of the assessments of sustainability, we have adopted the form of green highlights for the higher level classes of sustainability (4 and 5) and red highlights for the scores belonging to the lower classes (1 and 2); class 3 corresponds to the average scores that remain neutral. Figure 6 shows three profiles: (i) Brittany, Tangkit and Cirata: (ii) the Mediterranean: and (iii) Cameroon and the Philippines. The first group constitutes the one where the highest number of green highlights was recorded; they correspond to the criteria concerning the relationship with research, participation and governance. Concerning the second profile, there is an average profile with levels of weak sustainability in the contrition of the activity to the sustainability of the territory. These weak sustainabilities concern the recognition of the activity, involving its participation in the participatory mechanisms and its consideration in territorial management. Finally, the last profile corresponds to the areas containing the more red highlights for sustainability. 182
192 Figure 6 Stylized presentation in terms of advantages (dark grey) and constraints (light grey) of the results of the institutional sustainability analysis per area at the level of sustainability criteria P6C2 P8C3 P8C4 P8C5 P8C6 P11C3 P12C2 P12C3 P12C4 P12C5 P13C1 P13C3 P13C2 Presence of innovations Level of training Importance of networks Access to information Image of aquaculture Level of participation Importance of training in aquaculture Level of interaction between research and industry Access to information systems on aquaculture Access to scientific and administrative data Level of national recognition of sustainable development Level of state commitment with respect to the industry Level of state involvement in sustainable development Farms Brittany Cameroon Mediterranean Tangkit Cirata Philippines P8C4 P10C9 P11C1 P11C3 P11C5 P13C1 P13C4 Importance of networks Importance of local representation in the sector Level of comprehensibility of the industry Level of participation Level of management and territorial planning Level of national recognition of sustainable development Capacity of governance mechanisms Territory Brittany Cameroon Mediterranean Tangkit Cirata Philippines These comparisons are in line with existing interactions between the degrees of sensitivity to sustainable development and farmers accountability. The Mediterranean and Indonesia are in intermediate situations, when considering their context. The comparison of situations and the institutional characteristics of these fish farming systems allow us to verify the strong interaction between sustainability and the territorial inscription of aquaculture systems, as well as the important role of the socio-technical networks with two determining factors, which are the relationship with research as well as the levels and forms of professional organization. The projection of sustainability rankings obtained by the different fish farming systems in terms of factorial level allow to establish a typology of aquaculture systems from the point of view of their institutional capacities with respect to territorial integration, which stresses the role of individual and collective learning within the territorial integration of aquaculture. This learning is achieved, on the one hand, through professional structuring and governance on the territory, and on the other hand, according to the level of growing individual knowledge of regulations (Mathé et al., 2009). The process of learning and appropriating sustainable development, when taking into account previous conditions, appears to be endogenous to a group (of a variable size) and/or a territory (of variable scales). Nevertheless, specifically, for its assessment, it must also be possible to compare it with other experiences, hence the need for common indicators at higher levels. This requires a convergence between local approaches. This convergence could occur according to several forms, which cover two of the modalities proposed by Aggeri at al. (2005). This could be achieved a posteriori as opportunities and needs for comparison arise, through a gradual bringing together of chosen forms of information and support. This approach thus depends on a process of rapprochement through mimetic. It can be strengthened by resorting to common consultants or experts who have the same concept of sustainable development emerging from an epistemic community. The convergence can also be sought a priori, according to the qualified logic of professionalization by Aggeri et al. (2005). In this case, it can be facilitated through the implementation of guidelines proposing a set of references from which the actors select the composition that appears to them to be best adapted to the issues, and the level of institution and informational organization that characterize their group. Therefore, it is appropriate not only to convert know-how, but also, within a logic of communication, to make it known in such a way 183
193 as to gradually widen the field of the new standard so that it may be recognized by the greatest number. 5. Conclusion: governance in practice and institutional sustainability The taking into account of the assessment refers to the strength of quantification in the representation of the world, and according to this representation, the taking into account of governance must undergo quantification. Nevertheless, the complexity of governance demands, on the one hand, reflection on the conditions and modalities of assessment, but also on its theoretical and philosophical foundations. Sustainable development, and more particularly, the mechanisms of governance required through its implementation, introduces a new link, i.e. reciprocity between the assessment and its subject. There is an interactive evolution of both the subject and the assessment. This co-evolution assumes a change in assessment strategy, particularly in public policies. Indeed, it seems necessary to rethink the instruments of public policies with respect to: multidimensional objectives; the reconciliation of the private and public dimensions in the implementation of sustainability; and in the consideration of the conditions of sustainable development appropriation and implementation. The assessment of sustainable development policies must involve the construction of a system of indicators that is both territorialized (irrespective of the scale) and multidimensional. The construction of such a system of indicators requires the integration of actors representations and interests, and therefore, to rethink the role of research in supporting public policies thus understood. The sustainable development indicators are the results of choices and not natural laws. Therefore, the assessment approaches must take into account the nature of indicators (process or state). In addition, it is recommended that they rely on co-construction mechanisms benefiting from both the advantages of bottom-up and top-down approaches so as to facilitate participation. This type of co-construction approach of indicators allows both to contextualize the indicators by adapting to local values, but also to maintain a more universal rootedness of assessment that favours comparisons. It therefore seems that the assessment of indicators must be carried out through a participatory process of coconstruction, ensuring a collective learning that favours the strengthening of institutional sustainability through, for example, empowerment of the participating populations. Finally, it is clear that the assessment status, which was essentially based on information, which had the primary objective of monitoring and controlling, shifts towards that of a communication tool allowing coordination and organization. The analysis of the institutional conditions for implementing sustainable development involves the study of regulatory systems that make it possible to analyse, from the structure and operational point of view, the existing methods of governance and their potential to shift towards methods of revitalized governance. In this spirit, the conceptual framework of regulatory systems shows the importance of considering the values and representations of the actors but also of considering exhortations, recommendations, laws and rules, and standards of sustainable development that act both directly due to their normative character and their role of structuring strategies, but also indirectly to strengthen the epistemic communities that influence the representations. These two types of factors must co-evolve in such a way as to promote the effective implementation of sustainable development, particularly through the participation of actors in defining the integrated coastal zone management projects (Alban and Lewis, 2005). The importance of forms of integration in the analysis of governance requires the study of the available mechanisms, forms of social organizations and social networks, but also the administrative or identity-specific zoning and their overlap. Also, the links between aquaculture and territory should be taken into account (previous contexts, the importance of the sector in local development, geographic distribution of the activity). As a result of this analysis, the multi-level nature of governance can be understood. 184
194 6. References Aggeri F., Pezet E., Abrassart C., Acquier A Organiser le développement durable. Expériences des entreprises pionnières et formation de règles d action collective. Vuibert Ademe ed. Paris, 278 p. Alban N., Lewis N., Évaluation des processus de concertation et de gouvernance du territoire sur le littoral aquitain. VertigO, Vol. 6, n 3, décembre p. Allaire G., Les compétences collectives dans le développement (une approche institutionnaliste). Communication au Symposium International «Territoires et enjeu du développement régional» Lyon 9-11 Mars 2006, 20 p. Apaza C., La pertinence des «indicateurs mondiaux de la gouvernance» : un débat scientifique en cours. Revue française d administration publique, vol. 3, n 127: Arndt C., Oman C.P., Les indicateurs de gouvernance: usages et abus. Études du centre de développement, OCDE Ed., Paris, 112 p. Baron G., Monnier E Une approche pluraliste et participative. Co-produire l évaluation avec la société civile. Revue Information Sociale n 110 Sept. 2003, 7 p. Baslé M., Multicriteria evaluation of good governance at regional level: methodological remarks addressed to institutional assessment by the World Bank, European evaluation society, FHVR Univerty, Berlin, September, 9 p. Baslé, M., Economie, conseil et gestion publique. Suivi et évaluation des politiques publiques et des programmes. Paris, Economica Ed., 180 p. Blancheton J-P., Assessment of the sustainability of aquaculture production systems: cage fish culture in the Mediterranean (Cyprus and France), final seminaire of EVAD project, November 24-25th, Montpellier, 32p. Bourdin J., André P., Plancade J.P., Placer l évaluation des politiques publiques au cœur de la réforme de l état. Les Rapports du Sénat n 392, Paris Journal officiel, 428 p. Cadiou S., Jeux et enjeux de connaissances. In La gouvernance territoriale. Pratiques, discours et théories. Pasquier R., Simoulin V., Weisbein J. Eds. Sci. Droit et Société vol 44, L.G.D.J. Ed. pp Chia E., Rey-Valette H, Mathé S., 2008-a. Aquaculture and sustainable development: between regulation and governance systems. International Journal of Sustainable Development, 11: Chia E., Rey-Valette H, Mathé S., 2008-b. Aquaculture sustainable development and governance systems. Document de travail du projet INDAM, FAO, 17 p. Conan M., L évaluation constructiviste. Théorie, principes et éléments de méthodes. La Tour d Aigues, Ed de l Aube, 198 p Court J., Hyden G., Mease K., Assessing governance: methodological challenges. World Govenance Survey discussion paper 2, United Nations University, 23 p. De Crombrugghe D., Farla K., Meisel N., De Neubourg C., Ould-Aoudia J., Szirmai A., Institutional profiles database III. Document de travail IPD 2009, 20 p. + annexes. Desrosières A., Refléter et instituer: l inventaire des indicateurs statistiques. In Dupoirier E. and Parodi J-L. (ss dir.), Les indicateurs socio-politiques aujourd hui, l Harmattan, Logiques politiques, 364 p. El-Gayar O., Aquaculture in Egypt and issue for sustainable development. Aquaculture Economics and Management, n 7 (1/2), pp Gonzales O.H.A., Beltran L.F, Caceres-Martinez C, Ramirez H, Hernandez-Vazquez S, Troyo- Dieguez E and Ortega-Rubio A, Sustainability development analysis of semi-intensive shrimp farms in Sonora, Mexico. Sustainable development, 11: Goxe A., Gouvernance territoriale et développement durable: implications théoriques et usages rhétoriques. In La gouvernance territoriale. Pratiques, discours et théories. Pasquier R., Simoulin V., Weisbein J. Eds. Sci., Droit et Société vol 44, L.G.D.J. Ed. Paris pp
195 Habermas J., Théorie de l agir communicationnel. Traduction J.M. Ferry vol 1 et J.L. Schlegel vol 2 (1987), Fayard Ed. Paris, 215 p. Hildén M., Rosenström U., The use of indicators for sustainable development. Sustainable Development, vol. 16, issue 4, pp Holzer, M. and S-T. Kim Digital Governance in Municipalities Worldwide: An Assessment of Municipal Web Sites Throughout the World. Seoul, Korea: Global e-policy e-government Institute, Sungkyunkwan University and New Jersey: The E-Governance Institute/National Center for Public Productivity. Kaufmann D., Kraay A., Zoido-Labaton P., Aggregating Governance Indicators. The World Bank Policy Research Working Paper No. 2195, Washington, DC. Kaufmann D., Kraay A., and Mastruzzi M., Governance Matters VII: Aggregate and Individual Governance Indicators, World Bank Policy Research Working Paper No Madec P., Les indicateurs de développement durable. Présentation des expériences en cours. Application au secteur de l aquaculture. Mémoire de DESS «Activités et Aménagements Littoraux et Maritimes», INRA-Université de Montpellier II, 118 p. Malik A., State of art in Governance indicators. Human Development report 2002/7, United Nations Development Programme, 30 p. Manasan R.G., Gonzales E.T., Gaffud R., Indicators of good governance: developing an index of governance quality at the LGU level. Discussion paper of Philippine institute for development studies, series no , 46 p. + annexes. Mathé S., Brunel O., Rey-Valette H., Clément O Recensement des initiatives en faveur de la durabilité de l aquaculture. Rapport CEP/UICN, 80 p. Mathé S., Rey-Valette H., Co-construire le Développement durable. Le cas de l aquaculture Méditerranéenne. Colloque international. Le développement durable dans l espace Méditerranéen, juin 2009, Faculté de Sciences Economiques, Aix en Provence, 13 p. Mathé S., Rey-Valette H., Chia E., Les réseaux d apprentissage comme facilitateur de l intégration territoriale de l aquaculture: une réflexion à partir du projet EVAD. XLVIème Colloque ASRDLF : Entre projets locaux de développement et globalisation de l'économie : quels équilibres pour les espaces régionaux? Session spéciale Concertation et apprentissage : technologies de quelle gouvernance territoriale? 6-8 Juillet 2009, Clermont Ferrand, 20 p. Meisel N., Ould Aoudia J., La «Bonne Gouvernance» est-elle une bonne stratégie de développement? AFD, Document de travail de la DGTPE, n 11, Novembre 2007, 48 p. + annexes. ODI, Governance Assessemnt. Overview of governance assessment frameworks results from the 2006 World Governance Assessment. Report from ODI Learning workshop, February, 20 p + annexes. Perret B., Evaluation, gouvernance et procéduralisation de l'expertise. Intervention au séminaire Les mutations contemporaines de l'art de gouverner. Cellule de prospective de la Commission européenne, Bruxelles, 27 mars 1996, 24 p Perret B., Indicateurs sociaux. Etat des lieux et perspectives. Les papiers du Conseil de l emploi, des revenus et de la cohésion sociale (CERC), n Janvier 2002, 37 p. Rey-Valette H., Antona M., Gouvernance et Gestion Intégrée du Littoral : l exemple des recherches françaises. VertigO la revue électronique en sciences de l environnement, Vol 9 n 1, mai 2009, mise en ligne le 23 mai Rey-Valette H., Clément O., Aubin J., Mathé S., Chia E., Legendre M., Caruso D., Mikolasek O., Blancheton J.P., Slembrouck J., Baruthio A., René F., Levang P., Morrissens P., Lazard J., Guide de co-construction d indicateurs de développement durable en aquaculture. Cirad, Ifremer, INRA, IRD, Université Montpellier 1. Diffusion Cirad-Montpellier, Version en français et en anglais, 144 p. 186
196 Rey-Valette H., Mathé S., L évaluation de la gouvernance ou l évaluation pour la gouvernance? De la recherche d un référentiel à l institutionnalisation d un apprentissage collectif. XLVIème Colloque ASRDLF : Entre projets locaux de développement et globalisation de l'économie: quels équilibres pour les espaces régionaux? Session spéciale Concertation et apprentissage: technologies de quelle gouvernance territoriale? 6-8 Juillet 2009, Clermont Ferrand, 20 p. Rumpala Y., Le développement durable appelle-t-il davantage de démocratie? Quand le développement durable rencontre la gouvernance. VertigO, vol.8, octobre, 20 p. Stern J. and Holder S., Regulatory governance: criteria for assessing the performance of regulatory systems: An application to infrastructure industries in the developing countries of Asia, Utilities Policy, vol. 8, issue 1, pp UN, Public Governance Indicator: A Literature Review. Département des affaires économiques et sociales des Nations-Unies, 55 p. UNPD, Rapport mondial sur le développement humain Approfondir la démocratie dans un monde fragmenté. Pnud Ed. 277 p. UNPD, Portail sur l inventaire de la gouvernance en Afrique (IGA). Guide d utilisateur. Rapport PNUD, 36 p. UNDP, A Users Guide to Measuring local Governance. UNDP Oslo Governance Center, 150p. Van De Walle S., Peut-on mesurer la qualité des administrations publiques grâce aux indicateurs de gouvernance? Revue française d administration publique, 155 : Van Dooren W. and Lonti Z., Contribution au débat sur la mesure de la performance de la gouvernance. Revue française d administration, n 135, pp World Bank, Building Institutions for Markets. World development report. Oxford university press, 249 p. Zeiljl-Rozema A. V., Cörvers R., Kemp R., Martens P., Governance for sustainable development. Sustainable Development, 16:
197 Annex 6a Participants to the InDAM project Name Affiliation Country Montpellier I meeting Montpellier II meeting Pilot study in Turkey technical meeting Pilot study in Tunisia technical meeting Salammbô 1 year of activities final meeting Evi ABADZITHOU Kefalonia Fisheries S.A. Greece x 2 Safa ABDOULI CNA Tunisia x 3 Hüseyin AKBAS MARA Izmir Province Turkey x 4 Ayça AKSOY WWF Turkey Office Turkey x 5 Joël AUBIN INRA/UMR SAS France x 6 Pablo AVILA ZARAGOZA Empresa Pública Desarrollo Agrario y Pesquero Spain x 7 Zouheir BADER CRDA (MONASTIR) Tunisia x 8 Ibrahim BALKAS Gulluk Fishery Cooperative Turkey x 9 Lara BARAZI Kefalonia Fisheries S.A. Greece x x 10 Bahadır BASARAN Derin Aquaculture Equipment Inc. Turkey x 11 Mohmed BECHINA APAL Tunisia x 12 Hamadi BELAÏBA ART FIMED/COPEMED Tunisia x 13 Nejla BEN CHICKH ANPE Tunisia x 14 Mohamed BEN ESSGHAIER SOGEA / Environnement Tunisia x 15 Wafa BEN HAMADI CNA Tunisia x 16 Scander BEN SALEM Institut National Sciences Technologies de la Mer Tunisia x x 17 Mustapha BENDAG Ministère de l'agriculture Tunisia x x 18 Ümit BIRKOL Izmir Fish Farmer Union Turkey x 19 Jean-Paul BLANCHETON IFREMER France x x 20 Abir BLANCO CNA Tunisia x 21 Alain BODOY IFREMER France x 22 Zied CHAYAH PRIMA AZURE SOUSSE Tunisia x 23 Hüseyin CAKIR CAKIR Aquaculture & Fishery Equipment Inc Turkey x 24 Mehmet CATALKAYA MARA Mugla Province Turkey x 25 Intissar CHARGUI GIPP Tunisia x
198 Name Affiliation Country Montpellier I meeting Montpellier II meeting Pilot study in Turkey technical meeting Pilot study in Tunisia technical meeting Salammbô 1 year of activities final meeting Zied CHAYAH PRIMA AZURE SOUSSE Tunisia x 27 Edoardo CHIA INRA-CIRAD France x x 28 Hamadi CHTIOUI CRDA, MONASTIR Tunisia x 29 Maria COZZOLINO IREPA Italy x x x 30 Asiye Arzu DELICAN Akuvatur Mediterranean Sea Foods Inc. Turkey x 31 Abdelkader DABABI S.A.T Tunisia x 32 Filiz DEMİRAYAK WWF Turkey Office Turkey x 33 Hayal DEMIRHAN MARA Mugla Province Turkey x 34 Hayri DENIZ MARA Turkey x x x x 35 Hakki DERELI MARA Mugla Province Turkey x 36 Sami DHOUIB WWF Tunisia x 37 Ali EL OUAER Institut National Sciences Technologies de la Mer Tunisia x x 38 Hüseyin ERDEM Kılıç Seafood Inc. Turkey x 39 Ahmet ERYIGIT Ministry of Environment and Forest Turkey x 40 Esen ERGIN MARA Mugla Province Turkey x 41 Mohamed BEN ESSGHAIER SOGEA / Environnement Tunisia x 42 Zied GHEDIRA Master Aquaculture, Association Environnementale locale Tunisia x 43 Hamadi GUERBAJ CNA Tunisia x 44 Erkan GUMUS Fisheries Faculty of Akdeniz University Turkey x 45 Mohamed Rochd HADDAR LUC SONO Tunisia x 46 Mohamed HADJALI SALEM SIPAM Tunisia x x 47 Houssem HAMZA DGPA / TUNIS Tunisia x 48 Kürşat IMGA Dept of EU and Foreign Affairs, MARA Turkey x 49 Boukthir KADRI G.I.P.P Tunisia x 50 Fethi KAMOUN CNA Tunisia x 51 Mehmet KARA Fish farm, Mugla Turkey x 52 Ozge KARDAS Ministry of Environment and Forest Turkey x 53 Spyros KLAOUDATOS University Thessaly Greece x x 54 Abdullah KOKEN Provincial Directorate of Ministry of Culture Turkey x
199 Name Affiliation Country Montpellier I meeting Montpellier II meeting Pilot study in Turkey technical meeting Pilot study in Tunisia technical meeting Salammbô 1 year of activities final meeting Mejdi LAHMAR Ste Aquaculture RUSPINA Tunisia x 56 Néjib LAROUSSI CRDA MAHDIA Tunisia x 57 Jérôme LAZARD and Tourism France x 58 Atef LETAIEF CNA Tunisia x 59 Alessandro LOVATELLI FAO FIMA FAO x 60 Ahmed MAAMOURI T.S. Aquaculture. Maîtrise Bio marine Tunisia x 61 Chokri MABROUK Gouvernorat de Monastir Tunisia x 62 Emrah MANAP Ministry of Environment and Forest Turkey x 63 Fabio MASSA FAO GFCM FAO x x x x 64 Néjib MEHDIOUB CNA Tunisia x 65 Leila MGAÏDI CNA Tabarka Tunisia x 66 Ridha M RABET Institut National des Sciences et Technologies de la Mer Morocco x 67 Syndhia MATHE Univ Monpellier France x x x 68 Hamadi MEJRI GIPP Tunisia x 69 Foued MESTIRI GIPP Tunisia x 70 Hechmi MISSAOUI D.G/P.A Tunisia x 72 Néjiba MISSAOUI CTA Tunisia x x 73 Abdellah MOUSTATIR Ministere de Pêches Maritimes-DPNA Morocco x 74 Celalettin MULKUT Ministry of Environment and Forest Turkey x 75 Noureddine NSIBI CRDA, Bizerte Tunisia x 76 Abdellatif ORBI Institut National de Recherche Halieutique INRH Morocco x 77 Cengiz ÖNDER Kılıç Seafood Inc. Turkey x 78 Atilla OZDEMIR Central Fisheries Research Institute Kasüstü Beldesi Turkey x 79 Ramazan OZKAYA Central Union for Fishery Cooperatives Turkey x 80 Kamuran PATRONA Mugla Fish Farmers Association Turkey x 81 Ferit RAD University of Mersin Turkey x x x 82 Francois RENE IFREMER France x x x 83 Hélène REY-VALETTE Univ Monpellier France x x 84 Pablo SÁNCHEZ JEREZ Univ. Alicante Spain x
200 Name Affiliation Country Montpellier I meeting Montpellier II meeting Pilot study in Turkey technical meeting Pilot study in Tunisia technical meeting Salammbô 1 year of activities final meeting Moez SHAÏER Tunisie Cultimer Tunisia x 86 Abdelmajid S HEL CRDA (MEDNINE) Tunisia x 87 François SIMARD IUCN IUCN x 88 Biken TANIR Ministry of Environment and Forest Turkey x 89 Ridha TELILI D. G./ P A Tunisia x 90 Gulsen ULUKOY Fisheries Faculty of Mugla University Turkey x 91 Hülya UNAL KORKMAZ Ministry of Public Works and Settlement Turkey x 92 Marc VANDEPUTTE INRA/IFREMER France x 93 Aylin VELIOGLU Aquaculture Dept, Ministry of Agriculture and Rural Affairs Turkey x 94 Omer Hakan YALCIN Aquaculture Dept, Ministry of Agriculture and Rural Affairs Turkey x 95 Güzel YÜCEL GIER Dokuz Eylül Universitesi Turkey x x x 96 Othmane ZOGHLAMI CRDA / SOUSSE Tunisia x 97 Mourad ZOUARI Direction Generale des peches et de l Aquaculture Tunisia x x n. participants
201 Annex 6b Participants to the InDAM project meetings and events Evi ABADZITHOU (Ms) Kefalonia Fisheries S.A. Livadi, Lixouri Kefalonia, Greece Tel: Fax: Safa ABDOULI Technician Groupement Interprofessionnel des Produits de la Pêche (GIPP) Fisheries harbour Tabarka, Tunisia Tel: Fax: wafik.abdouli@gmail.com Hüseyin AKBAS Aquaculture Officer MARA Izmir Province Universite Cad. No 47, Izmir, Turkey Tel: Fax: akbashuseyin@gmail.com Ayça AKSOY (Ms) Project Representative WWF Turkey Office Büyük Postane Caddesi No: Kat: Bahçekapı Istanbul, Turkey Tel: Fax: aaksoy@wwf.org.tr Joël AUBIN INRA/UMR SAS Equipe Fields CS rue de St Brieuc, 042 Rennes cedex 35, France Joel.Aubin@rennes.inra.fr Pablo AVILA ZARAGOZA Area de Estructuras Pesqueras y Acuícolas. SubDir. Recuros Pesqueros y Acuícolas Empresa Pública Desarrollo Agrario y Pesquero C/Severo Ochoa 38 Pta Campanillas Malaga, Spain Tel: Fax: pavila@dap.es Zouheir BADER Chief of Fisheries Arrondissement Commissariat Régional au Développement Agricole (CRDA) Monastir, Tunisia Tel: Fax: crda.monastir@iresa.agrinet Ibrahim BALKAS Fisherman Gulluk Fishery Cooperative Gulluk, Mugla, Turkey Tel: Lara BARAZI (Ms) Chief Executive Officer Kefalonia Fisheries Livadi, Lixouri Kefalonia, Greece Tel: Fax: yer@otenet.gr Bahadır BASARAN Aquaculture Equipment Supplier Derin Aquaculture Equipment Inc. Mithatpaşa Cad. No 425/B Güzelbahçe, Izmir, Turkey Tel: Fax: bahadır.basaran@derinsu.com 192
202 Mohamed BECHINA Agence de Protection et d Aménagement du Littoral (APAL), Tunisia Tel: Fax: Hamadi BELAIBA Projet Expert Art FiMed Commissariat Régional au Développement Agricole (CRDA) Gabes, Nahal, Tunisia Tel: Fax: Nejla BEN CHEIKH Agence Nationale de Protection de l Environnement Tunis, Tunisia Tel: Fax: Mohamed BEN ESSGHAIER SOGEA / Environnement (Bureau d études) Sousse, Tunisia Tel: Fax: sogea.environnement@topnet.tn Wafa BEN HAMADI Technician Groupement Interprofessionnel des Produits de la Pêche (GIPP) Fisheries harbour Tabarka, Tunisia Tel: Fax: wafa.benhamouda@gmail.com Scander BEN SALEM Research scientist Institut National des Sciences et Technologies de la Mer (INSTM) Fisheries harbour, 2060 la Goulette, Tunisia Tel Fax : scander.bensalem@instm.rnrt.tn Mustapha BENDAG Responsible for Aquaculture General Directorate for Fisheries and Aquaculture Ministry of agriculture and water resources 30 rue Alain Savary 1002 Tunis, Tunisia Tel: Tel Fax: E- mail: Mustapha.bendag@topnet.tn mustapha.bendag@fao.org Ümit BIRKOL Union Secretary Izmir Fish Farmer Union Gaziosmanpasa Bulvarı No 8/4 Alsancak, Izmir, Turkey Tel: Fax: info@isub.org.tr Jean-Paul BLANCHETON Station expérimentale de l'ifremer Chemin de Maguelone Palavas les Flots, France Tel: Fax: jpblancheton@ifremer.fr Abir BLANCO Technician Groupement Interprofessionnel des Produits de la pêche Fisheries harbour Tabarka, Tunisia Tel: Fax: blanco-abir@hotmail.fr Alain BODOY IFREMER La ROCHELLE alain.bodoy@ifremer.fr Hüseyin CAKIR Owner of Company CAKIR Aquaculture & Fishery Equipment Inc. Mithatpaşa Cad. No 425/B Güzelbahçe, Izmir,Turkey Tel: Fax: huseyın@cakir-fishing.com 193
203 Mehmet CATALKAYA Aquaculture Officer MARA Mugla Province Muslihiddin Mah. Sakarya Sok. No 8 Mugla, Turkey Tel: Fax: m.catalkaya@mynet.com Intissar CHARGUI Technician Groupement Interprofessionnel des Produits de la Pêche (GIPP) Fisheries harbour Tabarka, Tunisia Tel: Fax: intissarchargui@yahoo.fr Zied CHAYAH Prime Azur (Aquaculture Society) Sousse, Tunisia Tel: Fax: zied_chayah@voila.fr Edoardo CHIA INRA-CIRAD BP 5032, TA 60/15 F34398 Montpellier France chia@ensam.inra.fi Hmadi CHTIOUI Regional Commissary for Agriculture Development Commissariat Régional au Développement Agricole Monastir, Tunisia Tel: Fax: crda.monastir@iresa.agrinet Maria COZZOLINO (Ms) IREPA, Via San Leonardo Salerno, Italy Tel: cozzolino@irepa.org Belgacem DABABI Société Aquaculture du Sud Tunisien (S.AT) Rue Midoun, B.P Mednine, Tunisia Tel: Fax: Asiye Arzu DELICAN (Ms) Akuvatur Mediterranean Sea Foods Inc. Eczane Mah. 113 Sok. No Bornova, Izmir, Turkey Tel: Fax: arzudelican@akuvatur.com Filiz DEMİRAYAK (Ms) CEO WWF Turkey Office Büyük Postane Caddesi No: Kat: Bahçekapı Istanbul, Turkey Tel: Fax: fdemirayak@wwf.org.tr Hayal DEMIRHAN (Ms) Aquaculture Officer MARA Mugla Province Muslihiddin Mah. Sakarya Sok. No 8 Mugla, Turkey Tel: Fax: hayaldemirhan@hotmail.com Hayri DENIZ Director of Marine Aquaculture Ministry of Agriculture and Rural Affairs, Aquaculture Department Eskisehir Yolu 9 Km Lodumlu Çankaya, Ankara, Turkey Tel: Fax: GSM: hayri.deniz@tarim.gov.tr hayrideniz@hotmail.com Hakkı DERELI Fishery Officer MARA Mugla Province Muslihiddin Mah. Sakarya Sok. No 8 Mugla, Turkey Tel: Fax: hakkıdereli@gmail.com Sami DHOUIB WWF (World Wildlife Fund) Av. Ahmed Khabthani immeuble. Ben Sassi 2080 Ariana, Tunisia Tel : Fax : sdhouib@wwftunis.org 194
204 Ali ELOUAR Director INSTM Route de Khnis Monastir, Tunisia Tel: Fax: ali.elouaer@instm.rnrt.tn Hüseyin ERDEM Aquaculture Engineer Kılıç Seafood Inc. Milas Bodrum Karayolu 18 km Kemikler Köyü Mevkii Milas, Mugla, Turkey Tel: Fax: homardem@hotmail.com Esen ERGIN (Ms) Aquaculture Officer MARA Mugla Province Muslihiddin Mah. Sakarya Sok. No 8 Mugla, Turkey Tel: Fax: Esenergin48@hotmail.com Ahmet ERYIGIT Officer of Environmental Protection Ministry of Environment and Forest, Authority of Special Environmental Protection Mugla, Turkey Tel: eryigitahmet@gmail.com Hamadi GUERBEJ Institut National Sciences et Technologie de la mer (INSTM) Route de khnis Monastir, Tunisia Tel: Fax: hamadi.guerbej@instm.rnrt.tn Erkan GUMUS Associate Professor Fisheries Faculty of Akdeniz University Dumlupınar Bulvarı, Yerleşke Antalya, Turkey Tel: Fax: egumus@akdeniz.edu.tr Rochd HADDAR MOHAMED Societé Luc Sono d Aquaculture CD Monsatrir, Tunisia Tel: Mohamed HADJALI SALEM Director SIPAM regional centre Ministry of agriculture and water resources 30 rue Alain Savary 1002 Tunis, Tunisia Tel.: Fax: Hajali.salem@fao.org Houssem HAMZA Service Head General Directorate for Fisheries and Aquaculture Ministry of agriculture and water resources 30, rue Alain Savary, 1002 Tunis, Tunisia Tel: Fax: houssemhamza@yahoo.fr Kürşat IMGA MARA EU Expert Department of EU and Foreign Affairs Ministry of Agriculture and Rural Affairs. Eskisehir Yolu 9 Km Lodumlu Cankaya, Ankara, Turkey Tel: /2190 Fax: kusatimga@tarim.gov.tr Fathi KAMOUN Research scientist INSTM - Centre de Monastir BP 59, Monastir 5000, Tunisia Tel : Fax : kamounfathi@yahoo.fr Mehmet KARA Owner of Small Scale Farm Land based Fish Farming Milas, Mugla, Turkey Tel:
205 Ozge KARDAS (Ms) Assistant Expert Ministry of Environment and Forest DG of Environmental Impact Assessment Sogutozu Cad. No 14/17 Kat Ankara, Turkey Tel: Fax: ozgekardas82@hotmail.com Spyros KLAOUDATOS University Thessaly Dept Ichthyology and Aquatic Environment Aquaculture Laboratory Fitocou Str New Ionia Magnissia, Greece Tel; Fax: sklaoudat@uth.gr, sklaouda@hol.gr Abdullah KOKEN Section Director Provincial Directorat of Ministry of Culture and Tourism. Mugla (Turkey) Tel: /135 Fax: Mejdi LAHMAR Manager Société Aquaculture Ruspina, B.P Fisheries harbour Teboulba, Tunisia Tel: Fax: Néjib LAROUSSI Head of Arrondissement Commissariat Régional au Développement Agricole 5111 Mahdia, Tunisia Tel: Fax: nejiblaroussi@yahoo.fr Jérôme LAZARD Unité de Recherche "Aquaculture et gestion des ressources aquatiques" Département Persyst Centre de coopération internationale en recherche agronomique pour le développement (Cirad) TA B-20/01, Avenue Agropolis Montpellier cedex 5, France jerome.lazard@cirad.fr Atef LETAIEF Technician Groupement Interprofessionnel des Produits de la Pêche (GIPP) Fisheries harbour Tabarka, Tunisia Tel: Fax: letaief_atef@hotmail.com Alessandro LOVATELLI Fishery Resources Officer (Aquaculture) Aquaculture Management and Conservation Service (FIMA) Fishery and Aquaculture Management Division Fisheries and Aquaculture Department Via delle Terme di Caracalla Roma, Italy Tel: Fax: alessandro.lovatelli@fao.org Ahmed MAAMOURI Technician Groupement Interprofessionnel des Produits de la Pêche (GIPP) Fisheries harbour Tabarka, Tunisia Tel: Fax: Chokri MABROUK Delegate for Economics Gouvernorat de Monastir 5000 Monastir, Tunisia Tel: Fax: Emrah MANAP Biologist Ministry of Environment and Forest Authority of Special Environmental Protection, Mugla, Turkey Tel: Fax: e.manap@occkkb.gov.tr 196
206 Fabio MASSA GFCM Aquaculture Officer CAQ Technical Secretary International Institutions and Liaison Service Fisheries and Aquaculture Economics and Policy Division (FIEL) Fisheries and Aquaculture Department Viale delle Terme di Caracalla Roma, Italy Tel.: Fax: Syndhia MATHE Université of Montpellier Faculté de Sciences Economiques Avenue de la Mer - Site de Richter CS Montpellier cedex 2, France Tel: +33 (0) syndhia.mathe@univ-montp1.fr Néjib MEDHIOUB Institut National Sciences et Technologie de la mer (INSTM) Route de khnis Monastir, Tunisia Tel : Fax : mednejib.medhioub@instm.rnrt.tn Hamadi MEJRI Ingeneer Groupement Interprofessionnel des Produits de la Pêche (GIPP) Fisheries harbour Tabarka, Tunisia Tel: Fax: hamadi.mejri@lycos.com Foued MESTIRI Director General Groupement Interprofessionnel des Produits de la Pêche (GIPP) Tunis, Tunisia Tel: Fax: gip.peche@planet.tn Leila MGAIDI Technician Groupement Interprofessionnel des Produits de la Pêche (GIPP) Fisheries harbour Tabarka, Tunisia Tel: Fax: leilamgaidi@yahoo.fr Hechmi MISSAOUI General Director General Directorate for Fisheries and Aquaculture Ministry of agriculture and water resources 30 rue Alain Savary, 1002 Tunis, Tunisia Tel: Fax: missaoui.hechmi@inat.agrinet.tn Néjiba MISSAOUI Centre Technique d Aquaculture Tunis, Tunisia Tel: Fax: missaoui.nejiba@iresagrinet.tn Abdellah MOUSTATIR Ministere des Pêches Maritimes - DPNA Rabat, Morocco Tel: moustatir@mpm.gov.ma Ridha M RABET Director Institut National des Sciences et Technologies de la Mer (INSTM) 28 Rue 2 mars Salammbô, Tunisia Tel: Fax: ridha.mrabet@instm.rnrt.tn Celalettin MULKUT Environment Officer Ministry of Environment and Forest DG of Environment Management Sogutozu Cad. No 14/17 Kat 21 Ankara, Turkey Tel: Fax: cmulkut@cevreorman.gov.tr Noureddine NSIBI Chef d arrondissement des pêches Commissariat Régional au Développement Agricole Fisheries harbour Bizerte, Tunisia Tel: Fax:
207 Cengiz ÖNDER Aquaculture Engineer Kılıç Seafood Inc. Milas Bodrum Karayolu 18 km Kemikler Köyü Mevkii Milas, Mugla, Turkey Tel: Fax: cengizonder@kilicdeniz.com.tr Abdellatif ORBI Institut National de Recherche Halieutique INRH 2 Rue De Tiznit, Casablanca, Morocco Tel: orbi@inrh.org.ma Atilla OZDEMIR Institute Director Central Fisheries Research Institute Kasüstü Beldesi, 61250, Yomra, Trabzon, Turkey Tel: Fax: aozdenir@sumea.gov.tr Ramazan OZKAYA President of Central Union Central Union for Fishery Cooperatives Konur Sok. No 54/8 Bakanlıklar, Ankara, Turkey Tel: Fax: info@surkoop.org Kamuran PATRONA Association Secretary Mugla Fish Farmers Association Ataturk Mah. 270 Sok. No 5 Kat 1 Gulluk, Mugla, Turkey Tel: Fax: kamuranpatrona@ttmail.com Ferit RAD Associate Professor Fisheries Faculty of Mersin University Cıftlikkoy Merkez Kampusu Mersin, Turkey Tel: Fax: frad@mersin.edu.tr François RENÉ Station expérimentale de l'ifremer Chemin de Maguelone Palavas les Flots, France Tel: Fax: francois.rene@ifremer.fr Hélène REY-VALETTE University of Montpellier Faculté de Sciences Economiques Avenue de la Mer - Site de Richter CS Montpellier cedex 2, France helene.rey-valette@univ-montp1.fr Pablo SÁNCHEZ JEREZ Senior Lecture Univeristy of Alicante Dept. of Marine Science and Applied Biology. Edf. Ciencias 5 Ap. C Alicante, Spain Tel: , ext 2977 Fax: psanchez@ua.es Moez SHAIER Tunisie Cultimer BP 62, Manzel abderrahmen 7035 Bizerte, Tunisia Tel Fax: tunisie-cultimer@gnat.tn Abdelmagid S HEL Head of Fisheries Arrondissement Commissariat Régional au Développement Agricole (CRDA) Medenine, Tunisia Tel: Fax: magidshel@yahoo.fr François SIMARD Marine Programme Coordinator IUCN Centre for Mediterranean Cooperation Parque Tecnológico de Andalucía Calle Marie Curie, 35, Campanillas Málaga, Spain Tel: Fax: francois.simard@iucn.org 198
208 Biken TANIR (Ms) Urban Planner Ministry of Environment and Forest DG of Environmental Impact Assessment Sogutozu Cad. No 14/17 Kat Ankara, Turkey Tel: Fax: Gulsen ULUKOY (Ms) Associate Professor Fisheries Faculty of Mugla University Kötekli, Mugla, Turkey Tel: Fax: Hülya UNAL KORKMAZ (Ms) Officer of Planning Ministry of Public Works and Settlement DG of Technical research and Application Ankara, Turkey Tel: Fax: hulyauk@bayindirlik.gov.tr Marc VANDEPUTTE INRA/IFREMER marc.vandeputte@jouy.inra.fr Güzel YÜCEL GIER (Ms) Dokuz Eylül University Institute of Marine Sciences and Technology Bakü Bulverı No: İnciralti İzmir, Turkey Tel: /140 Fax: yucel.gier@deu.edu.tr Othmane ZOGHLAMI Head of Fisheries Arrondissement Commissariat Régional au Développement Agricole (CRDA) 1 Rue d Algérie 4029 Sousse, Tunisia Tel: Fax: othmanzoghlami@yahoo.fr Mourad ZOUARI Ingeneer /Aquaculture General Directorate for Fisheries and Aquaculture Commissariat Régional Développement Agricole (CRDA) Monastir, Tunisia Tel: Fax: iwachi@jicapeche.com Aylin VELIOGLU (Ms) MARA Aquaculture Officer Aquaculture Department of Ministry of Agriculture and Rural Affairs Eskisehir Yolu 9 Km Lodumlu Cankaya, Ankara, Turkey Tel: Fax: velioglu.aylin@gmail.com Omer Hakan YALCIN MARA Aquaculture Officer Aquaculture Department, Ministry of Agriculture and Rural Affairs Eskisehir Yolu 9 Km Lodumlu Cankaya, Ankara, Turkey Tel: Fax : akdaghakan66@hotmail.com 199
209 Annex 7 InDAM-db bibliographic references 37 Aguado-Gimenez, F., Marin, A., Montoya, S., Marin-Guirao, L., Piedecausa, A. & Garcia-Garcia, B Comparison between some procedures for monitoring offshore cage culture in western Mediterranean Sea: Sampling methods and impact indicators in soft substrata. Aquaculture, 271: Apostolaki, E.T., Tsagaraki, T., Tsapakis, M. & Karakassis, I Fish farming impact on sediments and macrofauna associated with seagrass meadows in the Mediterranean. Estuarine Coastal Shelf Science, 75: Ariel, E Ornamental fish as transboundary vectors of viral diseases. in P. Walker, R. Letter and MG Bondad-Reantaso (eds). Diseases in Asian Aquaculture V, pp Fish Health Section, Asian Fisheries Society, Manila. Arndt, C. & Oman, C Uses and abuses of governance indicators. OECD Organisation for Economic Cooperation and Development Centre Studies pp Arthur, J.R. & Subasinghe, R.P Potential adverse socio-economic and biological impacts of aquatic animal pathogens due to hatchery-based enhancement of inland open-water systems, and possibilities for their minimisation. Primary aquatic animal health care in rural, small-scale, aquaculture. FAO Fisheries Technical Paper, 406: Asche, F., Bjorndal, T. & Young, J.A Market interactions for aquaculture products. Aquac Econ Manag, 5: AZTI Foundation A protocol for the establishment and environmental monitoring of sea farming cages in Spain. CIHEAM, Cahiers options mediterraneennes, 55: Bahri-Sfar, L., Lemaire, C., Chatain, B., Divanach, P., Ben Hassine, O.K. & Bonhomme, F Impact de l'élevage sur la structure génétique des populations méditerranéennes de Dicentrarchus labrax. Aquatic Living Resources, 18: Balata, D., Bertocci, I., Piazzi, L. & Nesti, U Comparison between epiphyte assemblages of leaves and rhizomes of the seagrass Posidonia oceanica subjected to different levels of anthropogenic eutrophication. Estuarine, Coastal and Shelf Science, 79: Baquerizo, C.A A perspective for an ecological management of aquaculture. CIHEAM, 55: Bartley, DM., Rana, K. & Immink, A.J The use of inter-specific hybrids in aquaculture and fisheries. Reviews in Fish Biology and Fisheries, 10: Bartoli, M., Nizzoli, D., Viaroli, P., Turolla, E., Castaldelli, G., Fano, E.A. & Rossi, R Impact of Tapes philippinarum farming on nutrient dynamics and benthic respiration in the Sacca di Goro. Hydrobiologia, 455: Basurco, B. & Lovatelli, A The aquaculture situation in the Mediterranean Sea predictions for the future. Beardmore, J.A. & Porte, J.S Genetically modified organisms and aquaculture. FAO Fisheries Circular, 989, Rome, FAO, 25p. Bearzi, G Interactions between cetaceans and fisheries: Mediterranean Sea. A report to the ACCOBAMS Segretariat, sect. 9, 20p. Beers, P., Findlay, V. & Perrera, R Biosecurity: a new word for an old concept. in P. Walker, R. Lesterand M.G. Bondad-Reantaso (eds). Diseases in Asian Aquaculture V, pp Fish Health Section, Asian Fisheries Society, Manila. 37 Prepared by F.Salucci, GFCM Secretariat 200
210 Belias, C., Dassenakis, M. & Scoullos, M Study of the N P and Si fluxes between fish farm sediment and seawater. Results of simulation experiments employing a benthic chamber under various redox conditions. Marine Chemistry, 103: Bentsen, H.B. & Thodesen, J Genetic interactions between farmed and wild fish, with example from the Atlantic salmon case in Norway. T. Gjedrem (ed): Selection and Breeding Programs in Aquaculture. Springer, Doordrecht, The Netherlands. pp. 31. Beveridge, M.C.M Aquaculture and wildlife interactions. Proceedings of the seminar of the CIHEAM network on technology of aquaculture in the Mediterranean (TECAM), jointly organized by CIHEAM and FAO, Zaragoza (Spain), January Cahiers Options Mediterraneennes, 55: Beveridge, M.C.M Cage aquaculture.2 nd Ed. Fishing News Books, Oxford, England, Chapter 5, pp Black, K.D Sustainability of aquaculture. Environmental impacts of aquaculture, pp Sheffield, United Kingdom, Sheffield Academic Press. Black, K.D Environmental impacts of aquaculture. Aquaculture International, 9: Blancheton, J.P Developments in recirculation systems for Mediterranean fish species. Aquacultural Engineering, 22: Boyd, C.E., McNevin, P., Aaron, A., Clay, J. & Johnson, H.M Certification issues for some common aquaculture species. Reviews in Fisheries Science, 13: Boyd, C.E., Tucker, C., McNevin, A., Bostick, K. & Clay, J Indicators of resource use efficiency and environmental performance in fish and crustacean aquaculture. Reviews in Fisheries Science, 15: Bower, S.M. & McGladdery, S.E Disease interactions between wild and cultured shellfish. A scientific review of the potential environmental effects of aquaculture in aquatic ecosystems. Fish Aquatic Science, 2450: viii + 33p. Brambilla, F., Lalumera, G., Terova, G., Crosa, G. & Saroglia, M Inflow and outflow water quality control in coastal aquaculture systems: A case study. Aquaculture Research, 38: Bunting, S.W Horizontally integrated aquaculture development: Exploring consensus on constraints and opportunities with a stakeholder Delphi. Aquaculture International, 16: Caffey, R.H., Kazmierczak, R.F., Avault, J.W. & Avault, J.r Developing consensus indicators of sustainability for southeastern United States aquaculture. Consensus Sustainable Aquaculture in Europe. Working Draft Bulletin No p. Callier, M.D., McKindsey, C.W. & Desrosiers, G Evaluation of indicators used to detect mussel farm influence on the benthos: Two case studies in the Magdalen Islands, Eastern Canada. Aquaculture, 278: Canada Department of Fisheries and Oceans Impact of freshwater and marine aquaculture on the environment. Canada Department of Fisheries and Oceans. Carubelli, G., Fanelli, R., Mariani, G., Nichetti, S., Crosa, G., Calamari, D. & Fattore, E PCB contamination in farmed and wild sea bass (Dicentrarchus labrax L.) from a coastal wetland area in central Italy. Chemosphere, 68: Cataudella, S., Massa, F. & Crosetti, D Interactions between aquaculture and capture fisheries: a methodological perspective. General Fisheries Commission for the Mediterranean. Rome, Studies and Reviews 78: 229p. Ceccarelli, R., Saluzzi, A., Fiore, V., Salerno, A. & Barbera, G The environmental impact of an offshore aquaculture system in the Gulf of Gaeta: a first approach. (Primi risultati relativi all'impatto ambientale di un allevamento offshore nel Golfo di Gaeta). Biologia marina mediterranea, 6: Chapelle, A., Lazure, P. & Souchu, P Modelisation numerique des crises anoxiques (malaigues) dans la lagune de Thau (France) (Modelling anoxia in the Thau Lagoon (France)). Oceanologica Acta, 24 S: S87-S97 201
211 Chapelle, A., Menesguen, A., Deslous-Paoli, J.M., Souchu, P., Mazouni, N., Vaquer, A. & Millet, B Modelling nitrogen, primary production and oxygen in a Mediterranean lagoon. Impact of oysters farming and inputs from the watershed. Ecological Modelling, 127: Chia, E., Rey-Valette, H. & Mathé, S Aquaculture sustainable development and governance system. International Journal of Sustainable Development, 11: Ciccotti, E Interactions between capture fisheries and aquaculture: the case of the eel (Anguilla anguilla L., 1758). in Cataudella, S., Massa, F. and Crosetti, D. (eds.). Interactions between aquaculture and capture fisheries: a methodological perspective. General Fisheries Commission for the Mediterranean. Studies and Reviews No. 78. Rome, FAO Ciccotti, E. & Franzoi, P La pesca del novellame. in: Cataudella, S. & Bronzi, P. (eds) Acquacoltura responsabile: verso le produzioni acquatiche del terzo millennio, UNIMAR, Roma, Clayton, P.L. & Gordon, D.V From Atlantic to Pacific: price links in the US wild and farmed salmon market. Aquaculture Economics & Management, Conides, A., Zacharaki, P., Hunter, S. & Glamuzina, B Multi-parametric ecological associations between physico-chemical quality of water and sediment around a marine finfish cage farm. Aquaculture: Book of Abstracts, World Aquaculture Society, 143 J.M Parker Coliseum Louisiana State University Baton Rouge LA USA, 132p. Cozzolino, M Market interactions between fishery and aquaculture in Italy. Cataudella, S., Massa, F. and Crosetti, D. (eds.), Interactions between aquaculture and capture fisheries: a methodological perspective.. General Fisheries Commission for the Mediterranean. Studies and Reviews No. 78. Rome, FAO Crema, R., Prevedelli, D., Valentini, A. & Castelli, A Recovery of the macrozoobenthic community of the Comacchio Lagoon system (Northern Adriatic sea). Ophelia, 522: Crosetti, D., Lapègue, S., Olesen, I. & Svasand, T Genetic effects of domestication, culture and breeding of fish and shellfish, and their impacts on wild populations. WP1 workshop Genetics of domestication, breeding and enhancement of performance of fish and shellfish, Viterbo, Italy, 12-17th June, 2006, 6p. Danovaro, R., Corinaldesi, C., La Rosa, T., Luna, G.M., Mazzola, A., Mirto, S., Vezzulli, L. & Fabiano, M Aquaculture impact on benthic microbes and organic matter cyclic in coastal Mediterranean sediments: a synthesis. 1st Scientific Conference of EFMS: Oceanographical Aspects for a Sustainable Mediterranean, Athens (Greece), September Chemistry and Ecology, 19: Danovaro, R., Gambi, C., Luna, G.M. & Mirto, S Sustainable impact of mussel farming in the Adriatic Sea (Mediterranean Sea): evidence from biochemical, microbial and meiofaunal indicators. Marine Pollution Bulletin, 49: Dedieu, K., Rabouille, C., Thouzeau, G., Jean, F., Chauvaud, L., Clavier, J., Mesnage, V. & Ogier, S Benthic O sub(2) distribution and dynamics in a Mediterranean lagoon (Thau France): An in situ microelectrode study. Estuarine Coastal Shelf Science, 72: De Gaetano, P., Doglioli, A.M., Magaldi, M.G., Vassallo, P. & Fabiano, M FOAM, a new simple benthic degradative module for the LAMP3D model: an application to a Mediterranean fish farm. Aquaculture Research, 39: Dekker, W Monitoring of glass eel recruitment. Report C007/02-WD, Netherlands Institute of Fisheries Research, IJmuiden, 256 p. Dekker, W Status of the European eel stock and fisheries. In Aida K., Tsukamoto K. and Yamauchi K. (Eds.), Eel Biology, Springer-Verlag, Tokyo pp Delgado, O., Ruiz, J., Perez, M., Romero, J. & Ballesteros, E Effects of fish farming on seagrass (Posidonia oceanica) in a Mediterranean bay: seagrass decline after organic loading cessation. Oceanologica Acta, 22: De Monbrison, P Mediterranean marine aquaculture and environment: Identification of issues. IUCN document. 202
212 Dempster, T., Fernandez-Jover, D., Sanchez-Jerez, P., Tuya, F., Bayle-Sempere, J., Boyra, A. & Haroun, R.J Vertical variability of wild fish assemblages around sea-cage fish farms: implications for management. Marine Ecology Progress series, 304: Dempster, T., Sanchez-Jerez, P., Bayle-Sempere, J.T., Giménez-Casalduero, F. & Valle, C Attraction of wild fish to sea-cage fish farms in the south-western Mediterranean Sea: spatial and short-term temporal variability. Marine Ecology Progress series, 242: Dempster, T., Sanchez-Jerez, P., Bayle-Sempere, J. & Kingsford, M Extensive aggregations of wild fish at coastal sea-cage fish farms. Hydrobiologia, 525: Diaz Lopez, B., Bunke, M. & Bernal Shirai, J.A Marine aquaculture off Sardinia Island (Italy): Ecosystem effects evaluated through a trophic mass-balance model. Ecological Modelling, 212: Danancher, D. & Garcia-Vazquez, E Genetic effects of domestication, culture and breeding of fish and shellfish, and their impacts on wild populations. Turbot Scophthalmus maximus. p 55-61, In: Svåsand T., Crosetti D., García-Vázquez E., Verspoor E. (eds). Evaluation of genetic impact of aquaculture activities on native populations: a European network. GENIMPACT Final Report (EU contract n. RICA-CT ). Deniz, H Environmental impact of aquaculture in Turkey and its relationship to tourism, recreation and sites of special protection. In Uriarte A. (ed.) Basurco B. (ed.). Environmental impact assessment of Mediterranean aquaculture farms. Zaragoza: CIHEAM-IAMZ, p Deslous-Paoli, J.M., Souchu, P., Mazouni, N., Juge, C. & Dagault, F Relationship between environment and resources: impact of shellfish farming on a Mediterranean lagoon (Thau, France). Oceanologica Acta, 21: Diaz-Almela, E., Marba, N., Alvarez, E., Santiago, R., Holmer, M., Grau, A., Mirto, S., Danovaro, R., Petrou, A., Argyrou, M., Karakassis, I. & Duarte, C.M Benthic input rates predict seagrass (Posidonia oceanica) fish farm-induced decline. Marine Pollution Bulletin, 56: Dimech, M., Borg, J.A. & Schembri, P.J Changes in the structure of a Posidonia oceanica meadow and in the diversity of associated decapod, mollusc and echinoderm assemblages, resulting from inputs of waste from a marine fish farm (Malta, Central Mediterranean). Bulletin of Marine Science, 71: Dimitriadis, C. & Koutsoubas, D Community properties of benthic molluscs as indicators of environmental stress induced by organic enrichment. Journal of Natural History, 42: Dimitriou, E., Katselis, G., Moutopoulos, D.K., Akovitiotis, C. & Koutsikopoulos, C Possible influence of reared gilthead sea bream (Sparus aurata- L.) on wild stocks in the area of the Messolonghi lagoon (Ionian Sea- Greece). Aquaculture Research, 38: Dolenec, T., Lojen, S., Kniewald, G., Dolenec, M. & Rogan, N Nitrogen stable isotope composition as a tracer of fish farming in invertebrates Aplysina aerophoba Balanus perforatus and Anemonia sulcata in central Adriatic. Aquaculture, 262: Dosdat, A Environmental impact of aquaculture in the Mediterranean: nutritional and feeding aspects. Proceedings of the seminar of the CIHEAM Network on Tecnology of Aquaculture in the Mediterranean, Zaragoza, January Cahiers Options Méditerranéennes, 55: Available at: Dougall, N.M. & Black, K.D Determining sediment properties around a marine cage farm using acoustic ground discrimination: RoxAnn super. Aquaculture Research, 30: Duret, J Relationships between aquaculture and the environment. The case of France. (Relations entre aquaculture et environnement: Cas de la France.) Aquaculture planning in Mediterranean countries. Planification de l'aquaculture dans les pays méditerraneens. Cahiers options mediterraneennes, 43: EIFAC/ICES Report on the EIFAC/ICES working group on eels. ICES/CM. EIFAC/ICES Report of the ICES/EIFAC Working Group on Eels. ICES CM. 2004/ACFM:09. EIFAC/ICES Report of the ICES/EIFAC Working Group on Eels. ICES CM 2005/I:09, Ref. G, ACFM. 203
213 EIFAC/ICES Report of the ICES/EIFAC Working Group on Eels. ICES CM 2005/I:01, Ref. G, ACFM. EIFAC/ICES Report of the 2006 session of the Joint EIFAC/ICES Working Group on Eels. Rome, January EIFAC Occasional Paper. No. 38, ICES CM 2006/ACFM:16. Rome, FAO/Copenhagen, ICES, 352p. EU Proposal for a Council Regulation establishing measures for the recovery of the stock of European Eel. COM(2005) 472 final, 2005/0201 (CNS). EU Setting Rules governing the use of alien species in aquaculture. Proposal for a Council Regulation. UE EU A strategy for the sustainable development of European aquaculture. Communication from the Commission to the Council and the European Parliament. COM (2002) 511, 26p. EU A strategy for sustainable development of European aquaculture. European Commission, COM(2002) 511. European Aquaculture Society, Oostende (Belgium) Defining indicators for sustainable aquaculture development in Europe. Consensus - Sustainable Aquaculture in Europe. Oostende (Belgium), Nov European Aquaculture Society, 118 p. Evans, B.B. & Lester, R.J.G Parasites of ornamental fish imported into Australia. Bulletin European Association Fish Pathologists, 21: Fabi, G., Manoukian, S. & Spagnolo, A Impact of an open-sea suspended mussel culture on macrobenthic community (Western Adriatic Sea). Aquaculture, 289: FAO Building an ecosystem approach to aquaculture. Soto, D; Aguilar-Manjarrez, J; Hishamunda, N (eds). FAO/Universitat de les Illes Balears Expert Workshop 7 11 May 2007 Palma de Mallorca, Spain. FAO Fisheries and Aquaculture Proceedings. No. 14, 221p. FAO The state of world fisheries and aquaculture.fao, 153 pp. FAO Report on the consultation on the application of article 9 of the FAO code of conduct for Responsible Fisheries in the Mediterranean, Rome, Jul. FAO Fisheries Report No. 606 FIRI/R606(Bi). FAO Technical Guidelines for Responsible Fisheries. FAO Fisheries Department. Inland fisheries. No 6, Rome, FAO, 36p. FAO Code of Conduct for Responsible Fisheries. Environmental Regime Marine; Freshwater. FAO, 55p. FAO Environmental management of aquaculture development. Cyprus. FAO-FI- TCP/CYP/2251. FAO/NACA The Asia Regional Technical Guidelines on Health Management for the Responsible Movement of Live Aquatic Animals and the Beijing Consensus and Implementation Strategy. FAO Fish. Tech. Paper No p. Fernandez-Jover, D., Jimenez, J.A.L., Sanchez-Jerez, P., Bayle-Sempere, J., Casalduero, F.G., Lopez, F.J.M. & Dempster, T Changes in body condition and fatty acid composition of wild Mediterranean horse mackerel (Trachurus mediterraneus, Steindachner, 1868) associated to sea cage fish farms. Marine Environmental Research, 63: Fernandez-Jover, D., Sanchez-Jerez, P., Bayle-Sempere, J., Carratala, A. & Leon, V.M Addition of dissolved nitrogen and dissolved organic carbon from wild fish faeces and food around Mediterranean fish farms: Implications for waste- dispersal models. Journal Experimental Marine Biology Ecology, 340: Flajshans, M. & Hulata, G Genetic effects of domestication, culture and breeding of fish and shellfish, and their impacts on wild populations. Common carp Cyprinus carpio. p 32-39, in: Svåsand T., Crosetti D., García-Vázquez E., Verspoor E. (eds). Evaluation of genetic impact of aquaculture activities on native populations: a European network. GENIMPACT Final Report (EU contract n. RICA-CT )
214 Focardi, S Preface to the International workshop on Sustainable aquaculture: animal welfare, human health and interactions with the environment. Pontignano (Siena, Italy), March 31st-April 1st, Aquaculture International, 13: Frankic, A Integrated Coastal Management & Sustainable Aquaculture Development in the Adriatic Sea. Republic of Croatia. Project Report, Ministry for Agricolture, Forestry and Fisheries, Government of Croatia. 81p. Frederiksen, M.S., Holmer, M., Diaz-Almela, E., Marba, N. & Duarte, C.M Sulfide invasion in the seagrass Posidonia oceanica at Mediterranean fish farms: Assessment using stable sulfur isotopes. Marine Ecology Progress Series, 345: Gangnery, A. Bacher, C. & Buestel, D Assessing the production and the impact of cultivated oysters in the Thau lagoon (Mediterrannée, France) with a population dynamics model. Canadian Journal Fisheries Aquatic Science, 58: Garcia Serge, M. & Grainger, R.J.R Gloom and doom? The future of marine capture fisheries. One contribution of 15 to a Theme Issue 'Fisheries: a Future?'. Philosophical Transactions: Biological Sciences, 1453: GESAMP (IMO/FAO/UNESCO-IOC/WMO/WHO/IAEA/UN/UNEP) Planning and management for sustainable coastal aquaculture development. Reports Studies GESAMP, 68: 90 p. GESAMP (IMO/FAO/UNESCO/WMO/WHO/IAEA/UN/UNEP) Reducing Environmental Impacts of Coastal Aquaculture. Reports Studies GESAMP, 47: 35p. GESAMP The state of the marine environment. UNEP Regional Seas Reports and Studies, N. 39: 111 p. Giangrande, A., Cavallo, A., Licciano, M., Mola, E., Pierri, C. & Trianni, L Utilization of the filter feeder polychaete Sabella. Aquaculture International, 13: Glover, K.A., Svasand, T. Olesen, I. & Rye, M Atlantic Halibut Hippoglossus hippoglossus in: Genetic effects of domestication, culture and breeding of fish and shellfish, and their impacts on wild populations. D. Crosetti, S. Lapegue, I. Olesen, T. Svaasand (eds). GENIMPACT project: Evaluation of genetic impact of aquaculture activities on native populations. A European network. WP1 workshop Genetics of domestication breeding and enhancement of performance of fish and shellfish, Viterbo. Italy, June, 2006, 5 pp. Golani, D Fish assemblages associated with net pen mariculture and an adjacent rocky habitat in the Port of Ashdod, Israel (eastern Mediterranean) - preliminary results. Acta adriatica, 44: Gowen, R.J., Karakassis, I. & Tett, P Cage farming of fish and the marine environment in Cyprus. FAO 32p. Haffray, P., Tsigenopoulos, C.S., Bonhomme, F., Chatain, B., Magoulas, A., Rye, M., Triantafyllidis, A. & Triantaphyllidis, C Genetic effects of domestication, culture and breeding of fish and shellfish, and their impacts on wild populations. European sea bass - Dicentrarchus labrax. p 40-46, in: Svåsand T., Crosetti D., García-Vázquez E., Verspoor E. (eds). Evaluation of genetic impact of aquaculture activities on native populations: a European network. GENIMPACT Final Report (EU contract n. RICA-CT ). Hayes, S.A., Bond, M.H., Hanson, C.V. & MacFarlane, R.B Interactions between endangered wild and hatchery salmonids: can the pitfalls of artificial propagation be avoided in small coastal streams? Journal of Fish Biology, 65: Hezri, A.A. & Dovers, S.R Sustainability indicators, policy and governance: Issues for ecological economics. Ecological Economics, 60: Hickman, R.W The fisheries-aquaculture relationship in New Zealand; is it competitive or complementary? in: Hancock, D.A. ; Smith, D.C. ; Grant, A. ; Beumer, J.P. (eds). World Fisheries Congress, Brisbane (Australia), 28 Jul-2 Aug Developing and sustaining world fisheries resources. The state of science and management, Hill, B National and international impacts of white spot disease of shrimp. Bulletin of the European Association of Fish Pathologists, 22:
215 Holmer, M., Argyrou, M., Dalsgaard, T., Danovaro, R., Diaz-Almela, E., Duarte, C.M., Frederiksen, M., Grau, A., Karakassis, I., Marba, N., Mirto, S., Perez, M., Pusceddu, A. & Tsapakis, M Effects of fish farm waste on Posidonia oceanica meadows: Synthesis and provision of monitoring and management tools. Marine Pollution Bulletin, 56: Holmer, M. & Frederiksen, Μ.S Stimulation of sulfate reduction rates in Mediterranean fish farm sediments inhabited by the seagrass Posidonia oceanica. Biogeochemistry, 85: Holmer, M., Marba, N., Diaz-Almela, E., Duarte, C.M., Tsapakis, M. & Danovaro, R Sedimentation of organic matter from fish farms in oligotrophic Mediterranean assessed through bulk and stable isotope (delta super(1) super(3)c and delta super(1) super(5)n) analyses. Aquaculture, 262: ICES Report of the Working Group on Environmental Interactions of Mariculture (WGEIM), April 2006, Narragansett, Rhode Island, USA. ICES CM 2006/MCC: p. ICES International Council for the Exploration of the Sea Conseil International pour l Exploration de la Mer Palægade 2 4 DK 1261 Copenhagen K Denmark. ICES CM 2003/F:05 Report of the Working Group on Marine Shellfish Culture, pp ICES Code of Practice on the Introductions and Transfers of Marine Organisms. ICES Cooperative Research Report No ICES Codes of Practice and Manual of Procedures for Consideration of the Introductions and Transfers of Marine and Freshwater Organisms. EIFAC publication as EIFAC Occasional Paper No. 23, 44p. IUCN Guide for the Sustainable Development of Mediterranean Aquaculture 1. Interaction between Aquaculture and the Environment. IUCN, Gland, Switzerland and Malaga, Spain. 107 p. IUCN Guide for the Sustainable Development of Mediterranean Aquaculture 2. Aquaculture Site Selection and Site Management. IUCN, Gland, Switzerland and Malaga, Spain. 303 p. Iwama, G.K Interactions between Aquaculture and the Environment. CRC Critical Reviews in Environmental Control, CCECAU, 21: Izzo, G Monitoring of Mediterranean marine eutrophication: strategy, parameters and indicators. UNEP(DEC) Report (draft) presented in Review meeting of MED-POL, Rome 5-7 Dec Jan Maat, A Draft report on the development of a Community Action Plan for the management of European eel (2005/2032(INI). Committee on Fisheries, Draft report. Joerstad, K.E., Fjalestad, K.T., Agustsson, T. & Marteinsdottir, G Genetic effects of domestication, culture and breeding of fish and shellfish, and their impacts on wild populations. Atlantic cod Gadus morhua. p 10-16, in: Svåsand T., Crosetti D., García-Vázquez E., Verspoor E. (eds). Evaluation of genetic impact of aquaculture activities on native populations: a European network. GENIMPACT Final Report (EU contract n. RICA-CT ). Kapuschinki, A.R. & Brister, D Genetic impacts of aquaculture. Sheffield, United Kingdom, Sheffield Academic Press, pp Karakassis, I Ecological effects of fish farming in the Mediterranean. In: Environmental impact assessment of Mediterranean aquaculture farms. Cahiers Options Mediterranean, 55: Karakassis, I. & Angel, D Aquaculture and the environment in the Mediterranean: available information and proposed steps forward. FAO, GFCM. Karakassis, I. & Hatziyanni, E Benthic disturbance due to fish farming analyzed under different levels of taxonomic resolution. Marine Ecology Progress Series, 203: Karakassis, I., Hatziyanni, E., Tsapakis, M. & Plaiti, W Benthic recovery following cessation of fish farming: a series of successes and catastrophes. Marine Ecology Progress Series, 184:
216 Karakassis, I., Tsapakis, M. & Hatziyanni, E Seasonal variability in sediment profiles beneath fish farm cages in the Mediterranean. Marine Ecology Progress Series, 162: Karakassis, I., Tsapakis, M., Hatziyanni, E., Papadopoulou, K.N. & Plaiti, W Impact of cage farming of fish on the seabed in three Mediterranean coastal areas. ICES Journal of Marine Science, 57: Karakassis, I., Tsapakis, M., Hatziyanni, E. & Pitta, P Diel variation of nutrients and chlorophyll in sea bream and sea bass cages in the Mediterranean. Fresenius Environmental Bulletin 10: Katavic, I The environmental impacts of marine fish cage farms in the eastern Adriatic. Ribarstvo, 61: Katavic, I. & Antolic, B On the impact of a sea bass (Dicentrarchus labrax L.) cage farm on water quality and macrobenthic communities. Acta Adriatica, 40, Katavic, I. & Ticina, V Fishing and farming of the northern bluefin tuna (Thunnus thynnus L.) in the Adriatic Sea. In: Interactions between aquaculture and capture fisheries: a methodological perspective ; Studies and Reviews - General Fisheries Commission for the Mediterranean (FAO), no. 78 Cataudella, S. (ed.) Massa, F. (ed.) Crosetti, D. (ed.) / FAO, Rome (Italy). General Fisheries Commission for the Mediterranean, p Katavic, I., Herstad, T.J., Kryvi, H., White, P., Franicevic, V. & Skakelja, N Guidelines to marine aquaculture planning, integration and monitoring in Croatia. Project Coastal zone management plan for Croatia, Zagreb, pp. 78. Katranidis, S., Nitsi, E. & Vakrou, A Social acceptability of aquaculture development in coastal areas: the case of two Greek Islands. Coastal management, 31: Kim, J.E., Withler, R.E., Ritland, C. & Cheng, K.M Genetic variation within and between domesticated chinook salmon, Oncorhynchus tshawytscha, strains and their progenitor populations. Environmental Biology of Fishes, 69: Kirk, R.S The impact of Anguillicola crassus on European eels. Fisheries Management and Ecology, 10: Klaoudatos, S.D Environmental impact of aquaculture in Greece. Practical experiences. in: Environmental impact assessment of Mediterranean aquaculture farms; Proceedings of the seminar of the CIHEAM network on technology of aquaculture in the Mediterranean (TECAM), jointly organized by CIHEAM and FAO, Zaragoza (Spain), January 2000 ; Cahiers Options Mediterraneennes (France), v. 55 Uriarte, A. (ed.) Basurco, B. (ed.) / International Centre for Advanced Mediterranean Agronomic Studies, Zaragoza (Spain). Mediterranean Agronomic Inst.; FAO, Rome (Italy). Plant Production and Protection Div., 2001, p Kleenam, S.N To hazard or not to hazard, this is the question : how unknowns in science affect the identification of hazards in an import risk analysis. Network of Aquaculture Centres in Asia Pacific (NACA), Kokkinakis, A.K., Van Rijn, J., Neori, A., Poulton, S.W., Eleftheriadis, E. & Krom, M.D Preliminary results from the operation of a pilot recirculating mariculture production system with the usage of biofilters. 10th Panellenic Congress of Ichthyologists, Chania, Greece, Oct , Proceedings. Praktika, Kruzic, P Variations in Posidonia oceanica meadow structure along the coast of the Dugi Otok Island (eastern Adriatic Sea). Marine Biological Association UK, 88: Lampadariou, N., Akoumianaki, I. & Karakassis, I Use of the size fractionation of the macrobenthic biomass for rapid assessment of benthic organic enrichment. Ecol Ind., 8: Lampadariou, N., Karakassis, I., Terascheke, S. & Arlt, G Changes in benthic meiofaunal assemblages in the vicinity of fish farms in the Eastern Mediterranean. Vie et Milieu, 55: Lapègue, S., Beaumont, A., Boudry, P. & Goulletquer, P Genetic effects of domestication, culture and breeding of fish and shellfish, and their impacts on wild populations. European flat oyster - Ostrea edulis. p 70-75, In: Svåsand T., Crosetti D., García-Vázquez E., Verspoor E. (eds). 207
217 Evaluation of genetic impact of aquaculture activities on native populations: a European network. GENIMPACT Final Report (EU contract n. RICA-CT ). Lapègue, S., Boudry, P. & Goulletquer, P Genetic effects of domestication, culture and breeding of fish and shellfish, and their impacts on wild populations. Pacific cupped oyster - Crassostrea gigas. p In: Svåsand T., Crosetti D., García-Vázquez E., Verspoor E. (eds). Genetic impact of aquaculture activities on native populations. GENIMPACT final scientific report (EU contract n. RICA-CT ). La Rosa, T., Mirto, S., Favaloro, E., Savona, B., Sara`, G., Danovaro, R. & Mazzola, A Impact on the water column biogeochemistry of a Mediterranean mussel and fish farm. Water Research, 36: La Rosa, T., Mirto, S., Mazzola, A. & Danovaro, R Differential responses of benthic microbes and meiofauna to fish-farm disturbance in coastal sediments. Environmental Pollution, 112: Lemarie, G., Martin, J.L.M., Dutto, G. & Garidou, C Nitrogenous and phosphorus waste production in a flow-through land-based farm of European seabass (Dicentrarchus labrax). Aquatic Living Resources, 11: Lembo, G., Carbonara, P., Scolamacchia, M., Spedicato, M.T. & McKinley, R.S Use of muscle activity indices as a relative measure of well-being in cultured sea bass Dicentrarchus labrax (Linnaeus, 1758). Hydrobiologia, 582: Liu, Z.J. & Cordes, J.F DNA marker technologies and their applications in aquaculture genetics. Aquaculture, 238: Lopez Alvarado, J Aquafeeds and the environment. In : Feeding tomorrow's fish. Proceedings of the Workshop of the CIHEAM Network on Technology of Aquaculture in the Mediterranean (TECAM), jointly organized by CIHEAM, FAO and IEO, Mazarron (Spain). Cahiers Options Mediterraneennes, 22: Lupatsch, I. & Kissil, G.M Predicting aquaculture waste from gilthead seabream (Sparus aurata) culture using a nutritional approach. Aquatic Living Resource, 11: Machias, A., Karakassis, I., Labropoulou, M., Somarakis, S., Papadopoulou, K.N. & Papaconstantinou, C Changes in wild fish assemblages after the establishment of a fish farming zone in an oligotrophic marine ecosystem. Estuarine, Coastal and Shelf Science, 60: Machias, A., Karakassis, I., Somarakis, S., Giannoulaki, P., Papadopoulou, K.N. & Smith, C The response of demersal fish communities to the presence of fish farms. Marine Ecology Progress Series, 288: Maclean, N. & Laight, R.J Transgenic fish: an evaluation of benefits and risks. Fish and Fisheries, 1: Mahmoudi, E., Essid, N., Beyrem, H., Hedfi, A., Boufahja, F., Aissa, P. & Vitiello, P Musselfarming effects on Mediterranean benthic nematode communities. Nematology, 10: Mannini, P., Massa, F. & Milone, N Adriatic sea fisheries: outline of main facts, in: Cataudella, S., Massa, F. and Crosetti, D. (eds.), Interactions between aquaculture and capture fisheries: a methodological perspective.. General Fisheries Commission for the Mediterranean. Studies and Reviews, FAO, 78: Mantzavrakos, E., Kornaros, M., Lyberatos, G. & Kaspiris, P Impacts of a marine fish farm in Argolikos Gulf (Greece) on the water column and the sediment. Desalination, 210: Marin, A., Montoya, S., Vita, R., Marin-Guirao, L., Lloret, J. & Aguado, F Utility of sea urchin embryo-larval bioassays for assessing the environmental impact of marine fishcage farming. Aquaculture, 271: Mathé, S., Rey-Valette, H. & Chia, E Key issue and some postulates concerning the use of sustainable development indicators: the example of Aquaculture. FAO, GFCM:CAQ/VI/2008/Inf
218 Matijevic, S., Kuspilic, G. & Kljakovic-Gaspic, Z The redox potential of sediment from the Middle Adriatic region. Acta Adriatic, 48: Matijevic, S., Kuspilic, G., Kljakovic-Gaspic, Z. & Bogner, D Impact of fish farming on the distribution of phosphorus in sediments in the middle Adriatic area. Marine Pollution Bulletin, 56: Mazon, M.J., Piedecausa, M.A., Hernandez, M.D. & Garcia Garcia, B Evaluation of environmental nitrogen and phosphorus contributions as a result of intensive ongrowing of common octopus (Octopus vulgaris). Aquaculture, 266: MEDRAP II Regional Centre Workshop on Intensive Farming Outfalls on the Coastal Ecosystem. Djerba, Tunisia, April 12-14, Tunis (Tunisia). 90 p. Project: FAO-FI- DP/RAB/89/005. Project: FAO-FI-DP/RER/87/009 Aquaculture Development in the Mediterranean Region (Phase II). Field Document 94/30. MEDRAP II Regional Centre Working Group on the Development of Lagoon Management Methodology. Montpellier, France, June 27-30, Tunis (Tunisia). 121 p. Project: FAO-FI- DP/RAB/89/005. Project: FAO-FI-DP/RER/87/009 Aquaculture Development in the Mediterranean Region (Phase II). Field Document 94/35. MEDRAP II Regional Centre Working Group on the Elaboration of EAM Programme of Activities. Biarritz, September 8-10, Tunis (Tunisia). 25 p. Project: FAO-FI- DP/RAB/89/005. Project: FAO-FI-DP/RER/87/009 Aquaculture Development in the Mediterranean Region (Phase II). Field Document 93/25. MEDRAP II Regional Centre Network Constitution Seminar on Environment and Aquaculture in the Mediterranean EAM. Athens, June 14-15, Tunis (Tunisia). 102 p. Project: FAO-FI- DP/RAB/89/005. Project: FAO-FI-DP/RER/87/009 Aquaculture Development in the Mediterranean Region (Phase II). Field Document 93/23. MEDRAP II Regional Centre Seminar on Aquaculture Environment in the Mediterranean. Project: FAO-FI-DP/RAB/89/005. Project: FAO-FI-DP/RER/87/009 Aquaculture Development in the Mediterranean Region (Phase II). Field Document 91/11. MedVeg Environmental issues of marine fish farming in the Mediterranean. Effects of nutrient release from Mediterranean fish farms on benthic vegetation in coastal ecosystems. Workshop in Barcelona, October 20, MedVeg - A EU-funded project. Mente, E., Pantazis, P., Neofitou, C., Aifanti, S., Santos, M.B., Oxouzi, E., Bagiatis, V., Papapanagiotou, E., Kourkouta, V. & Soutsas, K Socioeconomic interactions of fisheries and aquaculture in Greece: a case study of south evoikos gulf. Aquaculture Economics & Management, 11: Miggiano, E., De Innocentiis, S., Ungaro, A., Sola, L. & Crosetti, D AFLP and microsatellites as genetic tags to identify cultured gilthead seabream escapees: data from a simulated floating cage breaking event. Aquaculture International, 13: Mirto, S., La Rosa, T., Gambi, C., Danovaro, R. & Mazzola, A Fish farming impact on nematode. Environmental Pollution, 116: Miyadai, Toshiaki., Kitamura, Shin-Ichi., Uwaoku, Hideki. & Tahara, Daisuke Experimental infection of several fish species with the causative agent of Kuchijirosho (snout ulcer disease) derived from the tiger puffer Takifugu rubripes. Diseases of Aquatic Organisms, 47: Molina Dominguez, L., Lopez Calero, G., Vergara Martin, J.M., Robaina Robaina, L. & Fernandez- Palacios, H Retention and discharge of nutrients from a marine cage farm in the Canary Islands. Preliminary results. Feeding tomorrow's fish. Proceedings of the Workshop of the CIHEAM Network on Technology of Aquaculture in the Mediterranean (TECAM), jointly organize. Cahiers options mediterraneennes, 22: Moriarty, C The European eel fishery in 1993 and First report of a working group funded by the European Union Concerted Action AIR A Fisheries Bulletin (Dublin), 14, 52 pp. Muir, J.F., Young, J.A. & Northw, J Aquaculture and marine fisheries: will capture fisheries remain competitive? Atl. Fish. Sci., 23:
219 Muir, W.M The threats and benefits of GM fish. EMBO Rep, 5: Munday, B.W., Eleftheriou, A., Kentouri, M. & Divanach, P Quantitative statistical analysis of the literature concerning the interaction of the environment and aquaculture-identification of gaps and lacks. Journal of applied ichthyology, 10: Myhr, A.I. & Dalmo, R.A Introduction of genetic engineering in aquaculture: ecological and ethical implications for science and governance. Aquaculture, 250: Myhr, A.I., Traavik, T. & Agric, J Genetically modified crops: precautionary science and conflicts of interests. Environment Ethics, 16: NASCO Report on the Activities of the North Atlantic Salmon. Conservation Organisation , 16 p. Nash, C.E., Burbridge, P.R. & Volkman, J.K Guidelines for ecological risk assessment of marine fish aquaculture. U.S. Dept. Commer., NOAA Tech. Memo. NMFS-NWFSC-71, 90 p. Navarro, N., Leakey, R.J.G. & Black, K.D Effect of salmon cage aquaculture on the pelagic environment of temperate coastal waters: seasonal changes in nutrients and microbial community. Marine Ecology Progress Series, 361: Naylor, R.L., Goldburg, R.J., Primavera, J.H., Kautsky, N., Beveridge, M.C.M., Clay, J., Folke, C., Lubchenco, J., Mooney, H. & Troell, M Effect of aquaculture on world fish supplies. Nature, 405: Naylor, R.L., Hindar, K., Fleming, I.A., Goldburg, R., Williams, S., Volpe, J., Whoriskey, F., Eagle, J., Kelso, D. & Mangel, M Fugitive salmon: assessing risks of escaped fish from aquaculture. BioScience, 55: Neofitou, N. & Klaoudatos, S Effect of fish farming on the water column nutrient concentration in a semi-enclosed gulf of the Eastern Mediterranean. Aquaculture Research, 39: OIE Aquatic Animal Health Code. 6th ed. Office International des Epizooties, Paris, 165 p. Orpwood, J.E., Griffiths, S.W. & Armstrong, J.D Effect of density on competition between wild and hatchery-reared Atlantic salmon for shelter in winter. Journal of Fish Biology, 65: Ottolenghi, F., Silvestri, C., Giordano, P., Lovatelli, A. & New, M.B Capture-based aquaculture. The fattening of eels, groupers, tunas and yellowtails. Rome, FAO, 308p. PAP/RAC Approaches for zoning of coastal areas with reference to Mediterranean aquaculture. PAP-IO/EAM/GL.2 Split. 35p. Papoutsoglou, S., Costello, M.J., Stamou, E. & Tziha, G Environmental conditions at sea-cages, and ectoparasites on farmed European sea-bass, Dicentrarchus labrax (L.), and gilt-head seabream, Sparus aurata L., at two farms in Greece. Aquaculture Research, 27: Peeler, E.J. & Murray, A.G Disease interaction between farmed and wild fish populations. Journal of Fish Biology, 65, s1: Perez, M., Garcia, T., Invers, O. & Ruiz, J.M Physiological responses of the seagrass Posidonia oceanica as indicators of fish farm impact. Marine Pollution Bulletin, 56: Pergent, G., Mendez, S., Pergent-Martini, C. & Pasqualini, V Preliminary data on the impact of fish farming facilities on Posidonia oceanica meadows in the Mediterranean. Oceanologica Acta, 22: Petit, J Environment and aquaculture: 1. Technical and economic aspects. Environnement et aquaculture: 1. Aspects techniques et economiques Un Point sur. INRA, 214pp. Pillay, T.V.R Aquaculture and the environment, 2. ed, Oxford (United Kingdom). Blackwell, 196p. Poli, B.M Quality and certification of fishery products from both capture and farming in the same market place. in: Cataudella, S., Massa, F. and Crosetti, D. (eds.), Interactions between aquaculture and capture fisheries: a methodological perspective. FAO, General Fisheries Commission for the Mediterranean, 78:
220 Porrello, S., Lenzi, M., Ferrari, G., Persia, E., Savelli, F. & Tomassetti, P Loading of nutrient from a land-based fish farm (Orbetello, Italy) at different times. Aquaculture International, 13: Porrello, S., Lenzi, M., Tomassetti, P., Persia, E., Finoia, M.G. & Mercatali, I Reduction of aquaculture wastewater eutrophication by phytotreatment ponds system. II. Nitrogen and phosphorus content in macroalgae and sediment. Aquaculture, 219: Porrello, S. & Marino, G Guidelines for mariculture. ICRAM Research Report, p 178. Porter, G Protecting wild Atlantic salmon from impacts of salmon aquaculture: a country-bycountry. 2nd Edition, Executive summary. World Wildlife Fund and Atlantic Salmon Federation, 10p. Prioli, G An example of interactions between capture fisheries and aquaculture: the case of shellfish in: Cataudella, S., Massa, F. and Crosetti, D. (eds.). Interactions between aquaculture and capture fisheries: a methodological perspective. FAO, General Fisheries Commission for the Mediterranean, 78: Prodöhl, P.A., Jørstad, K.E., Triantaphyllidis, A., Katsares, V. & Triantaphyllidis, C Genetic effects of domestication, culture and breeding of fish and shellfish, and their impacts on wild populations. European lobster Homarus gammarus. p 91-98, In: Svåsand T., Crosetti D., García- Vázquez E., Verspoor E. (eds). Evaluation of genetic impact of aquaculture activities on native populations: a European network. GENIMPACT Final Report (EU contract n. RICA-CT ). Pullin, R.S.V., Froese, R. & Pauly, D Indicators for the sustainability of aquaculture. Methods and Technologies in Fish Biology and Fisheries, 6: Relini, G Fishery and aquaculture relationship in the Mediterranean: present and future. Mediterranean marine science, 4: Rey-Valette, H., Clement, O., Aubin, J., Mathé, S., Chia, E., Legendre, M., Caruso, D., Mikolasek, O., Blancheton, J.P., Slembrouck, J., Baruthio, A., Rene, F., Levang, P. & Morissens, P Guide to the co-construction of sustainable development indicators in aquaculture. EVAD project, Cirad, Montpellier (France), 144 p. Sadek, S. & Mires, D Capture of wild finfish fry in Mediterranean coastal areas and possible impact on aquaculture development and marine. Israeli Journal of Aquaculture. Bamidgeh, 52: Saenz de Buruaga, M Normes de qualite et environnementales: pollution, produits medicamenteux, etc. Bases, procedures et enjeux economiques (Quality and environmental standards: pollution, drugs, etc. Bases, procedures and economic implications.) Global Quality Assessmen. Proceedings of the Workshop of the CIHEAM Networks on Technology of Aquaculture in the Mediterranean (TECAM) and Socio-Economic and Legal Aspects of Aquaculture in the Mediterranean (SELAM), jointly organized by the International Centre for Advanced Medit. Sanchez-Jerez, P., Fernandez-Jover, D., Bayle-Sempere, J., Valle, C., Dempster, T., Tuya, F. & Juanes, F Interactions between bluefish Pomatomus saltatrix (L.) and coastal sea-cage farms in the Mediterranean Sea. Aquaculture, 282: Sanchez-Mata, A. & Mora, J A review of marine aquaculture in Spain: Production, regulations and environmental monitoring. Journal of Applied Ichthyology, 16: Sara`, G., Scilipoti, D., Mazzola, A. & Modica, A Effects of fish farming waste to sedimentary and particulate organic matter in a southern Mediterranean area (Gulf of Castellammare, Sicily): a multiple stable isotope study ( delta super(13)c and delta super(15)n). Aquaculture, 234: Smith, J. & Shackley, S.E Effects of a commercial mussel Mytilus edulis lay on a sublittoral, soft sediment benthic community. Marine ecology progress series, 282:
221 Sola, L., Moretti, A., Crosetti, D., Karaiskou, N., Magoulas, A., Rossi, A.R., Rye, M., Triantaphyllidis, A. & Tsigenopoulos, C.S Genetic effects of domestication, culture and breeding of fish and shellfish, and their impacts on wild populations. Gilthead seabream - Sparus aurata. p 47-54, In: Svåsand T., Crosetti D., García-Vázquez E., Verspoor E. (eds). Evaluation of genetic impact of aquaculture activities on native populations: a European network. GENIMPACT Final Report (EU contract n. RICA-CT ). Sorokin, Y., Sorokin, P. & Ravagnan, G Analysis of Lagoonal Ecosystems in the Po River Delta Associated with Intensive Aquaculture. Estuarine, Coastal and Shelf Science, 48: Spillman, C.M., Hamilton, D.P. & Imberger, J Management strategies to optimise sustainable clam (Tapes philippinarum) harvests in Barbamarco Lagoon, Italy. Estuarine, Coastal and Shelf Science, 81: Stigebrandt, A., Aure, J., Ervik, A. & Hansen, P.K Regulating the local environmental impact of intensive marine fish farming III. A model for estimation of the holding capacity in the Modelling Ongrowing fish farm Monitoring system. Aquaculture, 234: Tacon, A.G.J Use of fish meal and fish oil in aquaculture: a global perspective. Aquatic Resources, Culture and Development, 1: Tacon, A.G.J., Hasan, M.R. & Subasinghe, R.P Use of fishery resources as feed inputs for aquaculture development: trends and policy implications. FAO, Fisheries Circular N Tacon, A.G.J. & Forster, I Aquafeeds and environment: policy implications. Aquaculture, 226: Takashima, Youji., Watanabe, Naoki., Yanai, Takanori., Nakamura, Takeo The status of Koi Herpesvirus disease outbreaks in Lake Kasumigaura and Kitaura. Bulletin of Fisheries Research Agency (Japan), 2: Telfer, T.C. & Beveridge, M.C.M Monitoring environmental effects of marine fish aquaculture. Proceedings of the seminar of the CIHEAM network on technology of aquaculture in the Mediterranean (TECAM), jointly organized by CIHEAM and FAO, Zaragoza (Spain), January Cahiers Options Mediterraneennes, 55: Thia-Eng, C Asian Fisheries in the Context of Food Security and the Environment. Keynote addresses: 5th and 6th Asian Fisheries Forums. AFS Special Publication, 11: Tietz, W Whirling disease: a serious threat to wild trout propagation. Aquaculture. Book of Abstracts, 542p. Tomassetti, P. & Porrello, S Polychaetes as indicators of marine fish farm organic enrichment. Aquaculture International, 13: UNEP/MAP Mediterranean vision for sustainable development. UNEP/MAP Athens, June UNEP/MAP/MED POL Mariculture in the Mediterranean. MAP Technical Reports Series No. 140, UNEP/MAP Athens. Uriarte, A. & Basurco, B Environmental impact assessment of Mediterranean aquaculture farms: Proceedings of the seminar of the CIHEAM network on technology of aquaculture in the Mediterranean (TECAM), CIHEAM and FAO. Cahiers Options Mediterranean (France), v. 55 / International Centre for Advanced Mediterranean Agronomic Studies, Zaragoza (Spain). Mediterranean Agronomic Inst.; FAO, Rome (Italy). Plant Production and Protection Div. 213 p. Weaver, D.E. Importation of disease with ornamental fish: problem and risk analysis. Welcomme, R. & Craig, J.F Nature and culture: comparative biology and interactions of wild and farmed fish. The Fisheries Society of the British Isles Annual Symposium, London, UK, July World Wildlife Fund and Atlantic Salmon Federation Protecting Wild Atlantic Salmon from Impacts of Salmon Aquaculture: A Country-by-Country. Progress Report 2nd Edition, available at
222 Verlaque, M Inventaire des macroalgues de l'etang de Thau (Herault, France), un lieu privilegie d'introduction d'especes marines en Europe. (Checklist of the macroalgae of Thau Lagoon - Herault, France - a hot spot of marine species introduction in Europe). Oceanologica Acta, 24: Verspoor, E., Olesen, I., Bentsen, H.B., Glover, K., McGinnity, P. & Norris, A Genetic effects of domestication, culture and breeding of fish and shellfish, and their impacts on wild populations. Atlantic salmon Salmo salar. p 23-31, In: Svåsand T., Crosetti D., García-Vázquez E., Verspoor E. (eds). Evaluation of genetic impact of aquaculture activities on native populations: a European network. GENIMPACT Final Report (EU contract n. RICA-CT ). Verspoor, E., Stradmeyer, L. & Nielsen, J.L The Atlantic Salmon: Genetics, Conservation and Management. Blackwell Publishing, pp.514. Vezzulli, L., Moreno, M., Marin, V., Pezzati, E., Bartoli, M. & Fabiano, M Organic waste impact of capture-based Atlantic bluefin tuna aquaculture at an exposed site in the Mediterranean Sea. Estuarine Coastal Shelf Science, 78: Vita, R., Marin, A., Madrid, J.A., Jimenez-Brinquis, B., Cesar, A. & Marin-Guirao, L Effects of wild fishes on waste exportation from a Mediterranean fish farm. Marine Ecology Progress Series, 277: Yucel-Gier, G., Uslu, O. & Bizsel, N Effects of marine fish farming on nutrient composition and plankton communities in the Eastern Aegean Sea (Turkey). Aquac Res., 39: Zanella, L., Tessarin, C., Cattelan, R., Scordella, G. & Grimaldi, E Seasonal fluctuations of the organic load of sediments in two ponds of a brackish-water fish farm ("Valle") located in the Po River delta (Italian North Adriatic). Ophelia, 53: Zenetos, A., Streftaris, N. & Larsen, L.H. An indicator-based approach to assessing the environmental performance of European marine fisheries and aquaculture- Svoping study. EEA Techn. Rep., 87, 65p. 213
223 Annex 8 Projects and initiatives on aquaculture sustainability in the Mediterranean region and related issues EVAD : Evaluation de la durabilité des systèmes de production aquacoles. Elaboration d'une méthode et application dans différents contextes en zones tropicales et tempérée (Assessment of sustainable development of Aquaculture) Project funded by: ANR, French National Research Agency. Agriculture and sustainable development programme Duration: / Project Coordinator: Lazard Jérôme (CIRAD, Montpellier) Partners: CIRAD -Centre de coopération internationale en recherche agronomique pour le développement- Montpellier; Ifremer, Laboratoire de Palavas; INRA -Institut National pour la Recherche agronomique- Rennes (Dépt Environnement Agronomie); IRD -Institut de recherche pour le développement- Montpellier; Université Montpellier 1 (UFR Sciences Économiques); INRA - Institut National pour la Recherche agronomique- Saint Pee Sur Nivelle (Dépt. Physiologie Animale et Systèmes d Elevage). Aims of the project The objective of this project was to propose a generic method of analysis of development factors in aquaculture to evaluate its sustainability, and to adapt it to the local contexts through the perception of the different actors involved in aquaculture (producers, regulating institutions, tradesmen, distributors, consumers). This step implied the construction of a common framework of analysis of the aquaculture systems, in order to organize the implementation of the sustainability factors. One of the intermediate products of the project was to propose a representation framework of the aquaculture systems. These representations were to be completed for agriculture and for terrestrial animal husbandry, but also for fisheries and aquaculture. The method adopted in the project aimed at conceiving and putting into practice principles, criteria and indicators for the development of sustainable aquaculture. These indicators were built with the participation of the various groups of actors in the environmental, social and economic contexts of 5 case studies, reflecting different aquaculture realities: Brittany (France): its intensive production of freshwater trouts is decreasing parallel to the increase of strict environmental regulations, and in a phase of market stagnation, Mediterranean region: with a concentration of aquaculture facilities in certain areas and a strong touristic pressure on the coastal areas which pushes aquaculture production facilities away from the shore, Philippines: coastal brackish water production systems where the intensification level evolves according to the national economic context, Cameroun: fish farm innovation and development are linked to strong diversification dynamics of the agriculture system in the framework of important radical socio-economic changes, 214
, 24-25 November 2008.")
224 Indonesia (Java and Sumatra): village fish farming generally integrated with other agriculture or non agriculture activities; quick development of aquaculture can raise serious issues of environmental impact. The final meeting of the project EVAD: Evaluer le développement durable des systèmes de production en aquaculture was held in Montpellier (France), November Deliverables: Guide de co-construction d indicateurs de développement durable en aquaculture Rey-Valette H., Clément O., Aubin J., Mathé S., Chia E., Legendre M., Caruso D., Mikolasek O., Blancheton J-P., Slembrouck J., Baruthio A., René F., Levang P., Morissens P., Lazard J. Cirad, Ifremer, INRA, IRD, Université Montpellier , in French and in English EVAD is at L outil IDAqua : Indicateurs de Durabilité pour l Aquaculture (IDAqua: Sustainability indicators for French Aquaculture) Duration: / 2008 The IDAqua project aims at defining a set of sustainability indicators for trout farming in France. It is run by CIPA (Comité Interprofessionnel des Produits de l Aquaculture-Paris) and ITAVI (Institut Technique de l Aviculture et de l élevage des petits animaux- Paris) It aims at comparing the traditional physical and chemical water analysis data with biological indicators for water quality and an integrated approach to environmental analysis: the life cycle analysis. This approach was applied to a dozen French trout farms, and tailored within the new French regulation on water (Directive Cadre sur l eau). IDAqua is at (not available yet) CONSENSUS: a Multi-stakeholder Platform for Sustainable Aquaculture Project funded by: Commission of European Communities under the 6th Framework Programme, thematic priority Food Quality and Safety, Project N : FOOD-CT CONSENSUS is an initiative that works towards sustainable European aquaculture by building sustainable aquaculture protocols that are based on low environmental impact, high competitiveness and ethical responsibility with regard to biodiversity and animal welfare. CONSENSUS is steered by the principal European stakeholders the European Consumers Organisation (BEUC), the European Bureau for Conservation and Development (EBCD), the Federation of European Aquaculture Producers (FEAP), the European Mollusc Producers Association (AEPM/EMPA), the European Feed Manufacturers Federation (FEFAC) and the EuropeanAquaculture Society (EAS). It groups together 21 partners from 9 European countries. CONSENSUS is at 215
225 SustainAqua - Integrated approach for a sustainable and healthy freshwater aquaculture. Project funded by: the Commission of European Communities under the 6th Framework Programme, Collective research programme, Project N : COLL-CT Duration: / Project coordinator: Ing. Alexandra Oberdieck Partners: The SustainAqua consortium comprises 10 Industrial Associations/Groupings (IAG), 6 Small and Medium Enterprises (SME) and 7 Research and Technological Departments (RTD) including coordinator TTZ, which together cover all relevant fields of knowledge and experience which are necessary to accomplish the different research, training and management tasks of the project. Below is a list of the consortium members: Aims of the project: The Project will carry out specific research, training and dissemination activities in the field of producing healthy and tasty freshwater fish and other economical valuable by-products mainly by optimising nutrient chains, water management and energy efficiency. The overall objectives are: To encourage the development towards an environmental sound and healthy, and at the same time economic viable and social accepted freshwater aquaculture. To expand the knowledge base and the commercial image of the European freshwater aquaculture farmers by training To improve farmers ability to compete with low-cost aquaculture products from Asia, Latin America and the Caribbean. To respond to European and national legal and customers (supermarkets, individuals) requirements related to product quality, and environmental and health issues. To provide a high nutrition value for the consumer (fish quality). To create more employment especially in rural areas, and throughout the whole aquaculture production chain. To strengthen a sustainable development of rural areas. In the project 7 RTD performers will provide the required know-how in cooperation with the participating 10 IAGs and the SME core group consisting of 6 enterprises from different European countries. The gained knowledge will be the base for certain IAG training activities about sustainable freshwater aquaculture management contributing to spread the knowledge throughout Europe. Outputs: A substantial output from the project has been a handbook for aquaculture farmers, a practical guide to sustainable freshwater fish farming. Over 110 pages long the handbook details the core of the project, the five case studies that were carried out on different species. The handbook is intended as a manual for the fish farmer and each of the chapters on the case studies ends in a section that describes how the methods developed in the case study to achieve specific results can be scaled up to actual farm proportions. The handbook also includes an overview on production methods and technologies used in the main freshwater farming systems in Europe and a review of European legislation in the field. Information based on the case studies on techniques to improve product quality, to diversify production into potentially valuable wetland crops, as well as to grow fruit and vegetable in combination with fish, is also provided in the handbook. 216
226 The book was distributed at the training courses in the local languages (12 different languages) and is available for download on the SustainAqua web site. SustainAqua is at FOESA - Spanish Aquaculture Observatory Foundation The Spanish Aquaculture Observatory Foundation (FOESA), set up in June 2008, is a public Foundation protected by the Spanish Ministry of the Environment and Rural and Marine Affairs (MARM). Its patrons are the Secretary General of the Sea, National Advisory board of marine aquaculture farms (JACUMAR), Spanish Institute of Oceanography (IEO), Spanish National Research Council (CSIC), Spanish Science and Technology Foundation (FECYT) and Alfonso Martin Escudero Foundation (FUNDAME). FOESA s priority is to bring together aquaculture and society, promote and popularize aquaculture, as well as to encourage the sustainability development of the sector. To make this possible it follows the following goals: - Promote aquaculture image and its products through the social community - Be a platform to analyse and monitor aquaculture development in Spain - Reference point to the scientific, technology and industry community To achieve this FOESA works on 5 working lines: - Bringing aquaculture closer to society and media: workshops for the media; photography and aquaculture exhibitions, etc. - Strengthening the bond between RDI and producers: photography and media awards; training; technical sessions; weekly news bulletin, etc. - Publishing and training - Sustainable environment and development: Mediterrane-On - International cooperation: workshops The Mediterrane-On project is co-funded by FOESA and the Spanish Biodiversity Foundation, with IUCN and APROMAR as partners. It aims to provide all those involved in the aquaculture industry (producers, central and regional administrations and international organizations) with a series of measurable indicators applicable to the whole Mediterranean basin, and allowing those involved to analyse and improve the sustainability of this strategic industry for socioeconomic development. The main objectives are: 1. To define and identify indicators capable of measuring sustainable aquaculture at farm/ business, national and Mediterranean level. 2. To provide decision makers and aquaculture producers with a technical tool and advice on the processes of sustainable aquaculture development adapted to the Mediterranean context. 3. To increase awareness in the sustainable use and management of the social, economic and environmental resources available in order to obtain a sustainable balance in the management of the activity. 217
227 To ensure the correct definition and identification of the indicators the following three levels were established: farms and/or production companies, countries and Mediterranean region. For each of these three levels, the pillars or dimensions of sustainability have been contemplated: socio-territorial, economic, environmental aspects. The key to sustainability and sustainable management is based on the balance between these three pillars. With these levels and aspects in mind, a Principle-Criteria- Indicator (PCI) method was chosen as essential and fundamental method to establish the relationship between indicators and principles within the corresponding framework. A wide number of experts from the most important Mediterranean producer countries were contacted and allowed better assessment of the complexity of aquaculture in the Mediterranean basin, to analyse the industry's requirements and the challenges which will have to be faced in the next few years to demonstrate sustainability and become an even more consolidated, extended and well known activity in all countries that share the Mediterranean Sea. This exercise allowed a better definition of the indicators and greater consensus regarding their selection, reinforced by the project team s work and coordination. FOESA is at Marine Conservation Society (MCS) MCS has made a wide consultation of professional and other stakeholders to prepare principles and indicators of sustainable fish farming, with a focus on UK marine aquaculture. The core principles are the responsible siting of fish farms; the use of sustainable sources of feed, minimising the effects of marine pollutants; minimising the wider eco-system effects; optimal welfare standards and environmental management and continuous improvement though research. MCS provides information to consumers about the sustainability of the seafood choices they make from both wild and farmed sources via the website where over 150 species of fish and shellfish are listed with specific advice for each. The Society has also developed its own Principles and Criteria for Sustainable Fish Farming that can be accessed at the web site. The Marine Conservation Society (MCS) is at 218
228 ÉTUDES ET REVUES DE LA CGPM DÉJÀ PUBLIÉES GFCM STUDIES AND REVIEWS ALREADY ISSUED 1 Standardisation de méthodes d'étude biométrique et d'observation de clupéidés (en particulier de Sardina pilchardus) utilisées en biologie des pêches. Division des pêches de la FAO Standardization of biometric and observation methods for Clupeidae (especially Sardina pilchardus) used in fisheries biology. FAO Fisheries Division Le Chalutage en Méditerranée Observations préliminaires sur les chaluts italiens. Division des pêches de la FAO Mediterranean trawling Preliminary observations in the study of Italian trawl nets. FAO Fisheries Division La pollution des eaux provoquée par les déversements des sucreries. C. Maldura et P. Vivier Water pollution caused by wastes from sugar refineries. C. Maldura and P. Vivier Filets tournants et coulissants en fibres synthétiques. G. Klust Ring nets made of synthetic fibres. G. Klust La pisciculture dans les eaux intérieures des pays membres du CGPM. Secrétariat du CGPM Inland water fisheries in the GFCM member countries. Secretariat of the GFCM Le chalutage en Méditerranée. Deuxième et troisième rapports. Division des pêches de la FAO Mediterranean trawling. Second and third reports. FAO Fisheries Division La technique des pêcheries dans les lagunes saumâtres. R. de Angelis Fishing installations in brackish lagoons. R. de Angelis La situation de la pêche en Italie, en particulier dans le secteur de la distribution. P. Pagliazzi Situation of the fishing industry in Italy, particularly regarding distribution. P. Pagliazzi Documentation graphique sur certains engins de pêche utilisés dans les lagunes littorales espagnoles. F. Lozano Cabo Graphic documentation on some fishing gear used in Spanish coastal lagoons. F. Lozano Cabo Le chalutage en Méditerranée Quatrième rapport. J. Schärfe, Division des pêches de la FAO Mediterranean trawling. Fourth report. J. Schärfe, FAO Fisheries Division Le traitement du fond des étangs piscicoles et ses effets sur la productivité. La pisciculture dans divers pays européens. A. G. Wurtz Methods of treating the bottom of fish ponds and their effects on productivity. Fish culture in certain European countries. A. G. Wurtz Exploitation et description des lagunes saumâtres de la Méditerranée. R. de Angelis Mediterranean brackish water lagoons and their exploitation. R. de Angelis Contrôle d'un chalut opérant entre deux eaux ou sur le fond et tiré par un seul bateau. J. Schärfe, Division des pêches de la FAO A new method for "aimed" one-boat trawling in mid-water and on the bottom. J. Schärfe, FAO Fisheries Division. 1960
229 14 Le chalutage en Méditerranée. Cinquième rapport. J. Schärfe, Division des pêches de la FAO Mediterranean trawling. Fifth report. J. Schärfe, FAO Fisheries Division La madrague sicilienne de course. V. Fodera The Sicilian tuna trap. V. Fodera Influence de la température et de l'éclairement sur la distribution des crevettes des moyennes et grandes profondeurs. W. Ghidalia et F. Bourgois The influence of temperature and light on the distribution of shrimps in medium and great depths. W. Ghidalia and F. Bourgois L'amélioration des techniques de la pêche au feu. F. Bourgois et L. Farina, Experts de la FAO Improvements of techniques for fishing with lights. F. Bourgois and L. Farina, FAO Experts L'élevage des huîtres en parcs flottants. M. Nikolic et I. Stojnic A sytem of oyster culture on floating shellfish parks. M. Nikolic and I. Stojnic Pêche au feu. R. Sarà Light fishing. R. Sarà Réglementation en vigueur sur la pêche de la sardine en Méditerranée. Service d'études législatives de la FAO Existing regulations for sardine fishing in the Mediterranean. FAO Legislation Research Branch Diagnoses démographiques sur les populations de poissons dans les cours d'eau à truites. R. Cuinat et R. Vibert Demographic diagnosis on fish populations in trout streams. R. Cuinat and R. Vibert Dommages causés par les marsouins et autres animaux marins déprédateurs en Méditerranée. C. Ravel Damage caused by porpoises and other other predatory marine animals in the Mediterranean. C. Ravel Etudes sur la sardine (Sardina pilchardus Walb.) et l'anchois (Engraulis encrasicholus L.) dans le golfe de Naples et sur leur comportement sous l'influence de la lumière artificielle. O. Dragesund Studies on the sardine (Sardina pilchardus Walb.) and anchovy (Engraulis encrasicholus L.) in the Gulf of Naples and their behaviour in artificial light. O. Dragesund Réglementations concernant certaines industries de transformation des produits des pêches maritimes dans les pays méditerranéens. D. Rémy Regulations on certain sea food processing industries in Mediterranean countries. D. Rémy Sur la valeur des anneaux nets pour la détermination de l'âge des sardines (Sardina pilchardus Walb.). R. Muzinic The value of sharp rings for the age determination of sardine (Sardina pilchardus Walb.). R. Muzinic Revue critique des effets des détergents synthétiques sur la vie aquatique. R. Marchetti Critical review of the effects of synthetic detergents on aquatic life. R. Marchetti Méthodes permettant d'économiser la main-d'oeuvre à bord des chalutiers méditerranéens. M. Ben-Yami Labour-saving methods on board Mediterranean trawlers. M. Ben-Yami La distribution et la commercialisation du poisson en Sicile. G. Bombace. 1965
230 28 Preliminary report on fish distribution and marketing in Sicily. G. Bombace Réglementation sanitaire des mollusques. R. Coppini Sanitary regulations for molluscs. R. Coppini L'élevage de la truite fario et de la truite arc-en-ciel dans les eaux à température très élevée. E.G. Calderon The raising of brown trout and rainbow trout in water at high temperatures. E.G. Calderon (Suppl.1) Suite des études sur les possibilités de développement de la salmoniculture en eaux chaudes. E.G. Calderon Mortalité initiale de la sardine dans les conditions expérimentales et mortalité due au marquage. R. Muzinic Initial mortality of the sardine under experimental conditions and in the tagging work. R. Muzinic Study of hake (Merluccius merluccius L.) biology and population dynamics in the central Adriatic. S. Zupanovic Unités de stock de la sardine de la Méditerranée occidentale et de l'adriatique. M.G. Larrañeta The system of currents in the Adriatic Sea. M. Zore-Armanda Investigations of mullet fisheries by beach seine on the U.A.R. Mediterranean coast. S. Zaky Rafail. Rehabilitation of the fisheries of an inland saline lake in the United Arab Republic. S. El Zarka. Variations annuelles des captures de mulet dans le lac de Varna. D. Morovic Aquarium tagging experiments on sardines with anchor tags by the use of tricaine methane sulfonate. R. Muzinic Fishery of the green crab (Carcinus maenas L.) and soft crab cultivation in the lagoon of Venice. S. Varagnolo. Results obtained by geological charting of trawling grounds in the channels of the northern Adriatic. S. Alfierivic. Effects of fresh water and saturated sea-water brine on the survival of mussels, oysters and some epibionts on them. M. Hrs. Brenko and L. Igic The weight-length relationship of United Arab Republic Sardinella. A.M. El-Maghraby Distribution et densité des oeufs de sardines (Sardina pilchardus Walb.) dans l'adriatique centrale au cours de la saison 1965/66. J. Karlovac Coincidence and alternation in Yugoslav pelagic fisheries. R. Muzinic Selectivity of gillnets for Nile perch (Lates niloticus L.). R. Koura and A.A. Shaheen. Cod end mesh size effect on Italian otter trawl efficiency. R. Koura Studies on the life history of Adriatic sprat. N. and D. Zavodnik Note préliminaire à l'étude de la production primaire dans l'adriatique centrale. T. Pucher-Petkovic. Long term observation of plankton fluctuation in the central Adriatic. T. Vucetic and T. Pucher-Petkovic. Relation between some factors affecting productivity and fish catch in the central Adriatic area. M. Buljan Long line Mediterranean fisheries studies west of Alexandria. S.Z. Rafail; W.L. Daoud and M.M. Hilal Marine resource of the United Arab Republic. A.A. Aleem Les ressources vivantes des eaux profondes de la Méditerranée occidentale et leur exploitation. Groupe d'experts du CGPM. 1970
231 44 Living deep water resources of the western Mediterranean and their exploitation. GFCM Group of Experts Quelques techniques de fumage du poisson applicables dans la zone méditerranéenne. H. Lizac, Département des pêches de la FAO Some techniques of smoking fish applicable in the Mediterranean area. H. Lisac, FAO Fisheries Department Studies on the distribution, growth and abundance of migrating fry and juveniles of mullet in a brackish coastal lake (Edku) in the United Arab Republic. S. E. Zarka; A.M. El-Maghraby and Kh. Abdel-Hamid On the use of anaesthetics in the transportation of sardines. R. Muzinic Investigations on Sciaenidae and Moronidae catches and on the total catch by beach seine on the U.A.R. Mediterranean coast. S.Z. Rafail. Studies on the population and the catchability of Norway lobster in the central Adriatic. S. Jukic Evolution de la pêche sur le talus du plateau continental des îles Baléares entre 1940 et M. Massuti. Explorations of the possible deep-water trawling grounds in the Levant Basin. O.H. Oren; M. Ben-Yami and L. Zismann Commercialisation du poisson frais et congelé dans certains pays méditerranéens. CGPM Marketing of fresh and frozen fish in Mediterranean countries. GFCM Etat de la pollution marine en Méditerranée et réglementation. CGPM The state of marine pollution in the Mediterranean and legislative controls. GFCM Aquaculture en eau saumâtre dans la région méditerranéenne. CGPM Brackish water aquaculture in the Mediterranean region. GFCM Fuel consumption as an index of fishing effort. D. Levi and G. Giannetti. Fluctuations of zooplankton and echo-trace abundance in the central Adriatic. T. Vucetic and I. Kacic Study of fish populations by capture data and the value of tagging experiments. S. Zaky Rafail. Les ressources halieutiques de la Méditerranée et de la mer Noire. D. Levi et J.-P. Troadec. Perspectives for fisheries development to 1985 in the GFCM Member Nations. GFCM Secretariat Study of fish populations by capture data and the value of tagging experiments. S. Zaky Rafail. The fish resources of the Mediterranean and the Black Sea. D. Levi and J.-P. Troadec. Perspectives for fisheries development to 1985 in the GFCM Member Nations. GFCM Secretariat Ponte contrôlée et élevage des larves d'espèces marines sélectionnées de la Méditerranée. CGPM Controlled breeding and larval rearing of selected Mediterranean marine species. GFCM Données sur les bateaux et engins de pêche en Méditerranée. P.-Y. Dremière et C. Nédélec Data on fishing vessels and gear in the Mediterranean. P.-Y. Dremière and C. Nédélec Quelques aspects de la culture du poisson et des crustacés en eau saumâtre en Méditerranée. CGPM Aspects of brackish water fish and crustacean culture in the Mediterranean. GFCM Aménagement des ressources vivantes dans la zone littorale de la Méditerranée. CGPM Management of living resources in the Mediterranean coastal area. GFCM. 1981
232 59 Les ressources halieutiques de la Méditerranée. Première partie: Méditerranée occidentale. P. Oliver Los recursos pesqueros del Mediterráneo. Primera parte: Mediterráneo occidental. P. Oliver The fisheries resources of the Mediterranean. Part two: Black Sea. L. Ivanov and R.J.H. Beverton Aménagement des pêches dans les lagunes côtières. J.M. Kapetsky et G. Lasserre Management of coastal lagoon fisheries. J.M. Kapetsky and G. Lasserre Evolution des techniques de la pêche italienne Evolution of technology in Italian fisheries Tendances récentes des pêches et de l'environnement dans la zone couverte par le Conseil général des pêches pour la Méditerranée (CGPM). J.F. Caddy et R.C. Griffiths Recent trends in the fisheries and environment in the General Fisheries Council for the Mediterranean (GFCM) area. J.F. Caddy and R.C. Griffiths Fisheries and environment studies in the Black Sea. Part 1: V.G. Dubinina and A.D. Semenov. Part 2: Yu. P. Zaitzsev. Part 3: A. Kocatas, T. Koray, M. Kaya and O.F. Kara. 65 A review of the state of the fisheries and the environment of the Northeastern Mediterranean (Northern Levantine Basin). F. Bingel, E. Ozsoy and U. Unluata Etude de l'état des pêches et de l'environnement dans la Méditerranée du Nord-Est (bassin levantin septentrional). F. Bingel, E. Ozsoy et U. Unluata Resource and Environmental Issues Relevant to Mediterranean Fisheries Management Questions concernant les ressources et l'environnement dans la gestion des pêcheries méditerranéennes Introduction of mullet haarder (Mugil so-iuy Basilewsky) into the Black Sea and the Sea of Azov. L.I. Starushenko and A.B. Kazansky Environmental management of fish resources in the Black Sea and their rational exploitation. K. Prodanov, K. Mikhailov, G. Daskalov, C. Maxim, A. Chashchin, A. Arkhipov, V. Shlyakhov and E. Ozdamar Long and short-term trends of Mediterranean fishery resources. L. Fiorentini, J.F. Caddy and J.I. de Leiva Issues in Mediterranean fisheries management: geographical units and effort control. J.F. Caddy Eléments pour l'aménagement des pêcheries méditerranéennes: unités géographiques et contrôle de l'effort. J.F. Caddy Feasibility assessment for a database on socio-economic indicators for Mediterranean fisheries. R. Franquesa, I.M. Malouli and J.A. Alarcón Decision-support systems for fisheries. The ITAFISH case study. Coppola, S. and Crosetti, D Manual of fisheries sampling surveys: methodologies for estimations of socio-economic indicators in the Mediterranean Sea. E. Sabatella and R. Franquesa Ecosystem effects of fishing in the Mediterranean: an analysis of the major threats of fishing gear and practices to biodiversity and marine habitats. S. Tudela Fisheries laws and regulation in the Mediterranean: a comparative study. P. Cacaud Étude comparative des lois et réglementations des pêches en Méditerranée. P. Cacaud Fisheries laws and regulation in the Mediterranean: a comparative study. P. Cacaud (Arabic version)
233 76 Implementation of the International Plan of Action to Prevent, Deter and Eliminate Illegal, Unreported and Unregulated Fishing: relationship to, and potential effects on, fisheries management in the Mediterranean. J. Swan Inventory of artisanal fishery communities in the Western and Central Mediterranean. S.R. Coppola AdriaMed Expert Consultation: Interactions between aquaculture and capture fisheries. Cataudella, S.; Massa, F.; Crosetti, D. (eds.) An adaptive approach for the improvement of fishery statistical systems in Mediterranean countries under FAO projects. Coppola, S.R The Operational Units approach for fisheries management in the Mediterranean Sea. Accadia, P. and Franquesa, R Recreational fisheries in the Mediterranean countries: a review of existing legal frameworks. Gaudin, C. and De Young, C Marketing of aquacultured seabass and seabream from the Mediterranean basin. Monfort, M.C Selected papers presented at the Workshop on Biological Reference Points. Rome, April Lembo, G. (ed.) Impact des techniques de pêche sur l environnement en Méditerranée. Sacchi, J Regional study on small tunas in the Mediterranean including the Black Sea. Di Natale, A.; Srour, A; Hattour, A.; Keskin, Ç; Idrissi, M.; Orsi Relini, L Fish trade among Mediterranean countries: Intraregional trade and import export with the European Union. Malvarosa, L.; De Young, C Status of alien species in the Black and Mediterranean Seas. Öztürk, B Synthesis of Mediterranean marine finfish aquaculture - a marketing and promotion strategy. Barazi-Yeroulanos, L Present market situation and prospects of meagre (Argyrosomus regius), as an emerging species in Mediterranean aquaculture. Monfort, M.C Indicators for the sustainable management of finfish Mediterranean aquaculture: highlights from the InDAM project. GFCM, 2011
.")
 approach and took into consideration the main outcomes")
234 The document Indicators for the sustainable development of finfish Mediterranean aquaculture: highlights from the InDAM Project reports the activities carried out during the first year of the InDAM Project Indicators for Sustainable Development of Aquaculture and Guidelines for their use in the Mediterranean, in support to the GFCM CAQ Working Group on Sustainability in Aquaculture (WGSA). The project focuses on the practical use of the indicators for sustainable aquaculture and their adaptation to the Mediterranean Region. The methodology applied for the identification of the preliminary list of indicators was based on the PCI (Principles, Criteria and Indicators) approach and took into consideration the main outcomes and achievements of the recent projects carried out in the Mediterranean on the identification of indicators for sustainable aquaculture. The document also reports the results of the workshop on the Selection of indicators for the sustainable development of aquaculture in the Mediterranean Sea (27-28 November 2008, Montpellier, France), the expert meeting on Indicators for the sustainable development of aquaculture in the Mediterranean Sea (24-26 February 2009, Montpellier, France) and the workshop on Guidelines and application of indicators for sustainable development of aquaculture (19-20 November 2009, Salammbô, Tunisia), with recommendations given by the WGSA. The two pilot studies on the selection and evaluation of the indicators for aquaculture sustainable development carried out in Mugla, Turkey, and Monastir, Tunisia, are described. The report also includes a series of documents gathered and produced by the experts involved in InDAM activities.
Cover photos and design Cover pictures: Gilthead seabream (Sparus aurata) in a floating cage, Italy, FAO Aquaculture photo library / F.
 in a floating cage, Italy, FAO Aquaculture photo library / F.") Cover photos and design Cover pictures: Gilthead seabream (Sparus aurata) in a floating cage, Italy, FAO Aquaculture photo library / F. Cardia Cover design by A. Nastasi STUDIES AND REVIEWS No. 93 GENERAL
Cover photos and design Cover pictures: Gilthead seabream (Sparus aurata) in a floating cage, Italy, FAO Aquaculture photo library / F. Cardia Cover design by A. Nastasi STUDIES AND REVIEWS No. 93 GENERAL
GENERAL FISHERIES COMMISSION FOR THE MEDITERRANEAN (GFCM)
") GENERAL FISHERIES COMMISSION FOR THE MEDITERRANEAN (GFCM) Training Workshop on site selection, allocated zones for aquaculture and site management for coastal marine aquaculture(wgsc-shocmed) 1 Atelier
GENERAL FISHERIES COMMISSION FOR THE MEDITERRANEAN (GFCM) Training Workshop on site selection, allocated zones for aquaculture and site management for coastal marine aquaculture(wgsc-shocmed) 1 Atelier
Draft. Guidelines on addressing Statistical Capacity in the. Country Programming Framework (CPF)
") Draft Guidelines on addressing Statistical Capacity in the Country Programming Framework (CPF) ... To change... The designation employed and the presentation of material in this information product do
Draft Guidelines on addressing Statistical Capacity in the Country Programming Framework (CPF) ... To change... The designation employed and the presentation of material in this information product do
General Fishery Commission of Mediterranean MSP. Fabio Massa, GFCM - FAO Senior Aquaculture Officer
 General Fishery Commission of Mediterranean MSP Fabio Massa, GFCM - FAO Senior Aquaculture Officer 1949 Constitutive Agreement under FAO Article XIV Competence over the Mediterranean and Black Sea 24 Members:
REVIEW OF THE STATE OF WORLD AQUACULTURE
 FAO Fisheries Circular No. 886, Rev. 2 FIRI/C886(Rev.2) ISSN 0429-9329 REVIEW OF THE STATE OF WORLD AQUACULTURE Copies of FAO publications can be requested from: Sales and Marketing Group Information Division
PRIMA Partnership for Research and Innovation in the Mediterranean Art.185 TFEU
 PRIMA Partnership for Research and Innovation in the Mediterranean Art.185 TFEU Carolina Rodriguez Rodriguez European Commission - DG RTD iwater Barcelona, 15 November 2016 Background PARTNERSHIP FOR RESEARCH
Building a future for sustainable small-scale fisheries in the Mediterranean and the Black Sea. Regional Conference 7 9 March 2016, Algiers, Algeria
 Building a future for sustainable small-scale fisheries in the Mediterranean and the Black Sea Regional Conference 7 9 March 2016, Algiers, Algeria SEIZING THE MOMENTUM, BUILDING A BRIGHTER FUTURE There
BACKGROUND / INTRODUCTION
 Terms of reference Consultancy Prepare and support the capitalisation phase of the FishMPABlue 2 Interreg project promote mainstreaming and institutional uptake of the project results Fishing governance
Basic Concepts on the process of Site Selection and AZA
 Basic Concepts on the process of Site Selection and AZA JC. Macías - P. Avila Training Workshop on site selection, allocated zones for aquaculture and site management for coastal marine aquaculture(wgsc-shocmed)1
BES. Intergovernmental Science-Policy. Platform on Biodiversity and Ecosystem Services. Work on capacity-building (deliverables 1 (a) and 1 (b))
 and 1 (b))") UNITED NATIONS BES Intergovernmental Science-Policy Platform on Biodiversity and Ecosystem Services IPBES/5/3 Distr.: General 15 December 2016 Original: English Plenary of the Intergovernmental Science-Policy
UNITED NATIONS BES Intergovernmental Science-Policy Platform on Biodiversity and Ecosystem Services IPBES/5/3 Distr.: General 15 December 2016 Original: English Plenary of the Intergovernmental Science-Policy
Voluntary Guidelines to Support the Integration of Genetic Diversity into National Climate Change Adaptation Planning
 Voluntary Guidelines to Support the Integration of Genetic Diversity into National Climate Change Adaptation Planning Voluntary Guidelines to Support the Integration of Genetic Diversity into National
5-6 March 2013, Prague, the Czech Republic
 MONITORING PROGRESS TOWARDS GREEN GROWTH IN THE COUNTRIES OF EASTERN PARTNERSHIP AND CENTRAL ASIA: PROJECT CONCEPT AND OUTLINE FOR A POLICY REFORM HANDBOOK 5-6 March 2013, Prague, the Czech Republic Unclassified
INTERNATIONAL STANDARDS FOR PHYTOSANITARY MEASURES GUIDELINES FOR SURVEILLANCE
 Publication No. 6 November 1997 INTERNATIONAL STANDARDS FOR PHYTOSANITARY MEASURES GUIDELINES FOR SURVEILLANCE Secretariat of the International Plant Protection Convention Food and Agriculture Organization
VII meeting of the Ministers of agriculture and fisheries of CIHEAM member countries. Final declarations
 VII meeting of the Ministers of agriculture and fisheries of CIHEAM member countries. Final declarations in Basurco B. (ed.). The Mediterranean fisheries sector. A reference publication for the VII meeting
EXTERNAL EVALUATION OF THE EUROPEAN UNION AGENCY FOR FUNDAMENTAL RIGHTS DRAFT TECHNICAL SPECIFICATIONS
 EXTERNAL EVALUATION OF THE EUROPEAN UNION AGENCY FOR FUNDAMENTAL RIGHTS DRAFT TECHNICAL SPECIFICATIONS / / / 1) Motivation for this evaluation According to the founding Regulation (168/2007) of the Fundamental
Aquaculture farmer organizations and cluster management
 Aquaculture farmer organizations and cluster management Concepts and experiences FAO FISHERIES AND AQUACULTURE TECHNICAL PAPER 563 ISSN 2070-7010 Cover photographs: Top left: Cluster farmers meeting in
EASYPol Module 146. Group Exercise. Sources and Uses of Financial Resources
 EASYPol Module 146 Group Exercise Sources and Uses of Financial Resources Group Exercise Sources and Uses of Financial Resources Calvin Miller, Senior Officer, Agricultural Management, Marketing and Finance
The inter-group resource book. A guide to building small farmer group associations and networks
 The inter-group resource book A guide to building small farmer group associations and networks The inter-group resource book A guide to building small farmer group associations and networks FOOD AND AGRICULTURE
Recommendation on: The importance on pest diagnosis
 International Plant Protection Convention R-07 COMMISSION ON PHYTOSANITARY MEASURES RECOMMENDATION Recommendation on: The importance on pest diagnosis adopted 2016 published 2017 R-07 2017 eng FAO encourages
Guidelines for the notification of non-compliance and emergency action
 13 ISPM 13 INTERNATIONAL STANDARD FOR PHYTOSANITARY MEASURES Guidelines for the notification of non-compliance and emergency action ENG Produced by the Secretariat of the International Plant Protection
United Nations Environment Programme
 United Nations Environment Programme Barcelona Convention Mediterranean Action Plan (c) Mathieu FOULQUIE 1 About the UNEP/MAP In 1975, the Mediterranean countries and the European Community 1 adopted the
CONCLUSIONS OF THE FIRST REGIONAL SYMPOSIUM. Preamble
 CONCLUSIONS OF THE FIRST REGIONAL SYMPOSIUM ON SUSTAINABLE SMALL-SCALE FISHERIES IN THE MEDITERRANEAN AND THE BLACK SEA 27 30 November 2013, St. Julian s, Malta Preamble The following conclusions have
Newsletter. Water-DROP
 Newsletter June 2016 Issue N. 5 Contents Water-DROP Project Final Achievements...1 Water-DROP final events: Mediterranean and International Conferences...2 Training and educational campaigns in schools...3
Pre-announcement of PRIMA Calls
 Pre-announcement of PRIMA Calls The PRIMA Foundation would like to announce the PRIMA Section 1 and 2 Calls for proposals for 2018 of the PRIMA Programme. PRIMA is a new Partnership on Research and Innovation
Cooperation between UNEP MAP-Barcelona Convention and FAO-GFCM
 Cooperation between UNEP MAP-Barcelona Convention and UNEP/EC WORKSHOP ON REGIONAL OCEAN GOVERNANCE 9 10 November 2015 (Brussels, Belgium) General Fisheries Commission for the Mediterranean Commission
Organisation de Coopération et de Développement Économiques Organisation for Economic Co-operation and Development
 Unclassified ENV/JM/MONO(2014)1/ADD ENV/JM/MONO(2014)1/ADD Unclassified Organisation de Coopération et de Développement Économiques Organisation for Economic Co-operation and Development 06-Mar-2014 English
Cover photo: Mandarin fish (Siniperca sp.) Known from time immemorial in China, this fish became extremely popular in the Tang Dynasty ( A.D.
 Known from time immemorial in China, this fish became extremely popular in the Tang Dynasty ( A.D.") Cover photo: Mandarin fish (Siniperca sp.) Known from time immemorial in China, this fish became extremely popular in the Tang Dynasty (618 907 A.D.) and many poets eulogized about its colour and taste.
Cover photo: Mandarin fish (Siniperca sp.) Known from time immemorial in China, this fish became extremely popular in the Tang Dynasty (618 907 A.D.) and many poets eulogized about its colour and taste.
Aquaculture: ResponsiblePractices. andcertification. GuidefortheSustainable Developmentof Mediteranean 3Aquaculture
 Aquaculture: ResponsiblePractices andcertification GuidefortheSustainable Developmentof Mediteranean 3Aquaculture Responsible Practices Aquaculture: and Certification 3 Guide for the Sustainable Development
Detailed methodology for TDA finalisation and SAP development
 Detailed methodology for TDA finalisation and SAP development Project Number: 53885 Final report December, 2008 First published in Ghana in 2008 By the UNEP-GEF Volta Project. Copyright 2008, United Nations
Water Futures and Solutions: World Water Scenarios Initiative
 Water Futures and Solutions: World Water Scenarios Initiative Summary BACKGROUND In 2000, the World Water Vision i prepared under the aegis of the World Water Council was presented at the 2nd World Water
Pangani River Basin Management Project. Terms of Reference for Project Internal Review
 Pangani River Basin Management Project Terms of Reference for Project Internal Review 1. Background The World Conservation Union (IUCN) implements a programme of conservation and natural resource management
Executive Summary. 1
 Executive Summary In 2009 the EC published an Action Plan on Urban Mobility (APUM) with 20 concrete EU-level actions to be implemented by 2012. The EC announced that it would conduct a review on the implementation
Phytosanitary principles for the protection of plants and the application of phytosanitary measures in international trade
 1 ISPM 1 INTERNATIONAL STANDARD FOR PHYTOSANITARY MEASURES Phytosanitary principles for the protection of plants and the application of phytosanitary measures in international trade ENG Produced by the
Economic and Social Council
 United Nations Economic and Social Council Distr.: General 18 December 2002 E/CN.3/2003/11 Original: English Statistical Commission Thirty-fourth session 4-7 March 2003 Item 4 (c) of the provisional agenda*
Regulated nonquarantine. concept and application INTERNATIONAL STANDARD FOR PHYTOSANITARY MEASURES ENG ISPM 16
 16 ISPM 16 INTERNATIONAL STANDARD FOR PHYTOSANITARY MEASURES Regulated nonquarantine pests: concept and application ENG Produced by the Secretariat of the International Plant Protection Convention (IPPC)
INTERNATIONAL STANDARDS FOR PHYTOSANITARY MEASURES REGULATED NON-QUARANTINE PESTS: CONCEPT AND APPLICATION
 Publication No. 16 March 2002 INTERNATIONAL STANDARDS FOR PHYTOSANITARY MEASURES REGULATED NON-QUARANTINE PESTS: CONCEPT AND APPLICATION Secretariat of the International Plant Protection Convention Food
Economic and Social Council
 United Nations Economic and Social Council Distr.: General 2 October 2015 ECE/HBP/2015/4 Original: English Economic Commission for Europe Committee on Housing and Land Management Seventy-sixth session
Module 031. Policy Highlights. Agricultural Policies and Strategies: Concepts and Practice
 Module 031 Policy Highlights Agricultural Policies and Strategies: Concepts and Practice Policy Highlights Agricultural Policies and Strategies: Concepts and Practice by the Agricultual Policy Support
The Global Strategy to Improve Agricultural and Rural Statistics
 The Global Strategy to Improve Agricultural and Rural Statistics Better, faster and cost-effective collection of agricultural and rural data to support governments in making evidence-based policy decisions
15241/16 LS/ah 1 DGB B1
 Council of the European Union Brussels, 6 December 2016 (OR. en) 15241/16 AGRI 657 ENV 770 CLIMA 174 NOTE From: To: Subject: General Secretariat of the Council Delegations Regional Symposium on Agroecology
Draft National Submission of the Republic of Croatia for Compilation Document for UNCSD 2012
 Draft National Submission of the Republic of Croatia for Compilation Document for UNCSD 2012 The following non-paper aims at setting out views as to the overall priorities for Republic of Croatia at Rio+20
Presentation 2. The Common Assessment Framework CAF 2013
 Common Assessment Framework: the reference model for total The quality management in the public sector in Europe and the Asian Productivity Organisation s Public Sector Framework. Presentation 2 The Common
WOODHEAD PUBLISHING SERIES IN FOOD SCIENCE, TECHNOLOGY AND NUTRITION
 WOODHEAD PUBLISHING SERIES IN FOOD SCIENCE, TECHNOLOGY AND NUTRITION Innovations in food labelling Related titles: EU food law (ISBN 978-1-85573-557-6) This book is an ideal introduction to this complex
Compendium of Water Quality Regulatory Frameworks: Which Water for Which Use? Summary
 Compendium of Water Quality Regulatory Frameworks: Which Water for Which Use? Summary Compendium of Water Quality Regulatory Frameworks: Which Water for Which Use? - SUMMARY 1 About the Compendium Water
Guidance: Quality Criteria for Evaluation Reports
 Evaluation Guidance Note Series No.8 UNIFEM Evaluation Unit October 2009 Guidance: Quality Criteria for Evaluation Reports 1 1. Introduction The UNIFEM quality criteria for reports are intended to serve
Institutional capacity assessment approach for national adaptation planning in the agriculture sectors
 BRIEFING NOTE March 2018 Institutional capacity assessment approach for national adaptation planning in the agriculture sectors Overview The briefing note highlights the need to apply a country-driven
Requirements for the establishment of pest free places of production and pest free production sites
 10 ISPM 10 INTERNATIONAL STANDARD FOR PHYTOSANITARY MEASURES Requirements for the establishment of pest free places of production and pest free production sites ENG Produced by the Secretariat of the International
UNECE Workshop Role of freight forwarders and logistics in intermodal transport chains
 UNECE secretariat document 26 March 2014 ENGLISH Original: ENGLISH AND FRENCH WORKING PARTY ON INTERMODAL TRANSPORT AND LOGISTICS (WP.24) UNECE Workshop Role of freight forwarders and logistics in intermodal
How to map excellence in research and technological development in Europe
 COMMISSION OF THE EUROPEAN COMMUNITIES Brussels, 12.3.2001 SEC(2001) 434 COMMISSION STAFF WORKING PAPER How to map excellence in research and technological development in Europe TABLE OF CONTENTS 1. INTRODUCTION...
Economic and Social Council
 United Nations E/2017/15/Add.1* Economic and Social Council Distr.: General 16 May 2017 Original: English 2017 session 28 July 2016-27 July 2017 Agenda item 15 Regional cooperation Regional cooperation
Prof. Maria Loizidou School of Chemical Engineering National Technical University of Athens
 DEVELOPMENT OF TOOLS AND GUIDELINES FOR THE PROMOTION OF THE SUSTAINABLE URBAN WASTEWATER TREATMENT AND REUSE IN THE AGRICULTURAL PRODUCTION IN THE MEDITERRANEAN COUNTRIES MEDAWARE Prof. Maria Loizidou
Green Economy Initiatives on Agriculture
 Farming First's Guide to Green Economy Initiatives on Agriculture Farming First To download this guide, visit: Committees / Task Forces Details Overview Focus Areas Key Dates 1 Commission on Sustainable
Strengthening Euro-Mediterranean Cooperation through R&I 4PRIMA Conclusive Event 18 January 2017, Brussels
 Strengthening Euro-Mediterranean Cooperation through R&I 4PRIMA Conclusive Event 18 January 2017, Brussels Katja Klasinc DG RTD European Commission Euro-Mediterranean Cooperation Policy Background More
AGRICULTURAL RESEARCH FOR DEVELOPMENT
 PV ACP_2002_EC_Vialatte_chapeau ARD 11.doc - 22/08/02 - Page 1 of 11 AGRICULTURAL RESEARCH FOR DEVELOPMENT SUPPORT TO AGRICULTURAL RESEARCH FOR DEVELOPMENT (ARD) AT SUB-REGIONAL LEVEL CONCEPT PAPER The
Economic and Social Council
 United Nations E/CN.3/2018/14* Economic and Social Council Distr.: General 20 December 2017 Original: English Statistical Commission Forty-ninth session 6 9 March 2018 Item 3 (k) of the provisional agenda**
SUPPORT FOR AN INNOVATION POLICY AGENDA
 SUPPORT FOR AN INNOVATION POLICY AGENDA SUPPORT FOR AN INNOVATION POLICY AGENDA CONTEXT... 1 OBJECTIVES OF AN INNOVATION POLICY AGENDA... 2 METHODOLOGY FOR AN INNOVATION FRAMEWORK AGENDA... 3 A. SUPPORT
Integrated Coastal Zone Management
 Integrated Coastal Zone Management Steve Collins Marine Planning & Coastal Integration Team Date: 05 November 2014 Overview To cover ICZM History and context MSP Directive MPS How marine planning contributes
La Fondation pour la Recherche sur la Biodiversité The French Foundation for Research on Biodiversity (FRB)
") FRB-CESAB and ALCUE NET Meeting November 2014, Aix-en-Provence, France La Fondation pour la Recherche sur la Biodiversité The French Foundation for Research on Biodiversity (FRB) Jean-François Silvain
FRB-CESAB and ALCUE NET Meeting November 2014, Aix-en-Provence, France La Fondation pour la Recherche sur la Biodiversité The French Foundation for Research on Biodiversity (FRB) Jean-François Silvain
Resolution No. 2 on Territorial governance: empowerment through enhanced co-ordination
 14th European Conference of Ministers responsible for Regional/Spatial Planning (CEMAT) (Lisbon, Portugal: 26-27 October 2006) on Networks for sustainable spatial development of the European continent:
ISO INTERNATIONAL STANDARD. Risk management Principles and guidelines. Management du risque Principes et lignes directrices
 INTERNATIONAL STANDARD ISO 31000 First edition 2009-11-15 Risk management Principles and guidelines Management du risque Principes et lignes directrices http://mahdi.hashemitabar.com Reference number ISO
fao and traditional knowledge: the linkages with sustainability, food security and climate change ImpactS
 fao and traditional knowledge: the linkages with sustainability, food security and climate change ImpactS fao and traditional knowledge: the linkages with sustainability, food security and climate change
G4 DEVELOPMENT. Document 2 of 12 Statistics: Quantitative Online Feedback. Second G4 Public Comment Period: Submissions.
 G4 DEVELOPMENT Document 2 of 12 Statistics: Quantitative Online Feedback February 2013 INTRODUCTION ABOUT THE SUBMISSIONS DOCUMENTS In 2010 GRI began the development of the fourth generation of its Sustainability
Africa Mining Vision and Country Mining Visions
 Africa Mining Vision and Country Mining Visions ETHIOPIA EXTRACTIVE INDUSTRIES FORUM, 7-8 October 2014 Hilton Hotel, Addis Ababa By Valerio Bosco, Ph.D African Minerals Development Centre Objectives Raise
7.2 Rationale for the research component
 7. RESEARCH COMPONENT 7.1 Introduction While the number of commercial modern farms in Africa has increased significantly, most agricultural production (particularly food crop production) is still done
2. The Minister of Fisheries for Norway, His Excellency, Mr Per Sandberg, inaugurated the meeting and delivered an opening statement (Appendix C).
.") Report of the First Meeting of the Parties to the Agreement on Port State Measures to Prevent, Deter and Eliminate Illegal, Unreported and Unregulated Fishing OPENING OF THE MEETING 1. The first meeting
Report of the First Meeting of the Parties to the Agreement on Port State Measures to Prevent, Deter and Eliminate Illegal, Unreported and Unregulated Fishing OPENING OF THE MEETING 1. The first meeting
Intergovernmental Science-Policy. Platform on Biodiversity and Ecosystem Services
 UNITED NATIONS BES IPBES/5/12 Intergovernmental Science-Policy Platform on Biodiversity and Ecosystem Services Distr.: General 8 December 2016 Original: English Plenary of the Intergovernmental Science-Policy
DECLARATION OF MALTA
 DECLARATION OF MALTA 11 th GENERAL ASSEMBLY OF THE MEDITERRANEAN NETWORK OF BASIN ORGANISATIONS 22 nd -24 th March 2017 St. Julians, Malta PERMANENT TECHNICAL SECRETARIAT MEDITERRANEAN NETWORK OF BASIN
Multi-year workplans of the Convention institutions and subsidiary bodies
 Decision 1/COP.10 Multi-year workplans of the Convention institutions and subsidiary bodies The Conference of the Parties, Recalling decision 3/COP.8, by which the Parties adopted the 10-year strategic
Social and Environmental Investment Overview
 Table of contents 1. Introduction 3 2. SEI Governance Hierarchy 3 3. SEI Programme 4 3.1 Goal and Objectives 4 3.2 SEI Programme Framework 5 3.3 Project Funding Types 6 4. SEI Management System 7 4.1 SEI
COUNTRY CASE STUDY - MOROCCO 01 March 2010 TRANSHUMANCE FOR BIODIVERSITY CONSERVATION. Country. Region. Key Result Area. Project Title.
 - MOROCCO 01 March 2010 TRANSHUMANCE FOR BIODIVERSITY CONSERVATION Country Morocco Region Key Result Area Arab States Biodiversity Conservation Project Title Transhumance for Biodiversity Conservation
BOLOGNA CHARTER 2012 "BOLOGNA CHARTER 2012"
 EUROPEAN REGIONS CHARTER FOR THE PROMOTION OF A COMMON FRAMEWORK FOR STRATEGIC ACTIONS AIMED AT THE PROTECTION AND SUSTAINABLE DEVELOPMENT OF THE MEDITERRANEAN COASTAL AREAS "BOLOGNA CHARTER 2012" This
Key elements of the GMES EC Draft Action Plan Initial Period
 Brussels, 27/07/2001 Key elements of the GMES EC Draft Action Plan Initial Period 2001-2003 For information: Michel.Cornaert@cec.eu.int Hugo.De_Groof@cec.eu.int Neil.Hubbard@jrc.it Errol.Levy@cec.eu.int
UNITED NATIONS ENVIRONMENT PROGRAMME MEDITERRANEAN ACTION PLAN MED POL
 UNITED NATIONS ENVIRONMENT PROGRAMME MEDITERRANEAN ACTION PLAN MED POL GUIDELINES FOR THE APPLICATION OF BEST AVAILABLE TECHNIQUES (BATs), BEST ENVIRONMENTAL PRACTICES (BEPs) AND CLEANER TECHNOLOGIES (CTs)
Priority Actions to Achieve Aichi Biodiversity Target 10 for Coral Reefs and Closely Associated Ecosystems. adopted by COP 12
 Proposal to update the specific workplan on coral bleaching (appendix 1 of annex I to decision VII/5) Priority Actions to Achieve Aichi Biodiversity Target 10 for Coral Reefs and Closely Associated Ecosystems
Consultation "Bio-based economy for Europe: state of play and future potential"
 1 of 10 5/2/2011 6:05 PM Consultation "Bio-based economy for Europe: state of play and future potential" I. Respondent's profile 1. Are you answering as an individual or on behalf of an organisation or
CCAMLR Secretariat Strategic Plan
 CCAMLR Secretariat Strategic Plan 2015 2018 Introduction The CAMLR Convention entered into force on 7 April 1982. It establishes the Commission for the Conservation of Antarctic Marine Living Resources
HRD IN THE EUROPEAN UNION: INTERNET INFORMATION SOURCES
 CARDS 2004 Local Partnerships for Employment Phase 2 This project is funded by the European Union EuropeAid/121013/C/SV/HR: Service Contract No. 107603 EU CARDS 2004 Local partnerships for employment -
GLOBAL ADAPTATION NETWORK
 GLOBAL ADAPTATION NETWORK www.ganadapt.org Photo credits: Gallo Images/Getty Images; Tierramérica/IPS; UN Photo/Eric Kanalstein; UN Photo/UNICEF/Marco Dormino; Arsgera/ istock; UN Photo/Martine Perret;
THE ENERGY DEVELOPMENT CYCLE
 THE ENERGY DEVELOPMENT CYCLE PRE-PROJECT EXPLORATION APPRAISAL & DEVELOPMENT OPERATION CLOSURE USE Risks & Opportunities Across the Development Cycle Activities prior to the start of the individual project
Tunisia. Workshop on Allocated Zones for Aquaculture (AZA) WGSC-SHoCMed1. SHoCMed1. (Seville, Spain, 18th -20th October 2010)
 WGSC-SHoCMed1. SHoCMed1. (Seville, Spain, 18th -20th October 2010)") Workshop on Allocated Zones for Aquaculture (AZA) WGSC-SHoCMed1. SHoCMed1. (Seville, Spain, 18th -20th October 2010) Tunisia Population: 10,075,000 Aerea :164 sq km, Tunisia is bounded on the west by Algeria,
Workshop on Allocated Zones for Aquaculture (AZA) WGSC-SHoCMed1. SHoCMed1. (Seville, Spain, 18th -20th October 2010) Tunisia Population: 10,075,000 Aerea :164 sq km, Tunisia is bounded on the west by Algeria,
ACORD (Agency for Cooperation and Research in Development) Enhancing Iddir s Engagement in Slum Upgrading in Dire Dawa, Ethiopia ( )
 Enhancing Iddir s Engagement in Slum Upgrading in Dire Dawa, Ethiopia ( )") ACORD (Agency for Cooperation and Research in Development) Enhancing Iddir s Engagement in Slum Upgrading in Dire Dawa, Ethiopia (2012-2015) End of Project Evaluation Terms of Reference 1. Introduction
ACORD (Agency for Cooperation and Research in Development) Enhancing Iddir s Engagement in Slum Upgrading in Dire Dawa, Ethiopia (2012-2015) End of Project Evaluation Terms of Reference 1. Introduction
OPEN SCIENCE From Vision to Action
 OPEN SCIENCE From Vision to Action 8th UNICA Scholarly Communication Seminar The transition to Open Access: strategies and impacts 1-2 December 2016, University of Lausanne Daniel Spichtinger, Senior Policy
Executive Board of the United Nations Development Programme and of the United Nations Population Fund
 United Nations DP/2011/3 Executive Board of the United Nations Development Programme and of the United Nations Population Fund Distr.: General 15 November 2010 Original: English First regular session 2011
Contents. objectives and strategies structure: resources and governance partnerships and work program
 The World Bank Global Program on Fisheries PROFISH Lidvard Grønnevet Senior Fisheries Specialist Environment Department FAME, Esbjerg, 29 August 2005 1 1. PROFISH Contents objectives and strategies structure:
GUIDING FOR ACCOUNTABILITY:
 GUIDING FOR ACCOUNTABILITY: Together 2030 recommendations for a revised set of guidelines for Voluntary National Reviews (VNRs) of the 2030 Agenda and the Sustainable Development Goals (SDGs) October 2017
Session 2: International cooperation on quality management - principles; harmonization of frameworks; peer reviews; support of countries
 Committee for the Coordination of Statistical Activities Conference on Data Quality for International Organizations Rome, Italy, 7 and 8 July 2008 Session 2: International cooperation on quality management
COASTAL OIL POLLUTION PARTNER REGIONS' ORGANISATION SYNTHESIS OF MAREMED QUESTIONNAIRE INTENDED FOR PARTNER REGIONS MAREMED
 COASTAL OIL POLLUTION PARTNER REGIONS' ORGANISATION SYNTHESIS OF MAREMED QUESTIONNAIRE INTENDED FOR PARTNER REGIONS MAREMED 1 QUESTION 1 Role and responsibilities of regions and municipalities in the event
STRATEGIC VISION FOR THE WORK OF ESCWA IN THE FIELD OF STATISTICS VERSION 2
 UNITED NATIONS ECONOMIC AND SOCIAL COMMISSION FOR WESTERN ASIA STATISTICS DIVISION Fourth meeting of the Working Group Of the Statistical Committee Beirut, 3 4 February 2011 STRATEGIC VISION FOR THE WORK
Panel 2 A healthy environment, a stronger aquaculture industry Panel prospectus
 FAO aquaculture photo library/cardia Regional Aquaculture Conference: "Blue Growth in the Mediterranean and the Black Panel 2 A healthy environment, a stronger aquaculture industry Panel prospectus 1 Panel
Mayors Adapt and the new Covenant of Mayors for Climate and Energy
 Mayors Adapt and the new Covenant of Mayors for Climate and Energy Mayors AdaptBasics mayors-adapt.eu First pan-european initiative to support cities in leading the way on adaptation to climate change
EUROPEAN COMMISSION DIRECTORATE GENERAL FOR RESEARCH & INNOVATION. European Technology Platforms 2020 DRAFT STRATEGY
 EUROPEAN COMMISSION DIRECTORATE GENERAL FOR RESEARCH & INNOVATION Directorate C - Research and Innovation C.1 - Innovation policy European Technology Platforms 2020 DRAFT STRATEGY 1. INTRODUCTION Smart
Baltic Marine Environment Protection Commission
 Baltic Marine Environment Protection Commission Helsinki Commission Helsinki, Finland, 28 February 1 March 20 HELCOM 38-20 Document title Draft Work Plan - HELCOM Maritime sub-group on green ship technology
GUIDANCE FOR IMPLEMENTATION OF THE LEADER COOPERATION ACTIVITIES IN RURAL DEVELOPMENT PROGRAMMES /10/2013.
 GUIDANCE FOR IMPLEMENTATION OF THE LEADER COOPERATION ACTIVITIES IN RURAL DEVELOPMENT PROGRAMMES 2014-2020 11/10/2013 (Draft version) 1 Table of Contents 1. Rationale of cooperation under LEADER/CLLD...
Indicative content of evaluation final reports Draft, Jérémie Toubkiss, Evaluation Office, NYHQ (updated 4 February 2016)
") Indicative content of evaluation final reports Draft, Jérémie Toubkiss, Evaluation Office, NYHQ (updated 4 February 2016) 0. Opening pages - The first pages provides the key information on the programme
Indicative content of evaluation final reports Draft, Jérémie Toubkiss, Evaluation Office, NYHQ (updated 4 February 2016) 0. Opening pages - The first pages provides the key information on the programme
Environment Statistics and System of Environment-Economic Accounting (SEEA) - National Assessment Report 1
 - National Assessment Report 1") Environment Statistics and System of Environment-Economic Accounting (SEEA) - National Assessment Report 1 1 Version dated and released on 24 July 2017. Table of Contents Contents Page Objective... 3 Country
Environment Statistics and System of Environment-Economic Accounting (SEEA) - National Assessment Report 1 1 Version dated and released on 24 July 2017. Table of Contents Contents Page Objective... 3 Country
Nationally Appropriate
 Nationally Appropriate Mitigation Action: Understanding NAMA Cycle September 2014 U n i t e d N a t i o n s E n v i r o n m e n t P r o g r a m m e Copyright United Nations Environment Programme, 2014
Gender Mainstreaming Plan
 Gender Mainstreaming Plan Ensuring that both men and women have equal opportunities to participate in and benefit from the GEF project can be achieved through progressive and efficient mainstreaming of
ASIA-PACIFIC MONITORING & EVALUATION REGIONAL ANNUAL MEETING 2009
 ASIA-PACIFIC SHARED SERVICES CENTRE (APSSC) 30 MARCH 3 APRIL 2009, KUALA LUMPUR, MALAYSIA MEETING REPORT ASIA-PACIFIC MONITORING & EVALUATION REGIONAL ANNUAL MEETING 2009 0 Meeting Report Asia-Pacific
GUIDE TO KEY ISSUES IN DEVELOPMENT OF LOGISTICS POLICY
 GUIDE TO KEY ISSUES IN DEVELOPMENT OF LOGISTICS POLICY The views expressed in this publication are those of the authors and do not necessarily reflect the views of the United Nations Secretariat. The opinions,