Nebraska PROFIT OPPORTUNITIES FOR FOOD MANUFACTURING
|
|
|
- Samuel Harrison
- 6 years ago
- Views:
Transcription


1 Nebraska PROFIT OPPORTUNITIES FOR FOOD MANUFACTURING
2 Table of Contents EXECUTIVE SUMMARY...1 PART A THE FOOD MANUFACTURING INDUSTRY I. Industry Characteristics and Trends... 3 II. Industry Structure... 4 III. Industry Production and Location Characteristics... 8 IV. Capital Investment and Industry Outlook PART B NEBRASKA ADVANTAGES FOR MANUFACTURERS OF FOOD PRODUCTS I. Availability of Inputs in Nebraska II. Nebraska Location Resources Access to Markets Transportation Low Cost Utilities High Quality Work Force Higher Education Resources and Research Performance-Based Tax Incentives New Economic Development Initiatives Other Development Assistance Programs Quality of Life CONCLUSIONS...28 APPENDIX A LABOR AND ENERGY COST ANALYSIS...A-1 Alternative Plant Locations... A-1 The Model Plant... A-1 Energy Used in the Model Plant... A-2 Labor-Related Costs... A-3 Energy Costs... A-5 Labor and Energy Cost Summary... A-8 APPENDIX B NEBRASKA INCENTIVES... B-1
3 Table 1 Table 2 Table 3 List of Tables The Food Manufacturing Industry (NAICS 311), Characteristics and Trends, Selected Years, The Food Manufacturing Industry (NAICS 311), Value of Industry Shipments by Major Industry Subgroup, 2007, 2012, and The Food Manufacturing Industry (NAICS 311), Number of Companies and Establishments, Employment, Value of Shipments, Value Added, and Capital Expenditures by Major Sector and Industry Subgroups, Table 4 Production Characteristics for the Food Manufacturing Industry (NAICS 311) 2007, 2012, and Table 5 Establishment Characteristics for the Food Manufacturing Industry (NAICS 311), Animal Slaughtering and Processing Industry (NAICS 3116), and Other Food Manufacturing (NAICS 3119), Table 6 Shipment Characteristics for the Food Manufacturing Industry (NAICS 311) Related Commodities, Selected Commodities, 2007 and Table 7 Food Manufacturing Industry (NAICS 311) Production Workers, Average Wages, Value Added, and Value of Shipments Selected States and the U.S., Table 8 Capital Expenditures in the Food Manufacturing Industry (NAICS 311), by Industry Subgroup, 2007, 2012, and Table 9 Table 10 Employment and Output, Food Manufacturing Sector by Industry Subgroup, for All Manufacturing, 2002, 2012, and Projected Nebraska Food Manufacturing Establishments by Industry and Employment Size, Table 11 Production of Selected Agricultural Commodities in Nebraska Table 12 Table A-1 Cost of Living in Nebraska, Compared to the National Average, As of July 1, Alternative Locations for a Model Plant for the Food Manufacturing Industry (NAICS 311)... A-1 Table A-2 Characteristics of a Model Plant for the Food Manufacturing Industry (NAICS 311)... A-2 Table A 3 Energy Use in Food Manufacturing Establishments... A-2 Table A 4 Table A 5 Table A 6 Total Annual Labor-Related Costs for a Model Plant for the Food Manufacturing Industry (NAICS 311)... A-4 Annual Energy Costs for a Model Plant for the Food Manufacturing Industry (NAICS 311)... A-6 Summary of Labor and Energy Costs for a Model Plant for the Food Manufacturing Industry (NAICS 311)... A-8
4 Figure 1 Figure 2 List of Figures Labor and Energy Costs per Production Worker for the Food Manufacturing Industry (NAICS 311)... 2 Value of Shipments by Industry Subgroup, Food Manufacturing Industry (NAICS 311), Figure 3 Truck Access to Regional and National Markets Figure 4 Electric Costs for Industrial Service, Winter 2014 Summer Figure 5A Location of Nebraska Area Colleges and Universities Figure 5B Community Colleges in Nebraska Figure 6 Figure A 1 Figure A 2 Manufacturing Employment, Nebraska, Surrounding States, and the U.S., Estimated Total Labor Costs for a Model Plant for the Food Manufacturing Industry Alternative Plant Locations... A-5 Estimated Total Energy Costs for a Model Plant for the Food Manufacturing Industry, Alternative Plant Locations... A-7
5 EXECUTIVE SUMMARY The Food Manufacturing Industry (NAICS 311) is one of the largest manufacturing sectors in the United States. The U.S. Census Annual Survey of Manufactures, 2013 indicates the total value of shipments from the food manufacturing sector totaled $760,811.2 million and accounted for 13.0 percent of the total value of shipments by U.S. manufacturers in Value added in the industry totaled $269,172.7 million in Moreover, food processing establishments accounted for 12.4 percent of total manufacturing employment in the United States. This study has been developed specifically for use by manufacturers of food and related products to show how a Nebraska plant location can help them better respond to market conditions and significantly improve their competitive position. Nebraska provides substantial advantages for both small and large food production facilities. An attractive business climate, a well educated and productive labor force, reliable supplies of low cost energy, ready access to raw materials and intermediate processed inputs, and a location central to the national consumer market are among the leading advantages the state offers manufacturers of food products. Included in this study is an analysis of geographically variable labor and energy costs. The analysis makes cost comparisons among states on the basis of a model manufacturing plant. The model plant assumes employment of 50 production workers and the manufacture of a product representative for the food manufacturing industry as a whole. Sixteen states are examined in the analysis. Besides Nebraska, these states include those that currently have the largest production in the industry as well as other states near Nebraska with which it typically competes for industrial location projects. In the model plant analysis, estimated labor related costs include the direct wages paid to production workers and costs associated with workers compensation insurance, unemployment insurance, social security, and fringe benefits. Compared to the average labor costs for the 15 alternative states, Nebraska is found to offer an annual savings of $141,500 in labor related costs, which is 5.3 percent less than the average labor costs for the other states. This study also concludes that a Nebraska plant location offers a significant energy cost advantage. Industrial electric rates for the 15 alternative states average 19.2 percent more than the Nebraska rate and the average industrial gas rate is 37.1 percent more. Combining these advantages, Nebraska s energy cost for the model plant is 19.9 percent less than the average energy cost for the 15 alternative locations. Together, Nebraska s annual labor and energy costs for the model plant are $242,271, or 7.6 percent less than the average annual labor and energy costs for the 15 alternative states. Conversely, the average labor and energy costs in the other 15 states are 8.3 percent more than the Nebraska labor and energy costs. Figure 1 (following page) provides a summary of the labor and energy costs for the model plant in Nebraska and for each of the 15 alternate plant sites. These costs are shown on a per production worker basis. 1
6 $80,000 $70,000 Energy Labor Figure 1 Labor and Energy Costs per Production Worker for the Food Manufacturing Industry (NAICS 311) $60,000 $50,000 $40,000 $30,000 $20,000 $10,000 $0 NE CA FL IL IN IA KS MI MN MO NJ NY OH PA TX WI Calculated labor (wages, workers compensation insurance, unemployment insurance, social security, and fringe benefits) and energy (electricity and natural gas) costs for the food manufacturing industry (NAICS 311). Source: Table A 6. 2
7 Part A The Food Manufacturing Industry I. Industry Characteristics and Trends The Food Manufacturing Industry (NAICS 311) is one of the largest manufacturing sectors in the United States. The Annual Survey of Manufactures, 2013 indicates the food manufacturing sector accounted for 13.0 percent of the total value of shipments by U.S. manufacturers in Moreover, food manufacturing establishments accounted for 12.4 percent of total manufacturing employment in the United States. As the data shown in Table 1 indicate, the value of shipments for the food manufacturing industry in the U.S. totaled $760,811.2 million in Value added in the industry totaled $269,172.7 million, with total employees numbering 1,372,200 and production workers numbering 1,083,700. Capital expenditures for the food manufacturing industry totaled $15,743.9 million in Data for the review period provided in Table 1 show there has been significant nominal growth in value added, the value of shipments, and capital expenditures, while industry employment has declined slightly. Between , the value of shipments by industry establishment grew by 80.4 percent, industry value added increased by 64.5 percent and annual capital expenditures grew by 45.8 percent. During the same period, the number of production workers decreased by 2.6 percent and total employment in the food manufacturing industry decreased by 6.5 percent. Obviously, the growth in value added and the value of shipments occurring during the sixteen year review period resulted from increases in worker productivity. Worker productivity in the food manufacturing industry has been enhanced by growth in capital expenditures made by industry establishments. Table 1 The Food Manufacturing Industry (NAICS 311), Characteristics and Trends, Selected Years, Avg. Hourly Total Production Value Value of Capital Earnings, Employees Workers Added Shipments Expenditures Prod. Wrkrs. Year (Thousands) (Millions $) ($) , , , , , , , , , , , , , , , , , , , , , , , , , , , , , , , , , , , , , , , , , , , , , Data for the food industry as defined by the 2012 definition for NAICS 311, Food Manufacturing. Sources: U.S. Bureau of the Census, Census of Manufactures, Geographic Series 1997, 2002, and Sources: 2007; Industry Series: Detailed Statistics by Industry for the United States, 2012; and Sources: Annual Survey of Manufactures, 2009, 2011, and
8 During the review period, annual capital expenditures increased 45.8 percent, from $10,799.2 million in 1997 to $15,743.9 million in With a 2.6 percent decrease in the number of production workers during the same period, the annual capital expenditures per worker by food processing manufacturers increased by 49.6 percent, from $9,709 per production worker in 1997 to $14,528 in The growth in worker productivity has not contributed to significant increases in payments to workers during the review period, at least not in real terms. As the data presented in Table 1 (previous page) show, average hourly wages for production workers in the food manufacturing industry increased by 53.0 percent, from $11.27 per hour in 1997 to $17.25 per hour in During the same period, the consumer price index increased by 45.1 percent, resulting in a much more modest increase in average hourly earnings for industry production workers in real, or inflation adjusted terms. When average hourly earnings are adjusted using the consumer price index, the change in average hourly earnings for the period was an increase of 5.4 percent during the 16 year review period or an annual increase of 0.3 percent per year. II. Industry Structure As the reader will note, the Food Manufacturing Industry (NAICS 311) is subdivided into nine 4 digit NAICS code classifications. And as a subsequent table will indicate, these nine 4 digit industry classifications are further divided into additional 5 digit NAICS subgroups. The data presented in Table 2 show the general categories of products produced and sold by the food manufacturing industry. The table also provides insights into the relative sizes of the industry subgroups and the growth in industry shipments among the primary (4 digit NAICS) industry subgroups. The fastest growing industry subgroup at the 4 digit NAICS level was Animal food manufacturing (NAICS 3111), for which industry shipments grew by 55.6 percent between 2007 and The value of industry shipments for Grain and oilseed milling (NAICS 3112), the second fastest growing industry subgroup, grew by 49.1 percent between 2007 and For the Food Manufacturing Industry (NAICS 311) as a whole, industry shipments grew by 29.0 percent between 2007 and Table 2 The Food Manufacturing Industry (NAICS 311), Value of Industry Shipments by Major Industry Subgroup, 2007, 2012, and 2013 Value of Shipments % Change % of Total NAICS Industry Subgroup (Million Dollars) (%) (%) 311 Food manufacturing 589, , , Animal food manufacturing 39, , , Grain and oilseed milling 69, , , Sugar and confectionery product manufacturing 27, , , Fruit and vegetable preserving and specialty xxfood manufacturing 60, , , Dairy product manufacturing 91, , , Animal slaughtering and processing 160, , , Seafood product preparation and packaging 11, , , Bakeries and tortilla manufacturing 55, , , Other food manufacturing 74, , , Source: U.S. Bureau of the Census, Census of Manufactures, Summary Series 2007 and Industry Series 2012 and Annual Survey of Manufactures, Geographic Area Statistics,
9 Other food manufacturing industry subgroups experiencing relatively faster growth in the value of shipments between 2007 and 2013 included Other food manufacturing (NAICS 3119), with a 29.5 percent increase, followed by Animal slaughtering and processing (NAICS 3116), which experienced a 28.5 percent increase and Sugar and confectionery product manufacturing (NAICS 3113), which experienced a 22.3 percent increase. The data in Table 2 and Figure 2 show the relative importance of the food manufacturing industry subgroups, in terms of value of shipments for each industry subgroup. Animal slaughtering and processing (NAICS 3116) sector is the largest industry Figure 2 Value of Shipments by Industry Subgroup, Food Manufacturing Industry (NAICS 311), 2013 subgroup, accounting for 27.1 percent of total industry shipments in The second largest sector, Dairy product manufacturing (NAICS 3115) accounted for 14.7 percent followed by Grain and oilseed milling (NAICS percent), Other food manufacturing (NAICS percent), Fruit and vegetable preserving and specialty food manufacturing (NAICS percent), Bakeries and tortilla manufacturing (NAICS percent), Animal food manufacturing (NAICS percent), Sugar and confectionery product manufacturing (NAICS percent), and Seafood product preparation and packaging (NAICS percent). NAICS % NAICS % NAICS % NAICS % NAICS % NAICS % NAICS % NAICS % NAICS 3111 Animal food manufacturing NAICS 3112 Grain and oilseed milling NAICS 3113 Sugar and confectionery product manufacturing NAICS 3114 Fruit and vegetable preserving and specialty food manufacturing NAICS 3115 Dairy product manufacturing Note: Percentages may not total 100% due to rounding. Source: Table 2. 5 NAICS % Total Industry 2013 Shipments - $760,811.2 Million NAICS 3116 Animal slaughtering and processing NAICS 3117 Seafood product preparation and packaging NAICS 3118 Bakeries and tortilla manufacturing NAICS 3119 Other food manufacturing

 is the largest industry subgroup in terms of industry shipments.")
, which is identical to the 4 digit NAICS 3116 sector.")
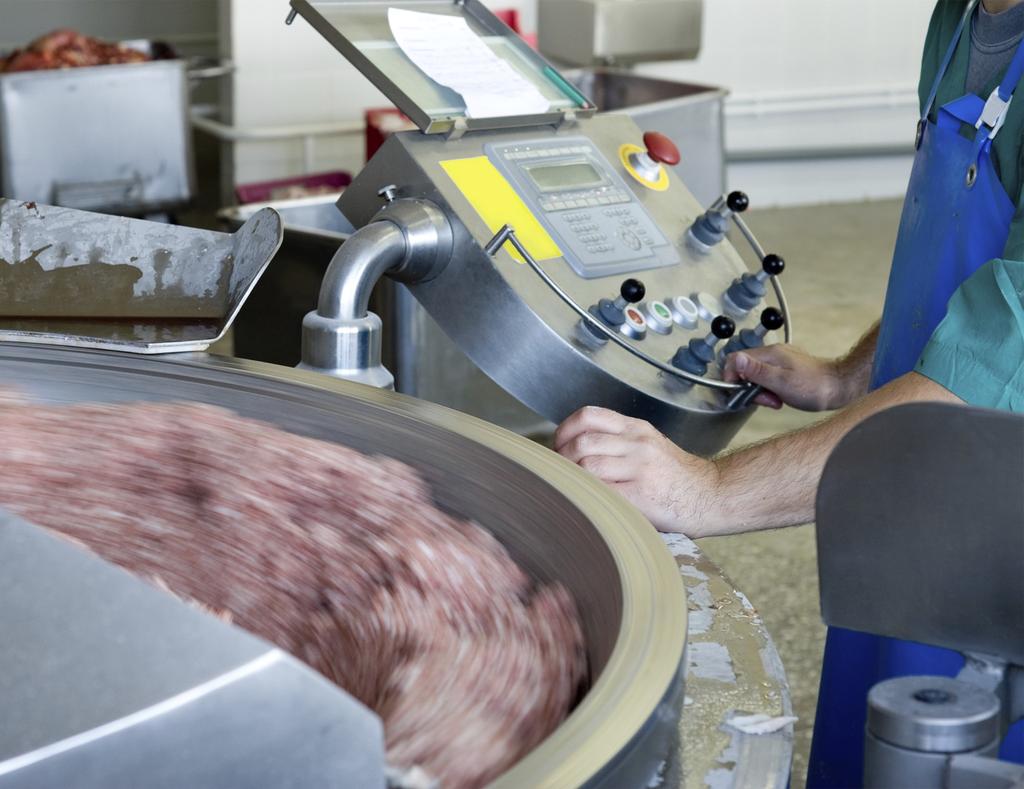
10 The data presented in Table 3 provide further detail for the industry subgroups that comprise the food manufacturing industry. Data showing the number of companies and establishments for 2012 and number of employees, production workers, value added, value of shipments, and capital expenditures are shown for the Food Manufacturing Industry (NAICS 311) as a whole for 2013 and for the NAICS 4 digit and 5 digit subgroups that make up the food manufacturing industry. As previously shown, the Animal slaughtering and processing sector (NAICS 3116) is the largest industry subgroup in terms of industry shipments. As the data presented in Table 3 (following page) show, it is also the largest food industry sector in terms of employees, production workers, value added, and capital expenditures. It is also of interest to note that the largest 5 digit NAICS subgroup is Animal slaughtering and processing (NAICS 31161), which is identical to the 4 digit NAICS 3116 sector. The largest industry subgroup, in terms of the number of companies and establishments, is the Bakeries and tortilla manufacturing (NAICS 3118) subgroup. This industry subgroup accounts for 9,877 of the total 22,086 companies in the food manufacturing industry and 10,546 of the total 25,575 industry establishments. Further inspection of the data for this sector reveals that the 5 digit sector, Bread and bakery product manufacturing (NAICS 31181), account for most of the companies and establishments in this industry sector. Fusion Ranch In 1977, KaiYen Mai s parents brought Hsin Tung Yang Foods Co. to San Francisco from Taiwan. Ten years ago, Mai, now owner, began looking for a new facility in more than five states but could not find a building. Mai ultimately chose Scottsbluff, Nebraska, and established Fusion Ranch because it is a small tight knit community and had local incentives. Last year, Fusion Jerky was launched which is a healthy, handcrafted jerky that is all natural, gluten free, no preservatives, no MSG, and lower in sodium jerky. 6
11 Table 3 The Food Manufacturing Industry (NAICS 311), Number of Companies and Establishments, Employment, Value of Shipments, Value Added, and Capital Expenditures by Major Sector and Industry Subgroups, 2013* Value Value of Capital NAICS Number of Number of All Production Added Shipments Expenditures Code Industry Description Companies* Establishments* Employees Workers (Thousand $) 311 FOOD MANUFACTURING 22,086 25,575 1,372,158 1,083, ,172, ,811,230 15,743, Animal food manufacturing 1,103 1,680 43,655 29,763 16,605,294 60,716,313 1,127, Animal food manufacturing 1,103 1,680 43,655 29,763 16,605,294 60,716,313 1,127, Grain and oilseed milling ,009 38,347 29,029, ,588,735 1,693, Flour milling and malt manufacturing ,491 11,439 6,242,497 20,655, , Starch and vegetable fats and oils manufacturing ,998 15,716 17,371,755 71,857, , Breakfast cereal manufacturing ,520 11,192 5,415,066 11,076, , Sugar and confectionery product manufacturing 1,705 1,847 68,488 50,268 14,839,016 33,336,710 1,076, Sugar manufacturing ,191 10,818 3,607,720 10,517, , Nonchocolate confectionery manufacturing ,862 13,618 3,991,802 7,610, , Chocolate and chocolate confectionery manufacturing 1,241 1,333 37,435 25,832 7,239,494 15,208, , Fruit and vegetable preserving and specialty food manufacturing 1,377 1, , ,312 33,218,562 71,236,234 1,958, Frozen food manufacturing ,130 75,574 13,894,226 30,988, , Fruit and vegetable canning, pickling, and drying 837 1,002 73,270 60,739 19,324,336 40,248, , Dairy product manufacturing 1,142 1, ,866 95,454 31,100, ,936,389 2,301, Dairy product (except frozen) manufacturing 799 1, ,521 81,164 27,994, ,381,778 2,129, Ice cream and frozen dessert manufacturing ,345 14,290 3,105,895 7,554, , Animal slaughtering and processing 3,053 3, , ,795 55,742, ,803,347 3,505, Animal slaughtering and processing 3,053 3, , ,795 55,742, ,803,347 3,505, Seafood product preparation and packaging ,387 26,198 4,437,729 11,158, , Seafood product preparation and packaging ,387 26,198 4,437,729 11,158, , Bakeries and tortilla manufacturing 9,877 10, , ,823 36,595,528 66,173,164 1,700, Bread and bakery product manufacturing 8,880 9, , ,974 22,898,299 38,690, , Cookie, cracker, and pasta manufacturing ,771 40,691 11,452,589 23,618, , Tortilla manufacturing ,839 14,157 2,244,641 3,863, , Other food manufacturing 2,855 3, , ,772 47,604,852 96,861,966 2,100, Snack food manufacturing ,286 36,224 17,633,346 32,860, , Coffee and tea manufacturing ,446 9,918 4,495,065 11,985, , Flavoring syrup and concentrate manufacturing ,881 4,522 6,446,439 8,695, , Seasoning and dressing manufacturing ,143 20,875 9,424,235 20,229, , All other food manufacturing 1,179 1,311 64,175 49,233 9,605,767 23,091, ,159 *Values for "Number of Companies" and "Number of Establishments" are for 2012 from the U.S. Census of Manufactures, Source: U.S. Bureau of the Census, Annual Survey of Manufactures, General Statistics,
12 III. Industry Production and Location Characteristics The food manufacturing industry encompasses a very large and diverse industry. In 2012, 25,575 establishments were primarily engaged in food processing, a decrease of 0.2 percent from From 2007 to 2012, establishments with fewer than 20 employees increased by 2.2 percent while establishments with 20 or more employees decreased by 4.8 percent. The data presented in Table 4 compares selected characteristics for the food manufacturing industry as a whole for 2007, 2012, and Over the period, the number of employees declined by 6.3 percent from 1,464,200 to 1,372,300, while production workers decreased by 4.9 percent, from 1,139,300 in 2007 to 1,083,700. The cost of materials (purchased inputs) increased by 39.9 percent, from $351.5 billion in 2007 to $491.9 billion in Another important factor contributing to the 29.0 percent increase in the value of shipments or the value of output produced by the food manufacturing industry was the value added by manufacture, which increased by 11.7 percent, from $241.1 billion in 2007 to $269.2 billion in The Table 4 data, along with data from the Census of Manufacturers, indicate that establishments in the Food Manufacturing Industry (NAICS 311) are more labor intensive than manufacturing establishments generally. In 2013, production workers accounted for 79.0 percent of total employment in the food manufacturing industry, compared to 69.9 percent for all manufacturing. The importance of production workers relative to total employment in the food manufacturing industry has also increased over time. The number of production workers in the industry decreased from 1,139,300 in 2007 to 1,083,700 in 2013 a decrease of 4.9 percent. Total industry employment declined by 6.3 percent for the same period. Total production worker hours declined by a slightly smaller rate, 3.6 percent, than Table 4 Production Characteristics for the Food Manufacturing Industry (NAICS 311) 2007, 2012, and 2013 Percent Change Establishments Number 25,616 25,575 N/A 0.2 N/A With 20+ Employees 8,594 8,183 N/A 4.8 N/A All Employees Number [thousands] 1, , , Payroll [million $] 50, , , Production Workers Number [thousands] 1, , , Hours [millions] 2, , , Wages [million $] 34, , , Average Hourly Wage [$] Value Added by Manufacture [million $] 241, , , Cost of Materials [million $] 351, , , Value of Shipments [million $] 589, , , Cost of Purchased Fuels and Electric Energy Electric Energy [million $] 4, , , Purchased Fuels [million $] 5, , , Quantity of Purchased Electric Energy [million kwh] 80, , , N/A: Not Available. Sources: U.S. Bureau of the Census, Census of Manufactures, Summary Series 2007 and Industry Series, 2012 and U.S. Bureau of the Census, Annual Survey of Manufactures, General Statistics,
13 total production workers and total production worker wages grew by 9.4 percent between 2007 and These data highlight the increasing importance of reliable and productive sources of labor for the food manufacturing industry. As previously noted, the total cost of materials increased by 39.9 percent between 2007 and Energy inputs are an important production input for which the cost has increased less rapidly during the same time period. The cost of purchased electricity increased by 15.0 percent, while the cost of purchased fuels decreased by 26.5 percent from 2007 to Table 5 provides data for selected additional production characteristics for the food manufacturing industry for The industry data presented in Table 5 are for the Food Manufacturing Industry (NAICS 311) as a whole, the Animal slaughtering and processing subsector (NAICS 3116), and the balance of the industry, excluding animal slaughtering & processing. As the data indicate, there were 22,086 companies and 25,575 industry establishments in the food manufacturing industry in Establishments in the animal slaughtering and processing sector totaled 3,591 in 2012, or 14.7 percent of the total industry establishments. Further inspection of the data indicates that the Animal slaughtering and processing sector had, on average, much larger establishments than for the balance of the industry. Data showing the distribution of manufacturing establishments by size is also of interest as one compares the Animal slaughtering and processing sector to the balance of the food manufacturing industry. Food processing establishments with 20 or more employees accounted for 32.0 percent of total industry establishments in For the animal slaughtering and processing sector, establishments with 20 or more employees accounted for 37.8 percent of establishments, while for the balance of the industry the comparable statistic Table 5 Establishment Characteristics for the Food Manufacturing Industry (NAICS 311), Animal Slaughtering and Processing Industry (NAICS 3116), and Other Food Manufacturing (NAICS 3119), 2012 NAICS 3116 NAICS 311 Food Manufacturing Animal Slaughtering and Processing NAICS 3119 Other Food Products Number of Companies 22,086 3,053 19,033 Number of Establishments 25,575 3,591 21,984 Est. with 20+ Employees 8,183 1,357 6,826 Est. with 20+ Emp (% of Total) Est. with 100+ Employees 3, ,432 Est. with 100+ Emp (% of Total) Establishments per Company Production Workers 1,094, , ,610 Average Prod. Workers per Estab Value Added (Million $) 259, , ,432.9 Per Establishment ($1,000) 10, , ,390.1 Per Production Worker ($) 236, , ,305.7 Value of Shipments (Million $) 738, , ,211.2 Per Establishment ($1,000) 28, , ,527.4 Per Production Worker ($) 674, , ,247.0 Source: U.S. Bureau of the Census, Census of Manufactures, Industry Series: Detailed Statistics by Industry for the United States,
14 was 31.0 percent. The differences between the animal slaughtering and processing sector and the balance of the industry are more pronounced when looking at the number and share of establishments with 100 or more employees. For the food manufacturing industry as a whole, 12.3 percent of the establishments had 100 or more employees. This statistic for the animal slaughtering and processing manufacturing industry was 20.1 percent, compared to only 11.1 percent of establishments with 100 employees or more for the balance of the industry. The average establishment in the food manufacturing industry had 42.8 production workers in Further review of the data in Table 5 indicate establishments in the animal slaughtering and processing sector were much larger, with an average of production workers per establishment, which was 3.7 times the average size of 31.0 production workers per establishment for the balance of the industry. Obviously, a few very large plants and many small establishments characterize the animal food manufacturing sector. Companies in the food manufacturing industry tend to locate plants in areas that provide a balance between access to material inputs and market orientation. Over the past few years, however, the location orientation has shifted somewhat, with access to material inputs combined with access to national markets gaining in importance, relative to a location orientation to local and regional markets. The data in Table 6 show the transportation characteristics of commodities produced by the food manufacturing industry. Data in Table 6 indicate shipping distances for Meat, poultry, fish, seafood, and their preparations and Milled grain products and preparation, and bakery products have increased, while shipping distances for Animal feed, eggs, honey, and other products of animal origin and Other prepared foodstuffs, and fats and oils have decreased. In 2012, the average distance shipped for Animal feed, eggs, honey, and other products of animal origin was slightly less than 400 miles and the average shipping distances for the other three categories ranged between 230 miles for Other prepared foodstuffs, and fats and oils and 262 miles for Milled grain products and preparation, and bakery products. To provide an indication of the geographic dispersion of the food manufacturing industry, Table 7 (following page) presents 2013 data, the most recent year these data are available for this report, on employment, production workers, value added by manufacturer, and value of shipments for 16 selected states. As indicated in the table, establishments located in the 16 states for which data are presented contribute 62.7 percent of total value added in the food manufacturing industry. Moreover, these states account for 65.7 percent of Table 6 Shipment Characteristics for the Food Manufacturing Industry (NAICS 311) Related Commodities, Selected Commodities, 2007 and 2012 Value (Mil. $) Tons (Thous.) Ton-miles Average Miles % Change Commodity Sector (Mil.) Animal Feed, Eggs, Honey, and Other xxproducts of Animal Origin 114, ,393 57, Meat, Poultry, Fish, Seafood, and xxtheir Preparations 302,921 90,439 43, Milled Grain Products and xxpreparations, and Bakery Products 164, ,915 58, Other Prepared Foodstuffs, and Fats xxand Oils 597, , , Source: U.S. Bureau of the Census, Census of Transportation, 2007 and 2012 Commodity Flow Survey. 10
15 total industry shipments and 59.6 percent of total production workers in the food manufacturing industry. Included among these states are Nebraska and neighboring states that typically compete with Nebraska for plant locations. Also included are the leading states with the greatest concentrations of food processing activity. The 16 states are included in this study as alternative sites for plant locations and are evaluated in Appendix A of this report using the geographically variable labor and energy costs. In 2013, California, with total shipments by food processing establishments of $75,426 million, was the largest food manufacturing state, accounting for 9.9 percent of the total U.S. food product shipments. Illinois, with shipments of food products totaling $44,436 million, ranked second among the states and contributed 5.8 percent of the total industry shipments. In terms of the value of shipments of food products, Texas ranked third, followed by Wisconsin, Iowa, Pennsylvania, and Ohio. Nebraska, with shipments of food products totaling $28,407 million, ranked tenth among the states and accounted for 3.7 percent of total industry shipments. The average hourly earnings of production workers in the food manufacturing industry shown in Table 7 indicate Nebraska production workers had average hourly earnings ($17.40) that were 0.9 percent higher than the U.S. average of $17.25, and 4.8 percent less than the average of $18.27 for the other 15 selected states. In highlighting Nebraska s average hourly earnings, it is notable that Nebraska has a higher concentration of its food manufacturng industry (and workers) in the Animal slaughtering and processing sector (NAICS 3116). And, as wages in the meat products manufacturing sector are generally lower than in other food industry sectors, one would expect Nebraska wages to be less than other areas. Table 7 Food Manufacturing Industry (NAICS 311) Production Workers, Average Wages, Value Added, and Value of Shipments Selected States and the U.S., 2013 % of U.S. Production Average Hourly Value Value of Value of Employees Workers Earnings Added Shipments Shipments State (1,000) (1,000) ($) (Million $) (Million $) (%) Nebraska ,116 28, California ,377 75, Florida ,958 12, Illinois ,898 44, Indiana ,906 22, Iowa ,187 42, Kansas ,408 23, Michigan ,054 16, Minnesota ,189 28, Missouri ,046 24, New Jersey ,794 12, New York ,093 19, Ohio ,762 31, Pennsylvania ,792 32, Texas ,186 43, Wisconsin ,104 42, Total Sel. States N/A 168, , Percent of U.S N/A Total U.S. 1, , , ,811 37,951.0 N/A Not Available. Source: U.S. Bureau of the Census, Annual Survey of Manufactures, Geographic Area Statistics:
16 IV. Capital Investment and Industry Outlook Capital investment in the food manufacturing industry exceeded $15.7 billion in As the data presented in Table 8 show, capital investment totaled $15,743.9 million, a 19.3 percent increase from As data provided in Table 8 also indicate, the growth and rate of capital investment in the food manufacturing industry varied significantly among the industry subgroups. The Animal food manufacturing (NAICS 3111) sector recorded the greatest increase (62.7 percent) in capital expenditures between 2007 and 2013, followed by Sugar and confectionery product manufacturing (NAICS percent) and Animal slaughtering and processing (NAICS percent). Two subgroups experienced declines in capital expenditures. The Seafood product preparation and packaging (NAICS 3117) and Other food manufacturing (NAICS 3119) subgroups experienced the declines of 5.5 and 1.4 percent respectively. The food manufacturing industry in the United States is expected to record stable employment and moderate output growth trends over the long term. As indicated by the data presented in Table 9 (next page), employment in the food manufacturing industry (NAICS 311) declined moderately during the period and is projected to decline by an average rate of 0.2 percent per year between 2012 and This projected decline is less than an average annual decline of 2.4 percent per year for all manufacturing employment between 2002 and 2012 and a projected average annual decline of 0.5 percent for the period. Real, constant dollar, output in the food manufacturing industry is projected to increase by 17.5 percent, or by an average annual rate of 1.6 percent, in real, inflation adjusted terms between 2012 and As the data presented in Table 9 indicate, this is slightly less than the projected increase in output for the total manufacturing sector (27.2 percent, or an average annual rate of 2.4 percent) for the projection period. The long run outlook for the food manufacturing industry is very positive. Expanding global markets and incomes will provide large and growing markets for this industry. On balance, the factors affecting individual companies producing food products will depend to a great extent on their ability to compete within their industry and in the markets for their products. While many external factors will influence the overall performance of the industry, the outlook for the individual companies that can control costs and respond to emerging and changing market opportunities and consumer tastes and behavior will be significantly enhanced. Appendix A of this study discusses how food processing establishments can better respond to market conditions and significantly improve their competitive positions with a Nebraska plant location. Table 8 Capital Expenditures in the Food Manufacturing Industry (NAICS 311), by Industry Subgroup, 2007, 2012, and 2013 Capital Expenditures % Change 2013 Cap. Exp. as Percent of NAICS Industry Group Value Added 311 Food manufacturing $13,196,530 $17,143,913 $15,743, Animal food manufacturing 692,604 1,023,463 1,127, Grain and oilseed milling 1,561,443 1,777,630 1,693, Sugar and confectionery product xxmanufacturing 772,978 1,197,114 1,076, Fruit and vegetable preserving and xxspecialty food manufacturing 1,636,394 2,305,592 1,958, Dairy product manufacturing 1,869,415 2,771,426 2,301, Animal slaughtering and processing 2,721,718 3,723,343 3,505, Seafood product preparation and xxpackaging 297, , , Bakeries and tortilla manufacturing 1,513,211 1,763,157 1,700, Other food manufacturing 2,130,834 2,320,935 2,100, Source: U.S. Bureau of the Census, Census of Manufactures, Summary Series 2007 and Industry Series 2012 Source: and Annual Survey of Manufactures, Geographic Area Statistics,
17 Table 9 Employment and Output, Food Manufacturing Sector by Industry Subgroup, for All Manufacturing, 2002, 2012, and Projected 2022 Part A -- Employment Thousands of Jobs Avg. Ann. Rate of Change NAICS Industry Sector / Subgroup Manufacturing 15, , , Food manufacturing 1, , , Animal food manufacturing Grain and oilseed milling Sugar and confectionery product xxmanufacturing 3114 Fruit and vegetable preserving and xxspecialty food manufacturing 3115 Dairy product manufacturing Animal slaughtering and processing Seafood product preparation and xxpackaging 3118 Bakeries and tortilla manufacturing Other food manufacturing Part B -- Value of Output Billions of Chain-Weighted 2005 Dollars (a) Avg. Ann. Rate of Change NAICS Industry Sector / Subgroup Manufacturing 4, , , Food manufacturing Animal food manufacturing Grain and oilseed milling Sugar and confectionery product xxmanufacturing 3114 Fruit and vegetable preserving and xxspecialty food manufacturing 3115 Dairy product manufacturing Animal slaughtering and processing Seafood product preparation and xxpackaging 3118 Bakeries and tortilla manufacturing Other food manufacturing (a) Output shown in billions of chain weighted constant (2005) dollars. Source: U.S. Bureau of Labor Statistics, Office of Occupational Statistics and Employment Projections, Employment and output projections for 2022 (2012). 13
18 Part B Nebraska Advantages for Manufacturers of Food Products The food manufacturing industry appears to have both a market orientation and a resource orientation depending on the specific product produced, the type of establishment, and the market area served. Those establishments which appear to be oriented to plant locations near markets they are serving tend to be the smaller industry establishments which may have identified local market opportunities. Establishments which appear to be more resource oriented in terms of their plant locations tend to be the larger establishments, which produce goods for national distribution or serve significant regional markets. For the industry as a whole, the location orientation tends to favor a combination of resource availability and market access. I. Availability of Inputs in Nebraska Agriculture and agribusiness represent an important segment of the Nebraska economy and provide the basic economic foundation for continued expansion of the state s economy. 14 Essential services available to the agricultural sector and the processing, distribution, and packaging for related food products have provided much of the impetus for growth of the Nebraska economy. The substantial availability of agricultural and agriculturally related resources represent a significant advantage for Nebraska s existing food manufacturing sector and for new and expanding food processing establishments. Table 10 provides data on Nebraska companies engaged in various types of food processing activity. The largest concentration of Nebraska food industry establishments is found in NAICS 31161, Animal slaughtering and processing, followed by NAICS 31111, Animal food manufacturing. As indicated by the data provided in the table, 113 establishments in the state slaughter and further process animal and meat products. Moreover, this industry subgroup employs the most workers, with 26 of these establishments employing more than 100 workers, Table 10 Nebraska Food Manufacturing Establishments by Industry and Employment Size, 2013 Employment Size Less Than ,000 or NAICS Industry Group Total 100 Emp. Emp. Emp. More Emp (Number of Establishments) Animal food manufacturing Flour milling and malt manufacturing Starch and vegetable fats and oils manufacturing Breakfast cereal manufacturing Sugar manufacturing Nonchocolate confectionery manufacturing Chocolate and chocolate confectionery manufacturing Frozen food manufacturing Fruit and vegetable canning, pickling, and drying Dairy product (except frozen) manufacturing Ice cream and frozen dessert manufacturing Animal slaughtering and processing Seafood product preparation and packaging Bread and bakery product manufacturing Cookie, cracker, and pasta manufacturing Tortilla manufacturing Snack food manufacturing Coffee and tea manufacturing Flavoring syrup and concentrate manufacturing Seasoning and dressing manufacturing All other food manufacturing Food manufacturing Source: U.S. Census Bureau County Business Patterns: 2013.
19 14 employing more than 500 workers, and 8 employing more than 1,000 workers. A review of the types of existing food product manufacturers reported in Table 10 (previous page) reveals that many of the significant inputs required by other food manufacturing industry establishments are currently available in Nebraska. Major beef processors operate some of the industry s largest processing facilities in Nebraska. A variety of additional food processors will be able to take advantage of these significant and important local inputs. The significant concentration of major food processors within Nebraska is related to the substantial availability of agricultural commodities produced in the state. Nebraska provides substantial agricultural inputs for beef, poultry, and dairy products processors. Moreover, the food and feed grains and other crops in the state represent an important agricultural resource both for supporting the livestock, poultry, dairy, and related products industry and as a raw materials input for further processing by Nebraska s food products manufacturers. Table 11 provides data on agricultural production for selected crops (Part A) and livestock commodities (Part B on next page) in Nebraska. As these data illustrate, the state accounts for a substantial share of total U.S. production for these agricultural commodities. Nebraska ranks third in the production of corn for grain with 1,664.3 million bushels in As shown in Part A of Table 11, Nebraska s corn crop accounted for 12.2 percent of total U.S. production. Sorghum for grain production in Nebraska totaled 20.2 million bushels, accounting for 3.5 percent of the total U.S. production. Nebraska also produced significant amounts of soybeans (7.4 percent of U.S. production), wheat (2.4 percent of U.S. production), hay (4.4 percent of U.S. production), and dry edible beans (11.4 percent of U.S. production). One of the most significant attributes of Nebraska, in terms of agricultural output, is the production of livestock and livestock products. As the data provided in Part B of Table 11 show, 19.4 percent of the nation s cattle on feed as of January 1, 2015, were in Nebraska, which ranked first among the Table 11 Production of Selected Agricultural Commodities in Nebraska Part A -- Selected Crops Corn for Grain, 2015 Sorghum for Grain, 2015 Acres Harvested Production Acres Harvested Production (1,000) (1,000 Bu.) (1,000) (1,000 Bu.) Nebraska 8,900 1,664, ,240 % of U.S U.S. Total 81,101 13,686,063 7, ,658 Wheat, 2015 Soybeans, 2015 Acres Harvested Production Acres Harvested Production (1,000) (1,000 Bu.) (1,000) (1,000 Bu.) Nebraska 1,300 52,000 5, ,400 % of U.S U.S. Total 48,454 2,136,039 83,549 3,916,448 All Hay, 2014 Dry Edible Beans, 2014 Acres Harvested Production Acres Harvested Production (1,000) (1,000 Tons) (1,000) (1,000 CWT) Nebraska 2,600 6, ,336 % of U.S U.S. Total 56, ,100 1,702 29,287 Table continued on following page (including source notes). 15
20 Nebraska % of U.S. U.S. Total Table 11, continued Table 11, Continued Part B -- Selected Livestock, Poultry, and Related Products Cattle on Feed, Jan. 1, 2015 All Cattle & Calves, Jan. 1, 2015 Number Number (1,000 Head) (1,000 Head) 2,530 6, ,025 89,800 Milk Cows, Jan. 1, 2015 Commercial Cattle Slaughter, 2014 Number Number Live Weight (1,000 Head) (1,000 Head) (1,000 Pounds) Nebraska 54 6, ,299,912 % of U.S U.S. Total 9,307 30, ,045,321 Hogs & Pigs, Dec. 1, 2014 Commercial Hog Slaughter, 2014 Number Number Live Weight (1,000 Head) (1,000 Head) (1,000 Pounds) Nebraska 3,200 7, ,014,836 % of U.S U.S. Total 67, , ,431,080 Milk Produced, 2014 Chicken (Excl. Broilers), Dec. 1, 2014 Quantity Number Value (Million Pounds) (Number Head) ($1,000) Nebraska 1,195 11, ,817 % of U.S U.S. Total 206, , ,962,126 Layers and Eggs, 2014 Avg. Number of Layers Eggs (1,000 Head) (Millions) Nebraska 9,466 2,860 % of U.S U.S. Total 360,873 99,768 Source: U.S. Department of Agriculture, National Agricultural Statistics Service xxxxxxx (USDA, NASS), Agricultural Statistics, 2015, states in terms of this measure. Nebraska also led the nation in the commercial cattle slaughter in 2014, accounting for 23.2 percent of the total live weight. Other livestock and livestock products, of which Nebraska produced significant quantities in 2014, include hogs (6.7 percent of the U.S. total, commercial slaughter), chickens (2.4 percent of the U.S. total inventory, and 2.6 percent of layers), and egg production (2.9 percent of the total, U.S. eggs produced). 16

21 II. Nebraska Location Resources In addition to the significant availability of raw materials and intermediate inputs, Nebraska offers a wide range of other locational advantages for food processors. In this section of the study, Nebraska resources and location attributes important to establishments in the food manufacturing industry are presented and discussed. An evaluation of geographically variable labor and energy costs for selected states is presented in Appendix A, which follows this section, using a model manufacturing establishment producing a representative food product. Nebraska lies near both the population and the geographic centers of the United States (Figure 3). The nation s population center moved across the Mississippi River for the first time in 1980 and continues to shift westward. The current population center is near Plano, Missouri, and the geographic center is in Butte County, South Dakota (the geographic center of the 48 contiguous states is Smith County, Kansas). Within one day, goods shipped by truck from Nebraska reach more than 25 percent of the U.S. population; add a second day and the percentage skyrockets to more than 90 percent. In addition to being a prominent location for national markets, Nebraska is well situated to serve international markets, which are important to many food products manufacturers. For example, the Union Pacific s main railroad line in central Nebraska is the busiest freight corridor in the world; many of the trains carry grain to West Coast ports for shipment around the world. Also, the state currently has operating Foreign Trade Zones in Omaha (Zone No. 19, Grantee/ Operator: Dock Board of the city of Omaha/ Douglas Civic Center) and in Lincoln (Zone No. 59, Grantee/Operator: Lincoln Chamber of Commerce Foreign Trade Zone). Foreign trade zones reduce or eliminate duties and excise taxes by allowing domestic activity involving foreign items to take place as if it were outside of U.S. Customs territory. Access to Markets Transportation Nebraska s central location is especially advantageous for transportation services. The state s communities are connected by a good highway system that includes 8,539 miles of interstate, freeway, and arterial roads. That system includes a 455-mile stretch of Interstate 80, the most traveled east-west transcontinental route of the interstate highway system. North-south interstate highways that add to Nebraska s market include Interstate 29, which passes along the state s eastern border in Iowa, and Interstate 25, which passes in close proximity to the state s western border. Figure 3 Truck Access to Regional and National Markets NEBRASKA 17
22 More than 13,500 licensed motor carriers with worldwide connections are based in Nebraska and serve businesses throughout North America. Largely because of Nebraska s good interstate connections, the state is home to one of the largest trucking companies in the country, Werner Enterprises, headquartered in Omaha. The nation s two largest rail companies BNSF Railway Company and Union Pacific Railroad provide rail service to many Nebraska communities. Ten freight railroads operate more than 3,200 miles of track throughout Nebraska. No major city in the United States is more than five days by rail from Nebraska. Amtrak provides passenger service in Nebraska with stops in five communities. The Union Pacific (UP) maintains headquarters in Omaha and is one of the largest railroads in North America with 32,000 miles of track in the western two-thirds of the country. UP operates more than 1,000 miles of track in Nebraska. The Harriman Dispatching Center in Omaha is one of the most technologically advanced dispatching facilities- in the country. Union Pacific s Bailey Yard in North Platte is the largest rail freight car classification yard in the world. The yard covers 2,850 acres, switches 10,000 rail cars daily, and has more than 300 miles of track. Union Pacific s main line in central Nebraska is the busiest rail freight corridor in the world, with more than 115 trains operating over the line every 24 hours. BNSF Railway Company (BNSF) operates more than 1,500 route miles of track in Nebraska, is one of the state s primary railroads transporting two million carloads of freight in Nebraska each year, and employs more than 4,000 people in the state. BNSF has rail yards in Alliance, Lincoln, McCook, and Omaha; intermodal and automotive facilities in Omaha; and mechanical shops in Alliance and Lincoln. Commercial airline service is available in nine Nebraska cities, providing direct service to major hubs. Scheduled air freight service is provided to five additional communities with on-demand service available. A total of 81 public-use airports are located throughout the state. With the Missouri River forming Nebraska s eastern border, the state is a western terminus for barge traffic. Barges have access to both the Gulf of Mexico via the Mississippi River and to the Atlantic Ocean via the Great Lakes and the St. Lawrence Seaway. Low Cost Utilities In providing a full range of reliable utilities with many cost advantages, Nebraska offers additional benefits to food processors. Nebraska s electric rates for typical industrial customers are 21.0 percent less than the U.S. average and are among the lowest of the 48 contiguous states (Figure 4, next page). This benefit is of particular importance to the food manufacturing industry, with its high level of electricity use relative to total energy consumption. A statewide grid system with regional interconnections assures reliability of service and adequacy of supply. One of the reasons for Nebraska s low electric rates is its close proximity to the vast low-sulfur coal fields of eastern Wyoming. It is also the only state in the nation with electric service provided entirely by public power. Nebraska s two largest utilities, Nebraska Public Power District (NPPD) and Omaha Public Power District (OPPD), have under their control an efficient and dependable mix of generating systems to supply current and projected needs; the mix includes coal, nuclear, hydro, wind, gas, oil, and diesel sources. Some major electric-generating facilities in Nebraska are: 1,300-megawatt NPPD coal-fired Gerald Gentleman Station near Sutherland, Unit No. 1 on-line in 1979 and Unit No. 2 on-line in ,330-megawatt OPPD coal-fired plant at Nebraska City, Unit No. 1 on-line in 1979 and Unit No. 2 online in megawatt NPPD Cooper Nuclear Station near Brownville, on-line in megawatt OPPD Fort Calhoun Nuclear Station, on-line in
23 Figure 4 Electric Costs for Industrial Service, Winter 2014 Summer 2014 Average Monthly Bills Billing Demand - 1,000 kw Consumption - 400,000 kwh Annual Average, Winter Summer 2014 WA OR NV CA ID AZ UT MT WY CO NM ND SD NE KS OK TX MN WI IA IL MO AR MS LA MI IN TN AL KY OH GA WV SC FL PA VA NC NY VT NH MA ME NJ DEL MD RI CT Less than $32,000 $32,001 - $35,000 $35,001 - $40,000 More than $40,001 U.S. Average $40,306 Source: Edison Electric Institute, Typical Bills and Average Rates Report, January 1, 2014 and July 1, State averages are weighted using eight months of January 2014 data and four months of July 2014 data. Nebraska data represent the average for Omaha Public Power District, Lincoln Electric System, and Nebraska Public Power District using the same seasonal weighting. NPPD owns and operates a 59 MW wind generation facility near Ainsworth. NPPD has long term agreements to purchase 122 MW of wind generated power from facilities located near Bloomfield, 80 MW from a facility near Petersburg, 75 MW from a facility located in Custer County, Nebraska, and 75 MW from a facility near Steele City. Nebraska utilities also operate 12 hydroelectric plants and receive a power allotment from the Western Area Power Administration (WAPA) hydroelectric facilities on the Missouri River. The utilities operate with a reserve capacity that protects users against voltage reductions and brownouts. Furthermore, the utilities are members of the Mid-Continent Area Power Pool (MAPP), the Southwest Power Pool (SPP), and the Western System Power Pool (WSPP). Natural gas in Nebraska is also attractive to industry for service, supply, and price. A gas-producing state, Nebraska is close and well connected by pipeline to the major gas fields of the central and southern plains. The state s average cost of industrial gas is less than both the regional and national averages. 19 The pipelines of two major companies, Northern Natural Gas and Kinder Morgan, provide an ample supply of natural gas to most areas of Nebraska. Depending on usage requirements, natural gas is offered both on a firm and interruptible basis. High Quality Work Force Any industry derives benefits from a productive and well-educated labor force. Nebraska s labor force has a strong work ethic and technical proficiency. Individuals with the foresight and diligence to transform it into a world center of agricultural production settled the state. Their descendants maintain a work ethic and mechanical aptitude that carry over into the state s manufacturing sector. Contributing to Nebraska s high labor productivity are very low absenteeism and labor turnover rates. Furthermore, Nebraska employers pay among the lowest unemployment insurance and workers compensation costs in the nation. Nebraska s work force quality is also highly rated by the state s employers and by various national comparisons. In 2013, 90.2 percent
24 of the state s population 25 years of age and older were high school graduates, compared to 86.6 percent nationally. In addition, the 2013 Nebraska public high school graduation rate was 88.5 percent. One reason for the high graduation rate is the state s comparatively low student-teacher ratio 13.73:1 in compared to 16.01:1 for the nation. Finally, Nebraska students consistently score above the U.S. average on both standardized achievement tests and college entrance exams. In 2014 Nebraska students averaged 21.7 on the ACT college entrance test, compared to 21.0 nationally. Moreover, Nebraska s average composite ACT score was achieved with 86 percent of graduates taking the exam, compared to 57 percent of graduates nationwide. Higher Education Resources and Research Companies within the food manufacturing industry can be major beneficiaries of flexible, state of the art education resources helping assure a trained, technically skilled work force in Nebraska. University of Nebraska System The industry relies on the presence of quality institutions of higher learning for research, teaching, and a flow of skilled workers. The University of Nebraska (NU) system, with campuses in Lincoln, Omaha, and Kearney, has the largest facilities among the state s 20 colleges and universities and offers advanced degrees in most professional fields. It is a major center for both basic and applied research and has a combined student enrollment of more than 45,000. Founded in 1869, the Lincoln campus of the University of Nebraska is the state s land grant university. Nebraska was the first university west of the Mississippi to establish a graduate college (in 1896); today, NU is one of the top 50 American universities in the number of doctoral degrees granted annually. The University of Nebraska boasts 22 Rhodes scholars and 2 Nobel laureates among its alumni. In 2015, U.S. News & World Report recognized four University of Nebraska-Lincoln online programs as some of the top programs in the nation. These included NU s online graduate education, bachelor of 20 science in applied science, master of engineering management programs, and the master of business administration. These programs are among the more than 100 degree, certificate, and endorsement online programs offered by the four campuses of the University of Nebraska system. The Food Processing Center - University of Nebraska Lincoln ( is a major resource available to food manufactures. The Food Processing Center understands that food is both a science and a business but are also two different, yet interconnected worlds. The Food Processing Center at the University of Nebraska Lincoln provides technical support to the food industry in product and process development as well as business assistance to small companies and entrepreneurs. Through a unique combination of science, engineering, and business development services that parallel the growing needs of the industry, the Food Processing Center supports the food industry by way of improving their market and economic vitality. The mission statement of the Food Processing Center is to advance the value added food manufacturing industry by partnering on technical and business development from idea through ongoing market support. The Center s goals are to stimulate the development of new food businesses, assist current manufacturers to become more efficient, productive, and diverse. The Food Processing Center assists new, as well as existing food processors, through educational programs for administrators, managers, and employees within the industry. Current programs and services are provided to meet the ever changing challenges of the food industry, with new, innovative services and workshops continually added in order to meet these needs. All services are provided on a strictly confidential basis. The Food Processing Center Team The Food Processing Center team is made up of food scientists and business professionals that are wholly committed to providing services to the food industry. Services are provided to food processors ranging from micro entrepreneur start ups to established Fortune 500 food companies. The Food Processing Center s team
25 has access to state of the art pilot plants and labs which allow them to provide outstanding assistance within the following service areas: Applied Research & Engineering Labeling & Regulatory Compliance Laboratory Services Pilot Plants Product & Process Development Professional Development Opportunities and Education Sensory Analysis Laboratory Small Business Development Services The Food Processing professional team works in conjunction with the Food Science and Technology faculty as well as faculty in other departments within the University of Nebraska, such as Agricultural Economics, Animal Science, Agronomy and Horticulture, Plant Sciences, and Biological Systems Engineering. Applied Research & Engineering This unit, known as ARE, serves as the bridge between fundamental research and the food industry. ARE utilizes and adapts the findings of original scientific research to meet specific industry needs. ARE helps businesses improve efficiencies and sharpen their competitive edge. Labeling & Regulatory Compliance Understanding FDA and USDA labeling regulations can be a daunting task for any company. Labeling assistance and reviews are provided to ensure that packaging is in compliance with regulations. Laboratory Services From routine analysis to specialized research projects, the Food Processing Center provides rapid and accurate microbiological testing so companies can make appropriate decisions regarding the safety of their food products. These comprehensive services allow companies to bring safe products to the market and quickly address food safety issues. Pilot Plants The Food Processing Center has extensive equipment that can be used to produce samples or to develop, scale up, and test product formulas and food ingredients. Utilizing the Center s equipment saves a company time and money in bringing finished products to the marketplace. Product & Process Development The Food Processing Center provides innovative formulation and process development for a wide range of food and beverage products. This includes concept and prototype development, scale-up, ingredient application, and line extensions. Professional Development Opportunities Providing the opportunity for employees to learn new skills and update their knowledge is critical for any company to remain viable in the marketplace. The Food Processing Center provides companies with a variety of unique educational and training opportunities so companies can continue to be successful. Sensory Analysis Laboratory Sensory analysis studies allow companies to better understand, determine, and target specific markets. The Center designs and conducts studies in their sensory facility to meet the objective of each client. Small Business Development Services Launched in 1989, the National Food Entrepreneur Program has helped thousands of entrepreneurs nationwide realize their dream of starting a food company. The program begins with the one day Recipe to Reality Seminar and individualized consultation is provided through Product to Profit. Other State Colleges In addition to the University of Nebraska system, Nebraska operates a state college system with campuses at Chadron, Peru, and Wayne. A variety of private colleges and universities are also located in Nebraska including Creighton University in Omaha, Nebraska Wesleyan 21

26 Friends & Sports Enthusiasts Launch Healthy Frozen Novelities Apollo Food Group, LLC of Boston, MA, produces and markets healthy frozen Greek yogurt novelties under the brand name Yasso TM a variation of the Greek word yassou which means hello. Amanda Klane and Drew Herrington were standout high school athletes Amanda in soccer and Drew in track and field and went on to compete collegiately at the Division I level. In July of 2009, the duo teamed up to explore the idea of starting a food manufacturing business after Amanda was introducted to frozen Greek yogurt while working as a food broker. Inspired by the product, Amanda and Drew embarked on a journey to create a healthy, high protein frozen novelty product utilizing Greek yogurt. To help with the development of their product, they began looking for outside assistance. After determining a private laboratory would be too expensive, they started exploring universities as a more affordable solution. They came across the Food Processing Center at the University of Nebraska Lincoln and contacted Laurie Keeler, senior manager of Product Development, who has a background in the dairy industry and wide ranging experience with developing novel food products. Drew and Amanda worked with Laurie and her product development colleague, Julie Reiling, on the creation of a frozen dairy novelty utilizing Greek yogurt. The goal was a scalable formulation for mass production; one resulting in a high protein product containing less than 70 calories per 75 gram serving. The final product, Yasso TM, was a healthy frozen Greek yogurt delivering 6 grams of protein and only 70 calories per bar. Additional product attributes include: Made from probiotic rich Greek style yogurt All natural Fat free Gluten free Made with rbst free milk A good source of calcium No corn syrup or artificial sugars Kosher No added sodium The first order of Yasso TM Greek yogurt bars was delivered to retailers in March, Today the bars are available in more than 30 different retail chains nationwide with a heavy concentration on both coasts. University in Lincoln, and others located throughout the state (see Figure 5A, next page). Another important facet of higher education in Nebraska is the statewide community college system that provides specialized training programs for new and expanding industries. As indicated in Figure 5B (next page), the state has six community college areas, which provide services in 26 cities across the state. The colleges offer a full curricula of occupational courses, which provide a steady flow of skilled graduates to Nebraska industries. As examples, Hastings and Milford Community College campuses offer vocational/technical training in more than 50 different one-year and two-year programs. Training is accomplished through the extensive use of hands-on activities and is centered around practical application of technical knowledge gained in lecture and laboratory sessions. 22
27 Figure 5A Location of Nebraska Area Colleges and Universities Chadron Sioux City Scottsbluff Wayne Curtis Kearney Grand Island Hastings York Blair Fremont Omaha Papillion Seward Bellevue Crete Lincoln Peru Source: Nebraska Coordinating Commission for Postsecondary Education. Figure 5B Community Colleges in Nebraska WESTERN Alliance Scottsbluff Sidney Valentine O Neill South Sioux City NORTHEAST Norfolk MID-PLAINS West Point Broken Bow Columbus Blair METROPOLITAN North Platte Ord Fremont Omaha LaVista Ogallala Grand Island Lexington Kearney Lincoln Imperial Milford Holdrege Hastings SOUTHEAST McCook CENTRAL Beatrice Source: Nebraska Community College System. 23
28 Performance-Based Tax Incentives In 2005 the Nebraska Legislature enacted the Nebraska Advantage Tax Incentive Program and amended the program in 2008 and The Nebraska Advantage package replaced and improved on Nebraska s existing tax incentive programs and created a business climate that makes Nebraska the preferred location for business start-ups and expansions. The Nebraska Advantage rewards businesses that invest in the state and hire Nebraskans. In this progressive, pro-business climate, corporate income and sales taxes are reduced or virtually eliminated. Further information about the Nebraska Advantage is summarized in this study and is available at The legislative components of the Nebraska Advantage package include: Nebraska Advantage Act (LB 312) Expanded incentives for six tiers of investment and/or job creation Small business advantage Research and development advantage Microenterprise tax credit advantage Rural development advantage State and local sales tax exemptions of manufacturing machinery, equipment, and related services Qualified businesses for Tier One include scientific testing research and development, manufacturing, and targeted export services. Qualified businesses for Tiers Two, Three, Four, and Five include the above plus data processing, telecommunications, insurance, financial services, distribution, storage, transportation, and headquarters (administrative). All businesses other than retail qualify for Super Tier Six. Retail sales of tangible personal property to specified markets can also qualify under Tiers Two through Six. Nebraska Agricultural Innovation Advantage (LB 90) Agriculture opportunities and value-added partnership act Building entrepreneurial communities act Ethanol production incentive cash fund enhancement 24 Other components in the Nebraska Advantage package are: Nebraska Customized Job Training Advantage - Provides a flexible job training program with grants from $500 to $4,000 per job. Additional funds may be available for new jobs created in rural or high poverty areas. Companies can design their own training or a statewide training team can assist with training assessments, training plans, curriculum development, and instruction. Nebraska Research and Development Advantage - Offers a refundable tax credit for research and development activities undertaken by a business entity. The credit is equal to 15 percent of federal credit allowed under Section 41 of the Internal Revenue Code of The credit is increased to 35 percent of the federal credit allowed under Section 41 if the business firm makes expenditures on the campus of a Nebraska college or university or a facility owned by a college or university in Nebraska. An important feature businesses with little or no income may take advantage of the tax credit by receiving a sales tax refund or a refundable income tax credit. Nebraska Microenterprise Tax Credit Advantage - Provides a 20 percent refundable investment tax credit to micro businesses on new investment in targeted communities. Applicants may qualify for a maximum $10,000 throughout the life of the program. The credit is geared to companies with five or fewer employees, including start-ups. Credits are approved through an application process with the Nebraska Department of Revenue and evaluated on expected local economic impacts. The credits are earned on new expenditures for wages, buildings, certain expenses, and non-vehicle depreciable personal property. Additional Tax Savings: Sales Tax Exemption On: - Manufacturing equipment - Manufacturing or processing raw materials - Common carrier vehicles - Utilities used in manufacturing No Tangibles Tax No Inventory Tax
29 Sales Tax Refund on Pollution Control Equipment 100% Tax Exemption on Certain Personal Property In a tax policy incentive, Nebraska determines the taxable income attributable to Nebraska operations using a single factor, or sales only, formula. This method for determining corporate income tax allocation provides a significant advantage to multi-state unitary firms that sell products or services outside Nebraska. Nebraska also provides a capital gains exemption. State residents may elect, on a one-time basis, to subtract from their income tax liability the gain from the sale of capital stock of a corporation acquired during Nebraska-based employment with the corporation. New Economic Development Initiatives Nebraska has recently adopted several new legislative initiatives and programs designed to build Nebraska s innovation economy and foster new high quality job opportunities. Additional information on all these initiatives can be viewed at Talent & Innovation Initiative (T12) - The four part T12 was developed to enhance momentum in Nebraska s fastest growing industries, maintain Nebraska world class workforce, and leverage private sector innovation. Nebraska Internship Program (InternNE), LB 386, is a partnership with Nebraska businesses to create new, paid internship opportunities for college and university students. The program provides matching grants to create new internship opportunities and are for 500 to 750 juniors and seniors studying at four year institutions or students in their second year at a Nebraska community college. Grant awards will be made on a first come, first serve basis to companies creating new internship opportunities, which are capped at ten per business. Internships will pay at least minimum wage and range from 12 week to year long programs. Grant amounts are lesser of 40 percent of reimbursable costs or up to $3,500 in non distressed areas, and 25 lesser of 60 percent of reimbursable costs or up to $5,000 in distressed areas. Business Innovation Act, LB 387, is intended to help businesses develop new technologies and leverage innovation to enhance quality job opportunities in the state. It will provide competitive matching grants for research, development, and innovation and will also help expand small business and entrepreneurial outreach efforts. Eligible grant activities may include: prototype development, product commercialization, applied research in the state, and support for small business and microenterprise lending. Site & Building Development Fund, LB 388, makes state resources available to increase industrial site and building availability and support site ready projects. State funding will be focused initially on land and infrastructure development and building rehabilitation, with 40 percent of funding available to non metro areas. Communities will provide matching funds. This program also makes funding available to assist with demolition of dilapidated residential and industrial buildings and offers direct support to communities that lose a major employer. Angel Investment Tax Credit, LB 389, encourages investment in high tech startup enterprises in Nebraska by providing a percent refundable state income tax credit to qualified Nebraska investors investing in qualified early-state companies. Capped at $3,000,000 annually, the program requires minimum investment of $25,000 for individuals and $50,000 for investment funds. Eligible small businesses must have fewer than 25 employees, with the majority based in the state. Other Development Assistance Programs Building on traditional advantages, Nebraska offers additional development assistance programs. Among those programs are the following: Tax Increment Financing (TIF) - An additional incentive program of note is Nebraska s Tax Increment Financing. TIF is a method of financing the public improvements associated with a private development project in a
30 blighted area by using the projected increase in property tax revenue that will result from the private development. Community Development Block Grants (CDBG) - Eligible businesses may be able to qualify for CDBG through local governments so they may make improvements to the public infrastructure serving the project site. Performance based loans of up to $1,000,000 may be awarded to qualifying companies creating new investments and jobs. Fifty one percent of the new jobs must be held by or made available to low- or moderate income persons. Other federal requirements apply. The program is administered by the Nebraska Department of Economic Development. More details are available at Industrial Revenue Bonds - All Nebraska counties and municipalities, as well as the Nebraska Development Finance Fund, are authorized to issue industrial revenue bonds to finance land, buildings, and equipment for industrial projects. No general election is required for an issue. Other Financing Assistance - Supplementing traditional sources, financing assistance is also available through the Nebraska Investment Finance Authority, the Business Development Corporation of Nebraska, and the local development corporations. The Nebraska Department of Economic Development also administers development finance services, with staff helping assemble government financing with conventional financing to put together the best comprehensive package. Nebraska Process Loan Fund - Focuses on making loans to qualifying small businesses. The minimum loan is $50,000, with a maximum of $2,000,000. Advantages with this loan are interest rates ranging from 0 percent to 4 percent, payment deferrals, and the ability to support loans that lack sufficient collateral to qualify the loan(s) from a private lender. It is important to recognize the Nebraska Advantage package replaces and significantly enhances Nebraska s previous performance based tax incentive programs. Those earlier incentives, the first of which was passed by the Nebraska Legislature in 1987, had a profound effect in stimulating business investment, expansion, and job creation. Nebraska s previous tax incentive programs contributed to substantial investment and job creation, including total investment of more than $23.5 billion and 121,000 jobs. The combination of many factors, including Nebraska s attractive business climate, tax incentives, labor productivity, and effective job training programs as well as other positive attributes, has resulted in Nebraska s manufacturing sector significantly outperforming both that of the surrounding states and the U.S. as a whole. Manufacturing employment in Nebraska grew by 17.1 percent between 1990 and As the U.S. economy experienced two major recessions between 2000 and 2011, manufacturing employment in Nebraska declined but outperformed the Plains Region and the nation (Figure 6, next page). These data suggest that companies with Nebraska manufacturing plants benefit from location and other competitive advantages associated with doing business in Nebraska. Quality of Life For a potential newcomer to Nebraska, the state s livability is obviously also a consideration. Nebraska ranks high in quality of life studies. The state s landscape is clean and spacious, both in urban and rural areas. Residents blend Midwestern values with Western enthusiasm for growth and change. This helps create a high degree of citizen participation in both neighborhood and community wide activities. The cost of living in non-metropolitan Nebraska is consistently at or slightly below the national average. Data presented in Table 12 (next page) indicates on average, the cost of living in Nebraska is 1.1 percent below the U.S. average. Of particular interest is the cost of housing, which in Nebraska averages 7.1 percent less than for the U.S. as a whole for families renting a home and the cost of utilities, which is 12.7 percent less than the U.S. average. 26
31 Table 12 Cost of Living in Nebraska, Compared to the National Average, As of July 1, 2015 All Income/ Items Consum- Transpor- Health Monthly Home Payroll Index (a) ables tation (b) Services Rent (c) Value (c) Utilities Taxes U.S. Average Nebraska Omaha, NE Lincoln, NE Nonmetro NE (d) (a) Cost of living values computed for a family of three with an annual income of $50,000. (b) Transportation costs assumes ownership of two cars valued at $14,312, which are driven a total of 20,000 miles annually. (c) Assumes a house of 1,613 square feet for both rental assumption and home value. (d) Nonmetro Nebraska data represent the average of 14 Nebraska cities outside of the Omaha and Lincoln metropolitan areas. These cities include Beatrice, Columbus, Dakota City, Fremont, Grand Island, Hastings, Kearney, McCook, Norfolk, North Platte, O'Neill, Scottsbluff, South Sioux City, and Valentine, Nebraska. Source: Index values computed from cost of living data obtained from Economic Research Institute (ERI), Source: Relocation Assessor Database as of July 1, Figure 6 Manufacturing Employment, Nebraska, Surrounding States, and the U.S., , 1990= Nebraska 70 Sur. States U.S Surrounding States include data for the states contiguous to Nebraska, as a group, including Colorado, Iowa, Kansas, Missouri, South Dakota, and Wyoming. Source: Bureau of Labor Statistics, 27

32 CONCLUSIONS This study concludes the food manufacturing industry is desirable for Nebraska and a Nebraska location is desirable for the industry. The locational advantages Nebraska offers appear well-suited to food products manufacturers. They cover a wide spectrum, ranging from an attractive business climate to a high quality of life at a relatively low cost, to the substantial raw materials and intermediate inputs Nebraska provides for food products manufacturers. But, as the study s model plant analysis demonstrates, in Appendix A, the competitive advantages Nebraska offers in important cost areas which vary geographically, such as labor and energy costs, are particularly noteworthy. The state s well-educated and productive labor force is a long-standing asset, as are its very favorable electric and natural gas rates. Essentially, the analysis presented in this study was based on state-to-state comparisons applicable to the food manufacturing industry generally. Individual manufacturers will therefore need to further consider the locational requirements of their manufacturing as well as the merits of specific sites within states. Certainly in terms of a general location situation for food products manufacturers, Nebraska has much to offer. Open Range Beef (ORB) began a new meat processing operation in Gordon, Nebraska, in December ORB purchased the plant from the city of Gordon, in northwest Nebraska in June 2013 and immediately began remodeling the building s refrigeration system, installing new SaniCrete floors, walls, and upgrading and installing new processing equipment. The 36,000-square-foot plant is furnished with the latest state-of-the-art equipment and 100 new and experienced employees. According to Co-plant Principal Pat Shudak, the meat processing plant is poised to process between 250 and 300 head of cattle per day. He also indicated that plans are being made to expand the plant s cooler space in the future and add 175 additional jobs. With cattle and agriculture being the two top leaders in revenue generation for the state of Nebraska, it s important that we try to maximize the opportunities that we have available, said Gordon City Manager Fred Hlava. We feel very fortunate that the Open Range Beef investment group looked at this mid sized plant as a business opportunity and to our advantage, one that will provide economic benefits for our community, region, and state. 28
33 The three organizations cooperating in the preparation of this study can also assist food manufacturers in assessing advantages in Nebraska for a specific new location or expansion project. To obtain this assistance, write or call: Economic Development Department NEBRASKA PUBLIC POWER DISTRICT PO Box 499 Columbus, Nebraska (402) (800) rjnelse@nppd.com Business Development Division NEBRASKA DEPARTMENT OF ECONOMIC DEVELOPMENT PO Box Lincoln, Nebraska (402) (800) brenda.hicks-sorensen@nebraska.gov Food Processing Center UNIVERSITY OF NEBRASKA LINCOLN Institute of Agriculture and Natural Resources 143 Food Industry Complex Lincoln, Nebraska (402) fpc@unl.edu 29
34 APPENDIX A LABOR AND ENERGY COST ANALYSIS As shown in the previous sections, Nebraska offers a wide range of locational advantages for manufacturers of food and related products. In this appendix, labor and energy production cost factors that have geographic variability are analyzed. Such analysis permits the identification of the plant site providing the greatest advantage relative to these important input factors. In the analysis of geographically variable labor and energy costs, the following procedures are used: 1) Selection of alternative plant locations for evaluation of the geographically variable labor and energy costs. 2) Definition of a model manufacturing plant for identifying labor and energy inputs and costs. 3) Evaluation of labor-related costs associated with each alternative plant location. 4) Evaluation of energy costs for each alternative plant location. Alternative Plant Locations Sixteen alternative plant locations were selected for comparison in this analysis. The plant locations essentially included two groups of states: (1) states that currently have the largest concentration of manufacturers of food products and (2) neighboring states that typically compete with Nebraska for industrial location projects. The first group of states includes California, Florida, Illinois, Indiana, Michigan, Minnesota, New Jersey, New York, Ohio, Pennsylvania, Texas, and Wisconsin. The second group of states includes Iowa, Kansas, Missouri, and Nebraska. Combined, these two groups of states account for 62.7 percent of the value added by manufacture in the food manufacturing industry (see Table A 1). The Model Plant To facilitate the analysis of the comparative labor and energy costs for the alternative states, it is useful to define a model plant for which the geographically variable costs can A-1 Table A-1 Alternative Locations for a Model Plant for the Food Manufacturing Industry (NAICS 311) Percent of Value Added by State Manufacture (a) Nebraska 2.3 California 10.5 Florida 1.8 Illinois 5.9 Indiana 2.9 Iowa 4.2 Kansas 2.0 Michigan 2.6 Minnesota 3.0 Missouri 3.0 New Jersey 1.8 New York 2.6 Ohio 5.1 Pennsylvania 4.8 Texas 5.3 Wisconsin 4.9 Total Selected States 62.7 (a) Percent of the 2013 U.S. total value added by xmanufacture for establishments in NAICS 311. Source: U.S. Bureau of the Census, Annual Survey of Manufactures, be quantified. The model plant is assumed to manufacture a product representative of the Food Manufacturing Industry (NAICS 311) as a whole. To specify the relevant labor and energy costs, information was obtained from the Annual Survey of Manufactures, 2013, and the U.S. Energy Administration 2010 Manufacturing Energy Consumption Survey. Table A-2 presents industry characteristics used in developing the model plant, which is assumed to employ 50 production workers. Estimated production worker hours total 104,000 annually or 2,080 hours per worker. Value added by manufacture is estimated to be $12,419,150 and the total annual output (value of shipments) is estimated to be $35,102,500. Energy inputs are
35 estimated at 39,661 million BTUs, with all energy inputs supplied by electricity and natural gas. Energy Used in the Model Plant The assumption that the model plant is representative of the industry as a whole leads to the assumption that energy used in the plant also should be characteristic of industry use patterns. Part A of Table A-3 presents data estimating energy use for the industry in The estimated energy use for the model plant was derived using the ratio of energy inputs to industry value added. Table A-2 Characteristics of a Model Plant for the Food Manufacturing Industry (NAICS 311) Total Per Production Model Plant Worker Production Workers 50 Value Added [dollars] (a) 12,419, ,383 Total Output [dollars] (b) 35,102, ,050 Energy Inputs [million BTUs] (c) 39, (a) Estimated value added applies the 2013 value added per production worker for the Food Manufacturing Industry (NAICS 311) to the model plant (see Table 4). (b) Estimated value of shipments derived by applying the 2013 value of shipments per production worker to the model plant (see Table 4). (c) Estimated by applying the 2013 ratio of energy inputs per production worker to the model plant (see Table A 3). Source: Calculated from data presented in Table A 3 and from U.S. Bureau of the Census, Annual Survey of Manufactures, Table A 3 Energy Use in Food Manufacturing Establishments A-2 It was further assumed all energy inputs for the model plant are derived from electricity and natural gas. Part B of Table A 3 indicates the model plant, employing 50 production workers, will have annual energy inputs of 39,661.0 million BTUs. Electric energy inputs are estimated to be 12,136.4 million BTUs (3,556,990 kwhs), or 30.6 percent of the total energy inputs, while natural gas inputs are estimated at 27,525.0 million BTUs, 69.4 percent of the total energy requirements. Trillion BTUs Percent Purchased Fuels and Electric Energy Purchased Electric Energy Purchased Fuels Source: Energy use estimated from data from the U.S. Bureau of the Census, Annual Survey of Manufactures, 2013 and U.S. Energy Information Administration, 2010 Manufacturing Energy Consumption Survey. Part B Energy Inputs for the Food Manufacturing Model Plant Million BTUs Percent Purchased Electricity 12, (3,556,990 kwhs) Natural Gas 27, Total Energy Inputs 39, Source: Calculated from data in Table A 2 and Part A of this table.

36 Labor-Related Costs Labor costs in the food manufacturing industry are affected by several factors: wage rates, productivity of workers, fringe benefits, and unemployment insurance and workers compensation costs. Estimated labor related costs for a model, food processing plant operating in Nebraska and in each of the 15 alternative state locations are presented in Table A 4 and Figure A-1 (next pages). Table A 4 also includes data on wage rates for the states identified as alternative plant locations. An analysis of state wage levels indicates Nebraska s food manufacturing production workers have hourly earnings, which are significantly less than all but two of the alternative plant sites. For example, 2013 average hourly earnings for Nebraska food processing workers ($17.40) are 4.8 percent less than the average hourly wage rates for the other 15 states included as alternative plant locations. The Nebraska costs for unemployment insurance and workers compensation are significantly less ecreamery, Personalized Ice Cream Gifts Becky App and Abby Jordan wanted to provide gift givers a new personalized gift; something the receiver would like and that would connect the gift to the receiver in a way only the giver could communicate. The model for ecreamery.com materialized in 2006 when their investor, Mark Hasebroock, purchased an existing, though somewhat dysfunctional, website that allowed users to create custom ice creams. Immediately, Abby and Becky had the idea to move away from customized self purchase and create a space that invited personalized gifting. To learn more about the intricacies of starting a food business Abby and Becky attended the Food Processing Center s seminar From Recipe to Reality. This nationally recognized workshop is specifically designed for food entrepreneurs and provides an overview of the marketing, business, and technical apsects that need to be taken into consideration. The education they received from this course included information on federal and state regulations, packaging requirements, distribution channels, and valuable contacts with industry experts. The pair subsequently worked on recipe development, distribution (shipping), and revamping the website. The duo launched ecreamery.com in mid In 2011 Abby and Becky were approached by The Food Processing Center to take part in a new initiative pioneered by Gallup, Inc. Over the past five years, Gallup has been adapting their globally validated behavioral economic sciences/systems specifically to help entrepreneurs increase sales, profits, and ultimately, to sustainably grow their businesses. The end product the Entrepreneur Acceleration System (EAS) uses one on one mentoring to facilitate an entreprise s growth strategy. Since Recipe to Reality and the knowledge that The Food Processing Center has been able to give to ecreamery.com, they have seen tremendous sales and growth. As people continue to learn ice cream gifts exist and the public s comfort level with shipping frozen foods increases, ecreamery.com is confident in the continued growth of their company. Currently, as they look towards expansion they have begun researching ways to lower shipping costs to their customers. Production and distribution capabilities on either coast are their latest move in order to better serve the needs of their target audience. A-3
NEBRASKA FABRICATED METAL PRODUCTS PROFIT OPPORTUNITIES FOR MANUFACTURERS OF.
 NEBRASKA PROFIT OPPORTUNITIES FOR MANUFACTURERS OF FABRICATED METAL PRODUCTS http://econdev.nppd.com Table of Contents Executive summary...1 Part A The Fabricated Metal Product Manufacturing Subsector
The Economic Performance of Food-Manufacturing Industries in Idaho
 The Economic Performance of Food-Manufacturing Industries in Idaho Yuliya Bolotova As part of the global economy, agriculture and agribusiness of the State of Idaho have been significantly affected by
NEBRASKA FABRICATED METAL PRODUCTS PROFIT OPPORTUNITIES FOR MANUFACTURERS OF.
 NEBRASKA PROFIT OPPORTUNITIES FOR MANUFACTURERS OF FABRICATED METAL PRODUCTS http://econdev.nppd.com Table of Contents EXECUTIVE SUMMARY...1 PART A THE FABRICATED METAL PRODUCT MANUFACTURING SUBSECTOR...4
2012 Farm Outlook. Highlights
 2012 Farm Outlook Office of the Chief Economist USDA Highlights A promising spring planting was followed by historic drought. Record high commodity prices followed. Farm incomes are expected to be near
Kansas. Estimated Economic Impact of Agriculture, Food, and Food Processing Sectors 08/01/2017
 Estimated Economic of Agriculture, Food, and Food Processing Sectors 08/01/2017 Using the most recent IMPLAN data available (2015) adjusted for 2017, 65 agriculture, food, and food processing sectors were
Estimated Economic Impact of Agriculture, Food, and Food Processing Sectors 9/8/2016
 Estimated Economic Impact of Agriculture, Food, and Food Processing Sectors 9/8/2016 This study was commissioned by the Agricultural Business Council of Kansas City and the American Royal and performed
SOYBEANS: LARGE SUPPLIES CONFIRMED, BUT WHAT ABOUT 2005 PRODUCTION?
 SOYBEANS: LARGE SUPPLIES CONFIRMED, BUT WHAT ABOUT 2005 PRODUCTION? JANUARY 2005 Darrel Good 2005 NO. 2 Summary USDA s January reports confirmed a record large 2004 U.S. crop, prospects for large year-ending
Input-output models for agriculture and agri-food industries
 Input-output models for agriculture and agri-food industries Pre-conference: Canadian Agricultural Economics Society Andreas Trau 613-951-3466 andreas.trau@statcan.gc.ca January 11, 2017 Overview Introduction
SOYBEANS: SMALLER STOCKS, MORE ACRES, AND EARLY WEATHER WORRIES
 SOYBEANS: SMALLER STOCKS, MORE ACRES, AND EARLY WEATHER WORRIES APRIL 2000 Darrel Good Summary March 1, 2000 stocks of soybeans were estimated at 1.397 billion bushels, 60 million less than on the same
SOYBEANS: HIGHEST PRICES IN OVER SEVEN YEARS. January 2004 Darrel Good 2004 NO. 2
 SOYBEANS: HIGHEST PRICES IN OVER SEVEN YEARS January 2004 Darrel Good 2004 NO. 2 Summary At 2.418 billion bushels, the 2003 U.S. soybean crop was 34 million bushels smaller than the USDA s November forecast
SOYBEANS: DECLINING EXPORTS, LARGE STOCKS
 SOYBEANS: DECLINING EXPORTS, LARGE STOCKS JANUARY 2006 Darrel Good 2006 NO. 2 Summary At 3.086 billion bushels, the 2005 U.S. soybean crop was 43 million larger than the November forecast and only 38 million
SOYBEANS: SURPLUS GROWS, ACREAGE TO DECLINE
 SOYBEANS: SURPLUS GROWS, ACREAGE TO DECLINE JANUARY 2007 Darrel Good 2007 NO. 2 Summary The 2006 U.S. soybean crop was a record 3.188 billion bushels, but was 16 million smaller than the November 2006
FAPRI-UMC Report December 8, 2005
 FAPRI-UMC Report 17-05 December 8, 2005 FAPRI 2006 Outlook for Missouri Agriculture Food and Agricultural Policy Research Institute (FAPRI) College of Agriculture, Food and Natural Resources University
CORN: USDA REPORTS FAIL TO CONFIRM SMALLER SUPPLIES
 CORN: USDA REPORTS FAIL TO CONFIRM SMALLER SUPPLIES JANUARY 2001 Darrel Good No. 1 Summary Corn prices managed a significant rally from late September to late December 2000, partially on anticipation of
Partnering Associations
 Partnering Associations A-FAN 1. Livestock Development Empowering communities with awareness of the impact of livestock production to make informed decisions Connecting industry opportunities 2. Awareness
Ohio Agricultural Production and Rural Infrastructure
 Ohio Trends in Agricultural Production and Infrastructure Highlights - In many states the percentage of the state population designated by the U.S. Census Bureau as living in rural areas has declined,
Grain Price SOYBEANS: SMALLER U.S. CROP, WILL SOUTH AMERICA FILL THE GAP? OCTOBER 2002 Darrel Good 2002 NO. 8. Summary
 UNIVERSITY OF ILLINOIS EXTENSION Grain Price OUTLOOK A joint publication of the Department of Agricultural Economics, College of Agriculture, Purdue University, West Lafayette, Indiana, and the Department
NEBRASKA FABRICATED METAL PRODUCTS PROFIT OPPORTUNITIES FOR MANUFACTURERS OF. sites.nppd.com
 NEBRASKA PROFIT OPPORTUNITIES FOR MANUFACTURERS OF FABRICATED METAL PRODUCTS sites.nppd.com Nebraska Wins Governor s Cup for Second Consecutive Year. Businesses are moving to Nebraska! People are locating
1979 Food and Agricultural Outlook
 1979 Food and Agricultural Outlook NEIL A. STEVENS and CLIFTON B, LUTTRELL ~HE 1979 forecast of U.S. food and agricultural developments by the U.S. Department of Agriculture (USDA) points to larger food
SOYBEANS: WORLD PRODUCTION CONTINUES TO EXPAND
 SOYBEANS: WORLD PRODUCTION CONTINUES TO EXPAND OCTOBER 2001 Darrel Good 2001-No. 7 Summary The USDA s October Crop Production report forecast the 2001 U.S. soybean crop at 2.907 billion bushels. That forecast
Jason Henderson Vice President and Branch Executive Federal Reserve Bank of Kansas City Omaha Branch April 25, 2012
 Jason Henderson Vice President and Branch Executive April 25, 2012 The views expressed are those of the author and do not necessarily reflect the opinions of the Federal Reserve Bank of Kansas City or
May 17, 1996 Ames, Iowa Econ. Info PLANTINGS LAG IN EASTERN CORN BELT & SPRING WHEAT AREAS
 May 17, 1996 Ames, Iowa Econ. Info. 1694 PLANTINGS LAG IN EASTERN CORN BELT & SPRING WHEAT AREAS Planting progress will be one of several factors influencing prices in the next several weeks. In contrast
The Importance of Agriculture and its Transportation Issues
 The Importance of Agriculture and its Transportation Issues Presented By: Dr. Steve Amosson Regents Fellow Professor and Extension Economist Texas Freight Advisory Committee Meeting Amarillo, Texas October
CATTLE MAY HAVE A DECENT, BUT VOLATILE YEAR
 CATTLE MAY HAVE A DECENT, BUT VOLATILE YEAR FEBRUARY 2004 Chris Hurt 2004 NO. 2 Summary Early indications are that 2004 will not be as difficult for the cattle industry as many producers had feared in
EASTERN CORN BELT DELAYS CONTINUE, MORE FARM PROGRAM DETAILS
 May 31, 22 Ames, Iowa Econ. Info. 1839 EASTERN CORN BELT DELAYS CONTINUE, MORE FARM PROGRAM DETAILS Corn prices in the next two weeks will continue to be moderately sensitive to weather and planting progress
SOYBEANS: AN EARLY WEATHER MARKET
 SOYBEANS: AN EARLY WEATHER MARKET January 2000 Darrel Good Summary 1999 U.S. Crop Estimate Revised Lower Soybean prices have made a modest rally from the mid-december lows, fueled by areas of dry weather
Impact of Higher Corn Prices on Feed Costs
 October 31, 2006 Ames, Iowa Econ. Info. 1945 Impact of Higher Corn Prices on Feed Costs Corn and soybean meal prices have increased rapidly and may move higher over the next year. In the six weeks from
Cattle Markets Start Year Strong
 Louisiana Cattle Market Update Friday, January 24 th, 2014 Ross Pruitt, Department of Agricultural Economics and Agribusiness LSU AgCenter Cattle Markets Start Year Strong It s rare that we have such a
World Agricultural Outlook Board Interagency Commodity Estimates Committee Forecasts. Lockup Briefing March 10, 2014
 World Agricultural Outlook Board Interagency Commodity Estimates Committee Forecasts Lockup Briefing World Wheat Production Country or Region 2013/14 Million Tons World 656.4 712.7 0.1 8.6 United States
Fundamental Shifts Impacting U.S. Agriculture
 Fundamental Shifts Impacting U.S. Agriculture Richard Brock California Grain & Feed Association San Diego, CA April 28, Game Changers 3 fundamental shifts Long term Impact $2 cotton in 2011 industry will
CORN: CROP PROSPECTS TO DOMINATE PRICES
 CORN: CROP PROSPECTS TO DOMINATE PRICES JULY 2002 Darrel Good 2002 NO. 5 Summary The USDA s June Grain Stocks report confirmed a rapid rate of domestic corn consumption during the third quarter of the
Knowledge Exchange Report
 Knowledge Exchange Report February 2016 The Economic Impact of a Minimum Wage Increase on New York State Agriculture New York State is considering a minimum wage increase from $9.00 to $15.00 statewide.
Iowa Farm Outlook. July 31, 2006 Ames, Iowa Econ. Info Midyear Cattle Inventory Report
 Iowa Farm Outlook July 31, 2006 Ames, Iowa Econ. Info. 1939 Overview Midyear Cattle Inventory Report USDA released two reports estimating July 1, 2006 cattle inventories; the midyear Cattle report and
CORN: WILL ACREAGE REBOUND IN 2002
 CORN: WILL ACREAGE REBOUND IN 2002 JANUARY 2002 Darrel Good 2002 - NO.1 Summary The USDA s Crop Production and Grain Stocks reports released on January 11 reflected a smaller domestic supply of corn and
CORN: FIVE CONSECUTIVE LARGE CROPS?
 CORN: FIVE CONSECUTIVE LARGE CROPS? JULY 2000 Darrel Good Summary The USDA s June Acreage Report revealed that U.S. producers had planted nearly 79.6 million acres of corn in 2000, up from 77.4 million
2015 AGRICULTURAL WORKFORCE. Agriculture economy Employment and earnings Agriculture labor market H-2A and prevailing wages Common practices
 2015 AGRICULTURAL WORKFORCE Agriculture economy Employment and earnings Agriculture labor market H-2A and prevailing wages Common practices Labor Market and Performance Analysis September 2016 2015 Agricultural
Economic Impact Study of Agriculture-Related Industries
 Economic Impact Study of Agriculture-Related Industries 12-County Area in Southwest Missouri Presented by: SPRINGFIELD AREA CHAMBER OF COMMERCE AGRIBUSINESS ROUNDTABLE Economic Impact of Springfield Economic
Prices Received, Prices Paid, and Ratio of Prices Received to Prices Paid Indexes 2011 Base United States: February 2015 with Comparisons
 Agricultural Prices ISSN: 1937-4216 Released March 30,, by the National Agricultural Statistics Service (NASS), Agricultural Statistics Board, United States Department of Agriculture (USDA). Special Note
CORN: DECLINING WORLD GRAIN STOCKS OFFERS POTENTIAL FOR HIGHER PRICES
 CORN: DECLINING WORLD GRAIN STOCKS OFFERS POTENTIAL FOR HIGHER PRICES OCTOBER 2000 Darrel Good Summary The 2000 U.S. corn crop is now estimated at 10.192 billion bushels, 755 million (8 percent) larger
Economic Impacts of Agricultural and Natural Resource Industries in Florida,
 FE627 Economic of Agricultural and Natural Resource Industries in Florida, 2003 1 Alan W. Hodges and W. David Mulkey 2 Estimates of economic impacts were developed for the agricultural and natural resource
Economic Analysis of Animal Agriculture
 Economic Analysis of Animal Agriculture 2005-2015 NEW YORK A Report for United Soybean Board September 2016 Decision Innovation Solutions, LLC 11107 Aurora Ave Urbandale, IA 50322 www.decision-innovation.com
Analysis & Comments. Livestock Marketing Information Center State Extension Services in Cooperation with USDA. National Hay Situation and Outlook
 Analysis & Comments Livestock Marketing Information Center State Extension Services in Cooperation with USDA April 2, 2015 Letter #12 www.lmic.info National Hay Situation and Outlook The 2014 calendar
2017 Tennessee Agricultural Outlook. Aaron Smith Crop Economist University of Tennessee Extension
 2017 Tennessee Agricultural Outlook Aaron Smith Crop Economist University of Tennessee Extension Overview Review of the Tennessee Agricultural Economy Crops Livestock 2017 Estimated Net Returns Principle
Pork Industry Makes Turn for the Better
 Pork Industry Makes Turn for the Better July 2004 Chris Hurt After a period of grave concern regarding depressed hog prices and rising feed prices in the spring, markets have turned positive for hog producers.
Feed Grain Outlook June 27, 2016 Volume 25, Number 37
 Today s Newsletter Market Situation Crop Progress 1 Grain Use 2 Outside Markets 5 Marketing Strategies 2016 Feed Grain Marketing Plan 6 Upcoming Reports/Events 7 Market Situation Crop Progress. The Crop
CORN: BETTER DEMAND, PRODUCTION CONCERNS
 CORN: BETTER DEMAND, PRODUCTION CONCERNS April 2000 Darrel Good Summary The USDA s March Grain Stocks report, released on March 31, confirmed a high rate of domestic corn use during the second quarter
Prices Received, Prices Paid, and Ratio of Prices Received to Prices Paid Indexes 2011 Base United States: December 2018 with Comparisons
 Agricultural Prices ISSN: 1937-4216 Released February 20, 2019, by the National Agricultural Statistics Service (NASS), Agricultural Statistics Board, United States Department of Agriculture (USDA). Prices
The Measure of California Agriculture, 2006 CHAPTER FIVE AGRICULTURE S ROLE IN THE ECONOMY
 PREPRINT DRAFT November 29, 2006 The Measure of California Agriculture, 2006 CHAPTER FIVE AGRICULTURE S ROLE IN THE ECONOMY The direct economic contribution of agriculture Additional economic linkages
Agricultural Prices. October Prices Received Index Down 3.5 Percent
 Agricultural Prices ISSN: - Released November, 0, by the National Agricultural Statistics Service (NASS), Agricultural Statistics Board, United States Department of Agriculture (USDA). Prices Received
Minnesota Agricultural Exports
 Minnesota Agricultural Exports Minnesota ranked No. 4 in agricultural exports among all states 2018 Update 10 pages Prepared by Su Ye, Chief Economist Minnesota Department of Agriculture, Agricultural
Crossroads Resource Center
 Crossroads Resource Center Tools for Community Self-determination 7415 Humboldt Ave. S. / Minneapolis, Minnesota 55423 / 612.869.8664 kmeter@crcworks.org www.crcworks.org Sarasota County, Florida Local
November 18, 1996 Ames, Iowa Econ. Info. 1706
 November 18, 1996 Ames, Iowa Econ. Info. 1706 LEAN HOG CARCASS BASIS The new Lean Hog futures contract differs from its predecessor in several ways. It is traded on carcass weight and price rather than
Agricultural Prices. Special Note. January Prices Received Index Down 4.5 Percent
 Agricultural Prices ISSN: 1937-4216 Released February 28, 2019, by the National Agricultural Statistics Service (NASS), Agricultural Statistics Board, United States Department of Agriculture (USDA). Special
Economic Review. South African Agriculture. of the DEPARTMENT OF AGRICULTURE, FORESTRY AND FISHERIES
 Economic Review of the South African Agriculture 2018 DEPARTMENT OF AGRICULTURE, FORESTRY AND FISHERIES Compiled by the Directorate: Statistics and Economic Analysis, Private Bag X246, PRETORIA 0001 Published
Facts About Texas Agriculture
 Facts About Texas Agriculture Caroline Gleaton Administrative Associate III John Robinson Professor and Extension Economist-Cotton Marketing Texas A&M AgriLife Extension Service Department of Agricultural
SOYBEANS: FOCUS ON SOUTH AMERICAN AND U.S. SUPPLY AND CHINESE DEMAND
 SOYBEANS: FOCUS ON SOUTH AMERICAN AND U.S. SUPPLY AND CHINESE DEMAND APRIL 2002 Darrel Good 2002-NO.4 Summary Soybean prices during the first half of the 2001-02 marketing year were well below the prices
WHAT WE KNOW ABOUT THE DEMOGRAPHICS OF U.S. FARM OPERATORS
 Agricultural Outlook Forum 2005 Presented: Friday, February 25, 2005 WHAT WE KNOW ABOUT THE DEMOGRAPHICS OF U.S. FARM OPERATORS Prepared by Rich Allen and Ginger Harris National Agricultural Statistics
CORN: PRODUCTION EXCEEDS EXPECTATIONS
 CORN: PRODUCTION EXCEEDS EXPECTATIONS OCTOBER 2001 Darrel Good 2001 NO. 7 Summary The USDA's October Crop Production report forecast the 2001 U.S. corn crop at 9.43 billion bushels. The crop is about 540
The Economic Impact of Mandatory Overtime Pay for New York State Agriculture
 Farm Credit East Report The Economic Impact of Mandatory Overtime Pay for New York State Agriculture Legislation has been introduced in the New York State Senate and Assembly that would require agricultural
Agricultural Prices. June Prices Received Index Increased 0.1 Percent
 Agricultural Prices ISSN: 1937-4216 Released July 30,, by the National Agricultural Statistics Service (NASS), Agricultural Statistics Board, United States Department of Agriculture (USDA). Prices Received
CORN: MARKET TO REFLECT U.S. AND CHINESE CROP PROSPECTS
 CORN: MARKET TO REFLECT U.S. AND CHINESE CROP PROSPECTS JULY 2001 Darrel Good 2001 - No. 6 Summary The USDA s June Acreage and Grain Stocks reports provided some modest fundamental support for the corn
John Deere s Outlook on Cattle Economics
 John Deere s Outlook on Cattle Economics U.S. Drought having serious impact on livestock Drought impacting large cattle/dairy states Pushing feed prices higher Forced to feed hay earlier, haul water to
Iowa Farm Outlook. Department of Economics April 2013 Ames, Iowa Econ. Info March 2013 Hogs and Pigs Summary
 Iowa Farm Outlook Department of Economics April 2013 Ames, Iowa Econ. Info. 2036 March 2013 Hogs and Pigs Summary On March 28, USDA released the Quarterly Hogs and Pigs Report as of March 1, 2013. As expected
Farm Labor. Special Note
 Washington, D.C. Farm Labor Released August 21,, by the National Agricultural Statistics Service (NASS),, U.S. Department of Agriculture. For information on call Mark Aitken at 202-720-6146, office hours
Marketing 2018 Feeder Calves
 Marketing 2018 Feeder Calves Chris Prevatt Beef Cattle and Forage Economics University of Florida, Range Cattle REC Tariffs A tariff is a tax on imports or exports between sovereign states. Tariffs (from
Crop production and cattle census for the 5-state project area. Report prepared for
 Crop production and cattle census for the 5-state project area Report prepared for Legume adoption practices in western central United States: economic and environmental benefits in face of increased climatic
Where s the Beef Demand?
 Louisiana Cattle Market Update Friday, February 3 rd, 2012 Ross Pruitt, Department of Agricultural Economics and Agribusiness Louisiana State University AgCenter Where s the Beef Demand? The rise in cattle
Grain Stocks. Corn Stocks Up Slightly from September 2015 Soybean Stocks Up 3 Percent All Wheat Stocks Up 21 Percent
 Grain Stocks ISSN: 949-095 Released September 30, 06, by the National Agricultural Statistics Service (NASS), Agricultural Statistics Board, United s Department of Agriculture (USDA). Corn Stocks Up Slightly
SOYBEANS: LOW PRICES TO PERSIST
 SOYBEANS: LOW PRICES TO PERSIST JANUARY 2002 Darrel Good 2002 - NO. 2 Summary Soybean prices received some support from the USDA s January 11 final U.S. production estimate for the 2001 crop. At 2.891
SOYBEANS: LARGE U.S. CROP, WHAT ABOUT SOUTH AMERICA? October 2005 Darrel Good 2005 No. 8
 SOYBEANS: LARGE U.S. CROP, WHAT ABOUT SOUTH AMERICA? October 2005 Darrel Good 2005 No. 8 Summary USDA reports provided two fundamental surprises for the market over the past three weeks. First, the September
Iowa Farm Outlook. Higher Production Trims Livestock Prices, Cash Receipts. May 2017 Ames, Iowa Econ. Info. 2085
 Iowa Farm Outlook 0BDepartment of Economics May 2017 Ames, Iowa Econ. Info. 2085 Higher Production Trims Livestock Prices, Cash Receipts In Iowa, the livestock industry is a significant part of the state
Honey Final Estimates
 United States Department of Agriculture National Agricultural Statistics Service Honey Final Estimates 200-2012 September 201 Statistical Bulletin Number 3 Contents Honey Price by Color Class United States:
October 1, 1996 Ames, Iowa Econ. Info. 1703
 October 1, 1996 Ames, Iowa Econ. Info. 1703 PROFITABLE HOG PRICE EXPECTED THROUGH MID-1997 The USDA September Hogs & Pigs report released September 27 indicated 4 percent fewer total hogs on U.S. farms
Agricultural Prices. Special Note. May Prices Received Index Increased 1.7 Percent
 Agricultural Prices ISSN: 1937-4216 Released June 28,, by the National Agricultural Statistics Service (NASS), Agricultural Statistics Board, United States Department of Agriculture (USDA). Special Note
U.S. Drought Monitor, August 28, 2012
 University of Nebraska - Lincoln DigitalCommons@University of Nebraska - Lincoln US Ag in Drought Archive Drought -- National Drought Mitigation Center 8-28-2 U.S. Drought Monitor, August 28, 2 Brian Fuchs
U.S. Drought Monitor, September 4, 2012
 University of Nebraska - Lincoln DigitalCommons@University of Nebraska - Lincoln US Ag in Drought Archive Drought -- National Drought Mitigation Center 9--12 U.S. Drought Monitor, September, 12 Brian Fuchs
Latest World Supply and Demand Estimates Report
 Louisiana Cattle Market Update Friday, June 10 th, 2011 Ross Pruitt, Department of Agricultural Economics and Agribusiness Louisiana State University AgCenter Latest World Supply and Demand Estimates Report
Food Price Outlook,
 Provided By: Food Price Outlook, 2017-18 This page provides the following information for August 2017: Consumer Price Index (CPI) for Food (not seasonally adjusted) Producer Price Index (PPI) for Food
CERESSYS ASSESSMENT OF THE ECONOMIC CONTRIBUTION OF AGRICULTURAL AND AGRI-FOOD EXPORTS TO THE CANADIAN ECONOMY.
 CERESSYS ASSESSMENT OF THE ECONOMIC CONTRIBUTION OF AGRICULTURAL AND AGRI-FOOD EXPORTS TO THE CANADIAN ECONOMY. Bertrand Montel, PhD for the Canadian Agri-Food Trade Alliance July 2016 Bertrand Montel
On the Fed-Beef Production/Distribution System. Clemson Agricultural Experiment Station Technical Article No. 2422
 Effects of Changing Economic Relationships On the Fed-Beef Production/Distribution System Clemson Agricultural Experiment Station Technical Article No. 2422 by Gregory M. Clary, Assistant Professor Dept.
U.S. Drought Monitor, July 31, 2012
 University of Nebraska - Lincoln DigitalCommons@University of Nebraska - Lincoln US Ag in Drought Archive Drought -- National Drought Mitigation Center -3-2 U.S. Drought Monitor, July 3, 2 Mark D. Svoboda
Food Manufacturing Research for Grand Erie
 Food Research for Grand Erie Research conducted by Paul Knafelc, Community Benchmarks Inc. on behalf of the Workforce Planning Board of Grand Erie, 2012 1 Brant County Table 1 Food (NAICS 311) Economic
TIMELY INFORMATION Agriculture & Natural Resources
 AG ECONOMIC SERIES TIMELY INFORMATION Agriculture & Natural Resources DAERS 2010 4 September 2010 U. S. Beef Cattle Situation and Price Outlook Walt Prevatt, Ph.D. Extension Economist and Professor Auburn
Less Obvious Market Impacts of the Zilmax Situation
 Louisiana Cattle Market Update Friday, August 23 rd, 2013 Ross Pruitt, Department of Agricultural Economics and Agribusiness LSU AgCenter Less Obvious Market Impacts of the Zilmax Situation What can be
Agricultural Prices. May Farm Prices Received Index Declined 2 Points
 Agricultural Prices ISSN: 1937-4216 Released 31,, by the National Agricultural Statistics Service (NASS), Agricultural Statistics Board, United States Department of Agriculture (USDA). Farm Prices Received
ECONOMIC. Impact of Arkansas Agriculture
 ECONOMIC Impact of Arkansas Agriculture 2010 Contents Total Impact... 4 Arkansas Counts on Agriculture... 8 The Natural State... 10 Crops Sector... 14 Strength in Diversity... 16 Animal Agriculture Sector...
Grain Stocks. Corn Stocks Up 32 Percent from September 2016 Soybean Stocks Up 53 Percent All Wheat Stocks Down 11 Percent
 Grain Stocks ISSN: 949-095 Released September 9, 07, by the National Agricultural Statistics Service (NASS), Agricultural Statistics Board, United s Department of Agriculture (USDA). Corn Stocks Up 3 Percent
Agricultural Prices. April Prices Received Index Decreased 2.2 Percent
 Agricultural Prices ISSN: 1937-4216 Released May 30,, by the National Agricultural Statistics Service (NASS), Agricultural Statistics Board, United States Department of Agriculture (USDA). Prices Received
U.S. Drought Monitor, October 2, 2012
 University of Nebraska - Lincoln DigitalCommons@University of Nebraska - Lincoln US Ag in Drought Archive Drought -- National Drought Mitigation Center -2-12 U.S. Drought Monitor, October 2, 12 Anthony
Grain Prices Remain Sensitive to Weather, Export Developments
 July 16, 2002 Ames, Iowa Econ. Info. 1842 Grain Prices Remain Sensitive to Weather, Export Developments Correction for the July 1 Iowa Farm Outlook In the section titled Possible Future Acreage Revisions,
CORN: SMALLER SUPPLIES ON THE HORIZON. April 2001 Darrel Good No. 3
 CORN: SMALLER SUPPLIES ON THE HORIZON April 2001 Darrel Good 2001- No. 3 Summary The USDA s March Grain Stocks and Prospective Plantings report released on March 30 provided some fundamentally supportive
Proceedings, The Range Beef Cow Symposium XX December 11, 12 and 13, 2007 Fort Collins, Colorado
 Proceedings, The Range Beef Cow Symposium XX December 11, 12 and 13, 2007 Fort Collins, Colorado The Impacts of the U.S. Corn/Ethanol Policy on the U.S. Cattle Industry Andrew Gottschalk Sr Vice-President,
agriculture, forestry & fisheries Department: Agriculture, Forestry and Fisheries REPUBLIC OF SOUTH AFRICA
 2014 agriculture, forestry & fisheries Department: Agriculture, Forestry and Fisheries REPUBLIC OF SOUTH AFRICA Economic Review of the South African Agriculture 2014 DEPARTMENT OF AGRICULTURE, FORESTRY
SOYBEANS: LARGE U.S. CROP, WHAT ABOUT SOUTH AMERICA?
 SOYBEANS: LARGE U.S. CROP, WHAT ABOUT SOUTH AMERICA? OCTOBER 2004 Darrel Good 2004 B NO. 8 Summary The USDA now forecasts the 2004 U.S. soybean crop at 3.107 billion bushels, 271 million larger than the
A REFERENCE GUIDE TO SOYBEAN FACTS AND FIGURES
 A REFERENCE GUIDE TO SOYBEAN FACTS AND FIGURES A publication of the American Soybean Association 1 S YSTATS 218 A publication of the American Soybean Association Welcome to the 218 edition of SoyStats,
Potatoes Summary. September United States Department of Agriculture. National Agricultural Statistics Service.
 United States Department of Agriculture National Agricultural Statistics Service Potatoes 00 Summary September 00 Pot 6 (0) Contents Page Introduction... Comments... Utilization, U. S., 99-00... 4 Area,
Proceedings, The Range Beef Cow Symposium XX December 11, 12 and 13, 2007 Fort Collins, Colorado
 Proceedings, The Range Beef Cow Symposium XX December 11, 12 and 13, 2007 Fort Collins, Colorado The Impacts of the U.S. Corn/Ethanol Policy on the U.S. Cattle Industry Andrew Gottschalk Sr Vice President,
The Iowa Pork Industry 2008: Patterns and Economic Importance by Daniel Otto and John Lawrence 1
 The Iowa Pork Industry 2008: Patterns and Economic Importance by Daniel Otto and John Lawrence 1 Introduction The Iowa pork industry represents a significant value-added activity in the agricultural economy
Prices Received, Prices Paid, and Ratio of Prices Received to Prices Paid Indexes 2011 Base United States: February 2019 with Comparisons
 Agricultural Prices ISSN: 1937-4216 Released March 28,, by the National Agricultural Statistics Service (NASS), Agricultural Statistics Board, United States Department of Agriculture (USDA). Special Note
Contribution of Agriculture to Oklahoma s Economy: 2015
 Contribution of Agriculture to Oklahoma s Economy: 2015 E-1046 Department of Agricultural Economics Division of Agricultural Sciences and Natural Resources Oklahoma State University Dave Shideler, Ph.D.