The Value of Improving the Performance of your Cow-Calf Operation
|
|
|
- Margery Bernice Robertson
- 6 years ago
- Views:
Transcription


1 The Value of Improving the Performance of your Cow-Calf Operation Chris Prevatt Livestock and Forage Economist UF Range Cattle Research and Education Center
2 NW Florida Beef Conference The Last Five Years in the Cow-Calf Industry 2015 Cattle Market 2015 Feeder Calf Market Prices 2015 Projected Average Florida Feeder Calf Price Where Cow-Calf Profitability may be in 2015? The Value of making improvements to your cowherd
3 What will happen in 2015?

4 What will happen in 2015?
5 $/cwt. $ $ $ $ $ $ $ $ $ $ $ January December 2014 U.S. Weekly Average 550 lb. Feeder Steers Chris Prevatt, UF/IFAS Range Cattle Research & Education Center
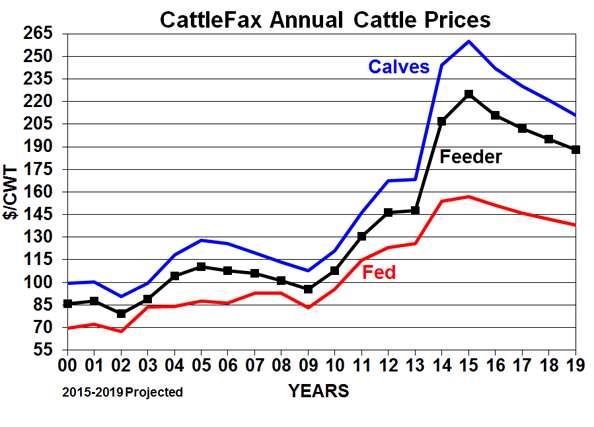
6 US 550 lb. Feeder Steer Prices US 550 lb. Feeder Steers January 2010: $103.78/cwt. $571/hd. December 2014: $289.41/cwt. $1,592/hd. % Change: % $/cwt. Change: $185.63/cwt. $/hd. Change: $1,021/hd.
7 US 550 lb. Feeder Steer Prices US 550 lb. Feeder Steers May 2013: $152.15/cwt. $836/hd. December 2014: $289.41/cwt. $1,592/hd. % Change: 90.21% $/cwt. Change: $137.26/cwt. $/hd. Change: $756/hd. The price of 550 lb. Feeder Steers moved to NEW record highs on a monthly basis for 19 months in a row.
8 What will happen in 2015? 2015 Price Expectations, CattleFax 550 lb. Steers, U.S. Avg. $ lb. Steers, U.S. Avg. $ lb. Steers, U.S. Avg. $157
9 Figure 1. August 2015 Feeder Cattle Futures Prices (CME) $/cwt. $240 3-Year Average $230 $220 $210 $200 $190 $180 $170 $160 $150 1-Sep 1-Oct 1-Nov 1-Dec 1-Jan 1-Feb 1-Mar 1-Apr 1-May 1-Jun 1-Jul 1-Aug
10 30-Aug 6-Sep 13-Sep 20-Sep 27-Sep 4-Oct 11-Oct 18-Oct 25-Oct 1-Nov 8-Nov 15-Nov 22-Nov 29-Nov 6-Dec 13-Dec 20-Dec 27-Dec 3-Jan 10-Jan 17-Jan 24-Jan 31-Jan 7-Feb $/cwt. $ August Feeder Cattle Futures Contract $ $ $ $ $ $ $ $200.00
11 Feeder Cattle Futures Prices 2015 Cattle Futures Prices Contract Months Feeder Cattle Live Cattle January February $ March $ April $ $ May $ June $ July August $ $ September $ October $ $ November $ December $ Avg Price $ $ CME Feeder Cattle Futures Prices as of 02/10/2015.
12 Feeder Cattle Futures Prices 2015 Feeder Cattle Futures Month $/cwt. $/hd. $/truckload January $0.00 $0.00 $0.00 February March $ $1, $101, April $ $1, $100, May $ $1, $100, June July August $ $1, $102, September $ $1, $101, October $ $1, $101, November $ $1, $100, December Avg Price $ $1, $101, CME Feeder Cattle Futures Prices as of 02/10/2015.

13 2015 Projected Average Florida Feeder Calf Prices Assumes blended price for Steers and Heifers. Feeders are Medium-Large Frame and Muscle Scores #1-2. Based on 2015 Feeder Cattle Futures Market Prices.
14 2015 Projected Average Florida Feeder Calf Prices* Avg. Calf Wt. (lbs.) Avg. Price $/cwt. Feeder Calves Avg. Price $/lb. Market Price $/hd. 300 $ $3.21 $ $ $2.92 $1, $ $2.63 $1, $ $2.44 $1, $ $2.26 $1, $ $2.10 $1, $ $1.98 $1, *Calf prices reflect Medium-Large Frame #1 & #2 Muscle Score Calves. Projected prices are based on CME Feeder Cattle Futures Prices as of 02/10/2015. The projected prices are subject to change as new data becomes available.
15 $/lb. $3.30 $3.10 $2.90 $2.70 $2.50 $3.21 Projected 2015 Average Florida Feeder Calf Prices* Dollars Per Pound $2.92 $2.63 $2.44 $2.30 $2.10 $2.26 $2.10 $1.98 $ Pounds Per Calf *The Projected 2015 Average Florida Feeder Calf Prices are blended prices for steers and heifers of medium-large frame and #1-#2 muscle score calves. Projected prices are based on CME Feeder Cattle future prices as of 02/10/2015.
16 $/lb. $3.50 $3.30 $3.10 $2.90 $2.70 $2.50 $2.30 $2.10 $1.90 $3.21 $962 Projected 2015 Average Florida Feeder Calf Prices* $2.92 $1,023 Dollars Per Pound $2.63 $1,053 $1,097 $2.44 Dollars Per Head $1,129 $2.26 $1,152 $2.10 $1, Pounds Per Calf $1.98 *The Projected 2015 Average Florida Feeder Calf Prices are blended prices for steers and heifers of medium-large frame and #1-#2 muscle score calves. Projected prices are based on CME Feeder Cattle future prices as of 02/10/2015. $/hd. $1,200 $1,175 $1,150 $1,125 $1,100 $1,075 $1,050 $1,025 $1,000 $975 $950
17 Cow-Calf Profits

18 What Factors Affect Cow-Calf Profitability?
19 Factors Affecting the Profitability of Cow-Calf Producers Marketing Genetics Breeding Season Calving Season Herd Health Program Calf Management Practices Cow Management Practices Bull Management Practices Performance - ADG Weaning Weights Corn Prices Fuel Prices Fertilizer Prices Feed Prices Land Management Forage Types Clovers, Legumes Grass Varieties Grazing Methods Size of Paddocks Level of Fertilization Soil Type, Soil PH Stocking Rate Level of Supplementation LEVEL OF MANAGEMENT Environmental Regulations Machinery and Equipment Buildings and Improvements Depreciation and Repairs Taxes and Insurance Interest Rates Labor Weather Death Loss Pregnancy Rate Calving Rate Weaning Rate Cost of Production Government Regulations EVERYTHING THAT GOES INTO A COW-CALF ENTERPRISE AFFECTS PROFITABILITY.
20 Understanding Profitability in Cow-Calf Enterprises Profitability can be projected using six quantitative factors from the cow-calf enterprise. Profitability varies widely among cow-calf producers due to differing levels of management ability, production systems, inputs, and resources.
21 FOUNDATIONS OF PROFITABILITY What do I need to calculate cow-calf profitability? Six Quantitative Factors
22 FOUNDATIONS OF PROFITABILITY What do I need to calculate cow-calf profitability? Six Quantitative Factors Total Number of Brood Cows & Replacement Heifers
23 FOUNDATIONS OF PROFITABILITY What do I need to calculate cow-calf profitability? Six Quantitative Factors Total Number of Brood Cows & Replacement Heifers Total Cow-Calf Production Costs, $/year
24 FOUNDATIONS OF PROFITABILITY What do I need to calculate cow-calf profitability? Six Quantitative Factors Total Number of Brood Cows & Replacement Heifers Total Cow-Calf Production Costs, $/year Total Cull Animal Revenue, $/year
25 FOUNDATIONS OF PROFITABILITY What do I need to calculate cow-calf profitability? Six Quantitative Factors Total Number of Brood Cows & Replacement Heifers Total Cow-Calf Production Costs, $/year Total Cull Animal Revenue, $/year Average Weaning Weight, lbs./calf
26 FOUNDATIONS OF PROFITABILITY What do I need to calculate cow-calf profitability? Six Quantitative Factors Total Number of Brood Cows & Replacement Heifers Total Cow-Calf Production Costs, $/year Total Cull Animal Revenue, $/year Average Weaning Weight, lbs./calf Weaning Percent, %
27 FOUNDATIONS OF PROFITABILITY What do I need to calculate cow-calf profitability? Six Quantitative Factors Total Number of Brood Cows & Replacement Heifers Total Cow-Calf Production Costs, $/year Total Cull Animal Revenue, $/year Average Weaning Weight, lbs./calf Weaning Percent, % Market Prices, $/lb.
28 FOUNDATIONS OF PROFITABILITY What do I need to calculate cow-calf profitability? Six Quantitative Factors Total Number of Brood Cows & Replacement Heifers Total Cow-Calf Production Costs, $/year Total Cull Animal Revenue, $/year Average Weaning Weight, lbs./calf Weaning Percent, % Market Prices, $/lb.

29 Foundations of Profitability Let s work thru an example to better understand 2015 projected cow-calf profitability.
30 Projecting 2015 Cow-Calf Profitability Commercial Cow-Calf Perspective There s lots of ways we could extend this example. Backgrounding Preconditioning Retained Ownership Carcass Quality But, to keep it simple we will market these calves at weaning time.
31 Table 4. Estimated 2015 Profit/Loss Per Cow for various weaning weights, weaning percentages, and calf production costs per brood cow. Weaning Weaning Calf Production Calf Production Costs Per Brood Cow** 2015 Projected Weight Percent Per Brood Cow Avg. FL Price* lbs. % lbs./cow $/lb. Estimated Profit/Loss Per Brood Cow, $/hd.
32 2015 Projected Average Florida Feeder Calf Prices* Avg. Calf Wt. (lbs.) Avg. Price $/cwt. Feeder Calves Avg. Price $/lb. Market Price $/hd. 300 $ $3.21 $ $ $2.92 $1, $ $2.63 $1, $ $2.44 $1, $ $2.26 $1, $ $2.10 $1, $ $1.98 $1, *Calf prices reflect Medium-Large Frame #1 & #2 Muscle Score Calves. Projected prices are based on CME Feeder Cattle Futures Prices as of 02/10/2015. The projected prices are subject to change as new data becomes available.
33 Table 4. Estimated 2015 Profit/Loss Per Cow for various weaning weights, weaning percentages, and calf production costs per brood cow Projected Avg. FL Price* $/lb. $1.98 $2.10 $2.26 $2.44 $2.63 $2.92 $3.21 $1.98 $2.10 $2.26 $2.44 $2.63 $2.92 $3.21
34 Weaning Weight We re selling Pounds Our Output is Pounds of Calves. Cattle Producers generate most of their revenue based on the total pounds of calves sold. The average weight of calves at weaning can be impacted by several factors: Age of Calf Calving Season Forage Conditions (Nutrition) Milking Ability of the Cow Herd Genetics (med./lg.,#1, #2) Calf Management Practices Castrate, Implant, Deworming, Vaccinations, Fly Control, etc. Weather (Drought, Floods, Extreme Temperatures)
35 Table 4. Estimated 2015 Profit/Loss Per Cow for various weaning weights, weaning percentages, and calf production costs per brood cow. Weaning 2015 Projected Weight Avg. FL Price* lbs. $/lb. 600 $ $ $ $ $ $ $ $ $ $ $ $ $ $3.21
36 Weaning Percent Calf Crop = Weaning Percentage Percent of Exposed Females that Wean a Calf Reproductive efficiency is a good measure of our herds overall management and health status.
37 Table 4. Estimated 2015 Profit/Loss Per Cow for various weaning weights, weaning percentages, and calf production costs per brood cow. Weaning Weaning 2015 Projected Weight Percent Avg. FL Price* lbs. % $/lb % $ % $ % $ % $ % $ % $ % $ % $ % $ % $ % $ % $ % $ % $3.21
38 lbs. of Calf Production Per Brood Cow Pounds of Calf Weaned Per Cow Exposed Average Weaning Weight x Weaning Percent Combines the relative reproductive and growth performance of a cow herd Two Ways to Increase the Total Pounds of Calf Weaned 1) Increase the pounds of each calf weaned 2) Increase the number of calves weaned
39 Table 4. Estimated 2015 Profit/Loss Per Cow for various weaning weights, weaning percentages, and calf production costs per brood cow. Weaning Weaning Calf Production 2015 Projected Weight Percent Per Brood Cow Avg. FL Price* lbs. % lbs./cow $/lb % 540 $ % 495 $ % 450 $ % 405 $ % 360 $ % 315 $ % 270 $ % 510 $ % 468 $ % 425 $ % 383 $ % 340 $ % 298 $ % 255 $3.21
40 Feeder Calf Revenue Feeder Calf Revenue is the easiest thing we can calculate.
41 Table 1. Projected 2015 Calf Revenue for various weaning weights and weaning percentages. Weaning Weight Weaning Percent Calf Production Per Brood Cow Projected Revenue Per Calf Projected Calf Revenue Per Brood Cow 2015 Projected Avg. FL Price* lbs. % lbs./cow $/hd. $/hd. $/lb % 540 $1,186 $1,068 $ % 495 $1,152 $1,037 $ % 450 $1,129 $1,016 $ % 405 $1,097 $987 $ % 360 $1,053 $948 $ % 315 $1,023 $921 $ % 270 $962 $866 $ % 510 $1,186 $1,008 $ % 468 $1,152 $979 $ % 425 $1,129 $960 $ % 383 $1,097 $933 $ % 340 $1,053 $895 $ % 298 $1,023 $870 $ % 255 $962 $818 $3.21
42 Table 2. Projected 2015 Total Calf Revenue for various weaning weights and weaning percentages, 100 hd. Weaning Weight Weaning Percent Calf Production Per Brood Cow Projected Calf Revenue Projected Calf Revenue, Adj. for WP 2015 Projected Avg. FL Price* lbs. % lbs./cow Total Dollars, $ Total Dollars, $ $/lb % 540 $118,630 $106,767 $ % 495 $115,226 $103,704 $ % 450 $112,929 $101,637 $ % 405 $109,707 $98,736 $ % 360 $105,316 $94,784 $ % 315 $102,324 $92,092 $ % 270 $96,184 $86,566 $ % 510 $118,630 $100,836 $ % 468 $115,226 $97,943 $ % 425 $112,929 $95,990 $ % 383 $109,707 $93,251 $ % 340 $105,316 $89,519 $ % 298 $102,324 $86,976 $ % 255 $96,184 $81,756 $3.21
43 Calf Production Costs Per Brood Cow Calf production costs per brood cow is calculated as total cow-calf production costs less cull animal revenue divided by the total number of brood cows exposed. Beware! As market prices increase, the production costs to carry a cow increases. Feed and pasture costs are the largest expenses most cow-calf producers incur to produce a calf. In most studies of cow-calf operations feed and pasture costs range from 50% to 60% of the total costs to carry a cow.
44 Table 4. Estimated 2015 Profit/Loss Per Cow for various weaning weights, weaning percentages, and calf production costs per brood cow. Weaning Weaning Calf Production Calf Production Costs Per Brood Cow** 2015 Projected Weight Percent Per Brood Cow $1,100 $1,000 $900 $800 $700 $600 $500 Avg. FL Price* lbs. % lbs./cow $/lb % 540 $ % 495 $ % 450 $ % 405 $ % 360 $ % 315 $ % 270 $ % 510 $ % 468 $ % 425 $ % 383 $ % 340 $ % 298 $ % 255 $3.21
45 Breakeven Feeder Calf Price By calculating breakeven feeder calf prices we can determine what it cost to produce a pound of calf production. We can use the breakeven price to guide us when making production and marketing decisions.
46 Table 3. Projected 2015 breakeven feeder calf prices for various weaning weights, weaning percentages, and calf production costs per brood cow. Weaning Weight Weaning Percent Calf Production Per Brood Cow Calf Production Costs Per Brood Cow** $1,100 $1,000 $900 $800 $700 $600 $500 lbs. % lbs./cow Breakeven Feeder Calf Price, $/lb.*** % 540 $2.04 $1.85 $1.67 $1.48 $1.30 $1.11 $ % 495 $2.22 $2.02 $1.82 $1.62 $1.41 $1.21 $ % 450 $2.44 $2.22 $2.00 $1.78 $1.56 $1.33 $ % 405 $2.72 $2.47 $2.22 $1.98 $1.73 $1.48 $ % 360 $3.06 $2.78 $2.50 $2.22 $1.94 $1.67 $ % 315 $3.49 $3.17 $2.86 $2.54 $2.22 $1.90 $ % 270 $4.07 $3.70 $3.33 $2.96 $2.59 $2.22 $ % 510 $2.16 $1.96 $1.76 $1.57 $1.37 $1.18 $ % 468 $2.35 $2.14 $1.93 $1.71 $1.50 $1.28 $ % 425 $2.59 $2.35 $2.12 $1.88 $1.65 $1.41 $ % 383 $2.88 $2.61 $2.35 $2.09 $1.83 $1.57 $ % 340 $3.24 $2.94 $2.65 $2.35 $2.06 $1.76 $ % 298 $3.70 $3.36 $3.03 $2.69 $2.35 $2.02 $ % 255 $4.31 $3.92 $3.53 $3.14 $2.75 $2.35 $1.96
47 Table 3. Projected 2015 breakeven feeder calf prices for various weaning weights, weaning percentages, and calf production costs per brood cow. Weaning Weight Weaning Percent Calf Production Per Brood Cow Calf Production Costs Per Brood Cow** $1,100 $1,000 $900 $800 $700 $600 $500 Breakeven Feeder Calf Price, $/lb.*** 2015 Projected Avg. FL Price* lbs. % lbs./cow $/lb % 540 $2.04 $1.85 $1.67 $1.48 $1.30 $1.11 $0.93 $ % 495 $2.22 $2.02 $1.82 $1.62 $1.41 $1.21 $1.01 $ % 450 $2.44 $2.22 $2.00 $1.78 $1.56 $1.33 $1.11 $ % 405 $2.72 $2.47 $2.22 $1.98 $1.73 $1.48 $1.23 $ % 360 $3.06 $2.78 $2.50 $2.22 $1.94 $1.67 $1.39 $ % 315 $3.49 $3.17 $2.86 $2.54 $2.22 $1.90 $1.59 $ % 270 $4.07 $3.70 $3.33 $2.96 $2.59 $2.22 $1.85 $ % 510 $2.16 $1.96 $1.76 $1.57 $1.37 $1.18 $0.98 $ % 468 $2.35 $2.14 $1.93 $1.71 $1.50 $1.28 $1.07 $ % 425 $2.59 $2.35 $2.12 $1.88 $1.65 $1.41 $1.18 $ % 383 $2.88 $2.61 $2.35 $2.09 $1.83 $1.57 $1.31 $ % 340 $3.24 $2.94 $2.65 $2.35 $2.06 $1.76 $1.47 $ % 298 $3.70 $3.36 $3.03 $2.69 $2.35 $2.02 $1.68 $ % 255 $4.31 $3.92 $3.53 $3.14 $2.75 $2.35 $1.96 $3.21
48 Estimated Profit/Loss Per Cow, $/hd. The cells with black numbers are profitable levels of beef production expressed in dollars per head. The cells with red numbers are losses per head.
49 Table 4. Estimated 2015 Profit/Loss Per Cow for various weaning weights, weaning percentages, and calf production costs per brood cow. Weaning Weaning Calf Production Calf Production Costs Per Brood Cow** 2015 Projected Weight Percent Per Brood Cow $1,100 $1,000 $900 $800 $700 $600 $500 Avg. FL Price* lbs. % lbs./cow $/lb % 540 ($32) $68 $168 $268 $368 $468 $568 $ % 495 ($63) $37 $137 $237 $337 $437 $537 $ % 450 ($84) $16 $116 $216 $316 $416 $516 $ % 405 ($113) ($13) $87 $187 $287 $387 $487 $ % 360 ($152) ($52) $48 $148 $248 $348 $448 $ % 315 ($179) ($79) $21 $121 $221 $321 $421 $ % 270 ($234) ($134) ($34) $66 $166 $266 $366 $ % 510 ($92) $8 $108 $208 $308 $408 $508 $ % 468 ($121) ($21) $79 $179 $279 $379 $479 $ % 425 ($140) ($40) $60 $160 $260 $360 $460 $ % 383 ($167) ($67) $33 $133 $233 $333 $433 $ % 340 ($205) ($105) ($5) $95 $195 $295 $395 $ % 298 ($230) ($130) ($30) $70 $170 $270 $370 $ % 255 ($282) ($182) ($82) $18 $118 $218 $318 $3.21
50 Table 4. Estimated 2015 Profit/Loss Per Cow for various weaning weights, weaning percentages, and calf production costs per brood cow. Weaning Weaning Calf Production Calf Production Costs Per Brood Cow** 2015 Projected Weight Percent Per Brood Cow $1,100 $1,000 $900 $800 $700 $600 $500 Avg. FL Price* lbs. % lbs./cow $/lb % 540 $68 $168 $268 $368 $468 $568 $ % 495 $37 $137 $237 $337 $437 $537 $ % 450 $16 $116 $216 $316 $416 $516 $ % 405 $87 $187 $287 $387 $487 $ % 360 $48 $148 $248 $348 $448 $ % 315 $21 $121 $221 $321 $421 $ % 270 $66 $166 $266 $366 $ % 510 $8 $108 $208 $308 $408 $508 $ % 468 $79 $179 $279 $379 $479 $ % 425 $60 $160 $260 $360 $460 $ % 383 $33 $133 $233 $333 $433 $ % 340 $95 $195 $295 $395 $ % 298 $70 $170 $270 $370 $ % 255 $18 $118 $218 $318 $3.21
51 Estimated Profit/Loss Per 100 hd. Estimated Profit/Loss Per Cow, $/hd. * 100 hd.
52 Table 5. Estimated 2015 Total Profit/Loss for various weaning weights, weaning percentages, and calf production costs per brood cow, 100 hd. Weaning Weaning Calf Production Calf Production Costs Per Brood Cow** 2015 Projected Weight Percent Per Brood Cow $1,100 $1,000 $900 $800 $700 $600 $500 Avg. FL Price* lbs. % lbs./cow $/lb % 540 ($3,233) $6,767 $16,767 $26,767 $36,767 $46,767 $56,767 $ % 495 ($6,296) $3,704 $13,704 $23,704 $33,704 $43,704 $53,704 $ % 450 ($8,364) $1,636 $11,636 $21,636 $31,636 $41,636 $51,636 $ % 405 ($11,264) ($1,264) $8,736 $18,736 $28,736 $38,736 $48,736 $ % 360 ($15,216) ($5,216) $4,784 $14,784 $24,784 $34,784 $44,784 $ % 315 ($17,908) ($7,908) $2,092 $12,092 $22,092 $32,092 $42,092 $ % 270 ($23,435) ($13,435) ($3,435) $6,565 $16,565 $26,565 $36,565 $ % 510 ($9,164) $836 $10,836 $20,836 $30,836 $40,836 $50,836 $ % 468 ($12,058) ($2,058) $7,942 $17,942 $27,942 $37,942 $47,942 $ % 425 ($14,010) ($4,010) $5,990 $15,990 $25,990 $35,990 $45,990 $ % 383 ($16,750) ($6,750) $3,250 $13,250 $23,250 $33,250 $43,250 $ % 340 ($20,481) ($10,481) ($481) $9,519 $19,519 $29,519 $39,519 $ % 298 ($23,025) ($13,025) ($3,025) $6,975 $16,975 $26,975 $36,975 $ % 255 ($28,244) ($18,244) ($8,244) $1,756 $11,756 $21,756 $31,756 $3.21
53 Table 5. Estimated 2015 Total Profit/Loss for various weaning weights, weaning percentages, and calf production costs per brood cow, 100 hd. Weaning Weaning Calf Production Calf Production Costs Per Brood Cow** 2015 Projected Weight Percent Per Brood Cow $1,100 $1,000 $900 $800 $700 $600 $500 Avg. FL Price* lbs. % lbs./cow $/lb % 540 $6,767 $16,767 $26,767 $36,767 $46,767 $56,767 $ % 495 $3,704 $13,704 $23,704 $33,704 $43,704 $53,704 $ % 450 $1,636 $11,636 $21,636 $31,636 $41,636 $51,636 $ % 405 $8,736 $18,736 $28,736 $38,736 $48,736 $ % 360 $4,784 $14,784 $24,784 $34,784 $44,784 $ % 315 $2,092 $12,092 $22,092 $32,092 $42,092 $ % 270 $6,565 $16,565 $26,565 $36,565 $ % 510 $836 $10,836 $20,836 $30,836 $40,836 $50,836 $ % 468 $7,942 $17,942 $27,942 $37,942 $47,942 $ % 425 $5,990 $15,990 $25,990 $35,990 $45,990 $ % 383 $3,250 $13,250 $23,250 $33,250 $43,250 $ % 340 $9,519 $19,519 $29,519 $39,519 $ % 298 $6,975 $16,975 $26,975 $36,975 $ % 255 $1,756 $11,756 $21,756 $31,756 $3.21
54 Sensitivity Analysis A useful exercise for managers is to evaluate the impact that a percentage change in gross revenue and/or calf production costs will have on cow-calf profitability.
55 Is it possible for you to increase the revenue you receive and/or reduce the costs of your cow-calf operation? Can you change revenues and/or costs by: 1 or 2 percent? 5 or 10 percent? More than 10 percent?
56 Table 6. Sensitivity Analysis of 2015 Gross Revenue and Calf Production Costs Percent Change in Total Gross Revenue -2% -1% 0% 1% 2% Estimated Profit/Loss Per Brood Cow Percent Change in Calf Production Costs -2% $235 $245 $255 $265 $275-1% $228 $238 $248 $257 $267 0% $220 $230 $240 $250 $260 1% $213 $223 $233 $242 $252 2% $205 $215 $225 $235 $245 *Assumptions: 100 Number of cows, hd. $92,654 Total Cow-Calf Production Costs, $ 80% Weaning Percent, % $17,654 Total Cull Cow Revenue, $ 550 Weaning Weight, lbs. $ Total Cull Cow Revenue Per Brood Cow, $/hd. 440 Pounds of Calf Production Per Brood Cow, lbs. $75,000 Total Calf Production Costs, $ 44,000 Total lbs. of Feeder Calves $ Calf Production Costs Per Brood Cow, $/hd. $2.25 Average Calf Market Price, $/lb. $1.70 Breakeven Price, $/lb. $99,000 Total Calf Revenue, $
57 Table 6. Sensitivity Analysis of 2015 Gross Revenue and Calf Production Costs Percent Change in Total Gross Revenue -2% -1% 0% 1% 2% Estimated Profit/Loss Per Brood Cow Percent Change in Calf Production Costs -2% ($5) $5 $15 $25 $35-1% ($12) ($2) $8 $17 $27 0% ($20) ($10) $240 $10 $20 1% ($27) ($17) ($8) $2 $12 2% ($35) ($25) ($15) ($5) $5
58 Table 7. Sensitivity Analysis of 2015 Gross Revenue and Calf Production Costs, 100 hd. Percent Change in Total Gross Revenue -2% -1% 0% 1% 2% Estimated Total Ranch Profit/Loss Percent Change in Calf Production Costs -2% $23,520 $24,510 $25,500 $26,490 $27,480-1% $22,770 $23,760 $24,750 $25,740 $26,730 0% $22,020 $23,010 $24,000 $24,990 $25,980 1% $21,270 $22,260 $23,250 $24,240 $25,230 2% $20,520 $21,510 $22,500 $23,490 $24,480 *Assumptions: 100 Number of cows, hd. $92,654 Total Cow-Calf Production Costs, $ 80% Weaning Percent, % $17,654 Total Cull Cow Revenue, $ 550 Weaning Weight, lbs. $ Total Cull Cow Revenue Per Brood Cow, $/hd. 440 Pounds of Calf Production Per Brood Cow, lbs. $75,000 Total Calf Production Costs, $ 44,000 Total lbs. of Feeder Calves $ Calf Production Costs Per Brood Cow, $/hd. $2.25 Average Calf Market Price, $/lb. $1.70 Breakeven Price, $/lb. $99,000 Total Calf Revenue, $
59 Table 7. Sensitivity Analysis of 2015 Gross Revenue and Calf Production Costs, 100 hd. Percent Change in Total Gross Revenue -2% -1% 0% 1% 2% Estimated Total Ranch Profit/Loss Percent Change in Calf Production Costs -2% ($480) $510 $1,500 $2,490 $3,480-1% ($1,230) ($240) $750 $1,740 $2,730 0% ($1,980) ($990) $24,000 $990 $1,980 1% ($2,730) ($1,740) ($750) $240 $1,230 2% ($3,480) ($2,490) ($1,500) ($510) $480
60 Table 6. Sensitivity Analysis of 2015 Gross Revenue and Calf Production Costs Percent Change in Total Gross Revenue -10% -5% 0% 5% 10% Estimated Profit/Loss Per Brood Cow Percent Change in Calf Production Costs -10% $216 $266 $315 $365 $414-5% $179 $228 $278 $327 $377 0% $141 $191 $240 $290 $339 5% $104 $153 $203 $252 $302 10% $66 $116 $165 $215 $264 *Assumptions: 100 Number of cows, hd. $92,654 Total Cow-Calf Production Costs, $ 80% Weaning Percent, % $17,654 Total Cull Cow Revenue, $ 550 Weaning Weight, lbs. $ Total Cull Cow Revenue Per Brood Cow, $/hd. 440 Pounds of Calf Production Per Brood Cow, lbs. $75,000 Total Calf Production Costs, $ 44,000 Total lbs. of Feeder Calves $ Calf Production Costs Per Brood Cow, $/hd. $2.25 Average Calf Market Price, $/lb. $1.70 Breakeven Price, $/lb. $99,000 Total Calf Revenue, $
61 Table 6. Sensitivity Analysis of 2015 Gross Revenue and Calf Production Costs Percent Change in Total Gross Revenue -10% -5% 0% 5% 10% Estimated Profit/Loss Per Brood Cow Percent Change in Calf Production Costs -10% ($24) $26 $75 $125 $174-5% ($62) ($12) $38 $87 $137 0% ($99) ($50) $240 $50 $99 5% ($137) ($87) ($38) $12 $62 10% ($174) ($125) ($75) ($26) $24
62 Table 7. Sensitivity Analysis of 2015 Gross Revenue and Calf Production Costs, 100 hd. Percent Change in Total Gross Revenue -10% -5% 0% 5% 10% Estimated Total Ranch Profit/Loss Percent Change in Calf Production Costs -10% $21,600 $26,550 $31,500 $36,450 $41,400-5% $17,850 $22,800 $27,750 $32,700 $37,650 0% $14,100 $19,050 $24,000 $28,950 $33,900 5% $10,350 $15,300 $20,250 $25,200 $30,150 10% $6,600 $11,550 $16,500 $21,450 $26,400 *Assumptions: 100 Number of cows, hd. $92,654 Total Cow-Calf Production Costs, $ 80% Weaning Percent, % $17,654 Total Cull Cow Revenue, $ 550 Weaning Weight, lbs. $ Total Cull Cow Revenue Per Brood Cow, $/hd. 440 Pounds of Calf Production Per Brood Cow, lbs. $75,000 Total Calf Production Costs, $ 44,000 Total lbs. of Feeder Calves $ Calf Production Costs Per Brood Cow, $/hd. $2.25 Average Calf Market Price, $/lb. $1.70 Breakeven Price, $/lb. $99,000 Total Calf Revenue, $
63 Table 7. Sensitivity Analysis of 2015 Gross Revenue and Calf Production Costs, 100 hd. Percent Change in Total Gross Revenue -10% -5% 0% 5% 10% Estimated Total Ranch Profit/Loss Percent Change in Calf Production Costs -10% ($2,400) $2,550 $7,500 $12,450 $17,400-5% ($6,150) ($1,200) $3,750 $8,700 $13,650 0% ($9,900) ($4,950) $24,000 $4,950 $9,900 5% ($13,650) ($8,700) ($3,750) $1,200 $6,150 10% ($17,400) ($12,450) ($7,500) ($2,550) $2,400
64 Are we getting better? AND Are we headed in the right direction?
65 What are your 2015 Cow-Calf Economic Goals? Total Number of Brood Cows, hd. Total Production Costs, $/year Total Cull Animal Revenue, $/year Total Calf Production Costs, $/year Pregnancy Percent, % Calving Percent, % Weaning Percent, % Weaning Weight, lbs./calf Projected Average Feeder Calf Price, $/lb. Estimated Profit Per Brood Cow, $/hd. Estimated Total Ranch Profit, $/year
66 Projecting 2015 Cow-Calf Profitability Summary
67 2015 Outlook Summary Tight supplies and increasing beef demand will continue to be supportive of high cattle prices Slightly higher prices than those that were seen in High Profits ($200 to $400/hd.) Higher Cattle Prices won t necessary mean better profit potential for 2015 More Heifer Retention Bearing any major droughts Next several years should be relatively good for cattle producers if they can stay ahead of input prices.
68
69 Take Home Message We want to continue to look for ways to be more profitable. Increase our Feeder Calf Market Price Received Increase Average Weaning Weight Increase Weaning Percent Reduce or Control Total Cost of Production Our challenge here is to reduce our pasture and feed costs without affecting the body condition and future reproductive performance of our cowherd. Increase Cull Animal Revenue


70 For up to date information on: Beef cattle outlooks Marketing Production information

71 Thank you! Have a profitable 2015!
Central Texas Cow/Calf Clinic
 Central Texas Cow/Calf Clinic Market Update/Beef Cattle Economics August 18, 2011 Bill Thompson AgriLife Extension Economist San Angelo, TX http://sanangelo.tamu.edu/programs/ag_economics/index.php 1 Mil.
BEEF COW/CALF ENTERPRISE BUDGET 2016 Estimated Costs and Returns - San Luis Valley
 Estimated s and Returns - San Luis Valley PRODUCTION ASSUMPTIONS Exposed Females (Cows & Heifers) 300 Total Calves Weaned (head) 258 Cows Per Bull 25 Steers (head) 129 Cow Death Loss 3% Total Heifers (head)
Background and Assumptions
 2016 Costs and Returns Estimate. Cow-Calf Budget: 250-head Northern Idaho Summer on Private Range, Winter Feeding Necessary Ben Eborn, Jim Church and Neil Rimbey Background and Assumptions University of
Intro to Livestock Marketing Annie s Project. Tim Petry Livestock Economist 2018
 Intro to Livestock Marketing Annie s Project Tim Petry Livestock Economist www.ndsu.edu/livestockeconomics 2018 ANNIES Feb2018 Always excuses NOT to market! Marketing takes time and planning Look for excuses
Background and Assumptions
 2016 Costs and Returns Estimate. Cow-Calf Budget: 250-head, Eastern Idaho Eastern Idaho Summer on Federal, State & Private Range Winter Feeding Necessary Ben Eborn, Danielle Gunn and Steven Harrison Background
2017 Beef Cattle Market Outlook
 2017 Beef Cattle Market Outlook Chris Prevatt Livestock and Forage Economist UF/IFAS Range Cattle Research and Education Center Presented at the 2015 UF Beef Cattle Short Course Presented at the 2015 UF
GUIDE TO ASSEMBLING DATA FOR COW-CALF
 GUIDE TO ASSEMBLING DATA FOR COW-CALF SPA-38 STANDARDIZED PERFORMANCE ANALYSIS* Revised 1-25-06 DATA NEEDED Assembling necessary data for the Cow-Calf Standardized Performance Analysis (SPA) is the most
Cattle Outlook. January, 2018
 Cattle Outlook January, 2018 Cattle Outlook January 2018 In This Issue: Supply Fundamentals Demand Fundamentals Summary 2 Historical Price Reference Where are Cattle Prices Currently, And Where are they
Beef Cattle Outlook Dr. Curt Lacy Extension Economist-Livestock
 Beef Cattle Outlook Dr. Curt Lacy Extension Economist-Livestock Current Situation $ Per Cwt. 190 180 170 160 150 140 130 120 110 100 90 MED. & LRG. #1 & 2 STEER CALF PRICES 500-600 Pounds, Georgia, Weekly
Grazing Economics 101 Keys to Being a Profitable Forage Producer MODNR-SWCP Mark Kennedy and John Turner
 Grazing Economics 101 Keys to Being a Profitable Forage Producer MODNR-SWCP Mark Kennedy and John Turner Mostly stolen from Wesley Tucker University of Missouri Extension Specialist and Cow-Calf Producer
Economics Associated with Beef Cattle Ranching. Larry Forero UC Cooperative Extension April 21, 2016
 Economics Associated with Beef Cattle Ranching Larry Forero UC Cooperative Extension April 21, 2016 There are Five Facets to the Beef Cattle Industry: Cow-Calf/Seedstock Yearling/Stocker Feedlot Packer
Cattle Market Situation and Outlook
 Cattle Market Situation and Outlook Rebuilding the Cow Herd Series March 28, 2007 Falls City, TX Coordinated by: Dennis Hale-Karnes CEA Ag & Charlie Pfluger-Wilson CEA Ag Prepared and presented by: Larry
Grazing Management Different Strategies. Dr Jim Russell and Joe Sellers Iowa State University
 Grazing Management Different Strategies Dr Jim Russell and Joe Sellers Iowa State University Cattle are important Keeping land in grasses reduces erosion and improves water quality Productive, well managed
Determining Your Unit Costs of Producing A Hundred Weight of Calf
 Managing for Today s Cattle Market and Beyond Determining Your Unit Costs of Producing A Hundred Weight of Calf By Harlan Hughes North Dakota State University Unit Costs of Production Astute beef cow producers
Defining Value and Requirements in Cow Rations: What is a Calorie Worth?
 Defining Value and Requirements in Cow Rations: What is a Calorie Worth? Jason E. Sawyer and Tryon A. Wickersham Department of Animal Science Texas A&M University Texas A&M AgriLife Research College Station,
Northwest Florida Beef Conference Chris Prevatt UF/IFAS Range Cattle REC Livestock and Forage Economist
 Northwest Florida Beef Conference Chris Prevatt UF/IFAS Range Cattle REC Livestock and Forage Economist 2016 Beef Cattle Market Outlook 2016 Beef Cattle Market Outlook Outline Recap 2014 and 2015 Feeder
October 20, 1998 Ames, Iowa Econ. Info U.S., WORLD CROP ESTIMATES TIGHTEN SOYBEAN SUPPLY- DEMAND:
 October 20, 1998 Ames, Iowa Econ. Info. 1752 U.S., WORLD CROP ESTIMATES TIGHTEN SOYBEAN SUPPLY- DEMAND: USDA's domestic and world crop estimates show a less burdensome world supply-demand balance for soybeans
Cattle Situation and Outlook
 Cattle Situation and Outlook Tim Petry, Livestock Economist www.ndsu.edu/livestockeconomics Feb. 27, 2018 Outlook_2-7-2018.pptx ? WASDE U.S. Meat Production and Prices 2014 2015 Change from 2014 2016 Change
Cattle Situation and Outlook
 Cattle Situation and Outlook Midwest/Great Plains/Western Outlook Conference August 2010 Tim Petry Livestock Economist www.ag.ndsu.edu/livestockeconomics mwgpw.ppt 8/12/10 TO ALL OUTLOOK CONFERENCE ATTENDEES
Livestock Enterprise. Budgets for Iowa 2017 File B1-21. Ag Decision Maker
 Livestock Enterprise Ag Decision Maker Budgets for Iowa 2017 File B1-21 This publication contains estimates of production costs for common livestock enterprises in Iowa. Estimates are intended to reflect
Canfax Research Services A Division of the Canadian Cattlemen s Association
 Canfax Research Services A Division of the Canadian Cattlemen s Association Publication Sponsored By: Focus on Productivity COW/CALF PRODUCTIVITY The feedlot and packing sectors have been very successful
Margin = Difference. Navigating Through Financials- Careful Where you Step! Stepping Forward. Revenue $$$ less expenses $$$ Improving Margins
 Navigating Through Financials- Careful Where you Step! Margin = Difference Revenue $$$ less expenses $$$ Improving Margins Revenue Expense Both 1 2014 Margins Improved 2014 Margin Example Improved Margins
Managing For Today s Cattle Market And Beyond: A Comparative Analysis Of ND - Demo Cow Herd To North Dakota Database
 Managing For Today s Cattle Market And Beyond: A Comparative Analysis Of ND - Demo - 160 Cow Herd To North Dakota Database By Harlan Hughes Extension Livestock Economist Dept of Agricultural Economics
Managing For Today s Cattle Market And Beyond A Comparative Analysis Of Demo Herd 1997 Herd To McKenzie County Database
 Managing For Today s Cattle Market And Beyond A Comparative Analysis Of Demo Herd 1997 Herd To McKenzie County Database By Harlan Hughes Extension Livestock Economist Dept of Agricultural Economics North
2017 Tennessee Agricultural Outlook. Aaron Smith Crop Economist University of Tennessee Extension
 2017 Tennessee Agricultural Outlook Aaron Smith Crop Economist University of Tennessee Extension Overview Review of the Tennessee Agricultural Economy Crops Livestock 2017 Estimated Net Returns Principle
Weekly Mature U.S. Beef Cow Slaughter
 Louisiana Cattle Market Update Friday, July 9 th, 2010 Ross Pruitt, Department of Agricultural Economics and Agribusiness Louisiana State University AgCenter In two weeks, USDA NASS will release the July
Situation and Outlook of the Canadian Livestock Industry
 Situation and Outlook of the Canadian Livestock Industry 2011 USDA Agricultural Outlook Forum Tyler Fulton February 25, 2011 tyler@hamsmarketing.ca Lost in Translation Canadian Livestock Industry - Outline
Grass-fed and Organic Beef: Production Costs and Breakeven Market Prices, 2008 and 2009
 AS 658 ASL R2684 2012 Grass-fed and Organic Beef: Production Costs and Breakeven Market Prices, 2008 and 2009 Denise Schwab Iowa State University Margaret Smith Iowa State University H. Joe Sellers Iowa
Opportunities exist to increase revenue from cull cows through changes in marketing strategies. This figure shows that cull cow prices tend to bottom
 1 Two approaches to increase value Consider your cows as productive assets. At the end of their useful life in your operation, how can you maximize their salvage value? Revenue from culls is a significant
U.S. Packing Capacity Sufficient for Expanding Cattle Herd
 September 7 U.S. Packing Capacity Sufficient for Expanding Cattle Herd Key Points: n The U.S. cattle industry will remain in expansion mode through the end of the decade. We project total beef production
Livestock and Feedgrain Outlook
 Livestock and Feedgrain Outlook 2017 Range Beef Cow Symposium James G. Robb Director, LMIC Website: www.lmic.info November 28-30, 2017 28 US Land Grant Universities: USDA Data Sources -- NASS, AMS, FAS,
Cow-Calf Ranch Input Worksheet- Unit Cost of Production Workshop Users Guide
 Cow-Calf Ranch Input Worksheet- Unit Cost of Production Workshop Users Guide Introduction and Background To guide ranchers in assessing their business profitability, the BC Ministry of Agriculture is hosting
Cattle Market Outlook
 Cattle Market Outlook Winter C. Wilson Gray District Economist Twin Falls R & E Center wgray@uidaho.edu http://web.cals.uidaho.edu/idahoagbiz/ Thank You! Topics: Markets and Aspects of Domestic Consumer
Dr. Curt Lacy Extension Economist-Livestock University of Georgia ECONOMICS OF IMPROVED GRAZING SYSTEMS
 Dr. Curt Lacy Extension Economist-Livestock University of Georgia ECONOMICS OF IMPROVED GRAZING SYSTEMS Will Improved Grazing Management Pay?? It depends!! Additional revenue Reduced cost Additional expense
Revised Estimated Returns Series Beginning in 2007
 Revised Estimated Returns Series Beginning in 2007 The Economics Department at Iowa State University has prepared monthly Estimated Returns to Feeding Livestock in Iowa since the 1960s. Each month the
Differences Between High-, Medium-, and Low-Profit Cow-Calf Producers: An Analysis of Kansas Farm Management Association Cow-Calf Enterprise
 Differences Between High-, Medium-, and Low-Profit Cow-Calf Producers: An Analysis of 2012-2016 Kansas Farm Management Association Cow-Calf Enterprise Dustin L. Pendell (dpendell@ksu.edu) and Kevin L.
TEXAS A8cM UNIVERSITY TEXAS AGRICULTURAL EXTENSION SERVICE
 TEXAS A8cM UNIVERSITY TEXAS AGRICULTURAL EXTENSION SERVICE J. E. HUTCHISON, DIRECTOR, COLLEGE STATION, TEXAS SEASONAL CHANGES IN CATTLE PRICES Edward Uvacek, Jr. and Ernest E. Davis* Beef has been blessed
Value-Based Marketing for Feeder Cattle. By Tom Brink, Top Dollar Angus, Inc.
 Value-Based Marketing for Feeder Cattle By Tom Brink, Top Dollar Angus, Inc. State of the Industry: 2014 was a BANNER YEAR in many ways Cattle ownership paid very well at all levels! $300 $280 Strong Cattle
Guidelines for Estimating. Bison Cow-Calf Production Costs 2017 in Manitoba
 Guidelines for Estimating Bison Cow-Calf Production Costs 2017 in Manitoba ................................................. Guidelines For Estimating Bison Cow-Calf Production Costs Based on a 100 Head
MCA/MSU Bull Evaluation Program 2016 Buyer Survey and Impact Report
 MCA/MSU Bull Evaluation Program 2016 Buyer Survey and Impact Report Daniel D. Buskirk*, Kevin S. Gould, and Daniel L. Grooms *Department of Animal Science Michigan State University Extension Department
Determining the costs and revenues for dairy cattle
 Determining the costs and revenues for dairy cattle Regional Training Course on Agricultural Cost of Production Statistics 21 25 November 2016, Daejeon, Republic of Korea 1 Definitions Production costs
Evaluating Opportunities to Market Feeder Calves
 Evaluating Opportunities to Market Feeder Calves Walter Prevatt 1 and Tom Anton 2 1 Auburn University, Auburn, Alabama 2 Range Cattle Research and Education Center, University of Florida, Ona, Florida
Profitability of Tasmanian beef enterprises:
 Profitability of Tasmanian beef enterprises: Calving dates and stocking rates for weaner and yearling production systems Libby Salmon, David Counsell and Tim Rhodes How can I make more from beef? Profitable
Cattle & Beef Outlook
 Cattle & Beef Outlook Glynn Tonsor Dept. of Agricultural Economics, Kansas State University Overarching Beef Industry Economic Outlook Supplies Expansion continues, but has moderated Demand Mixed signals
Beef Cattle Market Outlook
 Beef Cattle Market Outlook Glynn Tonsor Dept. of Agricultural Economics Kansas State University www.agmanager.info Supplies Historically tight Demand Overarching Beef Industry Economic Outlook Herd expansion
2007 PLANNING BUDGETS FOR DAIRY PRODUCTION IN MISSISSIPPI COSTS AND RETURNS. 112 and 250 COW DAIRY ENTERPRISES LARGE BREED CATTLE MISSISSIPPI, 2007
 2007 PLANNING BUDGETS FOR DAIRY PRODUCTION IN MISSISSIPPI COSTS AND RETURNS 112 and 250 COW DAIRY ENTERPRISES LARGE BREED CATTLE MISSISSIPPI, 2007 MISSISSIPPI STATE UNIVERSITY EXTENSION SERVICE MISSISSIPPI
IMPACT OF SEED STOCK SELECTION ON THE ECONOMICS OF A COW-CALF OPERATION
 IMPACT OF SEED STOCK SELECTION ON THE ECONOMICS OF A COW-CALF OPERATION Timothy D. Hewitt and John Holt North Florida Research and Education Center University of Florida, Marianna; and Food and Resource
Fall Calving in North Dakota By Brian Kreft
 Fall Calving in North Dakota By Brian Kreft A fall calving herd was established at CGRC in the fall of 1992 to gather a data base to determine the economics of fall calving in North Dakota. North Dakota
Forage and Livestock Management Considerations
 Know how. Know now. Forage and Livestock Management Considerations Jerry D. Volesky Range / Forage Specialist West Central Res. & Ext. Center 402 West State Farm Rd North Platte, NE 69101 (308) 696-6710
Forage and Livestock Management Considerations
 Know how. Know now. Forage and Livestock Management Considerations Jerry D. Volesky Range / Forage Specialist West Central Res. & Ext. Center 402 West State Farm Rd North Platte, NE 69101 (308) 696-6710
Historical Prices, Trends, Seasonal Indexes, and Future Basis of Cattle and Calves at Sioux Falls, South Dakota
 South Dakota State University Open PRAIRIE: Open Public Research Access Institutional Repository and Information Exchange Department of Economics Research Reports Economics 7-1-1990 Historical Prices,
COW/CALF DAYS 2015 NICOLE KENNEY-RAMBO
 Record Keeping COW/CALF DAYS 2015 NICOLE KENNEY-RAMBO NMKENNEY@UMN.EDU 1 RECORD KEEPING 101 Production Operational Financial Analysis 2 PRODUCTION/PERFORMANCE Whole Herd vs. Individual Animal Reproductive
Economic, Productive & Financial Performance Of Alberta Cow/Calf Operations
 Benchmarks for Cattlemen Economics & Competitiveness Economic, Productive & Financial Performance Of Cow/Calf Operations Comparing:, Profitability & Production Management Groupings Production Year - 1998
Ranch Calculator (RanchCalc)
") Oklahoma Cooperative Extension Service Current Report CR-3252 0609 Oklahoma Cooperative Extension Fact Sheets are also available on our website at: facts.okstate.edu Ranch Calculator (RanchCalc) Damona
Oklahoma Cooperative Extension Service Current Report CR-3252 0609 Oklahoma Cooperative Extension Fact Sheets are also available on our website at: facts.okstate.edu Ranch Calculator (RanchCalc) Damona
Differences Between High-, Medium-, and Low-Profit Cow-Calf Producers: An Analysis of Kansas Farm Management Association Cow-Calf Enterprise
 Differences Between High-, Medium-, and Low-Profit Cow-Calf Producers: An Analysis of 2010-2014 Kansas Farm Management Association Cow-Calf Enterprise Dustin L. Pendell (dpendell@ksu.edu), Youngjune Kim
Long Calving Seasons. Problems and Solutions
 DIVISION OF AGRICULTURE R ESEARCH & EXTENSION University of Arkansas System Agriculture and Natural Resources FSA3011 Long Calving Seasons: Problems and Solutions Tom R. Troxel Professor and Associate
Dairy Outlook. April By Jim Dunn Professor of Agricultural Economics, Penn State University. Market Psychology
 Dairy Outlook April 2017 By Jim Dunn Professor of Agricultural Economics, Penn State University Market Psychology The Class III price in March was $1.07 lower than in February, while the Class IV price
Guidelines for Estimating. Beef Cow-Calf Production Costs 2017 in Manitoba
 Guidelines for Estimating Beef Cow-Calf Production Costs 2017 in Manitoba ................................................. Guidelines For Estimating Beef Cow-Calf Production Costs Based on a 150 Head
PRODUCTION PLAN. Crop Production
 PRODUCTION PLAN The production plan conveys the type and quantity of commodities to be produced. The production plan pairs information from the resource inventory and financial records to serve as a realistic
U.S. DEPARTMENT OF AGRICULTURE ECONOMIC RESEARCH SERVICE August 1972 FCR-83 cooperating with New Mexico State University COSTS NOV
 U.S. DEPARTMENT OF AGRICULTURE ECONOMIC RESEARCH SERVICE August 1972 FCR-83 cooperating with New Mexico State University COSTS NOV 2 1872 and RETURNS FARM COSTS AND RETURNS STUDIES This report is part
Telephone: (706) Animal and Dairy Science Department Rhodes Center for Animal and Dairy Science
 Animal and Dairy Science Department Rhodes Center for Animal and Dairy Science") AS1 - Newsletter Telephone: (706) 542-2581 Animal and Dairy Science Department Fax: (706) 542-9316 Rhodes Center for Animal and Dairy Science Livestock Newsletter January/February 2003 http://www.ces.uga.edu/agriculture/asdsvm/beef-home.html
AS1 - Newsletter Telephone: (706) 542-2581 Animal and Dairy Science Department Fax: (706) 542-9316 Rhodes Center for Animal and Dairy Science Livestock Newsletter January/February 2003 http://www.ces.uga.edu/agriculture/asdsvm/beef-home.html
University of Florida Presentation. By: Jerry Bohn
 University of Florida Presentation By: Jerry Bohn Pratt Feeders, LLC Introduction Industry Change Of Focus Coordination Cooperation Transparency No More Island Mentality Create Win-Win Alliances Trust
Reproductive Management of Commercial Beef Cows. Ted G. Dyer, Extension Animal Scientist
 Reproductive Management of Commercial Beef Cows Ted G. Dyer, Extension Animal Scientist Reproductive efficiency has long been recognized as the most important aspect of commercial beef production. If only
EC Estimating the Most Profitable Use of Center-Pivot Irrigation for a Ranch
 University of Nebraska - Lincoln DigitalCommons@University of Nebraska - Lincoln Historical Materials from University of Nebraska- Lincoln Extension Extension 1974 EC74-861 Estimating the Most Profitable
What s Driving Dairy Profitability. Greg Bethard, Ph.D. GPS Dairy Consulting, LLC Blacksburg, VA
 What s Driving Dairy Profitability Greg Bethard, Ph.D. GPS Dairy Consulting, LLC Blacksburg, VA gregbethard@gpsdairy.com Concepts Benchmarking is a bad idea Goal Setting and tracking makes a lot of sense
Differences Between High-, Medium-, and Low-Profit Cow-Calf Producers: An Analysis of Kansas Farm Management Association Cow-Calf Enterprise
 Differences Between High-, Medium-, and Low-Profit Cow-Calf Producers: An Analysis of 2011-2015 Kansas Farm Management Association Cow-Calf Enterprise Dustin L. Pendell (dpendell@ksu.edu) and Kevin L.
Details. Note: This lesson plan addresses cow/calf operations. See following lesson plans for stockers and dairy operations.
 Session title: Unit III: Livestock Production Systems -Cow/Calf Total time: 60 minutes Objective(s): To recognize the elements of livestock production systems, such as herd management, nutrient requirement,
Economic, Productive & Financial Performance Of Alberta Cow/Calf Operations
 Benchmarks for Cattlemen Economics & Competitiveness Economic, Productive & Financial Performance Of Cow/Calf Operations Southern Fescue land, Mixed land & Moist Mixed land Production Year - 2002 Jan.
Update on Preconditioning Beef Calves Prior to Sale by Cow Calf Producers. Objectives of a Preconditioning Program. Vac-45 Calves
 Update on Preconditioning Beef Calves Prior to Sale by Cow Calf Producers What s a guy from Florida know about beef production? Todd Thrift University of Florida I will make no political promises? Objectives
An Economic Comparison of Organic and Conventional Dairy Production, and Estimations on the Cost of Transitioning to Organic Production
 An Economic Comparison of Organic and Conventional Dairy Production, and Estimations on the Cost of Transitioning to Organic Production Produced by: the Northeast Organic Farming Association of Vermont
3/25/2017. What to do today? Cattle & Beef Markets: Commodity Outlook
 3/25/27 Cattle & Beef Markets: Commodity Outlook Stephen R. Koontz Professor & extension economist Department of Agricultural & Resource Economics Colorado State University Stephen.Koontz@ColoState.Edu
Slope Farms. Our farm. Our work with other farmers. Experience with leasing land. Models for seasonal grazing
 Slope Farms Our farm Our work with other farmers Experience with leasing land Models for seasonal grazing Slope Farms LLC what we do Grass fed beef producer: 200 head cattle Branding, aggregation, quality
FEED EFFICIENCY IN THE RANGE BEEF COW: WHAT SHOULD WE BE LOOKING AT?
 Proceedings, The Range Beef Cow Symposium XXIV November 17, 18, and 19, 2015, Loveland, Colorado FEED EFFICIENCY IN THE RANGE BEEF COW: WHAT SHOULD WE BE LOOKING AT? H. H. Trey Patterson Padlock Ranch
Selection and Development of Heifers
 Selection and Development of Heifers Bob Sand Animal Science Department University of Florida, Gainesville Introduction One of the most expensive phases of the production cycle is the development of replacement
Dairy Outlook. January By Jim Dunn Professor of Agricultural Economics, Penn State University. Market Psychology
 Dairy Outlook January 2015 By Jim Dunn Professor of Agricultural Economics, Penn State University Market Psychology Dairy prices have fallen in the past month, especially butter prices. The dollar is still
Grassfed Beef Production Profit Projection and Closeout
 Grassfed Beef Production Profit Projection and Closeout You can t predict but you can prepare. The purpose grassfed beef retained ownership beyond the cow-calf phase or purchased stockers spreadsheets
Southeast Cattle Advisor
 october 2009 Southeast Cattle Advisor Cattle Outlook and Marketing Considerations Curt Lacy and Walt Prevatt, Extension Livestock Economists, University of Georgia and Auburn University Fall is here, and
User Manual - Custom Finish Cattle Profit Projection
 User Manual - Custom Finish Cattle Profit Projection The purpose of this decision aid is to help facilitate the organization of custom finish cattle, feeder cattle price, costs and production data to project
Silvopasture Economics: Three Case Studies. Larry Godsey Ph.D. Center Economist
 Silvopasture Economics: Three Case Studies Larry Godsey Ph.D. Center Economist Topics Benefits of Silvopasture Practices Published Economic Studies Unpublished Economic Case Studies Benefits of Silvopasture
Iowa Farm Outlook. February 2015 Ames, Iowa Econ. Info Takeaways from the January Cattle Inventory Report
 Iowa Farm Outlook 0BDepartment of Economics February 2015 Ames, Iowa Econ. Info. 2058 Takeaways from the January Cattle Inventory Report USDA has released the much anticipated inventory of the U.S. cattle
Introduction BEEF 140
 Beef Cattle Introduction Markets and price drivers Recent years have seen greater volatility in the market. Reasons range from the effective closure of the EU beef intervention scheme, the horsemeat scare,
MARKETING ASPECTS OF GOAT PRODUCTION. Outline. Know your costs Know your consumer Know the prices. Marketing Aspects of Goat Production 09/12/2011
 MARKETING ASPECTS OF GOAT PRODUCTION Extension Economist-Livestock Outline Know your costs Know your consumer Know the prices Secattleadvisor.com 1 Know thy costs The FIRST step in any good marketing program.
Costs to Produce Milk in Illinois 2003
 Costs to Produce Milk in Illinois 2003 University of Illinois Farm Business Management Resources FBM-0160 Costs to Produce Milk in Illinois 2003 Dale H. Lattz Extension Specialist, Farm Management Department
Opportunities and Challenges for Cow/Calf Producers 1. Rick Rasby Extension Beef Specialist University of Nebraska
 Opportunities and Challenges for Cow/Calf Producers 1 Rick Rasby Extension Beef Specialist University of Nebraska Introduction The cow/calf enterprise has been a profitable enterprise over the last few
ONTHLY BEEF MANAGEMENT CALENDAR & WORKBOOK
 J A N U A R Y - D E C E M B E R MONTHL ONTHLY BEEF CATTLE MANAGEMENT CALENDAR & WORKBOOK Foreword This publication is intended to be a reminder of management practices thought to be appropriate for each
AGRICULTURAL ALTERNATIVES
 AGRICULTURAL ALTERNATIVES Beef Backgrounding Production Backgrounding is a beef production system that uses pasture and other forages from the time calves are weaned until they are placed in a feedlot.
Cattle and Beef Markets: 2016 and beyond. Kate Brooks Department of Agricultural Economics
 Cattle and Beef Markets: 2016 and beyond Kate Brooks Department of Agricultural Economics kbrooks4@unl.edu Key Factors in 2016 Crops/Feedstuffs good for the industry. Expansion where we headed? Beef production
FORAGE SYSTEMS TO REDUCE THE WINTER FEEDING PERIOD. Gerald W. Evers
 Proceedings: Adjusting to High Fuel and Fertilizer Prices Research Center Technical Report No. 2008-01 FORAGE SYSTEMS TO REDUCE THE WINTER FEEDING PERIOD Gerald W. Evers Livestock require some form of
2012 STATE FFA FARM BUSINESS MANAGEMENT TEST PART 2. Financial Statements (FINPACK Balance Sheets found in the resource information)
") 2012 STATE FFA FARM BUSINESS MANAGEMENT TEST PART 2 Financial Statements (FINPACK Balance Sheets found in the resource information) Please use the Market Value when making the calculations for the Zimmerman
2012 STATE FFA FARM BUSINESS MANAGEMENT TEST PART 2 Financial Statements (FINPACK Balance Sheets found in the resource information) Please use the Market Value when making the calculations for the Zimmerman
Tennessee Market Highlights
 Tennessee Market Highlights September 22, 2017 Number: 38 Trends for the Week Compared to a Week Ago Slaughter Cows $2 to $3 lower Slaughter Bulls $4 to $7 lower Feeder Steers less than 600 lbs. $3 to
Tennessee Beef Cattle Improvement Initiative
 Tennessee Beef Cattle Improvement Initiative An educational program that will provide information that will help producers to: Improve profitability Be competitive 1 Goal of Master Beef Producer Program
A COMPARISON OF BEEF CATTLE BREEDING METHODS TO IMPROVE PERFORMANCE. D.G. Landblom and J.L. Nelson
 A COMPARISON OF BEEF CATTLE BREEDING METHODS TO IMPROVE PERFORMANCE D.G. Landblom and J.L. Nelson Artificial insemination has been promoted for a number of years as being one management tool available
Benchmark Angus. Engineering Superior Beef
 Benchmark Angus Engineering Superior Beef INNOVATION Research + Researchers Develop Knowledge + More Knowledge Innovation Details of Production 400 Purebred Black and Red Angus Cows 200 Spring Calving
MONITORING HEIFER PROGRAMS
 MONITORING HEIFER PROGRAMS Greg Bethard, Ph.D. G&R Dairy Consulting, Inc. Wytheville, Virginia USA Introduction Dairy producers, nutritionists, veterinarians, and consultants have utilized dairy records
Tennessee Market Highlights
 Tennessee Market Highlights March 4, 2016 Number: 10 Trends for the Week Compared to a Week Ago Slaughter Cows Steady to $1 higher Slaughter Bulls Unevenly steady Feeder Steers Under 700 lbs. $1 to $5
OPERATING INPUTS Units Price Quantity $/Acre Wheat Seed Bu./acre $ $ Custom Harvest Acre $ -
 Dryland Wheat Enterprise Budget - Grain and Graze 1000 acres farmed, 160 acres for this budget No Till - Continuous 2008 marketing year price projection Total PRODUCTION Units Price Quantity $/Acre Wheat
Raising the Bar on Calf & Heifer Feeding & Management. Jim Barmore, M.Sc., PAS Nutrition & Management Consulting Verona, WI
 Raising the Bar on Calf & Heifer Feeding & Management Jim Barmore, M.Sc., PAS Nutrition & Management Consulting Verona, WI jimbarmore@gpsdairy.com Why the Focus on Calves & Heifers Early calf development
Balancing Forage Demand with Forage Supply
 B-1606 Balancing Forage Demand with Forage Supply Larry D. White and Tom R. Troxel* One of the first priorities for proper management of range resources is balancing animal numbers with forage supply.
Cost Analysis of Implementing a Synchronization or AI Program-Using Decision-Aid Tools
 Cost Analysis of Implementing a Synchronization or AI Program-Using Decision-Aid Tools Introduction G. Cliff Lamb North Florida Research and Education Center Marianna, Florida University of Florida Estrous
IMPROVING THE EFFICIENCY OF YOUR PASTURES. Jose Dubeux, IFAS - NFREC NW FL Beef Conference and Trade Show 2015
 IMPROVING THE EFFICIENCY OF YOUR PASTURES Jose Dubeux, IFAS - NFREC dubeux@ufl.edu NW FL Beef Conference and Trade Show 2015 Outline 1. Introduction 2. Forage management priorities 3. How/Where should