Farm Financial Outlook
|
|
|
- Blaise McCoy
- 5 years ago
- Views:
Transcription
1 Farm Financial Outlook Alejandro Plastina, PhD Assistant Professor, Economics NACM Heartland - National Agriculture Retail Credit Exchange Group Ankeny, IA March 2, 2017
2 Main topics Farm Financial Situation Cost of Production Managing Margins Farm Bill
3 Recent Trends Low crop prices Declining, but lagging input costs Low-to-negative profit margins Declining Net Farm Income Deterioration in Farms : Financial liquidity (hurt most) Financial solvency How to manage margins?
4 Farm Income in Iowa (Source: Iowa Farm Business Assoc.) $300,000 $250,000 $200,000 $150,000 Net farm income accrual Net farm income cash $100,000 $50,000 $0 $90,458 $25,399 After asset depreciation and changes in inventories, Farm Income ~ $25,000 Source: Iowa Farm Costs and Returns. Ag Decision Maker File C1 10. Various years.
5 Distribution of 2015 Accrued Net Farm Income $0 NFI (Average) $25,399 = Cash Income = $813,531 + Change in Crop Inventory + $9,905 + Change in Livestock Inventory $46,287 + Feed Credits and change in + $39,248 other inventories Cash Expenses $723,073 Economic Depreciation $67,925 Source: Plastina, A. Number of farms=558
6 Classification Matrix Solvency: Total Debt to Asset Ratio Vulnerable: Above 60% Under Watch: Between 30% and 60% Strong: Under 30% Liquidity: Current Ratio Vulnerable: Below 1.3 Under Watch: Between 1.3 and 2.0 Strong: Over 2.0 Current Ratio = Current Assets/Current Liabilities Debt to Asset Ratio = Total Liabilities / Total Assets
7 Caveats: Land Value Land value: measured at Cost Value (purchase price) If Cost Value > Market Value: Solvency underestimated If Cost Value < Market Value: Solvency overestimated
8 January 1, 2015 (316 farms) Solvency: Total Debt to Asset Ratio Vulnerable: Above 60% Under Watch: Between 30% and 60% Strong: Under 30% Liquidity: Current Ratio Vulnerable: Below 1.3 Under Watch: Between 1.3 and 2.0 Strong: Over % 13.6% 2.2% 3.5% 10.4% 6.3% 1.9% 13.6% 35.1% Source: Plastina, A. Ag Decision Maker File C1 12 N=316
9 January 1, 2016 (316 farms) Solvency: Total Debt to Asset Ratio Vulnerable: Above 60% Under Watch: Between 30% and 60% Strong: Under 30% Vulnerable: Below % (+4.3%) 15.5% (+1.9%) 2.9% (+0.7%) Liquidity: Current Ratio Under Watch: Between 1.3 and % ( 0.3%) 10.8% (+0.4%) 7.0% (+0.7%) Strong: Over % ( 0.3%) 10.8% ( 2.8%) 30.7% ( 4.4%) Source: Plastina, A. Ag Decision Maker File C1 12 N=316
10 Changes in Liquidity and Solvency Ratings (Jan 2015 vs Jan 2016) Liquidity (Current Ratio) Jan'15 Jan'16 Solvency (Debt-to-Asset Ratio) Jan'15 Jan'16 29% +7% 36% 19% 22% +4% 20% 38% 37% +0.6% 21% 0.7% 51% 7.6% 43% 44% 41% 3.2% Vulnerable Under Watch Strong Vulnerable Under Watch Strong Current Ratio = Current Assets/Current Liabilities Debt to Asset Ratio = Total Liabilities / Total Assets Source: Plastina, A. Ag Decision Maker File C1 12 N=316
11 Summary of Changes in Liquidity and Solvency Ratings: Jan 2015 Jan No change 65% Solvency rating unchanged, lower liquidity rating 16% Liquidity rating unchanged, lower solvency rating 7% Solvency rating unchanged, higher liquidity rating 6% Lower liquidity and solvency ratings 3% Liquidity rating unchanged, higher solvency rating 2% Higher liquidity and solvency ratings 1% NO change in Rating does NOT mean NO change in Liquidity or Solvency
12 Working capital: burn rate in 2015 Liquidity Rating Jan'15 Liquidity Rating Jan'16 Change in Working Capital ($) % Change vs. Jan'15 Number of Farms Vulnerable Vulnerable 42,752 45% 77 Vulnerable Under Watch 68, % 13 Vulnerable Strong 141, % 2 Under Watch Vulnerable 326,265 66% 28 Under Watch Under Watch 75,857 22% 29 Under Watch Strong 129,166 42% 7 Strong Vulnerable 356,407 79% 9 Strong Under Watch 169,874 45% 24 Strong Strong 71,937 10% 127 All Farms 91,658 24% 316 Source: Plastina, A. Ag Decision Maker File C1 12 N=316
13 Farm Finances in 2015 Wide variability in financial performance of Iowa farm operations On average, farms burned through $92,000 of working capital in 2015 Between Jan and Jan : 65% maintained their liquidity and solvency rating 26% LOWER liquidity and/or solvency rating Successful farms: production mix, marketing, costs, yields
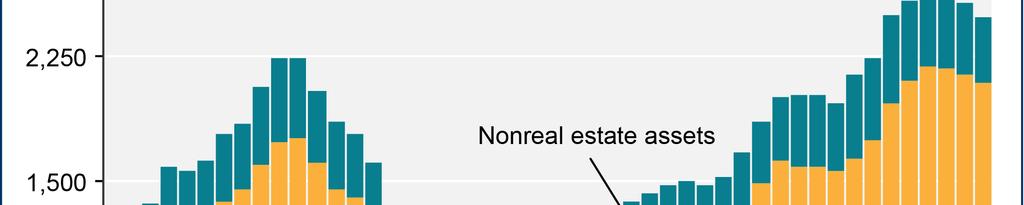
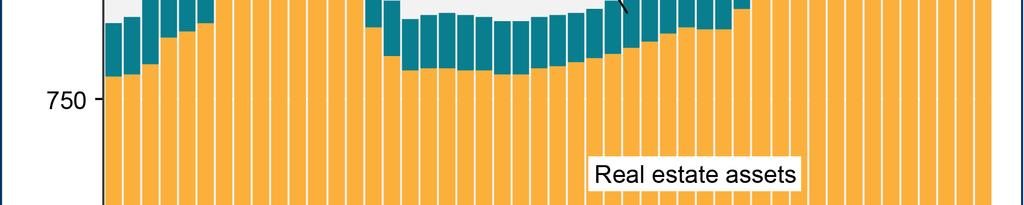
14 US principal farm operator: average $ per household 799,316 Farm assets Farm debt 950, , , ,082 1,003,551 67,404 69,387 78,333 80, , , * 2013* 2014* 2015* Source: USDA/ERS. Feb 2017 *Change in methodology
15 US principal farm operator: average $ per household Non farm assets Non farm debt 513, , , , , ,933 56,235 50,827 96,908 72, ,736 89, * 2013* 2014* 2015* Source: USDA/ERS. Feb 2017 *Change in methodology
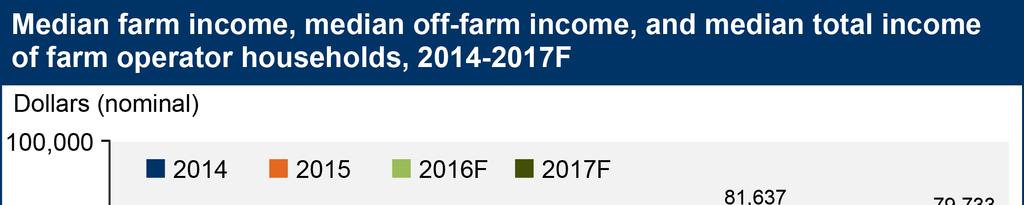
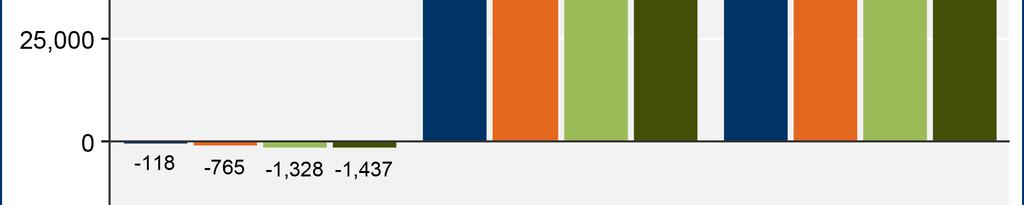
16 US principal farm operator Net Worth: $ per household Household net worth Average Household net worth Median 958,480 1,011,309 1,289,226 1,312, , ,742 1,469,443 1,399, , , , , * 2013* 2014* 2015* Source: USDA/ERS. Feb 2017 *Change in methodology
17 US Farm Income 8.7% Source: USDA/ERS. Feb 2017


18 US Cash Receipts Source: USDA/ERS. Feb 2017

19 US Cash Receipts Source: USDA/ERS. Feb 2017

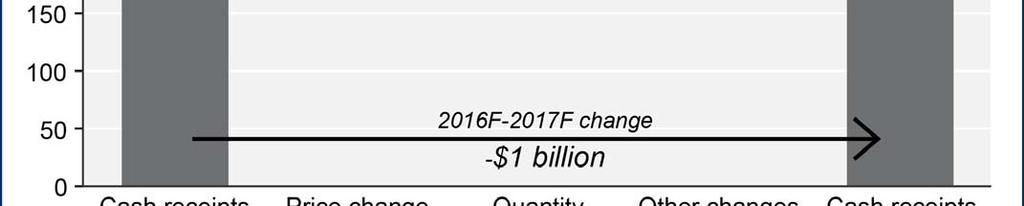
20 Change in US Cash Receipts
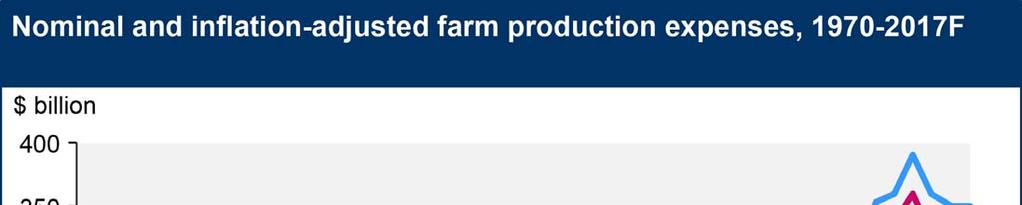
21 Farm Production Expenses (flat!)
22 ALL US AGRICULTURE

23 ALL US AGRICULTURE
24 ALL US AGRICULTURE
25 ALL US AGRICULTURE
26 ALL US AGRICULTURE Improving Worsening
 As of Nov 16-5.")
27 AVERAGE VALUES all farmland $7, Iowa Nominal and Inflation-adjusted Farmland Values Land Value ($ per acre) As of Nov % Nominal value Inflation-adjusted value (2015 dollars)
28 % Change in Nominal Iowa Farmland Values % 30.0% 20.0% 10.0% 0.0% -10.0% -20.0% -30.0% -40.0% Annual Percentage Change (%)


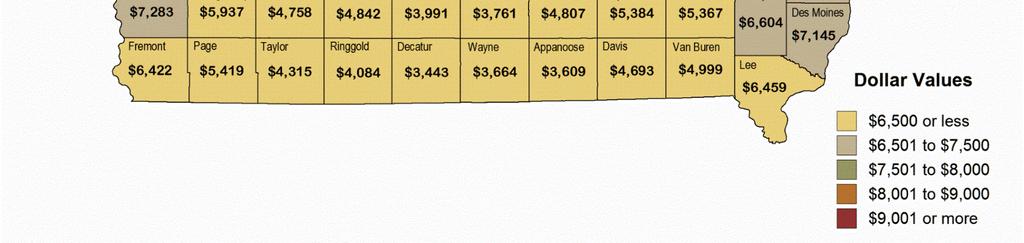
29 Land Values by County, 2016


30 Percent Changes in Land Values from Nov 2015
31 ISU Land Value Tool
32 Farmland supply tends to be tighter in down years % 30% 20% 10% 0% -10% -20% Sale activity index (% reproted more % reported less)* Percent change ISU sale activity index and percent change in Iowa land value, (% reported more sales - % reported less sales) Land Value % Change
33 90% 80% 70% 60% 50% 40% 30% 20% 10% Iowa Farmland Purchases by Buyer Types % Existing Farmers Investors New Farmers Other
34 Land Values: 7 th District FED-Chicago Source: Federal Reserve Bank of Chicago Feb 2017

35 Farm business average net cash income (nominal $1,000) Heartland US Average $200 $150 $100 $50 $ F 2017F Source: USDA/ERS. Feb 2017
36 Credit Conditions at 7 th District Agricultural Banks Loan Demand Index Fund Availability Index 1970Q1 1972Q1 1974Q1 1976Q1 1978Q1 1980Q1 1982Q1 1984Q1 1986Q1 1988Q1 1990Q1 1992Q1 1994Q1 1996Q1 1998Q1 2000Q1 2002Q1 2004Q1 2006Q1 2008Q1 2010Q1 2012Q1 2014Q1 2016Q1 Source: Federal Reserve Bank of Chicago Feb 2017
37 Credit Conditions at 7 th District Agricultural Banks Loan Repayment Index Q1 1972Q1 1974Q1 1976Q1 1978Q1 1980Q1 1982Q1 1984Q1 1986Q1 1988Q1 1990Q1 1992Q1 1994Q1 1996Q1 1998Q1 2000Q1 2002Q1 2004Q1 2006Q1 2008Q1 2010Q1 2012Q1 2014Q1 2016Q1 Source: Federal Reserve Bank of Chicago Feb 2017
38 U.S. Corn Supply and Use Area Planted (mil. acres) Yield (bu./acre) Production (mil. bu.) 13,829 14,216 13,602 15,148 14,065 Beg. Stocks (mil. bu.) 821 1,232 1,731 1,737 2,320 Imports (mil. bu.) Total Supply (mil. bu.) 14,686 15,479 15,401 16,940 16,435 Feed & Residual (mil. bu.) 5,040 5,280 5,131 5,600 5,450 Ethanol (mil. bu.) 5,124 5,200 5,206 5,350 5,400 Food, Seed, & Other (mil. bu.) 1,369 1,401 1,429 1,445 1,470 Exports (mil. bu.) 1,920 1,867 1,898 2,225 1,900 Total Use (mil. bu.) 13,454 13,748 13,664 14,620 14,220 Ending Stocks (mil. bu.) 1,232 1,731 1,737 2,320 2,215 Season-Average Price ($/bu.) Source: USDA-WAOB , USDA-OCE 2017
39 U.S. Soybean Supply and Use Area Planted (mil. acres) Yield (bu./acre) Production (mil. bu.) 3,358 3,927 3,926 4,307 4,180 Beg. Stocks (mil. bu.) Imports (mil. bu.) Total Supply (mil. bu.) 3,570 4,052 4,140 4,528 4,625 Crush (mil. bu.) 1,734 1,873 1,886 1,930 1,945 Seed & Residual (mil. bu.) Exports (mil. bu.) 1,638 1,842 1,936 2,050 2,125 Total Use (mil. bu.) 3,478 3,862 3,944 4,108 4,205 Ending Stocks (mil. bu.) Season-Average Price ($/bu.) Source: USDA-WAOB , USDA-OCE 2017


40 Corn Yields Top: 2016 Yield Bottom: Change from last year Units: Bushels/acre Source: USDA-NASS


41 Soy Yields Top: 2016 Yield Bottom: Change from last year Units: Bushels/acre Source: USDA-NASS
42 World Corn Production Source: USDA-WAOB
43 World Soybean Production Source: USDA-WAOB
44 Corn Export Sales Source: USDA-FAS
45 Change in Corn Export Sales Source: USDA-FAS
46 Soybean Export Sales Source: USDA-FAS
47 Change in Soybean Export Sales Source: USDA-FAS
48 Strength of the U.S. Dollar Source: Federal Reserve
49 Corn Grind for Ethanol
50 Crude Oil Prices Sources: EIA and CME

51 Current Corn Futures Source: CME Group, 2/24/2017

52 Current Soybean Futures Source: CME Group, 2/24/2017

53 2016/17 Crop Actual Yields
54 2017/18 Crop Margins
55 Iowa Corn Prices vs. Costs
56 Iowa Soybean Prices vs. Costs
57 Costs of Crop Production in Iowa $ per bushel $ $4.08 $ Corn following Corn Corn following Soybeans Soybeans following Corn AgDM File A1 20

 AgDM File")
58 Costs of Crop Production in Iowa 2017 ($ per acre) AgDM File A1 20
59 Cost of Corn Production in Iowa 2017 Corn following corn ($ per acre) $765 Other $34 Labor $37 Crop Protection $57 Seed $111 Fertilizer & Lime $129 $673 Other $31 Labor $36 Crop Protection $53 Seed $103 Fertilizer & Lime $101 Machinery $130 Machinery $120 Land $266 Land $ AgDM File A1 20
60 Cost of Corn Production in Iowa 2017 Corn following soybeans ($ per acre) $720 Other $33 Labor $34 Crop Protection $38 Seed $111 Fertilizer & Lime $111 $631 Other $30 Labor $33 Crop Protection $32 Seed $103 Fertilizer & Lime $87 Machinery $127 Machinery $117 Land $266 Land $ AgDM File A1 20
61 Cost of Corn Production in Iowa 2017 Soybeans following corn ($ per acre) $533 Other $24 Labor $29 Crop Protection $32 Seed $54 Fertilizer & Lime $53 Machinery $75 $483 Other $23 Labor $29 Crop Protection $40 Seed $53 Fertilizer & Lime $42 Machinery $67 Land $266 Land $ AgDM File A1 20
62 U.S. Meat Production & Prices Source: USDA-WAOB
63 U.S. Meat Trade Source: USDA-WAOB

64 Hog Crush Margin The Crush Margin is the return after the pig, corn and soybean meal costs. Carcass weight: 200 pounds Pig price: 50% of 5 mth out lean hog futures Corn: 10 bushels per pig Soybean meal: 150 pounds per pig Source: ISU Extension

65 Cattle Crush Margin The Crush Margin is the return after the feeder steer and corn costs. Live weight: 1250 pounds Feeder weight: 750 pounds Corn: 50 bushels per head Source: ISU Extension
66 Projections for 11/6/15 9/2/16 9/27/16 12/29/ $300 $78 $15 $ $86 $22 $29 Data Source: USDA & LMIC, Compiled by LMIC Livestock Marketing Information Center C-P-66 12/29/16

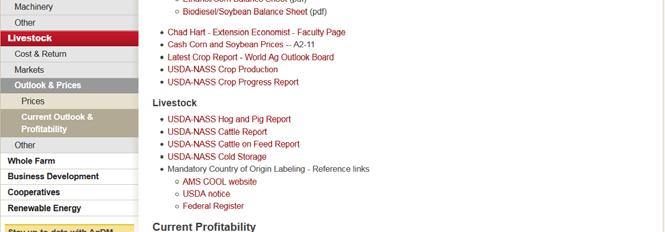
![24 [+$41 to +$269] 2015 = -$225.](/docs-images/80/81794620/images/67-2.jpg "12 [-$530 to +$43] 2016 = -$110.")
67 2013 = -$59.43 [-$155 to +$77] 2014 = +$ [+$41 to +$269] 2015 = -$ [-$530 to +$43] 2016 = -$ [-$359 to +$113] 2017 f = +$15.45 [-$98 to +$208]
68 Lower incomes might affect Family living expenses / Repayment of loans Local jobs Local communities Family relations / stress Litigation ISU Extension and Outreach Iowa Concern Hotline:
69 9 Strategies to manage margins Major concern: cash flow / liquidity Solvency hit, but less: Declining land values in Iowa Declining machinery values Long term problem strategy for 2-3 years
70 Strategies: 1. Protect your working capital Revise scale of operation and fixed costs over next 2-3 years. In particular: Recent asset purchases Rented land Manage taxes: visit with tax advisor Carry back operating losses to obtain tax refunds
71 Strategies: 2. Avoid cash shortages Plan for operating losses (rented land) Maintain cash reserves Secure operating loan/emergency loan terms Be very careful with new capital expenditures Costs per acre 2017 Corn on beans Corn on corn Beans following corn Cash Non land Costs $315 $370 $355 $410 $209 $220 Land Costs $191 $270 $191 $270 $191 $270 Non cash costs $56 $61 $58 $63 $38 $39 Total Costs $562 $700 $604 $743 $400 $490 Costs per bushel $3.51 $3.50 $4.17 $4.01 $9.75 $9.63 Source: File A1-20, Ag Decision Maker


72 Strategies: 3. Diversify Income Add or don t lose non-farm income Consider alternative sources of revenue with your assets: custom work, snow removal, truck driving in fall & winter,???
73 Strategies: 4. Revise production costs Revise production plans, especially for rented land (renegotiate land rent?) Can you make changes that generate savings that offset reductions in revenue? N 20 lbs per acre? Savings $10. If yield smaller than 2.59 $3.86/bu, GO AHEAD! Otherwise, NO GO. Switch to seeds with fewer traits (+crop management)? Net savings $25/acre. If yield smaller than 6.47 $3.86/bu, GO AHEAD! Otherwise, NO GO. Seek volume discounts in seeds, chemicals, etc. Visit with Agronomist: update your production skills, evaluate how to control costs
74 Strategies: 5. Actively Manage Risks Know your break-even prices Design a marketing plan with price and date targets and stick to it Lock-in margins whenever possible Revise crop insurance (Explore ways to maintain protection while lowering costs) Revise use of forward contracts & crop insurance for pre-harvest marketing
75 Strategies: 6. Revise family living expenses Average NFI (2015): $25,000 Average farm size in sample: 800 acres Need ~1,300 acres to afford $40,000 in living expenses And ~2,250 for $70,000! Revise family living expenditures: Vacation plans House remodeling plans Truck purchase
76 Strategies: 7. Secure repayment capacity Short repayment schedules reduce cash flow vs. long repayment schedules Try to extend repayment schedules on equipment & real estate loans (low interest rates) Work a plan with your lender(s) for
77 Strategies: 8. Revise Growth Strategy Depending on your growth stage: Offload unproductive assets Downsize Slow down growth Beginning farmers: wait to buy land Align short term needs with long term growth goals
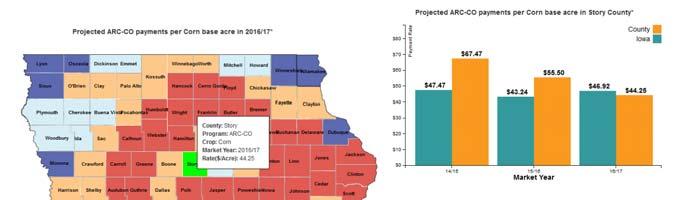
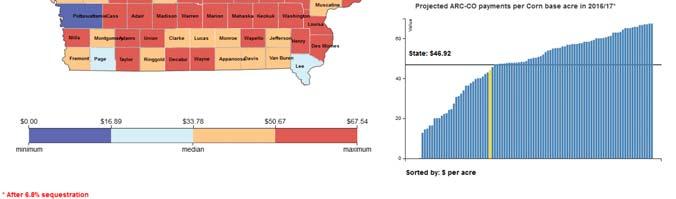
78 Strategies: 9. Know your ARC/PLC Payments Payments vary widely across counties and programs Check ISU decision tools: ARC-CO payments calculator PLC payments calculator Map of payments by county Source: Iowa Farm Bureau Federation
79 ARC-CO Projected Payments Last updated: Prices updated: Yields: 2014/15 and 2015/16 ARC-CO payments use Official FSA Yields updated ; 2016/17 ARC-CO payment use Official NASS yields updated

80 ARC-CO CORN Proj. Payments Oct 2017 (for 2016/17)
81 ARC-CO CORN Proj. Pmts. State Average: $8.43 >$20: 21 counties >$30: 7 counties: Grundy $48 Johnson $68 Mills $39 Palo Alto $30.1 Webster $33 Wright $36
")
82 ARC-CO BEANS Proj. Pmts. Oct 2017 (for 2016/17)
83 ARC-CO CORN Proj. Pmts. State Average: $0.33 >$0: 3 counties Dubuque $24 Washington $7 Clinton $1

84 PLC CORN Proj. Pmts Oct 2017 (for 2016/17)
85 PLC Projected Payments Oct 2017 (for 2016/17) CORN: ALL counties >$23 per corn base acre State average: $35 1 st time: PLC payments>arc-co payments SOYBEANS: No payments for 3 rd year
86 Summary Expect low margins in 2017 Visit with: Agronomist control costs? Lender refinance, lower payments? Tax advisor refunds from previous years? Crop insurance agent change coverage? Use Ag Decision Maker:

87 Farm Management Specialists: Financial Planning Associates: David Entriken, Webster City, , Jim Dane, Iowa City, , Roger Stewart, Red Oak, , Mark Olsen, Newell, , Tom Olsen, Newell, ,

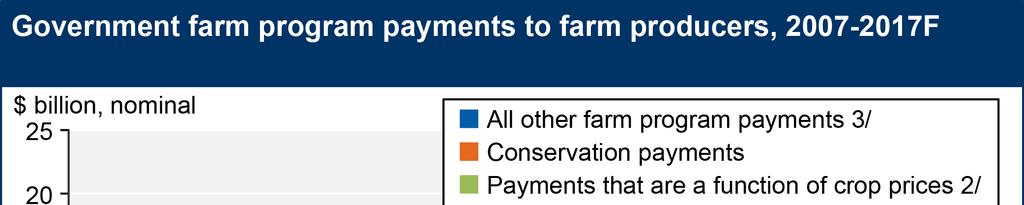
88 Farm and agribusiness management info: Farm Bill Payments:
89 Thank you for your attention! Questions? Alejandro Plastina Assistant Professor/Extension Economist (515)
Iowa Farm Financial Conditions
 Iowa Farm Financial Conditions Alejandro Plastina, PhD Assistant Professor, Economics AAEA Extension Track Session Chicago, IL August 1, 2017 Data Source: Iowa Farm Business Association Actively Managed
Ag Business Climate Outlook for 2017
 Ag Business Climate Outlook for 2017 Chris Hurt, Professor & Extension Economist Michael Langemeier, Professor & Associate Director James Mintert, Professor & Director Purdue Center for Commercial Agriculture
OUTLOOK FOR US AGRICULTURE
 Agricultural Outlook Forum 216 OUTLOOK FOR US AGRICULTURE Robert Johansson Chief Economist 25 February 216 Fig 2 Main themes for 216 1. The macroeconomy is weighing on trade, but there are reasons for
2017 Crop Market Outlook
 2017 Crop Market Outlook Presented at the Row Crop Short Course Jackson County Agriculture Conference Center March 2, 2017 Adam N. Rabinowitz, PhD Assistant Professor and Extension Specialist Agricultural
The data for this report were collected by Iowa Farm Business Association consultants and compiled by Iowa State University Extension and Outreach.
 2016 Cash Iowa Rental Farm Rates Costs for Iowa Ag Decision Maker Returns 2015 Survey File C1-10 The farm record data utilized in this report were obtained from the Iowa Farm Business Association. The
Chuck Danehower Extension Specialist Farm Management Danny Morris Extension Specialist Farm Management
 Maximizing Essential Crop Inputs Chuck Danehower Extension Specialist Farm Management cdanehow@utk.edu Danny Morris Extension Specialist Farm Management danhmorr@utk.edu Tennessee State Average Yields
2017 Tennessee Agricultural Outlook. Aaron Smith Crop Economist University of Tennessee Extension
 2017 Tennessee Agricultural Outlook Aaron Smith Crop Economist University of Tennessee Extension Overview Review of the Tennessee Agricultural Economy Crops Livestock 2017 Estimated Net Returns Principle
2012 STATE FFA FARM BUSINESS MANAGEMENT TEST PART 2. Financial Statements (FINPACK Balance Sheets found in the resource information)
") 2012 STATE FFA FARM BUSINESS MANAGEMENT TEST PART 2 Financial Statements (FINPACK Balance Sheets found in the resource information) Please use the Market Value when making the calculations for the Zimmerman
2012 STATE FFA FARM BUSINESS MANAGEMENT TEST PART 2 Financial Statements (FINPACK Balance Sheets found in the resource information) Please use the Market Value when making the calculations for the Zimmerman
Livestock and Feedgrain Outlook
 Livestock and Feedgrain Outlook 2017 Range Beef Cow Symposium James G. Robb Director, LMIC Website: www.lmic.info November 28-30, 2017 28 US Land Grant Universities: USDA Data Sources -- NASS, AMS, FAS,
Chicago Mercantile Exchange information sources.
 Chicago Mercantile Exchange information sources http://www.cmegroup.com/toolsinformation/index.html Key Areas in Grain Marketing Global Market Developments Seasonality of prices & basis Basis signals &
The Iowa Pork Industry 2008: Patterns and Economic Importance by Daniel Otto and John Lawrence 1
 The Iowa Pork Industry 2008: Patterns and Economic Importance by Daniel Otto and John Lawrence 1 Introduction The Iowa pork industry represents a significant value-added activity in the agricultural economy
Hog:Corn Ratio What can we learn from the old school?
 October 16, 2006 Ames, Iowa Econ. Info. 1944 Hog:Corn Ratio What can we learn from the old school? Economists have studied the hog to corn ratio for over 100 years. This ratio is simply the live hog price
2007 Michigan Cash Grain Farm Business Analysis Summary. Eric Wittenberg And Stephen Harsh. Staff Paper December, 2008
 2007 Michigan Cash Grain Farm Business Analysis Summary Eric Wittenberg And Stephen Harsh Staff Paper 2008-07 December, 2008 Department of Agricultural, Food, and Resource Economics MICHIGAN STATE UNIVERSITY
Report on Minnesota Farm Finances. April, 2010
 2009 Report on Minnesota Farm Finances April, 2010 Acknowledgements: Contributing Minnesota producers Minnesota State Colleges and Universities Farm Business Management Education Program Southwestern Minnesota
Iowa Farm Outlook. December 2017 Ames, Iowa Econ. Info Stretch Run for Meat Markets
 Iowa Farm Outlook 0BDepartment of Economics December 2017 Ames, Iowa Econ. Info. 2092 Stretch Run for Meat Markets The holiday season is an important test for meat sales and demand. Retailers and foodservice
2011 STATE FFA FARM BUSINESS MANAGEMENT TEST PART 2. Financial Statements (FINPACK Balance Sheets found in the resource information)
") 2011 STATE FFA FARM BUSINESS MANAGEMENT TEST PART 2 Financial Statements (FINPACK Balance Sheets found in the resource information) Please use the Market Value when making the calculations for the Zimmerman
2011 STATE FFA FARM BUSINESS MANAGEMENT TEST PART 2 Financial Statements (FINPACK Balance Sheets found in the resource information) Please use the Market Value when making the calculations for the Zimmerman
Cattle Market Outlook
 Cattle Market Outlook Winter C. Wilson Gray District Economist Twin Falls R & E Center wgray@uidaho.edu http://web.cals.uidaho.edu/idahoagbiz/ Thank You! Topics: Markets and Aspects of Domestic Consumer
January 12, USDA World Supply and Demand Estimates
 January 12, 2017 - USDA World Supply and Demand Estimates Corn This month s U.S. corn outlook is for lower production, reduced feed and residual use, increased corn used to produce ethanol, and smaller
Iowa Farm Outlook. February 2018 Ames, Iowa Econ. Info Betting on the Come in the Fed Cattle Market
 Iowa Farm Outlook 0BDepartment of Economics February 2018 Ames, Iowa Econ. Info. 2094 Betting on the Come in the Fed Cattle Market Prices feedlot managers are bidding for feeder cattle suggest that feedlot
Examining Land Values, Rents, Crop Input Costs & Margins in 2016
 Examining Land Values, Rents, Crop Input Costs & Margins in 2016 Barry Ward Department of Agricultural, Environmental and Development Economics, The Ohio State University 1 2 3 4 +3.5% Source: NASS 5 6
The survey was initiated in 1941 and
 File C2-70 December 2017 www.extension.iastate.edu/agdm 2017 Farmland Value Survey The survey was initiated in 1941 and is sponsored annually by Iowa State University. Only the state average and the district
Crops Marketing and Management Update
 Crops Marketing and Management Update Department of Agricultural Economics Princeton REC Dr. Todd D. Davis Assistant Extension Professor -- Crop Economics Marketing & Management Vol. 2016 (3) March 9,
Iowa Farm Outlook. October 2015 Ames, Iowa Econ. Info Hogs & Pigs Report: As Expected Inventories Larger
 Iowa Farm Outlook 0BDepartment of Economics October 2015 Ames, Iowa Econ. Info. 2066 Hogs & Pigs Report: As Expected Inventories Larger USDA s September Hogs and Pigs Report was full of information in
Report on Minnesota Farm Finances. May, 2017
 2016 Report on Minnesota Farm Finances May, 2017 Acknowledgements: Contributing Minnesota producers Minnesota Farm Business Management Education, Minnesota State Southwestern Minnesota Farm Business Management
2015 Michigan Dairy Farm Business Analysis Summary. Eric Wittenberg And Christopher Wolf. Staff Paper November, 2016
 2015 Michigan Dairy Farm Business Analysis Summary Eric Wittenberg And Christopher Wolf Staff Paper 2016-01 November, 2016 Department of Agricultural, Food, and Resource Economics MICHIGAN STATE UNIVERSITY
2007 Michigan Dairy Farm Business Analysis Summary. Eric Wittenberg And Christopher Wolf. Staff Paper December, 2008
 2007 Michigan Dairy Farm Business Analysis Summary Eric Wittenberg And Christopher Wolf Staff Paper 2008-04 December, 2008 Department of Agricultural, Food, and Resource Economics MICHIGAN STATE UNIVERSITY
Jason Henderson Vice President and Branch Executive Federal Reserve Bank of Kansas City Omaha Branch April 25, 2012
 Jason Henderson Vice President and Branch Executive April 25, 2012 The views expressed are those of the author and do not necessarily reflect the opinions of the Federal Reserve Bank of Kansas City or
October 20, 1998 Ames, Iowa Econ. Info U.S., WORLD CROP ESTIMATES TIGHTEN SOYBEAN SUPPLY- DEMAND:
 October 20, 1998 Ames, Iowa Econ. Info. 1752 U.S., WORLD CROP ESTIMATES TIGHTEN SOYBEAN SUPPLY- DEMAND: USDA's domestic and world crop estimates show a less burdensome world supply-demand balance for soybeans
2008 Michigan Cash Grain Farm Business Analysis Summary. Eric Wittenberg And Stephen Harsh. Staff Paper November, 2009
 2008 Michigan Cash Grain Farm Business Analysis Summary Eric Wittenberg And Stephen Harsh Staff Paper 2009-11 November, 2009 Department of Agricultural, Food, and Resource Economics MICHIGAN STATE UNIVERSITY
John Deere s Outlook on Cattle Economics
 John Deere s Outlook on Cattle Economics U.S. Drought having serious impact on livestock Drought impacting large cattle/dairy states Pushing feed prices higher Forced to feed hay earlier, haul water to
HOGS VS. ETHANOL: ETHANOL WINS!
 HOGS VS. ETHANOL: ETHANOL WINS! OCTOBER 2006 Chris Hurt 2006 NO. 6 The pork industry s concerns about higher corn prices from the extraordinary growth in corn demand for ethanol appears to be moving from
3/17/2016. Ross Pruitt Associate Professor. What is happening? What may happen? Economic/management considerations
 Ross Pruitt Associate Professor What is happening? What may happen? Economic/management considerations Mil. Head 40 JANUARY 1 COW INVENTORY U.S., Annual 35 30 25 2016 = 30.3 Million Head +3.5 Percent 20
Report on Minnesota Farm Finances. April, 2015
 2014 Report on Minnesota Farm Finances April, 2015 Acknowledgements: Contributing Minnesota producers Minnesota State Colleges and Universities Farm Business Management Education Program Southwestern Minnesota
Cattle Situation and Outlook
 Cattle Situation and Outlook Midwest/Great Plains/Western Outlook Conference August 2010 Tim Petry Livestock Economist www.ag.ndsu.edu/livestockeconomics mwgpw.ppt 8/12/10 TO ALL OUTLOOK CONFERENCE ATTENDEES
Iowa Farm Outlook. Livestock Price and Profitability Outlook
 Iowa Farm Outlook Department of Economics November, 2010 Ames, Iowa Econ. Info. 2007 Livestock Price and Profitability Outlook The holiday season is fast coming, marking the end of a year of variable livestock
Learn more at MarginManager.com May As always, if you have questions, please feel free to contact me.
 Learn more at MarginManager.com May 17 This Issue Feature Article Pages -6 Optimize Your Capital... Margin Watch Reports Pages 73 Hog....7 Dairy...8 Beef....9 Corn.... 11 Soybean...1 Wheat...13 Dear Ag
Iowa Farm Outlook. December 2015 Ames, Iowa Econ. Info Replacement Quality Heifer Prices Supported by Latest Data
 Iowa Farm Outlook 0BDepartment of Economics December 2015 Ames, Iowa Econ. Info. 2068 Replacement Quality Heifer Prices Supported by Latest Data Beef cow herd expansion started briskly in 2014 with a 2.1%
Agriculture: expansions highlighted developments
 Agriculture: expansions highlighted developments A broad-based expansion in livestock production and another bumper grain harvest highlighted agricultural developments in 1976. Meat production rose 9 percent
Commodity Market Outlook
 Commodity Market Outlook Jim Hilker Professor and MSU Extension Economist Department of Agricultural, Food, and Resource Economics Michigan State University Market Outlook Reports For September 6, 2017
An Economic Comparison of Organic and Conventional Dairy Production, and Estimations on the Cost of Transitioning to Organic Production
 An Economic Comparison of Organic and Conventional Dairy Production, and Estimations on the Cost of Transitioning to Organic Production Produced by: the Northeast Organic Farming Association of Vermont
Iowa Farm Outlook. February 2016 Ames, Iowa Econ. Info Cattle Inventory Report Affirms What Happened in 2015 and What May Happen in 2016
 Iowa Farm Outlook 0BDepartment of Economics February 2016 Ames, Iowa Econ. Info. 2070 Cattle Inventory Report Affirms What Happened in 2015 and What May Happen in 2016 Curious about how fast the beef cow
Beef Cattle Outlook Dr. Curt Lacy Extension Economist-Livestock
 Beef Cattle Outlook Dr. Curt Lacy Extension Economist-Livestock Current Situation $ Per Cwt. 190 180 170 160 150 140 130 120 110 100 90 MED. & LRG. #1 & 2 STEER CALF PRICES 500-600 Pounds, Georgia, Weekly
Agriculture: issues of the past resurface
 Agriculture: issues of the past resurface The past year marked a return to conditions in the agricultural sector that closely parallel those prior to 1973. Agricultural production rose to a record high,
3/25/2017. What to do today? Cattle & Beef Markets: Commodity Outlook
 3/25/27 Cattle & Beef Markets: Commodity Outlook Stephen R. Koontz Professor & extension economist Department of Agricultural & Resource Economics Colorado State University Stephen.Koontz@ColoState.Edu
The 2014 farm bill is now
 A Business Newsletter for Agriculture Vol. 18, No. 6 www.extension.iastate.edu/agdm April 2014 New farm program to provide enrollment decisions By Steven D. Johnson, PhD, ISU Extension and Outreach farm
CONTRIBUTION OF THE ETHANOL INDUSTRY TO THE ECONOMY OF THE UNITED STATES
 CONTRIBUTION OF THE ETHANOL INDUSTRY TO THE ECONOMY OF THE UNITED STATES Prepared for the Renewable Fuels Association by John M. Urbanchuk Technical Director February 2011 2010 was a year of continued
Cattle and Hay Outlook
 Cattle and Hay Outlook Stephen R. Koontz Associate professor & extension economist Department of Agricultural & Resource Economics Colorado State University Stephen.Koontz@ColoState.Edu http://dare.agsci.colostate.edu/skoontz
Iowa Farm Outlook. Fall 2017 Calf Marketing Considerations. September 2017 Ames, Iowa Econ. Info. 2089
 Iowa Farm Outlook 0BDepartment of Economics September 2017 Ames, Iowa Econ. Info. 2089 Fall 2017 Calf Marketing Considerations As fall weaning nears cow-calf producers should assess backgrounding prospects.
Iowa Farm Outlook. February 2015 Ames, Iowa Econ. Info Takeaways from the January Cattle Inventory Report
 Iowa Farm Outlook 0BDepartment of Economics February 2015 Ames, Iowa Econ. Info. 2058 Takeaways from the January Cattle Inventory Report USDA has released the much anticipated inventory of the U.S. cattle
CONTRIBUTION OF THE ETHANOL INDUSTRY TO THE ECONOMY OF THE UNITED STATES
 CONTRIBUTION OF THE ETHANOL INDUSTRY TO THE ECONOMY OF THE UNITED STATES Prepared for the Renewable Fuels Association by John M. Urbanchuk Managing Partner February 17, 2014 The environment facing the
USING PRODUCTION COSTS AND BREAKEVEN LEVELS TO DETERMINE INCOME POSSIBILITIES
 USING PRODUCTION COSTS AND BREAKEVEN LEVELS TO DETERMINE INCOME POSSIBILITIES Dale Lattz and Gary Schnitkey Department of Agricultural and Consumer Economics University of Illinois at Urbana-Champaign
Feed Grain Outlook June 2, 2014 Volume 23, Number 33
 June 2, Today s Newsletter Market Situation Crop Progress 1 Corn Use 2 Outside Markets 3 Marketing Strategies Corn Marketing Plan 5 Upcoming Reports/Events 6 Market Situation Crop Progress. This afternoon
Baseline Update for U.S. Farm Income and Government Outlays
 Baseline Update for U.S. Farm Income and Government Outlays October 2016 FAPRI MU Report #06 16 Prepared by the Food and Agricultural Policy Research Institute University of Missouri www.fapri.missouri.edu
Field Pea and Lentil Marketing Strategies
 EC-1295 Field Pea and Lentil Marketing Strategies George Flaskerud Professor and Extension Crops Economist Department of Agribusiness and Applied Economics The United States is a small but growing producer
Cattle Situation and Outlook
 Cattle Situation and Outlook January 2011 Tim Petry Livestock Economist www.ag.ndsu.edu/livestockeconomics Carrington-Jan2011 01/27/11 Northern Plains Calf Markets www.lmic.info In The Cattle Markets November
Cattle & Beef Outlook
 Cattle & Beef Outlook Glynn Tonsor Dept. of Agricultural Economics, Kansas State University Overarching Beef Industry Economic Outlook Supplies Expansion continues, but has moderated Demand Mixed signals
Revised Estimated Returns Series Beginning in 2007
 Revised Estimated Returns Series Beginning in 2007 The Economics Department at Iowa State University has prepared monthly Estimated Returns to Feeding Livestock in Iowa since the 1960s. Each month the
Ohio Agricultural Production and Rural Infrastructure
 Ohio Trends in Agricultural Production and Infrastructure Highlights - In many states the percentage of the state population designated by the U.S. Census Bureau as living in rural areas has declined,
2011 Southern Peanut Farmers Conference. Marshall Lamb USDA/ARS National Peanut Research Laboratory Dawson, GA
 2011 Southern Peanut Farmers Conference Farm Planning and Financing Marshall Lamb USDA/ARS National Peanut Research Laboratory Dawson, GA The vast majority of men die poor, not because their intentions
Situation and Outlook of the Canadian Livestock Industry
 Situation and Outlook of the Canadian Livestock Industry 2011 USDA Agricultural Outlook Forum Tyler Fulton February 25, 2011 tyler@hamsmarketing.ca Lost in Translation Canadian Livestock Industry - Outline
Analysis of the October 2010 USDA Crop Production & WASDE Reports
 Analysis of the October 2010 USDA Crop Production & WASDE Reports Daniel O Brien Extension Agricultural Economist, K State Research and Extension October 11, 2010 Summary of October 8 th 2010 Crop Production
U.S. Farm Income Outlook for 2018
 Randy Schnepf Specialist in Agricultural Policy February 27, 2018 Congressional Research Service 7-5700 www.crs.gov R45117 Summary According to USDA s Economic Research Service (ERS), national net farm
SOUTH AMERICAN SOYBEAN CROP ESTIMATE INCREASED
 April 14, 2000 Ames, Iowa Econ. Info. 1787 SOUTH AMERICAN SOYBEAN CROP ESTIMATE INCREASED USDA s World Agricultural Outlook Board raised its estimate of combined Brazilian and Argentine soybean production
Iowa Farm Outlook. November 2013 Ames, Iowa Econ. Info Is Beef Cattle Herd Rebuilding on the Horizon?
 Iowa Farm Outlook 0BDepartment of Economics November 2013 Ames, Iowa Econ. Info. 2043 Is Beef Cattle Herd Rebuilding on the Horizon? Cow-calf producers appear to have a growing incentive for herd expansion
PRX Grain Market Overview
 PRX The ProExporter Network Grain, Oilseed & Biofuel Fundamentals Updated 4/1/18 PRX Grain Market Overview US Major Grains Crop Years 217/18 & 218/19 with USDA Apr 1, 218 WASDE PRX_Overview, SDU, Apr-1-18
Cattle Situation and Outlook
 Cattle Situation and Outlook Tim Petry, Livestock Economist www.ndsu.edu/livestockeconomics Feb. 27, 2018 Outlook_2-7-2018.pptx ? WASDE U.S. Meat Production and Prices 2014 2015 Change from 2014 2016 Change
User Manual - Custom Finish Cattle Profit Projection
 User Manual - Custom Finish Cattle Profit Projection The purpose of this decision aid is to help facilitate the organization of custom finish cattle, feeder cattle price, costs and production data to project
November 18, 1996 Ames, Iowa Econ. Info. 1706
 November 18, 1996 Ames, Iowa Econ. Info. 1706 LEAN HOG CARCASS BASIS The new Lean Hog futures contract differs from its predecessor in several ways. It is traded on carcass weight and price rather than
Outline. Outlook for Crop Farm Income, Cash Rents, Farmland Prices, and Agricultural Credit. U.S. Corn Yield, U.S.
 Outlook for Crop Farm Income, Cash Rents, Farmland Prices, and Agricultural Credit September 1st, 217 Outline Outlook for Crop Farm Income, Cash Rents, Farmland Prices, and Agricultural Credit Gary Schnitkey,
Agri-Service Industry Report
 Agri-Service Industry Report December 2016 Dan Hassler 2017 U.S. Industry Outlook A little better or a little worse is the quickest way to sum up the expectations for the agricultural equipment industry
Corn and Soybean Stocks, Acreage, and Balance Sheet Implications
 Corn and Soybean Stocks, Acreage, and Balance Sheet Implications Scott Irwin, Darrel Good, and John Newton sirwin@illinois.edu / d-good@illinois.edu / jcnewt@illinois.edu Department of Agricultural and
Crop Enterprise Budgets
 Economics 330 Lab 2 Fall 2008 Crop Enterprise Budgets Name The purposes of this lab are: (1) to become familiar with the concepts and organization of a crop enterprise budget (2) to estimate the costs
U.S. Farm Income Outlook for 2017
 Randy Schnepf Specialist in Agricultural Policy October 4, 2017 Congressional Research Service 7-5700 www.crs.gov R40152 Summary According to USDA s Economic Research Service (ERS), national net farm income
Using Enterprise Budgets to Compute Crop Breakeven Prices Michael Langemeier, Associate Director, Center for Commercial Agriculture
 June 2017 Using Enterprise Budgets to Compute Crop Breakeven Prices Michael Langemeier, Associate Director, Center for Commercial Agriculture Enterprise budgets provide an estimate of potential revenue,
Iowa Farm Outlook. May 2015 Ames, Iowa Econ. Info Several Factors Supporting, Pressuring Fed Cattle Prices
 Iowa Farm Outlook 0BDepartment of Economics May 2015 Ames, Iowa Econ. Info. 2061 Several Factors Supporting, Pressuring Fed Cattle Prices All market classes of beef cattle are at record high levels for
Things to Consider When Trying to Weather the Storm
 Things to Consider When Trying to Weather the Storm Brian R. Williams, Aaron Smith, and Jordan M. Shockley Introduction The days of $7.00 corn and $16.00 soybeans, which were great while they lasted, are
Iowa Farm Outlook. Big Supply, Strong Dollar Pressure Hog Prices. January 2016 Ames, Iowa Econ. Info. 2069
 Iowa Farm Outlook 0BDepartment of Economics January 2016 Ames, Iowa Econ. Info. 2069 Big Supply, Strong Dollar Pressure Hog Prices After holding between $60 and $75 per cwt for much of the fall, nearby
SOYBEANS: LARGE SUPPLIES CONFIRMED, BUT WHAT ABOUT 2005 PRODUCTION?
 SOYBEANS: LARGE SUPPLIES CONFIRMED, BUT WHAT ABOUT 2005 PRODUCTION? JANUARY 2005 Darrel Good 2005 NO. 2 Summary USDA s January reports confirmed a record large 2004 U.S. crop, prospects for large year-ending
Beef Cattle Market Outlook
 Beef Cattle Market Outlook Glynn Tonsor Dept. of Agricultural Economics Kansas State University www.agmanager.info Supplies Historically tight Demand Overarching Beef Industry Economic Outlook Herd expansion
MILK PRODUCTION COSTS in 2008 On Selected WISONSIN DAIRY FARMS
 MILK PRODUCTION COSTS in 2008 On Selected WISONSIN DAIRY FARMS By Ken Bolton and Jenny Vanderlin 1 October 2009 Introduction The Basic Cost of Production increased in 2008 by $0.35/cwt equivalent (CWT
Agri-Service Industry Report
 Years Since Presidential Election 1950 1955 1960 1965 1970 1975 1980 1985 1990 1995 2000 2005 2010 2015 Billions Agri-Service Industry Report November 2016 Dan Hassler Farm Income and Presidential Elections
Beef Outlook Webinar July 27, 2009
 2009-10 Beef Outlook Webinar July 27, 2009 David Maloni Principal American Restaurant Association Inc. 888-423-4411 www.americanrestaurantassociation.com David.Maloni@AmericanRestaurantAssociation.com
Daily Market Highlights
 Daily Market Highlights Click below to see the Daily Commentary PDF version http://www.aghost.net/images/e0176001/dailymarketcommentary.pdf Wednesday, November 2, 2016 Hogs: Today's Markets: Dec 16 LEAN
CONTRIBUTION OF THE ETHANOL INDUSTRY TO THE ECONOMY OF THE UNITED STATES
 CONTRIBUTION OF THE ETHANOL INDUSTRY TO THE ECONOMY OF THE UNITED STATES Prepared for the Renewable Fuels Association by John M. Urbanchuk Technical Director Environmental Economics Updated January 31,
The estimated costs of corn, corn silage,
 Estimated Costs of Crop Ag Decision Maker Production in Iowa - 2017 File A1-20 The estimated costs of corn, corn silage, soybeans, alfalfa, and pasture maintenance in this report are based on data from
Pork Industry Economic Issues and Outlook
 Vita Plus Feeds Swine Summit - 2013 Pork Industry Economic Issues and Outlook Steve R. Meyer, Ph.D. Key drivers of meat and poultry -- 2013 Input prices and production costs Top 5: 1. Will it rain? 2.
Cattle Market Situation and Outlook
 Cattle Market Situation and Outlook Rebuilding the Cow Herd Series March 28, 2007 Falls City, TX Coordinated by: Dennis Hale-Karnes CEA Ag & Charlie Pfluger-Wilson CEA Ag Prepared and presented by: Larry
1998 Missouri Crop Costs and 2000 Crop Cost of Production Estimates
 1998 Missouri Crop Costs and 2000 Crop Cost of Production Estimates Raymond E. Massey Crops Economist, Commercial Agriculture Program This report summarizes the enterprise records for the 1998 Management
John Deere. Committed to Those Linked to the Land. Market Fundamentals. Deere & Company June/July 2014
 John Deere Committed to Those Linked to the Land Market Fundamentals Deere & Company June/July 2014 Safe Harbor Statement & Disclosures This presentation includes forward-looking comments subject to important
Cattle and Beef Markets: 2016 and beyond. Kate Brooks Department of Agricultural Economics
 Cattle and Beef Markets: 2016 and beyond Kate Brooks Department of Agricultural Economics kbrooks4@unl.edu Key Factors in 2016 Crops/Feedstuffs good for the industry. Expansion where we headed? Beef production
Proceedings, The Range Beef Cow Symposium XXII November 29, 30, & December1, 2011, Mitchell, NE
 Proceedings, The Range Beef Cow Symposium XXII November 29, 30, & December1, 2011, Mitchell, NE Implications of the Ethanol Industry for Cow-Calf Producers Ted C. Schroeder 1 Agricultural Economics Kansas
Illinois Farm Bureau Commodities Conference
 Illinois Farm Bureau Commodities Conference INVESTING IN AMERICA S HEARTLAND Perry Vieth, President & CIO Firm Overview Investment objective Ceres Partners, LLC Best-in-class purchase and management of
Beef Industry Tour to Argentina and Uruguay
 April 16, 2007 Ames, Iowa Econ. Info. 1956 Beef Industry Tour to Argentina and Uruguay In late March, a few of us from the Iowa State University joined a study tour to Argentina and Uruguay to look at
Emmit L. Rawls Professor Agricultural Economics
 Beef Cattle Situation and Outlook Emmit L. Rawls Professor Agricultural Economics Slaughter Steer Prices $ Per Cwt. 105 5 Market W eighted Average, Weekly 100 95 90 85 Avg. 2004-08 2009 80 75 2010 70 JAN
HOG PRODUCERS SHOW LITTLE SIGN OF RETREAT
 HOG PRODUCERS SHOW LITTLE SIGN OF RETREAT APRIL 2007 Chris Hurt 2007 NO. 2 Hog producers reported in the latest USDA update that they increased the size of the breeding herd by 1 percent. This means pork
2017 Crop Outlook. Chris Hurt, Professor, Department of Agricultural Economics. Michael Langemeier, Assoc. Director, Center for Commercial Agriculture
 2017 Crop Outlook Chris Hurt, Professor, Department of Agricultural Economics Michael Langemeier, Assoc. Director, Center for Commercial Agriculture James Mintert, Director, Center for Commercial Agriculture
Iowa Farm Outlook. January 2017 Ames, Iowa Econ. Info Pork industry shaping itself for the future
 Iowa Farm Outlook 0BDepartment of Economics January 2017 Ames, Iowa Econ. Info. 2081 Pork industry shaping itself for the future The talk of 2016 was heavy hog supplies relative to available processing
OPERATING INPUTS Units Price Quantity $/Acre Wheat Seed Bu./acre $ $ Custom Harvest Acre $ -
 Dryland Wheat Enterprise Budget - Grain and Graze 1000 acres farmed, 160 acres for this budget No Till - Continuous 2008 marketing year price projection Total PRODUCTION Units Price Quantity $/Acre Wheat
How Will Farmers Respond to High Fuel and Fertilizer Prices?
 How Will Farmers Respond to High Fuel and Fertilizer Prices? Damona Doye Regents Professor and Extension Economist Oklahoma State University Value of production by commodity Cattle and calves Poultry &
Soy Canada SOYBEAN PROCESSING WORKSHOP PRESENTATION NOVEMBER 16, 2017 BRANDON, MANITOBA
 Soy Canada SOYBEAN PROCESSING WORKSHOP PRESENTATION NOVEMBER 16, 2017 BRANDON, MANITOBA Overview 1) Soy Canada & Mandate 2) Soybean Sector Update & Trends 3) Growth in Western Canada 4) Commodity Soybean