DHI-202 Herd Summary
|
|
|
- Michael Small
- 5 years ago
- Views:
Transcription

1 DHI-202 Herd Summary February, Herd Test Identification Production, Income and Feed Cost Summary...3 2a. Daily Average Per Cow on Test Day...3 Daily Average Feed Reported...4 Daily Average Income and Feed Costs...5 2b. Rolling Yearly Herd Averages...5 Rolling Yearly Average Production...6 Rolling Yearly Average Feed Reported...7 Rolling Yearly Herd Average Income and Feed Cost Miscellaneous Herd Information Reproductive Summary...8 4a. Reproductive Summary of Current Breeding Herd...9 4b. Reproductive Summary of Total Herd c. Yearly Reproductive Summary Birth Summary Cows to be Milking, Dry, Calving by Month Stage of Lactation Profile Identification and Genetic Summary a. Identification Summary b. Genetic Summary Production by Lactation Summary Current Somatic Cell Count Summary Dry Cow Profile Yearly Summary of Cows Entered and Left the Herd Yearly Production and Mastitis Summary...19 Appendix Table 1: Description of DHI Record Plans...21 Appendix Table 2: Average Nutritional Values...23 Dairy Records Management Systems


2 2 Herd Summary Example 1 4a 4 2 2a 2b 4b 5 4c 6 3 8a 8 7 8b


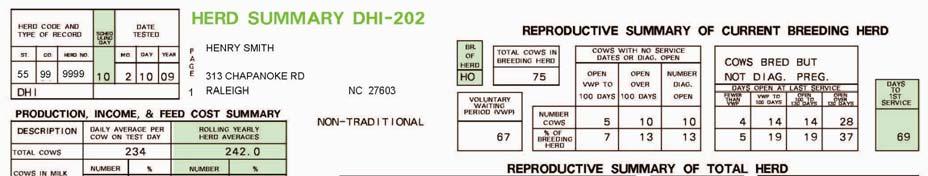
3 1. Herd Test Identification, 2. Production, Income and Feed Cost Summary 3 The Herd Summary DHI-202 provides a comprehensive herd analysis and management report including production, reproduction, genetics, udder health and feed cost information. All compiled data result from input into a dairy management program by farm staff and/or by the DHI technician on test day. The DHI-202 is a calculated each test day. If the herd is enrolled in the Permanent String option, a DHI-202 is also prepared for each string. In multiple breed herds, all cows of each breed can be in separate Permanent Strings and their yearly averages can be considered for recognition. When all cows in the herd are the same breed (registered and/or grade), information on the entire herd is used to calculate the herd averages Herd Test Identification Herd Code and Type of Record. The first two digits identify the state where the herd is located, the third and fourth digits identify the county within the state and the fifth through eighth digits identify the herd within the county. The herd number is unique for each herd. The descriptive name is given for the record plan on which the herd is enrolled. Table 1 in the appendix provides a summary of record plans. Scheduling Day is the day the herd was scheduled to be tested. This date is listed if previous arrangements are established for testing days. Date Tested is the date of the current test. The date tested is the date of the last milkings of the test. If a herd is tested at the PM and AM milkings, the date of the AM milking is used. Name and Address for the herd. Reports are mailed to this address. It must be accurate and complete to ensure prompt return of the reports. 2. Production, Income, and Feed Cost Summary summarizes production, feed intake, feed cost, and income over feed cost for the current test day. 2a 2b 2a. DAILY Average Per Cow on Test Day Total Cows are all cows, milking and dry, in the herd on test day. Cows sold during the current test period (day after previous test date through current test date) are not counted. Cows in Milk includes all cows in milking status on test day. Percent is calculated by dividing cows in milk by total cows and multiplying by 100. For example: (84 cows in milk divided by 122 total cows) x 100 = 69%. Milk Lbs. (All Cows) is the average milk production for all cows (milking and dry) in the herd. Test day averages are calculated by dividing the sum of test day milk weights (printed for each cow on the DHI-200, 210, 211 or 220) by the total number of cows in the herd on test day. Fat Lbs. (All Cows) is the average fat production of all cows (milking and dry) in the herd. Test day fat production for each cow is computed from the test day milk weight and fat percent printed on the monthly report. Calculation of average fat production is the same as for average test day milk production.
4 4 2a. DAILY - Feed Reported Fat Percent is the average fat percent for the herd. Total pounds of fat produced by the herd is divided by the total milk production (lb) of the herd to calculate this percentage. Protein Lbs. (All Cows) is the average pounds of protein produced by the herd (all cows). It is calculated the same as average test day fat production. Protein Percent is the average protein percent for the herd. The method for calculating protein percent is the same as for fat percent. Milk Lbs. (Milking Cows) is the average production for each milking cow on test day. To obtain the average, the sum of the herd's milk weights on test day is divided by the number of cows with milk weights. 2a 2b DAILY Average Feed Reported Reporting feed data is optional. If it is reported, care should be taken to use accurate values. Feed intake and cost information are printed both for milking cows and for all cows. Silage is the average pounds of this forage reported consumed. Total reported consumption by all feed programs of cows in milk is divided by the number of cows in milk to obtain the average pounds consumed by milking cows. Reported consumption by cows in all feed programs is totaled and divided by the total cows to obtain average silage intake for all cows on test day. Other Succulents or Blended Rations include all other high moisture content, high fiber feeds or blended rations consisting of all or most of the feeds fed to the herd. Examples of succulents are green chop, haylage, wet brewers grain, and root crops. Blended rations may be total mixed rations (TMR) or other mixtures of forages and concentrates. Averages are calculated by the same method as for silage. Dry Forage refers to hay and other high fiber dry forages fed to the herd. Test day averages are computed by the same method as for silage. Other Feeds may include all other feeds fed on a group or herd basis. These may include beet pulp, citrus pulp, crushed ear corn, high moisture corn, cottonseed, cottonseed hulls, etc. Blended rations also may be reported in this category. The calculation of test day average is by the same method as for silage. Pasture indicates whether milking cows have been on pasture this past test period. If just dry cows are on pasture, a NO will print under Milking Cows and a YES will print under All Cows. Concentrates include high energy, low fiber feeds fed individually or on a group basis. Test day averages for Milking Cows and All Cows are computed by the same method as for silage. Feeds reported as Group Fed Concentrate or Other Feed which are over 50% TDN or cost over $100 per ton are summarized as Concentrates on the DHI-202. NOTE: For herds with more than one breed, individual cow forage intake and feed costs are adjusted by the herd average body weight for each breed. For herds on the permanent string option, string average feed data and feed costs are adjusted by the breed average body weight of the entire herd.
5 2a. DAILY - Avg Income and Feed Costs, 2b. ROLLING YEARLY Herd Averages 5 DAILY Average Income and Feed Costs Value of Product $ is a dollar ($) value for the average daily lbs. milk produced. Total daily value for milk produced divided by the number of milking cows yields the Value of Product for Milking Cows. Total daily value for milk produced divided by the total number of cows in the herd (milking and dry) yields the Value of Product for All Cows. Milk price data reported each test day is used in the calculation including price/cwt and fat/protein differentials for milk sold during the month preceding test day. Actual values for all milk sold should be reported. Cost of Concentrates $ is the average cost per cow based on amounts of concentrate fed and reported cost/ton. Costs per cow are summed for the entire herd and divided by the total cows in the herd (milking and dry) to obtain cost of concentrates for all cows. Costs per cow are summed for the entire herd and divided by the number of cows in milk to obtain cost of concentrates for milk cows. Total Feed Cost $ is the sum of the cost of concentrates plus all other feeds per cow. Averages are calculated by the same method as for cost of concentrates. Income Over Feed Cost $ is the difference between Value of Product $ and Total Feed Cost $. Feed Cost Per Cwt. Milk $ is the value of all feeds fed to produce 100 pounds (cwt) of milk. The daily average feed cost per cwt milk for milking cows is calculated by dividing Total Feed Cost of cows in milk by the average number of cwts of milk produced by cows in milk. Total Feed Costs for All Cows is divided by the average number of cwts of milk produced by all cows (milking and dry cows) on test day to obtain Feed Cost Per Cwt. Milk for All Cows. Feed Cost Per Cwt. Milk tends to be lower in high producing herds. Although larger Total Feed Costs per cow will be associated with higher producing herds, a smaller proportion of total feed intake will be associated with nonproduction (i.e., maintenance). The added income from increased production generally more than offsets the increase in total feed cost per cow. Comparisons of Feed Cost Per Cwt. Milk values can be made on a within herd basis. Monthly trends can be monitored in addition to comparing cost with the same period last year. Milk Blend Price for test day is the reported milk price and fat and protein tests. This generally represents the price received for milk marketed in the month preceding the date of test since the farm receives this information after the end of the month. The differential adjustment for fat and protein (if applicable) is included in the blend price. 2b. ROLLING YEARLY Herd Averages are computed for all items in the Production, Income and Feed Cost summary except Milk Lbs. (Milking Cows). New herds receive this information after 365 days on test. A description of each item appears in section 2a. A general explanation of the calculation of Rolling Herd Averages (RHA) for milk production follows. This calculation will apply to RHA for other production items, feed intake, feed costs and income values unless otherwise indicated. To effectively explain the RHA calculation, test interval production and total cow-days per test interval must be defined. The test interval begins the day after the previous test date and ends on the current test date. Days in Test Period for each test interval in the past year are listed in the Yearly Production and Mastitis Summary section of the DHI-202. Total production during each test interval for each cow is calculated using her production on the previous test day and the current test day. Production on the previous test day is the cow s daily production for the first half of the test interval. Production on the current test day is used as the daily production for the last half of the test period. As an example, suppose the test interval is 30 days and a cow produced 70 lb. on the previous test day and 60 lb. this test day. Her test interval production is (15 days x 70 lb.) + (15 days x 60 lb.) = 1,950 lb. Additional adjustments are made to the first, second and last test intervals of a cow s lactation to adjust for nonlinear sections of the normal lactation curve.
 in the herd on the current test day. No cows entered or left the herd during the test interval.")
6 6 2b. ROLLING YEARLY - Production The number of cow-days in a test interval is the accumulation of the number of days that each cow was in the herd during the test interval. Suppose there was a 30- day test interval with 100 cows (milking and dry) in the herd on the current test day. No cows entered or left the herd during the test interval. Total cow-days for the interval were 30 days x 100 cows = 3,000 cow-days. As another example, assume that 99 cows were in the herd on test day. One cow left the herd 5 days into the test interval and one cow entered the herd 15 days before the current test day. The test interval was 32 days. Total cow-days for the test interval were (98 cows x 32 days) + (1 cow x 5 days) + (1 cow x 15 days) = 3,165 cow-days. To calculate RHA, total yearly milk production for the herd and total cow-days for the year are needed. These are accumulated by test intervals to obtain a production year of 365 days. For the oldest test interval which spans the 365 day period, the portion is used which accumulates exactly 365 days of production. For example, if the old test interval was 30 days and the addition of this interval made a total of 370 days, production for 25 days of this period would be added to the yearly total. For a new herd, RHA will be calculated after the herd has been enrolled in the DHI program for 365 days. When the total yearly production and 2a 2b total cow-days for the year are obtained, total yearly production is divided by total yearly cow-days to yield the average daily production for all cows during the past production year. This average daily production is multiplied by 365 to get the RHA. No adjustments are made for age, stage of lactation, number of dry cows, or length of the dry period. Consequently, extended records and long dry periods will reduce RHA for milk production. Current Daily Average per Cow on Test Day values compared to averages for the test period dropped (same month of the previous year) may or may not give an indication of the change in RHA from one month to the next. Average production of all cows during the entire test interval is the information used in calculating RHA, not average test day production only. Consequently, when a large number of cows are dry for most of the test interval but calve in time to be tested, an increase in average daily production per cow on test day may be a misleading indicator of the RHA change. The Test Period Production Added and Dropped is printed with the Yearly Production and Mastitis Summary. This information should be used to evaluate changes in RHA. ROLLING YEARLY Average Production Total Cows is calculated as total cow days for the production year (total of consecutive test intervals comprising approximately 365 days) divided by the sum of all days in the test intervals included in the production year. Fat Percent on a yearly basis is calculated as (RHA fat divided by RHA milk) x 100. Example: (804/20946) x 100 = 3.8% Protein Percent on a yearly basis is calculated as (RHA protein divided by RHA milk) x 100 Example: (659/20946) x 100 = 3.1%

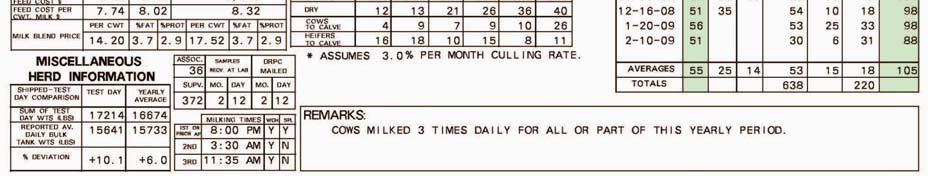
7 2b. ROLLING YEARLY - Feed Reported / Income and Feed Cost, 3. Misc. Herd Info. 7 ROLLING YEARLY Average Feed Reported The yearly summary of feed consumed by the herd can be used to plan feed requirements for the next year. It also allows you to compare feed intake for the current year with previous years. Total Digestible Nutrients (TDN) is the measure used to report the energy value for each feed. %ENE (energy) on an annual basis is the amount of energy derived from each individual feed class (i.e. silage, dry forage, etc.) as a percentage of the total energy contained in all feeds fed to the entire herd. TDN information is required only for herds where Lbs. Indicated data is requested on the DHI-200. TDN values should be obtained from forage analyses or estimated using standard values for the feed based upon visual quality estimates. Tables for average nutritional values of many forages and concentrates fed are included in Appendix Table 2. Pasture as a rolling yearly herd average is the total number of days in all test intervals during the year when feed reported on test day included a pasture quality code. The entire herd, a part of the herd or only dry cows may include pasture. Calculation of the % ENE (energy) from pasture on an annual basis is based upon the total herd energy intake, not just cows that had access to pasture. ROLLING YEARLY Herd Average Income and Feed Cost Yearly averages for Value Of Product$, Cost Of Concentrates$ and Total Feed Cost$ are calculated by the test interval method using procedures described for the Rolling Herd Average (see item 2b). Income Over Feed Cost $ is the difference between the rolling yearly herd averages for Value of Product and Total Feed Cost. Feed Cost Per Cwt Milk $ is calculated by dividing Total Feed Cost by the rolling yearly herd average for milk (all cows) expressed as cwts. [Example: $1070/ cwt= $5.10 feed cost/cwt.] Milk Blend Price $ for the year is calculated by weighting each reported test period milk blend price by the test period total milk. Yearly plant % fat and % protein are weighted by multiplying each test period total milk by the corresponding reported plant fat or protein test. 3. Miscellaneous Herd Information 3 Milk Shipped and Test Day Comparison compares the test day results to the previous milk shipped information. Sum of Test Day Wts. (lbs.) is the total pounds of milk reported for all cows on test day. If a cow s production is indicated abnormal (CAR code A reported) and the record is adjusted by the computer, the actual weight is included in this total. Estimated production (CAR code E is reported) for cows that were not milked or milk was discarded (mastitis treatment or other reason) is not included in this total. Cows Too Fresh to test are included if milk weights are reported. Reported Av. Daily Bulk Tank Wts. (lbs.) is the calculated daily production for the herd based on the most recent three milk shipments reported. The % Deviation compares the % difference between Sum of Test Day Wts. and Average Bulk Tank Weights. The denominator is the milk shipped. [Example: ( )/4650 x 100 = 1.2%]. This difference can be used to monitor the accuracy of meters, weigh jars and bulk tank measurements. Milk fed to calves, used in the home, discarded due to mastitis or not shipped for any other reason should be considered in this comparison. A % Deviation below 5% is desirable. Test Day averages for Sum of Test Day Wts., Reported Average Daily Bulk Tank Wts. and % Deviation are weighted by test interval length to obtain the corresponding yearly averages.


8 8 3. Miscellaneous Herd Information, 4. Reproductive Summary 3 Turnaround Times: Samples Recv at Lab can be compared with Date Tested to determine sample shipping time. DRPC Mailed is the date processed reports were mailed or downloaded. Milking Times indicate starting times of milkings and if they were AM or PM. Milkings that were weighed and sampled are indicated by a Y (Yes) or N (No) in the WGH and SPL blocks. For herds on alternate AM-PM testing plans, the starting time of the milking prior to the milking being weighed is listed. For herds on an APCS (AM-PM Component Sampling) testing plan, the SPL (sampling) box will indicate which milking was sampled. Remarks will be listed if needed. a) THIS STRING AVERAGE IS NOT FOR RECOGNITION. IT SHOULD BE USED ONLY FOR WITHIN HERD MANAGEMENT. This message is printed for supervised herds with string averages that do not meet the parameters to be a published average. b) COWS MILKED 3 TIMES DAILY FOR PART OR ALL OF THIS YEARLY PERIOD. One cow milked 3X for one month will trigger this message. 4a 4 4b 4. Reproductive Summary includes three major sections: Current Breeding Herd, Total Herd, and Yearly Reproductive Summary. Throughout the discussion of the Reproductive Summary, the word pregnant will mean cows diagnosed pregnant for herds reporting routine pregnancy checks. These herds will have the message COWS BRED BUT NOT DIAG. PREG. printed in the Current Breeding Herd section. Routine pregnancy diagnosis in a herd is reported in the options by the DHI technician. For herds not routinely checking for pregnancy, the word pregnant will mean cows bred 65 days or more before the current test date or before they left the herd (non-return rate). These herds will have
9 4a. Reproductive Summary of CURRENT Breeding Herd 9 the message COWS BRED SINCE MM-DD-YY printed in the Current Breeding Herd section. This date will be 65 days before the current test date. Cows to be sold without breeding can be designated as C (cull) for reproductive status. Cows coded "C" are not included in the calculation of values in the Summary of Current Breeding Herd and in most of the calculations in the Reproductive Summary of Total Herd. They are included in the Yearly Reproductive Summary and in the other sections of the DHI-202. Breed of Herd is indicated by a two letter code. The more common breeds are: AY-Ayrshire, BS- Brown Swiss, GU-Guernsey, HO-Holstein, JE-Jersey, MS-Milking Shorthorn, DL-Dutch Belted and WW-Red and White. When two or more breeds are included in the herd and one breed comprises 75 percent or more, the code for this breed is used. If one breed does not predominate, the herd is coded as mixed (XX). 4a. Reproductive Summary of CURRENT Breeding Herd This section includes cows in the herd that: 1) have not been bred and open past the Voluntary Waiting Period (VWP), 2) have been bred but currently are diagnosed open or 3) their last breeding date is too recent for assumed or confirmed pregnancy. Total Cows in Breeding Herd includes cows with no breeding dates open past the VWP, cows bred but not diagnosed or not assumed pregnant, and cows bred but diagnosed open. Voluntary Waiting Period (VWP) is your desired waiting period from freshening to first service which has been reported in the options as Days Open Goal. If no VWP is specified, 60 days is used as the desired number of days open before first service. An accurate value for the voluntary waiting period should be reported because it is used to calculate Projected Minimum Calving Interval and Projected Minimum Days Open in the Reproductive Summary of Total Herd and to calculate % of Heats Observed in the Yearly Reproductive Summary. A goal for first service is usually days after calving. Cows With No Service Dates or Diag. Open includes three categories. The first two categories include cows open from the VWP to 100 days, and cows open over 100 days. The number of cows which have been bred and then diagnosed open at a later time is printed in the area labeled Number Diag. Open. Both the number of cows and the percentage of total cows in the breeding herd in each category are listed. This section is useful in quantifying the number of cows for which heat detection may be a problem. Special attention is needed for those cows open more than 100 days. Days Open At Last Service - the heading for this section will read either Cows Bred Since mm-dd-yy (65 days before current test day by month, day, year) or Cows Bred But Not Diag. Preg. In herds not designated as using routine pregnancy diagnosis, cows are summarized as pregnant only after they have been bred 65 days or more. Although some individual cows in non-pregnancy check herds may be reported pregnant less than 65 days after breeding, they are still included in the Reproductive Summary of Current Breeding Herd until they are bred 65 days or more. Days Open as of Last Service is used to categorize cows in one of four categories; open fewer than the VWP days, VWP-100 days, days and over 130 days. Average Days to 1st Service is an average of the days to first service of cows in the current breeding herd. This value is dependent on the VWP for the herd and on % heats observed. If the VWP is extended or if heat detection efficiency declines, the average days to first breeding will increase.

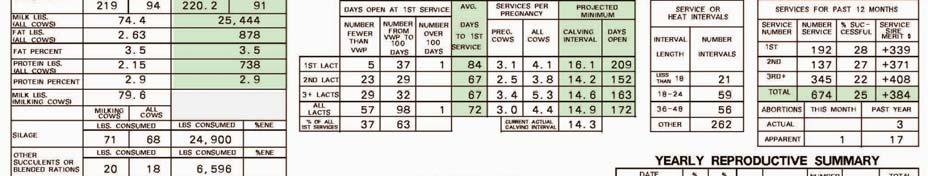
10 10 4b. Reproductive Summary of TOTAL Herd 4b 4b. Reproductive Summary of TOTAL Herd This section is a summary of all cows in the herd on test day. It will include both pregnant and open cows. Some of the categories include cows which have left the herd. If this is the case, it will be noted in the discussion of that category. Cows designated C (reproductive cull) for reproductive status are excluded from the Reproductive Summary of Total Herd unless noted in the discussion of that item. Days Open at 1st Service divides all cows in the herd that have been bred at least once into three categories; open fewer than the VWP (voluntary waiting period) days, open VWP-100 days, and open over 100 days. The categories as summarized for lactations 1, 2, 3+ and all lactations. The % of All 1st Services is calculated by dividing the number on the all lactations line by the total number of 1st services for the herd. The goal set for days to first breeding as well as the effectiveness of heat detection in the herd will affect the distribution of cows in these groups. In herds where heat detection is a high priority, larger percentages of cows will be open 100 days or less at first service. Avg. Days to 1st Service is calculated by summing the days to first service for all cows in each category which have been bred at least once. The sum is divided by the number of cows with first services in that category to obtain the average. Avg. Days to 1st Service is affected by heat detection, VWP prior to first service, and the reproductive health of the herd. Services Per Pregnancy - Preg. Cows includes all pregnant cows. Cows that left the herd in the last nine months are also included if they were diagnosed or assumed pregnant. The numerator is the total number of services and the denominator is the number of pregnant cows. Services Per Pregnancy - All Cows includes all services more than 64 days before test day plus services for cows bred in the last 64 days which have been diagnosed pregnant or open. Cows left herd in the last nine months are also included. Only services for the current lactation of each cow are summarized. The numerator is the total number of services in the evaluation period. The denominator is the number of pregnant cows. Projected Minimum Calving Interval and Projected Minimum Days Open include cows with breeding dates and cows without breeding dates that are in milk longer than the VWP. The days open for cows with breeding dates are determined using the last breeding date. Days open for cows without breeding dates and in milk longer than the VWP are computed as the greater of: a) days open as of test day plus 10 days or b) average days to 1st service for total herd Projected Minimum Days Open is the average days open based on days open calculations described above. Projected Minimum Calving Interval is calculated as: [(Av. Days Open days) /30.4] days where 280 days is the average length of gestation and 30.4 is the average length of a month.
11 4b. Reproductive Summary of TOTAL Herd 11 Current Actual Calving Interval includes cows with two reported calvings. The interval is calculated as [(Average number of days between calvings)/30.4)]. Service or Heat Intervals provides a summary of all service or heat intervals for cows currently in the herd. This summary is based on all intervals for each cow. For example, a cow with two reported heat dates and three breeding dates would have four intervals included in the summary. All breeding and heat dates must be reported for this section to be accurate. Four service/heat interval length categories are listed: less than 18 days, days, days, and all other intervals. Most normal heat cycles will be from days. Intervals less than 18 days can indicate reproductive problems such as cystic ovaries, inadequate heat detection or use of prostaglandin. Intervals of days indicate that one heat was not observed. Service or heat intervals in the other category are likely to be associated with two or more missed heats, or with abnormal heat cycles, or with the use of prostaglandin. DHIA members who receive the DHI-210 (Monthly Report) can monitor the last service or heat interval length by referring to the Intvl. Days column on the DHI-210 form. Services For Past 12 Months is a summary by 1st service, 2nd service, 3rd and later service and all services. The summary includes all breedings on cows left herd in the last 9 months and all breedings on cows coded as reproductive culls (C). Number of Services is determined by adding all monthly services shown in the Yearly Reproductive Summary of the DHI-202 for months with % successful printed (usually all but last 2 test dates). The number of services listed for the month dropped this test period and the month dropped last test period (refer to last month s DHI-202) are added to the total. Example: =308 where 14 equals the services from the month dropped and 11 equals the services from the month dropped on last month s DHI-202. % Successful is the number of successful services in each category divided by total services in that category multiplied by 100. Service Sire Merit$ for each category is the average Merit$ for all services to proven sires. Abortions Actual - This Month includes all observed abortions (status code 8) reported this test period. Apparent - This Month includes cows rebred or diagnosed open following a diagnosed pregnancy Actual and Apparent Abortions -Past Year is the sum for the most recent 12 months. NOTE: Herd must be on routine pregnancy checking for abortions to be summarized.

12 12 4c. Yearly Reproductive Summary 4c. Yearly Reproductive Summary This section is designed to provide a current, up-to-date review of herd reproductive information for the past year. Services on cows that left the herd during the past year and services on cows coded as reproductive culls are included in this summary. 4c Month Dropped is labeled on the top line of this summary. Normally this is one test day. However, if the test schedule was irregular, Month Dropped could be blank or it could represent two test periods. Values in the Month Dropped line allow comparisons between current reproduction and reproduction a year ago. The "Yearly Reproductive Summary" is recalculated for the most recent six test intervals up to 200 days. This improves the accuracy of prior test day records in the event that reproductive data are added or deleted after the test interval in which they occurred. % of Heats Observed for each test period is an indication of the success of heat detection in the herd. This percentage is calculated as follows: % Heats Obs. = [number of services and heats in the test period for eligible cows / (estrous cycle days in test period for eligible cows / 21)] x 100. Eligible cows are defined as all cows past the VWP which are contributing to estrous cycle days in the test period. Estrous cycle days for eligible cows are calculated as follows: a) Cows with no service date or cows diagnosed open - eligible days are calculated as the number of days past the VWP in this test period. b) Cows bred but not diagnosed pregnant or open - eligible days in the test period are determined as: Eligible days = days in test period through the last service + [days in test period after the last service x (1 - (yearly % successful / 100))] c) Pregnant cows - eligible days would be the days in the test period up to the successful breeding date. Pregnant cows would only contribute eligible days in cases of unusually long test intervals. At best, approximately 80-85% of all heats will be detected visually. A recommended goal is to service greater than 70% of possible breedings. % Successful is the number of successful services in each test period divided by the total number of services for that test period. Percent successful is not computed for the two most recent test periods since pregnancy status on most of these breedings has not been determined. For herds on routine pregnancy, a reported pregnancy diagnosis is used to determine percent successful. For herds not reporting pregnancy diagnosis, 65 day non-return is used. Pregnancy Rate is the percentage of cows eligible to become pregnant that are reported pregnant in a specific period of time. It is a measure of how quickly cows have conceived and it accounts for both heat detection and conception rate. The assessment begins at the end of the VWP after calving and evaluates each 21-day period for eligible cows to determine the percent of cows that became pregnant. Every 21- day period for a cow that lapses without a pregnancy reduces the herd s Pregnancy Rate. Thirteen to 14 percent is the national average Pregnancy Rate. Number Services is the number of services reported during that test period.


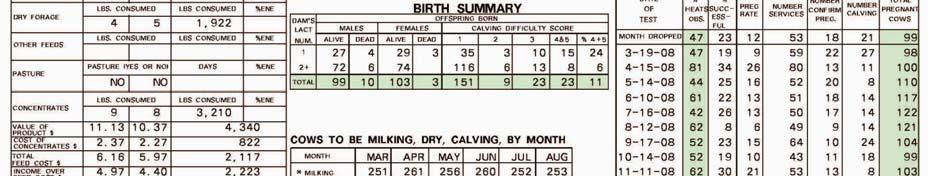
13 5. Birth Summary, 6. Cows to be Milking, Dry, Calving by Month 13 Number Confirmed Pregnant represents the outcome of pregnancy exams conducted during that test period. Only cows with a P reported will be included in this number. Results of pregnancy diagnoses must be accurately reported for this to be a valid summarization. Number calving is the reported number of calvings during that test period. Total Pregnant Cows is the total number of pregnant cows on that test day. In herds on routine pregnancy check, this is all cows in the herd with a P reported. In non-pregnancy check herds, this number represents cows with a P reported plus cows bred 65 days or more before test day. 5. Birth Summary summarizes the 5 number, sex, and mortality of calves born in the last year by lactation 1st land 2nd and later lactations. The calving difficulty score, if reported, is also summarized for each group on a scale from 1 to 5: 1=No problems, 2=Slight problem, 3=Needed assistance, 4=Considerable force used, and 5=Extreme difficulty. The percent of births with a difficulty score of 4 and 5 is also listed. Calving ease information may be used to evaluate the effectiveness of selecting the best calving ease sires for heifers and smaller cows. With all types of dairy records, the output is useful only if the input is complete and accurate. For this section to provide information that will be most useful to the producer, technicians and producers must report breeding and calving information correctly and promptly. Getting more national information about the relationship between sires and calving ease is important and should provide useful information to individual dairy producers Cows To Be Milking, Dry, Calving By Month is an eight-month projection for all cows in the herd. Cows are included in this summary according to the following conditions: 1) Cows in milk on test day with no due date are assumed to be milking all eight months. 2) Cows dry on test day without a due date will be dry for the entire eight months. 3) Cows with due dates after the 15th of a month are assumed dry for that entire month and the previous month. 4) Cows with due dates on or before the 15th of a month are assumed milking that entire month and dry the previous two months. 5) Cows to Calve are cows with due dates that month. These cows are included in the number milking if they are due on or before the 15th of the month and in the number dry if they are due after the 15th of the month. 6) Heifers to Calve in the next eight months are summarized for herds enrolled in the Heifer Calf Management option (DHI-214). All heifers due to calve that month will be included in the number milking. This summary estimates numbers of cows in milk after accounting for the % per month culling rate for the herd. This figure is calculated by dividing by 12 the annual % cows left herd figure. The example herd has an average yearly culling rate of 36% (3% per month). Therefore, the projected number of cows to be milking is reduced by 3% the first month, 6% the second month, etc. to reflect the expected effect of normal culling.

14 14 7. Stage of Lactation Profile 7. Stage of Lactation Profile divides 7 the milking herd into five groups based on days in milk for the current lactation: 40 days or less, 41 to 100 days, 101 to 199 days, 200 to 305 days, and 306 days and greater. First lactation cows, second lactation cows and third and later lactation cows are summarized separately within each stage of lactation group. Number of Milking cows, Average Daily Milk Production, % Fat, % Protein, Average SCC Score or Weighted Actual SCC and SCC Scores > 3.9 or 200,000 are listed for each group. Milk production trends across stage of lactation can indicate if the herd is following a normal lactation curve. Milk production should peak in the second stage of lactation ( days) with a gradual decline as days in milk increase. Production by stage of lactation can be compared with similar values from previous DHI-202 Herd Summaries. The effects of changes in management conditions (such as change in the feeding program) can be determined from these comparisons. The number of cows in each stage of lactation group should be considered. A small number of cows may yield an unrepresentative average. % Fat and % Prot are listed together to allow comparisons between the two components. Nutrition will have a high influence on these values, and an abnormal inversion may indicate a metabolic disorder. Producers should consult their veterinarian or nutritionist when a high degree of abnormal inversions exist or if any values are abnormally low. Average SCC Score or Weighted Actual SCC and SCCS > 3.9 or 200,000 by stage of lactation can help you monitor somatic cell count across stage of lactation. Increases in the somatic cell count are associated with decreases in milk production. For each 1 unit increase in SCC Score, daily production per cow is expected to decrease by 0.8 lb. for first lactation cows and 1.4 lb. for second and later lactation cows. Mastitis control can be partially evaluated with the data in this section of the summary and this information should be used in conjunction with the monthly somatic cell count report for the herd. There are several trends to watch for such as the pattern of counts, are high counts found in early or late lactation, or whether there is no pattern at all. The number and percent of cows over 3.9 or 200,000 does not necessarily represent new infections in the herd. First lactation cows should have lower SCC scores than older cows. Lowest SCC scores generally will be found early in lactation. High SCC scores after calving may be caused by ineffective dry cow therapy and/or poor environmental conditions in the maternity area. Increases in SCC score can be due to faulty milking equipment, improper milking techniques and/or poor environmental conditions.

15 8a 8 8. Identification and Genetic Summary 15 8b 8. Identification and Genetic Summary provides the dairy producer with a comprehensive summary of the completeness of identity of the replacement and milking herd as well as a genetic profile of the herd. 8a. Identification Summary gives an age and identity summary of all the recorded animals in the herd. This is an excellent way to verify replacement and producing animals' numbers on the farm with the numbers recorded. For replacements, there are two Age Group categories plus a total number line. In addition, the milking animals are categorized by lactation number as well as total number for all lactations. Average Age Yr-Mo indicates the average age in years and months for each age group category for replacements and is the average age at last freshening for cows. The key figure to monitor in this section is average age of first lactation animals. The goal for this is 24 months. Numerous research trials have indicated that when heifers calve with adequate body size at 24 months of age, it increases lifetime productivity and there is more production per day of life and more replacements. Delaying calving beyond the 24 month age goal costs over $1/day or more than $30 per month in lost herd income for every unit beyond the goal. The tendency is for the high producing, well managed herds to have younger herds as older cows are being culled and replaced with genetically superior heifers. Number Identified indicate the number of replacement and producing females with identified sires and dams. These data are interpreted in a manner similar to that of the age and number data. Number ID Changes is a tabulation of all identification changes which were reported after the second test date following a cow's entry into the herd including: cow, sire or dam identity; cow, sire or dam breed; or date of birth. % Identified Producing Females is indicated at the bottom of the column. Valid identification for sires, such as registration number, NAAB code or eartag, must be reported in order to be considered as identified. Sire name is not sufficient identification. A low percentage of identified animals indicates the need for improved animal identification to enhance the accuracy and usefulness of the DHI records. % Heifers IN 13+ Age Group over 30 Months of Age is indicated at the bottom of the column. 8b. Genetic Summary No. Animals with Merit $ indicates the number of animals in each age category that have a value calculated. At least 25% of the herd must have sires with Merit $ values reported for average Merit$ of sires to be calculated. Sires with no available Merit$ are not included in the average. Average Merit $ for animals in the herd and their sires are reported. These estimates are calculated by AIPL (Animal Improvement Programs Laboratory at USDA, Beltsville, MD) using the Animal Model method. Genetic progress in a herd is evidenced by an increase in cow and sire Merit$ from younger to older cows. If genetic trend is progressing, the youngest cows in the herd should have the highest Merit$ values. The highest Merit$ for sires should be for current service sires.
. Codes are FM (milk and fat), CM (cheese yield) or NM (milk, fat and protein).")

16 16 8b. Genetic Summary, 9. Production By Lactation Summary Herd Merit $ Option indicates whether a herd chooses bulls based on MFP (milk, fat and protein), MF (milk and fat) 8b or CY (cheese yield). The Herd Merit $ option is reported by your DHI Technician in your herd options (#74). Codes are FM (milk and fat), CM (cheese yield) or NM (milk, fat and protein). Information reported in the Genetic Profile of Service Sires and in the average Merit $ values for cows and sires of cows will be consistent with the Herd Merit$ Option. PTA values and percentile rankings for bulls will differ depending on the option chosen. PTA$ reflect the gross dollar income per lactation that future daughters of bulls will earn in excess of herdmates sired by bulls having a PTA$ equal to zero. Genetic Profile of Service Sires summarizes information on Proven A.I. Sires, A.I. Young Sires and All Other Sires used in the herd. All Other Sires generally includes herd bulls and young sires in private sampling programs. The percent of the herd bred to proven sires, young sires or other sires is reported in addition to the number of bulls used in each category. Dairy farmers should maximize the use of proven and young sires and discontinue use of herd bulls in order to maximize genetic progress. The average Merit $ for proven sires and young sires is reported. If All Other Sires includes one or more proven sires, the average Merit $ of these proven sires will be printed. The number of proven sires will be indicated in parentheses in the margin. The Avg. Percentile Rank Net Merit is also summarized for each group so that merit of service sires can be evaluated. Percentile ranking is based on net merit $. Generally, herds should use sires ranking in at least the 80th percentile. DCR Mlk is the Data Collection Rating for milk and is an indication of the accuracy of lactation records from a wide variety of test plans. The squared correlation of estimated and true yields is multiplied by a factor to give monthly testing a rating of 100 and daily testing a rating of 104. DCR is computed as soon as 305 days have lapsed. The herd average DCR is the average of all cows that qualify for inclusion in genetic analysis. For more details, go to NOTE: For this summary to accurately reflect the A.I. breeding program in the herd, A.I. sires must be reported using their registration number or uniform NAAB code number. A.I. sires reported using their code name will be summarized under All Other Sires. 9. Production by Lactation Summary is listed for first lactation, second lactation, third and later lactation, and all lactations. 9
17 9. Production by Lactation Summary 17 Number of Cows listed for all lactations will equal total cows in the herd on test day. Average Age is computed by including all cows with reported calving dates. An estimated birth date is used for new cows which entered without a birth date. Avg Age Mon. gives the age in months for each lactation group and for all lactations. Peak Milk is the highest test day milk production that has occurred in a cow s lactation and is listed for each lactation group as well as for all animals. The peak is calculated after 100 days in milk and does not include any days after 305 days. Summit Milk is the average of the two highest of the first three test days production and is listed for animals by lactation number and for all animals. Only cows that have calved in the last 365 days are included. Reviewing these values along with the information in the Stage of Lactation Profile (Section 7) can indicate the level of the nutrition program for dry cows and the lactating herd. Cows peaking low and/ or early can be a sign of inadequate nutrition, whereas cows peaking later in lactation, but at high levels is seen in herds receiving BST or some form of added fat. An increase of one pound in summit performance usually will relate to pounds of increase in Rolling Herd Average. Projected ME 305 Day Milk, Fat and Protein for all cows with projected 305 day mature equivalent (ME) records printed on the DHI-200, 210, 211, 220 and 225 (Monthly Report) are added and averaged. Cows fresh less than 50 days, cows in milk more than 50 days and with only one valid test day milk weight for the current lactation, or cows with no reported calving date are excluded from this calculation. Projected ME 305 Day averages allow comparisons of production of first lactation cows and older cows on an age-adjusted basis. Generally, average projected ME 305 day production of first lactation cows will be lb. less than the average for second and later lactation cows. Although the average PTA of sires of first lactation cows may be higher, second and later lactation cows have been culled more heavily. Relatively large differences in average projected ME production may be due to significant differences in genetic and/or management factors. Difference from Herdmates Milk, Fat and Protein for all cows with a value printed on the DHI-200 and 220 are added and averaged. This is the number of pounds that the cow s current 305-2X-ME record compared to the average of the herdmates adjusted for record in progress. Herdmates are those cows of the same breed and calving season. There are two calving seasons (November to May and June to October). Body Weight is computed from individual cow body weights reported when the cow s calving date is reported. Cows entering the herd without body weights are estimated using the following: Breed 1st Lact 2nd Lact 3rd or Later Lact Ayrshire Guernsey Holstein Jersey Brown Swiss All Others Dairy Goats


18 Current SCC Summary, 11. Dry Cow Profile, 12. Yearly Summary Entered & Left 10. Current Somatic Cell Count Summary provides a herd 10 analysis for milk quality and mastitis/udder health. Herd Production Lost From SCC This Test Period indicates the expected loss of milk and income due to the somatic cell count for the entire herd. These dollar values are based on research relating to production losses due to subclinical mastitis in relation to the somatic cell count. They do not include any quality premiums lost by the herd as a result of high cell counts. % Cows SCC Score - the % of first lactation, second lactation, third and greater lactation cows, and all cows in each of five somatic cell count score categories (0-3, 4, 5, 6, 7-9) are listed. At least 25% of the milking cows must have somatic cell counts reported for this section to print. A large proportion of the herd should have SCC scores of 3 or less. A recommended goal is for 70% or more of first lactation cows to have scores 0 to 3 while 55-60% of the entire herd should be in this category. No more than 7-8% of the entire herd should have an SCC score of 6 or greater. Dairy producers need to evaluate milking equipment, milking procedures and/or environmental conditions when relatively high percentages of cows score at SCCS 6 or higher. 11. Dry Cow Profile includes the number of dry periods and average days dry for the last completed dry period for all cows in the herd. Information on second, third 11 and later lactations is reported, as well as an average for all lactations. The dry periods are grouped by length: dry fewer than 40 days, dry days, and dry over 70 days. The length of the dry period has a significant effect on the subsequent lactation. Cows dry fewer than 40 days or more than 70 days tend to produce less milk during the next lactation than herdmates that are dry an optimum of days. 12. Yearly Summary of Cows Entered and Left the Herd is a measure of herd turnover and herd replacement. The yearly 12 period is comprised of the test periods printed in the Yearly Production and Mastitis Summary of the DHI-202 (number of test periods closest to 365 days). Total cows in the herd on the current test day are used to calculate the % of cows entering and leaving the herd. Voluntary culling of low production cows and cows sold for dairy purposes (first two categories) are the most desirable reasons for culling. When large numbers of cows are culled for involuntary reasons (reproductive failure, mastitis, udder, poor feet and legs, injury, disease or death), voluntary culling is limited. Cow turnover for reasons other than low production or dairy purposes should be minimized.
19 13. Yearly Production and Health Summary Yearly Production and Mastitis Summary is designed to provide an up-to-date review of herd information for the past year. Comparison of all tests conducted during the year can be made and changes noted. Most items included in this section have been discussed previously. More detailed explanations are in Item 2a. Date of Test - the top line of this column is labeled Month Dropped. Normally this is one test day. However, if the test schedule was irregular, Month Dropped could be blank or it could represent two test periods. Values in the Month Dropped line allow comparisons between current production and production a year ago. Averages are printed on the bottom line for most items (except Rolling Herd Averages). They are computed as unweighted averages for all items in the test period listed. No adjustments are made for the length of each test period. Days in Test Period are determined as the period beginning on the day after the previous test and ending on the current test date. Number of Cows in Herd on Test Day is the total number of cows on the DHI-201 (Barn Sheet) for each test day minus the number of cows that left the herd during the test period. Test Day Averages (Milking Cows) includes a column for Days in Milk, which is the average days in the current lactation for each cow in milk on test day. This figure provides a measure of the average stage of lactation of the herd. Test Day Averages (Milking Cows) tend to decline as average days in milk increase. The average pounds of milk for milking cows is also listed. Standardized 150 Day Milk is designed to provide a comparison of test day production of the milking cows from one month to the next after standardizing to a common days in milk (150 days). Regional lactation curves for breed, lactation number and season of calving are used to adjust each cow s test day milk production to her expected production assuming she was 150 days in milk on test day. The standardized production values are computed and averaged for all cows in milk 330 days or less. Standardized 150 day milk is an excellent tool for monitoring the effect of feeding and management changes. Test Period Persistency Index provides a means to determine if the herd produced as expected during the current month based on the previous month s production. Each cow s expected % change in production from last month to this month is computed as the ratio of each cow s standardized 150 day milk for the last two test days. An average ratio is computed to determine the test period persistency for the herd. A Test Period Persistency Index of less than 90 may indicate that changes in management practices had a negative effect on herd production. Index values over 110 may be due to favorable management or feeding changes during the past month causing herd
 report average milk production, fat % and protein % for all cows in the herd, including dry cows. The % of cows in the herd in milk on test day is also reported.")
20 Yearly Production and Health Summary 13 production to be above the normal expected level. Test Day Averages (All Cows) report average milk production, fat % and protein % for all cows in the herd, including dry cows. The % of cows in the herd in milk on test day is also reported. Rolling Yearly Herd Average for milk, fat and protein for each test period in the past year are listed. A detailed description of the Rolling Herd Average calculation is in section 2b. Somatic Cell Count Summary includes the % of cows in each of the five SCCS categories (see item 10). The Average SCC Score is calculated as an unweighted average of SCC scores of milking cows on test day. The Actual SCC reported is a weighted average actual somatic cell count to the nearest This information is a valuable tool for dairy farmers in monitoring the udder health of the herd. The trend in Average Somatic Cell Counts should be observed each month. Large increases may indicate faulty milking equipment, improper milk practices and/or poor environmental conditions. These items should be examined as possible reasons for an increasing SCC Score. Number Left Herd includes the number of cows died or sold during each test period. Test Period Average Milk Lbs. Added and Test Period Average Milk Lbs. Dropped should be used to evaluate changes in the Rolling Herd Average for milk. An explanation of the use of test period averages in calculating the Rolling Herd Average is given in section 2b.
Placing: 1 st 2 nd 3 rd 4 th
 2012 North Dakota FFA Convention Pedigree Evaluation [50 points] Given the following scenario, place the attached four (4) pedigrees in the order best suited to meet the long term goals of the purebred
Herd Summary Definitions
 Herd Summary Definitions The Herd Summary is the primary source of AgSource DHI information on herd level milk production, reproduction, genetics and inventory. Individual cow data is found in AgSource
MONTHLY HERD SUMMARY REPORT
 MONTHLY HERD SUMMARY REPORT Monthly Herd Summary Report Monthly Herd Summary Report Monthly Herd Summary Report Monthly Herd Summary Report Monthly Herd Summary Report Monthly Herd Summary Report Report
DHI Report Options. August Dairy Records Management Systems
 DHI Report Options August 2009 Dairy Records Management Systems 2 Table of Contents Adding or Deleting Herd Options...4 HERD OPTIONS 15 Days to Stand Dry...5 17 Days Before 1st Breeding (Voluntary Waiting
COW PRODUCTION MONTHLY REPORT
 COW PRODUCTION MONTHLY REPORT Report objectives to provide individual cow identification, age, calving and lactation number information; to provide individual cow current test day milk weights and milk
CULLING: REPLACEMENT HEIFER STRATEGIES
 CULLING: REPLACEMENT HEIFER STRATEGIES David B. Fischer TAKE HOME MESSAGES Reducing herd culling rate and heifer mortality rate by 5 percent will increase surplus replacements by 30 percent per 100 cow
DAIRY CATTLE EVALUATION CAREER DEVELOPMENT EVENT
 DAIRY CATTLE EVALUATION CAREER DEVELOPMENT EVENT 1. reeds of dairy cattle that may be used in this CDE include Ayrshire, rown Swiss, Guernsey, Holstein, Jersey and mixed breeds. Only one class may be mixed
4-H Dairy Project Record Dairy Cow
 4-H Dairy Project Record Dairy Cow Name: Age as of Jan 1: Year in Project: This project is: Ownership Managerial Year in 4-H: Junior Ldr: Yes No Date this project started: Date project or project year
Reproductive Management of Commercial Beef Cows. Ted G. Dyer, Extension Animal Scientist
 Reproductive Management of Commercial Beef Cows Ted G. Dyer, Extension Animal Scientist Reproductive efficiency has long been recognized as the most important aspect of commercial beef production. If only
MANAGING THE REPLACEMENT HERD
 MANAGING THE REPLACEMENT HERD David B. Fischer TAKE HOME MESSAGES Quantity, Quality and Timing of colostrum intake is critical to improving calf survival and proper heifer growth. Monitoring heifer growth
REDUCED AGE AT FIRST CALVING: EFFECTS ON LIFETIME PRODUCTION, LONGEVITY, AND PROFITABILITY
 Dairy Day 2004 REDUCED AGE AT FIRST CALVING: EFFECTS ON LIFETIME PRODUCTION, LONGEVITY, AND PROFITABILITY M. J. Meyer 1, R. W. Everett 1, and M. E. Van Amburgh 1 Summary The primary advantages of reducing
11/30/2018. Introduction to Genomic Selection OUTLINE. 1. What is different between pedigree based and genomic selection? 2.
 Introduction to Genomic Selection imagefriend.com OUTLINE 1. What is different between pedigree based and genomic selection? 2. Selection tools - Selection Indexes - Genotyping resources 3. DNA-based markers
Economic Impact of Bull Choices... A.I. Or Otherwise
 Economic Impact of Bull Choices... A.I. Or Otherwise By Dr. Ben McDaniel Animal Science Department North Carolina State University P.O. Box 7621 Raleigh, NC 27695-7621 919-515-4023 fax 919-515-7780 Email:
An Economic Comparison of AI and Bull Breeding
 An Economic Comparison of AI and Bull Breeding Mike Schutz, Ph.D. Assistant Professor and Dairy Extension Specialist Department of Animal Sciences Purdue University Decline in AI Usage Lack of trained
Section 5: Production Management
 Introduction Lessons included the Production Management section of the elearning tool: Lesson 1: Market Steer Management...94 Lesson 2: Herd Sire Management...96 Lesson 3: Cow & Heifer Management...98
What dairy farmers should know about genetic selection
 52nd Florida Dairy Production Conference 9 Gainesville, FL, April 6, 2016 Francisco Peñagaricano Department of Animal Sciences University of Florida Genetic selection decisions one of the most important
TAKE HOME MESSAGES Illinois Parameter < 18,000 18,000 22,000 > 22,000
 TAKE HOME MESSAGES Average days open for the top, middle and bottom third of Illinois dairy herds on DHIA in September 2000 were 172, 186 and 204 days, respectively. At a cost of $2.00 per day open after
Dairy Reproduction Benchmarks. J.W. Smith, W.D. Gilson, L.O. Ely and W.M. Graves Animal and Dairy Science Department
 Dairy Reproduction Benchmarks J.W. Smith, W.D. Gilson, L.O. Ely and W.M. Graves Animal and Dairy Science Department Dairy Reproduction Benchmarks Table of Contents Introduction...3 Methods...3 Figure 1:
Dairy Production and Management Benchmarks
 Cooperative Extension Service The University of Georgia College of Agricultural and Environmental Sciences Dairy Production and Management Benchmarks Table of Contents Introduction... 3 Methods... 3 Rolling
Increasing Dairy Efficiency. THIS PUBLICATION IS OUT OF DATE. For most current information:
 5o F Increasing Dairy Efficiency EM 8350 / September 1987 Oregon State University Extension Service INCREASING DAIRY EFFICIENCY N.J. Gamroth To meet the challenge of declining net incomes, dairy farmers
Profitable Dairy Cow Traits for Future Production Circumstances
 Profitable Dairy Cow Traits for Future Production Circumstances Albert de Vries, Ph.D. Department of Animal Sciences University of Florida Gainesville, Florida, USA 57 th Annual Meeting of the European
Are We Drowning in Data?
 Are We Drowning in Data? Which Metrics Should I Monitor? Randall Greenfield 2013 Vita Plus Dairy Summit 1 DHM, 9/30 70 Data Points/Lacta on 7,000 Data Points/Lactation 2 Drowning in Data? More Sophisticated
Long Calving Seasons. Problems and Solutions
 DIVISION OF AGRICULTURE R ESEARCH & EXTENSION University of Arkansas System Agriculture and Natural Resources FSA3011 Long Calving Seasons: Problems and Solutions Tom R. Troxel Professor and Associate
Herd Management. Lesson 4: Herd Management. Figure Parallel Milking Parlor. Production Costs
 Herd Management Lesson 4: Herd Management Figure 4.2 - Parallel Milking Parlor Dairy herd management is an important part of dairy production. Dairy operations require a large investment and usually operate
2/22/2012. Impact of Genomics on Dairy Cattle Breeding. Basics of the DNA molecule. Genomic data revolutionize dairy cattle breeding
 Impact of Genomics on Dairy Cattle Breeding Bennet Cassell Virginia Tech 2012 VSFA/VA Tech Nutrition Cow College Genomic data revolutionize dairy cattle breeding Accuracy of selection prior to progeny
Mike Davis, The Ohio State University 6/19/14
 2014 Beef Improvement Federation Meeting! The optimum beef cow is indeed an elusive beast. I have searched for her for more than 20 years, and have come up empty handed. But I believe I m getting close.!
HERD REPLACEMENTS: HEIFERS OR OPEN COWS?
 HERD REPLACEMENTS: HEIFERS OR OPEN COWS? J. F. Baker Coastal Plain Experiment Station University of Georgia INTRODUCTION It is common to find opinions, rules of thumb or suggestions for livestock operations
CHALLENGES FOR IMPROVING CALF CROP
 CHALLENGES FOR IMPROVING CALF CROP J. N. Wiltbank Animal Science Department Brigham Young University Several authors have stated that reproductive performance is the most important economic trait in a
Short Forage What to Do? Options Available Using an Example Herd
 Short Forage What to Do? Options Available Using an Example Herd By: Donna Amaral-Phillips, Ph.D. With the dry conditions this past summer, several farmers have been left with tight or short forage supplies.
Development of an Economic Breeding Index EBI for Ireland. Ross Evans (ICBF)
") Development of an Economic Breeding Index EBI for Ireland Ross Evans (ICBF) ICBF Strategy for increasing profit for Irish dairy farmers Maintain a comprehensive database of Irish animal performance information
Development of an Economic Breeding Index EBI for Ireland Ross Evans (ICBF) ICBF Strategy for increasing profit for Irish dairy farmers Maintain a comprehensive database of Irish animal performance information
DAIRY & DAIRY GOAT PROJECT RECORD
 4HDGR01 DAIRY & DAIRY GOAT PROJECT RECORD Name Parent s Name Mailing Address Zip Age Jr. or Sr. Month, Day, Year of Birth Grade in School Name of School Name of 4-H Club Name of 4-H Leader Name of 4-H
Genomic Management: Impact on Sustainability
 Genomic Management: Impact on Sustainability David C. Thorbahn, Select Sires Inc. 1 Definition of Sustainability: the ability to survive, be sustained, be supported, or confirmed the quality of not being
Culling and Replacement Strategies. Stable to declining herd. Under the magnifying lens 2/20/2012. Matt Lippert Wood Co.
 Culling and Replacement Strategies Matt Lippert Wood Co. Agriculture Agent Stable to declining herd Since 1946 long term trend is the same or fewer cows No need to grow the herd, only replace Under the
Real-Life Implementation of Controlled Breeding Season
 Real-Life Implementation of Controlled Breeding Season T. R. Troxel, Ph.D. Professor and Associate Department Head, Animal Science, University of Arkansas, Little Rock, AR Story in Brief Reducing the length
COW HERD REPLACEMENT. John Dhuyvetter NCREC NDSU Extension
 COW HERD REPLACEMENT John Dhuyvetter NCREC NDSU Extension Cow Ownership Costs Cow Longevity Culling Reasons and Rates Depreciation-Replacement Cost Replacement Strategies Raising or Buying Replacements
THE EFFECTS OF CONDITION SCORE ON THE PERFORMANCE OF EARLY LACTATION HOLSTEIN COWS
 THE EFFECTS OF CONDITION SCORE ON THE PERFORMANCE OF EARLY LACTATION HOLSTEIN COWS Mike McCormick, Associate Professor, Southeast Research Station Dennis French, Professor, Veterinary Science Department
Establishment of a Single National Selection Index for Canada
 Establishment of a Single National Selection Index for Canada Brian Van Doormaal, Gerrit Kistemaker and Filippo Miglior Canadian Dairy Network, Guelph, Ontario, Canada Introduction Ten years ago, in 1991,
More Feed = More Milk. Dry Matter Intake Used To Express Feed. Intake ASC-135. Donna M. Amaral-Phillips, Roger W. Hemken, and William L.
 More Feed = ASC-135 More Donna M. Amaral-Phillips, Roger W. Hemken, and William L. Crist Feed intake governs the amount of each nutrient a cow receives and the amount of milk she can potentially produce.
Culling the Commercial Cow Herd: BIF Fact Sheet
 1 of 6 10/26/2009 1:52 PM University of Missouri Extension G2036, Reviewed October 1993 Culling the Commercial Cow Herd: BIF Fact Sheet John Massey Department of Animal Sciences Beef cow owners should
Proceedings, The State of Beef Conference November 4 and 5, 2014, North Platte, Nebraska BEEF PRODUCTION WITHOUT MATURE COWS
 Proceedings, The State of Beef Conference November 4 and 5, 2014, North Platte, Nebraska BEEF PRODUCTION WITHOUT MATURE COWS George E. Seidel, Jr. Colorado State University Summary Mature beef cows must
FEEDING AND MANAGING EARLY LACTATION COWS. J.R. Dunham. Summary
 13 FEEDING AND MANAGING EARLY LACTATION COWS J.R. Dunham Summary Feeding and managing dairy cows during the prepartum and early lactation periods have more effect on total lactation yields than all other
MILK. U.S. daily milk production is million gallons. Youth across the nation drink % of all milk consumed. oldest
 Dairy Production Objectives A. Explain the importance of the dairy industry; B. Define terms associated with dairy production C. List 7 breeds of dairy cattle & their breed characteristics; D. Label the
Dairy Project Records
 Dairy Project Records ANIMAL SCIENCES DAIRY *Use Dodge County Dairy Youth Project & Activities Handbook that you received with your literature for Record Book Dairy information. Sample pages of each required
Selecting and Sourcing Replacement Heifers
 Selecting and Sourcing Replacement Heifers 10 to 20% of a cowherd is replaced annually. Approximately 30% of weaned heifers are needed for replacement Additional heifers are needed for expansion Heifers
Beef Cattle Handbook
 Beef Cattle Handbook BCH-5403 Product of Extension Beef Cattle Resource Committee Feeding The Beef Cow Herd Part II Managing the Feeding Program Rick Rasby, Extension Beef Specialist, University of Nebraska
Using EPDs in a Commercial Herd
 Using EPDs in a Commercial Herd R. R. Schalles and K. O. Zoellner Department of Animal Sciences and Industry Kansas State University Manhattan, KS 66506 Today, beef cattle producers have the best tools
A COMPARISON OF BEEF CATTLE BREEDING METHODS TO IMPROVE PERFORMANCE. D.G. Landblom and J.L. Nelson
 A COMPARISON OF BEEF CATTLE BREEDING METHODS TO IMPROVE PERFORMANCE D.G. Landblom and J.L. Nelson Artificial insemination has been promoted for a number of years as being one management tool available
Body Condition: Implications for Managing Beef Cows
 Agdex 420/40-1 Body Condition: Implications for Managing Beef Cows Body condition, or the amount of body fat an animal is carrying, is one management indicator that can be used to predict herd fertility
Big Data, Science and Cow Improvement: The Power of Information!
 Big Data, Science and Cow Improvement: The Power of Information! Brian Van Doormaal, Canadian Dairy Network (CDN) Building a Sustainable Dairy Industry, DFC Symposium November 7-8, 2017, Ottawa Our Product
What s Driving Dairy Profitability. Greg Bethard, Ph.D. GPS Dairy Consulting, LLC Blacksburg, VA
 What s Driving Dairy Profitability Greg Bethard, Ph.D. GPS Dairy Consulting, LLC Blacksburg, VA gregbethard@gpsdairy.com Concepts Benchmarking is a bad idea Goal Setting and tracking makes a lot of sense
Understanding Results
 Understanding Results CLARIFIDE is a DNA-marker-based technology that provides a comprehensive genetic evaluation of each animal. CLARIFIDE is a 3,000-marker panel (3K) that delivers as many as 30 production,
COMPARISON OF BREEDING SYSTEM COSTS FOR ESTRUS-SYNCHRONIZATION PROTOCOLS PLUS ARTIFICIAL INSEMINATION VERSUS NATURAL SERVICE
 Cattlemen s Day 2003 COMPARISON OF BREEDING SYSTEM COSTS FOR ESTRUS-SYNCHRONIZATION PROTOCOLS PLUS ARTIFICIAL INSEMINATION VERSUS NATURAL SERVICE S. K. Johnson, S. L. Fogleman, and R. Jones Summary Breeding
Canadian Hereford Association
 Canadian Hereford Association Pan American Hereford Cattle Evaluation Fall 2017 EPD Averages, Tools and Trends Includes: Introduction to Genomically Enhanced EPD Post-Weaning Gain EPD Residual Feed Intake
Growth. Monitoring Dairy Heifer COLLEGE OF AGRICULTURAL SCIENCES
 Growth Monitoring Dairy Heifer COLLEGE OF AGRICULTURAL SCIENCES Growth Monitoring Dairy Heifer INTRODUCTION Raising dairy heifers to an adequate size and with an age at first calving between 22 and 24
Farm Management Decisions in the Era of Genomics
 Farm Management Decisions in the Era of Genomics Brian Van Doormaal and Gerrit Kistemaker Canadian Dairy Network, Guelph, Ontario. E-mail: Brian@cdn.ca Take Home Messages Genomics has had a major impact
2010 North Dakota FFA Convention. Pedigree Evaluation. [50 points]
![2010 North Dakota FFA Convention. Pedigree Evaluation. [50 points]](/thumbs/80/80504175.jpg "2010 North Dakota FFA Convention. Pedigree Evaluation. [50 points]") 2010 North Dakota FFA Convention Pedigree Evaluation [50 points] Given the following scenario, place the attached four (4) pedigrees in the order best suited to meet the long term goals of the purebred
2010 North Dakota FFA Convention Pedigree Evaluation [50 points] Given the following scenario, place the attached four (4) pedigrees in the order best suited to meet the long term goals of the purebred
Objectives. Economic Comparison of Conventional vs. Intensive Heifer Rearing Systems. Problems with the Historical Approach to Rearing Calves
 Economic Comparison of Conventional vs. Intensive Heifer Rearing Systems Objectives To evaluate the economic costs and opportunities of conventional vs. intensive heifer rearing systems What are the additional
Understanding and Using Expected Progeny Differences (EPDs)
") Agriculture and Natural Resources FSA3068 Understanding and Using Expected Progeny Differences (EPDs) Brett Barham Associate Professor Animal Science Arkansas Is Our Campus Visit our web site at: http://www.uaex.edu
Agriculture and Natural Resources FSA3068 Understanding and Using Expected Progeny Differences (EPDs) Brett Barham Associate Professor Animal Science Arkansas Is Our Campus Visit our web site at: http://www.uaex.edu
Canfax Research Services A Division of the Canadian Cattlemen s Association
 Canfax Research Services A Division of the Canadian Cattlemen s Association Publication Sponsored By: Focus on Productivity COW/CALF PRODUCTIVITY The feedlot and packing sectors have been very successful
Growth. Monitoring Dairy Heifer
 Growth Monitoring Dairy Heifer College of Agricultural Sciences Growth Monitoring Dairy Heifer Introduction Raising dairy heifers to an adequate size and with an age at first calving between 22 and 24
2016 Iowa FFA Dairy Cattle Evaluation CDE Test
 2016 Iowa FFA Dairy Cattle Evaluation CDE Test West Union, Iowa September 10, 2016 Mark the best answer in the proper blank on the Scantron sheet. 25 Objective Questions -- 2 pts. each 1. At birth, which
Maximize milk component production
 Ten key herd management opportunities on dairy farms Tom Overton, Larry Chase, Jason Karszes, Mike Van Amburgh, and David Galton Department of Animal Science and PRO-DAIRY Cornell University Maximize milk
MORE COW PREGNANCIES, FEWER CALF LOSSES, FASTER GENETIC IMPROVEMENT By Brad R. Lindsey, PhD
 MORE COW PREGNANCIES, FEWER CALF LOSSES, FASTER GENETIC IMPROVEMENT By Brad R. Lindsey, PhD Ways to Optimize Reproductive Efficiency in the Breeding Herd INTRODUCTION Most ranching operations will experience
Management of TMR Feeding Programs
 Dairy Update Issue 121, October 1995 Management of TMR Feeding Programs James G. Linn, Department of Animal Science, University of Minnesota, St. Paul The goal of any feeding program is to provide the
Investigating New Marketing Options to Increase Beef Production in Ontario
 DAIRY-BEEF PRODUCTION FACT SHEET Investigating New Marketing Options to Increase Beef Production in Ontario The Beef Farmers of Ontario (BFO) has investigated potential feeding strategies with Holstein
Figure 1. Dry matter intake, milk yield and live weight changes in a cow during her lactation cycle
 Welcome to the sixth edition (Sep 2014) of the ADN News. This newsletter discusses the very important topic of persistency of milk production during the cow s lactation cycle and the dramatic adverse impact
Economical Feeding And Management Practices For Herds Approaching 30,000- Pound RHAs: A Panel Discussion
 Economical Feeding And Management Practices For Herds Approaching 30,000- Pound RHAs: A Panel Discussion Panelists: Brad Houston, Price s Roswell Dairy, Roswell, NM, Dennis Lagler, Lagler Dairy, Vancouver,
Understanding Bull Proofs
 Understanding Bull Proofs 1. Ideal Commercial Cow (ICC$) Index A genetic ranking developed by Genex. ICC$ is designed to breed for farm profitability and efficiency using real-time economic indicators
2007 PLANNING BUDGETS FOR DAIRY PRODUCTION IN MISSISSIPPI COSTS AND RETURNS. 112 and 250 COW DAIRY ENTERPRISES LARGE BREED CATTLE MISSISSIPPI, 2007
 2007 PLANNING BUDGETS FOR DAIRY PRODUCTION IN MISSISSIPPI COSTS AND RETURNS 112 and 250 COW DAIRY ENTERPRISES LARGE BREED CATTLE MISSISSIPPI, 2007 MISSISSIPPI STATE UNIVERSITY EXTENSION SERVICE MISSISSIPPI
Dairy Replacement Programs: Costs & Analysis 3 rd Quarter 2012
 February 2014 EB 2014-02 Dairy Replacement Programs: Costs & Analysis 3 rd Quarter 2012 Jason Karszes PRO-DAIRY Department of Animal Science Charles H. Dyson School of Applied Economics and Management
publication
 publication 400-791 Virginia Cow Herd Performance Check-Up Bill R. McKinnon, Extension Animal Scientist, Virginia Tech John B. Hall, Extension Animal Scientist, Virginia Tech Thomas W. Covey, Extension
Agricultural Science Past Exam Questions Animal Production Higher Level
 Agricultural Science Past Exam Questions Animal Production Higher Level 2013 Question 1 Part (a) (a) Name three breeds of pig including at least two breeds suitable for outdoor (non-intensive) rearing.
Dairy Science. An Introduction
 Dairy Science An Introduction Types of Dairy Cattle Operations Intensive Dairy Production- animals are raised in a more confined setting such as an open lot or tie stall barn. Pasture Dairy Production-
NTM. Breeding for what truly matters. The NTM breeding goal is healthy, fertile, high producing cows the invisible cow. Elisabeth
 NTM Breeding for what truly matters The NTM breeding goal is healthy, fertile, high producing cows the invisible cow. Elisabeth 1 Contents Nordic Total Merit NTM a powerful tool for dairy farmers 3 How
Reproduction management and its economic value
 Reproduction management and its economic value V.E. Cabrera University of Wisconsin-Madison Dairy Science WISCONSIN UNIVERSITY WORKSHOP - PRACTICAL HIGH LEVEL DAIRY MANAGEMENT - A Case Study from a Wisconsin
STANDARDIZED PERFORMANCE ANALYSIS
 STANDARDIZED PERFORMANCE ANALYSIS SPA-1 COW-CALF ENTERPRISE PERFORMANCE 6-16-06 MEASURES WORKSHEET (SPA-PCC)* SPA is a standardized beef cattle enterprise production and financial performance analysis
South West Scotland Dairy Monitor Farm. Willie Fleming Hillhead Kirkpatrick-Fleming Lockerbie, DG11 3NQ Tel:
 South West Scotland Dairy Monitor Farm Willie Fleming Hillhead Kirkpatrick-Fleming Lockerbie, DG11 3NQ Tel: 01461800247 Meeting report Monday 21 st November 2011 Useful Contacts Heather Wildman - DairyCo
6 Breeding your cows and heifers
 6 Breeding your cows and heifers 6 Breeding your cows and heifers Regardless of the bulls you use, breeding your herd replacements from your best cows and heifers is essential if you want to achieve the
Focus. Department of Agricultural Economics Texas A&M AgriLife Extension Service
 FARM Assistance Focus Profitability of Beef Cattle Best Management Practices in South Texas: Improving Profitability with Genetically Superior Sires and Higher Breeding Ratios Mac Young Joe Paschal Levi
Focus. Department of Agricultural Economics Texas A&M AgriLife Extension Service
 FARM Assistance Focus Profitability of Beef Cattle Best Management Practices in South Texas: Improving Profitability with Genetically Superior Sires and Higher Breeding Ratios Mac Young Joe Paschal Levi
Three Times a Day Milking (3 )
") September 1997 Volume 3, Number 9 Co-Editors James R. Dunham Extension Specialist, Dairy Science John F. Smith Extension Specialist, Dairy Science Dan Waldner Extension Specialist, Dairy Science Contributors
September 1997 Volume 3, Number 9 Co-Editors James R. Dunham Extension Specialist, Dairy Science John F. Smith Extension Specialist, Dairy Science Dan Waldner Extension Specialist, Dairy Science Contributors
Bath County Extension Agent for Agriculture and Natural Resources. January American Forage and Grassland Meeting Louisville
 From the Ground Up Cooperative Extension Service Bath County 2914 E. Hwy 60 Bath County Agricultural Newsletter Owingsville, KY 40360 (606)674-6121 Fax: (606)674-6687 bath.ca.uky.edu LIKE US ON FACEBOOK:
The Use of Technology for Improved Cow Health to Increase Production and Reproduction
 The Use of Technology for Improved Cow Health to Increase Production and Reproduction Eric J. Diepersloot Herd Manager, IFAS Dairy Unit, University of Florida 13200 NW 59 th Drive, Gainesville, FL 32653
EPD Info 1/5. Guide to the American Gelbvieh Association Expected Progeny Differences (EPDs)
") EPD Info gelbvieh.org/genetic-technology/epd-info/ Guide to the American Gelbvieh Association Expected Progeny Differences (EPDs) Expected progeny differences (EPDs) can be used to predict the average
EPD Info gelbvieh.org/genetic-technology/epd-info/ Guide to the American Gelbvieh Association Expected Progeny Differences (EPDs) Expected progeny differences (EPDs) can be used to predict the average
Got Milk? An Economic Look at Cow Size and Milk. July 13 th, 2015
 Got Milk? An Economic Look at Cow Size and Milk July 13 th, 2015 Every complex problem has a simple solution, and it s usually wrong. Author unknown The Optimum Beef Cow The never-ending cow size argument
REPLACEMENT HEIFER DEVELOPMENT & NUTRITION
 OHIO STATE UNIVERSITY EXTENSION REPLACEMENT HEIFER DEVELOPMENT & NUTRITION MARK LANDEFELD OSU EXTENSION EDUCATOR AGRICULTURE AND NATURAL RESOURCES Heifer Development Proper selection and development of
Animal and Forage Interactions in Beef Systems
 Planning and Managing for Dry Conditions in Range and Pasture Production Systems Don Adams dadams1@unl.edu Animal and Forage Interactions in Beef Systems 1 Diets of Grazing Cattle The Primary Factor Affecting
6/29/2018. Trends and Opportunities in Calf and Heifer Rearing Costs
 Trends and Opportunities in Calf and Heifer Rearing Costs Matt Akins UW-Madison Dairy Science Vita Plus Dairy Calf Summit 2018 1 Heifer Management Goals: Calve between 22 and 24 months of age Minimize
Grade Level: 4th-5th Time: 40 minutes
 Dairy Production Got Milk? Language Arts, Math and Social Studies Grade Level: 4th-5th Time: 40 minutes Kansas Next Generation Standards: Science Grade 4-LS1-1: Animals have structures that support survival,
A SELECTION INDEX FOR ONTARIO DAIRY ORGANIC FARMS
 A SELECTION INDEX FOR ONTARIO DAIRY ORGANIC FARMS Paola Rozzi 1 and Filippo Miglior 2,3 1 OntarBio Organic Farmers' Co-operative, 2, 3 Canadian Dairy Network Guelph, ON, Canada 56 th Annual EAAP Meeting,
Breeding for Tuberculosis and Liver Fluke Resistance. Siobhán Ring Irish Angus Meeting, 7 th February 2019
 Breeding for Tuberculosis and Liver Fluke Resistance Siobhán Ring Irish Angus Meeting, 7 th February 2019 Observing genetic variation
Livestock Enterprise. Budgets for Iowa 2017 File B1-21. Ag Decision Maker
 Livestock Enterprise Ag Decision Maker Budgets for Iowa 2017 File B1-21 This publication contains estimates of production costs for common livestock enterprises in Iowa. Estimates are intended to reflect
Real Feed Costs on WI Dairy Farms January 2011
 Real Feed Costs on WI Dairy Farms January 2011 Paul Dyk, UWEX Dairy and Livestock Agent paul.dyk@uwex.edu, 920-929-3171 Greg Booher, LTC Instructor Comparing Feed Costs on WI Dairy Farms (2011) Paul Dyk,
Management Calendar for North Carolina Producers
 Management Calendar for North Carolina Producers Profitability of your cow herd depends on good planning and appropriate timing of major herd activities. The calendar in this fact sheet offers timelines
Strategies for Dairying Success in the Future
 Strategies for Dairying Success in the Future Richard Waybright Mason Dixon Farms, Inc. Gettysburg, Pennsylvania 29 Steps to Successful Dairying 1. Set vision goals (at least ten years ahead/dream possible
GENETIC CONSIDERATIONS FOR HEIFER FERTILITY DR. HEATHER J. HUSON ROBERT & ANNE EVERETT ENDOWED PROFESSORSHIP OF DAIRY CATTLE GENETICS
 GENETIC CONSIDERATIONS FOR HEIFER FERTILITY DR. HEATHER J. HUSON ROBERT & ANNE EVERETT ENDOWED PROFESSORSHIP OF DAIRY CATTLE GENETICS OVERVIEW Genetic merit of the heifer Genetics as a management tool
Production Records for Cow/Calf Producers Sandy Johnson, Beef specialist Bob Weaber, Cow/calf specialist
 Production Records for Cow/Calf Producers Sandy Johnson, Beef specialist Bob Weaber, Cow/calf specialist Few people really enjoy keeping records but having the records when you need them can be a great
Matching Cow Type to the Nutritional Environment
 Matching Cow Type to the Nutritional Environment Don D. Hargrove Animal Science Department University of Florida The goal in planning a management program for a commercial cow-calf operation is to maximize
Strategies to Improve Economic Efficiency of the Dairy
 Strategies to Improve Economic Efficiency of the Dairy Victor E. Cabrera and Afshin S. Kalantari 1675 Observatory Dr., University of Wisconsin Madison, Department of Dairy Science, Madison, WI 53706 Email:
Current Reality of the Ayrshire Breed and the Opportunity of Technology for Future Growth
 Current Reality of the Ayrshire Breed and the Opportunity of Technology for Future Growth First Current Reality August 2016 US CDCB-AGIL Genetic Breed Difference From Holstein Breed Milk Fat Protein Productive