ACCEPTED HERE! FOOD ACCESS PROGRAMS AT WASHINGTON STATE FARMERS MARKETS
|
|
|
- Kelly McLaughlin
- 5 years ago
- Views:
Transcription


1 ACCEPTED HERE! FOOD ACCESS PROGRAMS AT WASHINGTON STATE FARMERS MARKETS By Colleen Donovan, Small Farms Program, Washington State University. Rita Ordóñez, Birdsign Consulting. Karen Kinney, Washington State Farmers Market Association. Suzanne Briggs, collaboration. Marcia Ostrom, Small Farms Program, Washington State University TB44E Page 1 extension.wsu.edu TB44E
2 Accepted Here! Food Access Programs at Washington State Farmers Markets Introduction Across the country, farmers markets have become key actors in a burgeoning food access movement. The concept of food access builds on long-held goals such as reducing hunger, building community food security, promoting public health, advocating for food justice, and/or supporting local agriculture. While terms such as food security broadened the focus from calories to the quality, desirability, and consistency of family diets, the term food access also considers where people are able to shop and how they can get there. Food access acknowledges that many neighborhoods or towns don t have grocery stores with fresh, healthy foods that are affordable and/or within geographic reach of low income families. In this way, food access programs seek to address both economic and physical barriers to a healthy diet that lowincome people face. Farmers markets are especially well suited to their role in the food access movement because they can provide a ready-made solution for places that lack brick-and-mortar grocery stores and other appropriate retail food outlets. Albeit on a seasonal basis, farmers markets are renowned for transforming parking lots, parks, or main streets into vibrant places of communitybased commerce. In addition, farmers markets have the flexibility to design their vendor and product mix to meet the food preferences of different cultures. Despite long-standing critiques as being expensive and catering to elite shoppers, farmers markets play a specific role in implementing two federal nutrition assistance or food access programs. The Supplemental Nutrition Assistance Program (SNAP) and the Farmers Market Nutrition Program (FMNP) are designed to provide individuals and families in need with access to food and a more healthful diet (Dixit-Joshi et al. 2013). In the case of FMNP, the program is explicitly designed to ensure these purchases are made directly from farmers at farmers markets and farm stands. The purpose of this report is to aggregate and assess SNAP and FMNP sales at farmers markets in Washington State over a five-year period from 2010 to Tracking the scope and impact of food access programs at farmers markets is challenging on multiple fronts. TB44E Page 2 extension.wsu.edu There are a variety of government agencies involved, each with their own goals and clients. The federal and state administrative policies are regularly changing. The amount, timing, and sources of funding tend to be uncertain from year to year. The point of sale and electronic benefits equipment, services, and costs are in a period of transition. And farmers markets themselves have had to figure out how to stretch their capacity to manage additional bookkeeping, do data collection, train themselves and vendors on programs rules, work with new partners, and outreach to SNAP and FMNP clients. This report aggregates data provided by the Washington State Department of Social and Health Services (DSHS) and Washington State Department of Health (DOH), the two key agencies responsible for SNAP and FMNP programs, respectively. In addition, this report includes data from a recent Washington State University (WSU) Small Farms Program pilot project that provided Electronic Benefits Transfer (EBT), credit and debit technology to farmers markets, and collected data on specialty crop sales. Farmers markets can be key assets and active partners in improving food access at the neighborhood, city, county and statewide levels (Briggs, et al. 2010). In Washington State, a recent survey of farmers markets found that serving lowincome community members was an important goal for over 70% of market organizations. Moreover, improving their community s access to fresh farm produce or access to healthy foods was the primary motivation for starting a third of farmers markets (Ostrom and Donovan 2013). These federal nutrition programs have catalyzed many farmers markets to independently create partnerships with their local Women, Infant, and Children (WIC), Senior Farmers Market Nutrition Program and SNAP program managers. Farmers market organizations have also independently created their own local food access programs.
3 Examples from Washington State farmers markets include distributing Helping Harvest Vouchers to food bank clients to purchase food from farm vendors; organizing cooking demonstrations that emphasize healthy and affordable meals; sponsoring monthly senior days at the market; donating market bucks to food pantries and other agencies doing local outreach to low-income shoppers, as well as providing how to training on gardening and food preservation. A 2010 survey found that 86% of farmers markets in Washington State donate produce to their local food bank, pantry, soup kitchen, or shelter (Ostrom and Donovan 2013). In 2013, the Washington State Farmers Market Association (WSFMA) created a Farmers Market Access Partnership (FMAP), a network for markets, state agencies, non-profit partners, and public health groups to share information and increase collaboration. FMAP provides streamlined information about FMNP and SNAP programs for farmers market organizers and community partners; facilitates farmers markets engagement in policy; and problem-solves challenges to implementing Point of Sale (POS) technology, food benefit redemptions, and other issues. Federal Nutrition Assistance Programs at Farmers Markets Dating back to the Great Depression, federal nutrition assistance programs have an over 80-year history in the United States. Today food assistance programs are administered by the Food and Nutrition Service (FNS) of the United States Department of Agriculture (USDA) and have grown to include 15 different programs. Nutrition programs are the largest proportion of farm bill spending and are currently utilized by one in four Americans each year (USDA FNS 2014). In the most recent farm bill, known as the Agricultural Act of 2014, 80% or over $391 billion is projected to be spent on nutrition programs between 2014 and 2018 (USDA ERS 2014). All federal food assistance programs are administered in partnership with state and tribal governments. The two federal nutrition assistance programs that directly affect farmers markets in Washington State are the Supplemental Nutrition Assistance Program (SNAP) and the Farmers Market Nutrition Program (FMNP). FMNP encompasses a program for WIC clients, which is funded through the Child Nutrition Reauthorization Act, and a program for low-income seniors which funded through the farm bill. Table 1 provides an overview of these two programs key features. TB44E Page 3 extension.wsu.edu The funding levels for SNAP and FMNP is a function of policies, politics, and demand created by overall economic conditions. Both SNAP and FMNP are federal programs with state partnerships. In the case of the combined WIC and Senior FMNP program, roughly half of the funding comes from the State of Washington. Without state funding as a match, WIC FMNP would not receive federal funding and therefore not be available in Washington. Historically and currently, FMNP is the far larger program in terms of total redemptions at farmers markets. In 2014, FMNP redemptions exceeded a million dollars whereas SNAP redemptions were just over $425,000. However, in terms of trends, SNAP redemptions at Washington farmers markets have increased by 82% since 2010, while FMNP has decreased by 23% in the same period (Figure 1). Historically and currently, FMNP is also the far larger program in terms of number of participating farmers markets. In 2014, the FMNP authorized 126 farmers markets to participate in its program. (They also authorized 71 farm stands; however, for the purposes of this report we are focusing only on the farmers market activities.) Whereas, in 2014, there were 74 farmers markets in Washington that had been authorized by USDA s Food and Nutrition Service to accept SNAP. This represents a far smaller proportion of farmers markets in Washington; however, the number of farmers markets able to accept SNAP is growing: there has been a 48% increase in last five years alone (Table 2; Figure 2). This is due in large part to the enormous effort made by the USDA and partners to help farmers markets accept SNAP benefits. If we look at the average redemptions per farmers market, these trends are echoed. FMNP is the larger program, and had greater average sales per market from 2010 to However, the average redemption of SNAP at farmers markets has grown 23% while the average FMNP redemptions decreased 24% in the same period (Table 2; Figure 2). What this data fails to capture is the wide range in both FMNP and SNAP redemptions at farmers markets. For example, in 2014, there were 18 farmers markets with over $20,000 in sales from FMNP alone. Of these 18 farmers markets, four had FMNP redemptions over $40,000. Many farmers markets located in and serving low-income communities rely heavily on FMNP and SNAP to attract shoppers, generate farm sales, and sustain their market operations.

4 TB44E Page 4 extension.wsu.edu

5 TB44E Page 5 extension.wsu.edu
6 The next section looks at each of these federal nutrition assistance programs in detail and examines findings from a Washington State University Small Farms Program research project that assessed the economic potential of SNAP Electronic Benefits Transfer (EBT) and credit/debit card technology at farmers markets. Supplemental Nutrition Assistance Program (SNAP) and Farmers Markets The federal government started the first national food stamp program in 1939 to help alleviate hunger. At that time, people literally purchased orange or blue stamps which they could use to buy food. Later the program evolved from stamps to paper coupons. The program name officially changed from food stamps to the Supplemental Nutrition Assistance Program in October Today, it is referred to as the Supplemental Nutrition Assistance Program (SNAP) in 28 states, the District of Columbia, Guam and the Virgin Islands; the Food Stamp Program in seven states; and by a variety of different names in the remaining 16 states (USDA FNS 2012). In Washington State, the SNAP program is officially called Basic Food although practitioners also frequently refer to it as SNAP, SNAP EBT, EBT, or food stamps. The program has evolved beyond its original focus on meeting people s basic caloric needs to placing added emphasis of promoting healthful food consumption and local sourcing (Dixit-Joshi et al. 2013). Farmers markets are a core part of the USDA s strategy to improve access to locally grown produce for nutrition assistance program recipients (Dixit-Joshi et al. 2013). TB44E Page 6 extension.wsu.edu
7 Historically, farmers at farmers markets accepted and redeemed food stamps through a paper voucher system (DixitJoshi et al. 2013). In 1996, the Personal Responsibility and Work Opportunity Reconciliation Act mandated that states transition from the paper food stamps to Electronic Benefit Transfer (EBT) cards in order to increase SNAP efficiency, reduce participation stigma, and reduce fraud (Dixit-Joshi et al. 2013). In Washington State, the transition from paper food stamps to EBT was fully rolled out by November 1, 1999 (Hulsey et al. 2013). From this point forward, farmers markets needed a Point of Sale (POS) terminal or card reader in order to accept SNAP benefits. To address this transition, many states provided free, wired EBT card readers. However, the wired EBT card readers required both electricity and a telephone line. Unlike other retail outlets, most farmers markets in Washington are outdoors and lack this basic infrastructure. The new technology also required additional bookkeeping and other administrative expenses, creating new challenges for farmers markets with limited staff capacity. Consequently, the change from paper to EBT cards dramatically reduced the use of food stamps at farmers markets across the state (Farmers Market Access Project Advisory Committee 2012). Nationally, food stamp sales at farmers markets and farm stands decreased from $9.2 million in 1992 to a low of $1.6 million in 2007 (Briggs et al. 2010). Since then an enormous investment in outreach and technical support has been made by farmers markets, state farmers market associations, the national Farmers Market Coalition, and private funders. There have been many challenges to implementing and sustaining SNAP programs at farmers markets (Dixit-Joshi et al. 2013; Briggs et al. 2010; Blaustein-Rejto 2015). Nevertheless, nationally there are now 5,175 farmers markets and farmers that are authorized to accept SNAP (USDA ERS 2015). The total amount of SNAP benefits redeemed at farmers markets has rebounded to over $18.8 million, an increase of 154% since 2010 (Figure 3). However, the amount of SNAP redeemed at farmers markets, while growing, remains under 0.030% of the overall SNAP spending (Blaustein-Rejto 2015). TB44E Page 7 extension.wsu.edu Following national trends, wireless POS card readers have replaced wired card readers and grant-funded projects have helped a growing number of farmers markets in Washington set up EBT programs using tokens or other scrip. A turning point was when the Local Farms, Healthy Kids Act, was passed by the Washington State legislature in This legislation provided $50,000 to the WSFMA to (1) help farmers markets accept wireless electronic payment cards, (2) increase access to fresh fruits and vegetables and quality meat and dairy for all Washington residents, and (3) increase the number of food stamp recipients able to use their EBT cards at farmers markets. This project was followed in 2010 by two programs, the Farmers Market Access Project, a partnership between the Public Health-Seattle & King County and the King County Agricultural Program, and the WSU Small Farms Program s Increasing High-Value, Specialty, and Sustainable Crop Sales through Farmers Markets: Assessing the Economic Potential of Electronic Benefits Transfer and Credit Card Capability project funded by the Washington State Department of Agriculture (WSDA) Specialty Crop Block Grant Program (Ostrom et al ). In Washington State, the amount of SNAP benefits redeemed at farmers markets has increased 82% in the last five years, from $234,515 in 2010 to $426,235 in 2014 (Figure 4). Part of this increase reflects improvements in technology. In 2010, 19% of SNAP benefits were redeemed by farmers markets using a manual voucher system because the market didn t have electricity for a wired Point of Sale machine or access to a wireless POS. By 2014, 99.6% of SNAP benefits at farmers markets were redeemed using EBT cards at a POS machine. During this same period, the overall number of annual SNAP transactions at farmers markets increased 143%; from 11,065 in 2010 to 26,922 in 2014 (Figure 4). However, the average dollar amount per transaction decreased 25%, from $21.19 in 2010 to $15.83 in 2014 (Table 3). Mirroring national trends, the number of farmers markets in Washington State that are FNS authorized SNAP retailers has increased 48% since 2010 from 50 to 74 (Figure 5). Meanwhile, the average annual SNAP sales per farmers market has increased by 23%, from $4,690 in 2010 to $5,760 in 2014 (Table 3; Figure 5). The highest average SNAP sales per farmers market was $6,197 in 2012.

8 TB44E Page 8 extension.wsu.edu


9 TB44E Page 9 extension.wsu.edu
.")
10 There are currently over 5,000 retailers authorized to accept SNAP benefits in Washington State ( According to USDA FNS, in 2014, these retailers collectively served nearly 1.1 million people per month and redeemed $1.5 billion in SNAP benefits per year (Table 4). On average, in 2014, individual SNAP recipients received around $117 in food assistance benefits per month, down from $126 per month in 2013 (Table 4). TB44E Page 10 extension.wsu.edu As with the national trend, farmers markets in Washington represented just 0.027% of all SNAP sales in 2014 (Table 4). While modest, this percentage has crept up over the last five years just as it has nationally. Advocates point to the social value of improving food access as one of the reasons to justify investment in EBT programs at farmers markets. The potential growth in SNAP sales for local farms and processors at farmers markets is another justification. Unlike FMNP, SNAP is available to customers year-round, it can be used to purchase a wider variety of items, and the average monthly benefits are far greater. Even if just 0.1% of SNAP were spent at Washington State farmers markets, it would potentially represent over $1.5 million in farm and processed food vendor sales.

11 The Importance of SNAP to Farm Vendors Supporting local farmers is part of the rationale for adopting technology and creating programs so that SNAP benefits can be accepted at farmers markets. In Washington State, a 2012 survey found that approximately a third of farmers market farm vendors accepted SNAP benefits, primarily through the farmers market s EBT machine (using tokens as an alternative currency). Only six farms (out of 512) reported accepting SNAP through their individual farm s EBT machine. Of those farms that accepted SNAP, enabling low-income and senior shoppers to purchase their products was important to three-quarters of farmers. Increasing farm sales through SNAP was important to over half of farm vendors (Ostrom et al. n.d.). When asked to approximate what percentage of their gross sales (for all markets combined) came from SNAP (food stamp) sales, they reported a range of answers. Over half (59%) reported that SNAP was between 1% and 5% of their farmers market sales. Notably, 16% reported that SNAP represented over 10% of their sales at farmers markets (Figure 6). TB44E Page 11 extension.wsu.edu
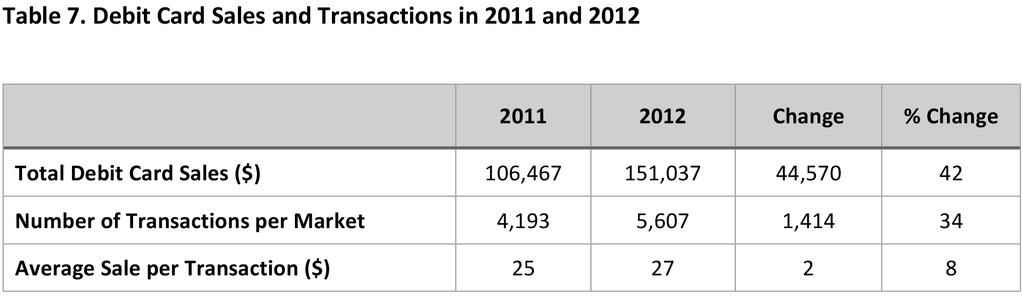
12 SNAP Incentive Programs Around the country and in Washington State, there are an increasing number of projects, programs, and campaigns designed specifically to encourage SNAP recipients to shop at their local farmers markets by matching their SNAP benefits. The match may be dollar-for-dollar, or there may be a maximum amount offered. Funding typically comes from a variety of private and local sources interested in increasing food access, improving nutrition among low-income families, and attracting new shoppers to farmers markets. Nationally, nonprofits such as the Fair Food Network and Wholesome Wave have been leaders in pioneering and funding SNAP incentive programs. Lessons learned from their experiences helped shape incentive programs in Washington State. In 2014, the USDA launched a new program funded by the farm bill. The Food Insecurity Nutrition Incentive Program (FINI) authorized $100 million to expand SNAP nutrition incentives programs across the country. The Washington State Department of Health was awarded $5.8 million in FINI funding to expand SNAP Incentive programs at farmers markets and other retailers over a four-year period. This programming has the potential to impact SNAP sales at farmers markets in Washington State. Assessing the Economic Potential of SNAP Electronic Benefits Transfer and Credit Card Capability at Farmers Markets In 2010, the WSU Small Farms Program in partnership with the Washington State Farmers Market Association, WSDA Small Farm and Direct Marketing Program, and King County Agriculture Program initiated a research project to assess the economic potential of SNAP EBT and credit/debit cards at farmers markets. Funded by the WSDA Specialty Crop Block Grant Program, the project was organized around five interrelated goals: Improving sales for specialty crop farmers; Increasing consumer access to Washington specialty crops; Evaluating the economic benefits of current EBT (and credit/debit) technologies for farmers markets in relation to costs; Helping additional Washington farmers markets access wireless EBT/credit/debit readers; and Investigating and employing methods to maximize the positive benefits of utilizing new wireless technologies (Ostrom et al ). TB44E Page 12 extension.wsu.edu In all, 15 farmers market organizations, located in 11 counties, participated in this project. Over two-thirds (67%) of the markets are considered small or very small markets (meaning they had less than 30 vendors on a typical market day in the peak season). The remaining third were medium or large markets (meaning they had from 31 to 100 vendors on a typical day during the peak season). Most (61%) markets also had total annual vendor sales of under $100,000 based on data for the 2009 market season. Nearly a quarter (23%) of the markets had total annual vendor sales over $250,000. The project collected data on sales transactions for SNAP EBT and credit/debit cards. All sales were conducted through a wireless point of sale machine which was provided to markets. Among the 15 participating market organizations, sales made through credit card, debit card and SNAP EBT increased from $336,498 to $401,349 or 19% between the 2011 and 2012 market seasons (Figure 7; Figure 8). Credit card sales were the highest of the three payment options for both years. However, from , the overall portion of credit card sales decreased from 57% to 52% of total sales (Figure 7; Figure 8). SNAP sales held steady at 10 11% and debit sales increased from 32% to 38% over that same time period. Credit card sales totaled $192,592 in 2011 and $210,766 in 2012; an increase of 9% (Table 6). The greatest overall increase between the two project years was for the debit card sales, totaling $106,467 in 2011 and $151,037 in 2012; an increase of 42% (Table 7).SNAP EBT sales also increased from $37,439 in 2011 to $39, 546 in 2012, representing a more modest increase of 6% (Table 8). Based on this data, it is clear that farmers economically benefit most when the technology for credit and debit sales is available. This is further reflected in the project s consumer survey data which found that among farmers market shoppers, 43% stated that they would buy more now that they can use their credit/debit card and/or food stamps at the farmers market (Gallardo et al. 2015). Specialty Crops Sales The WSU research project also analyzed the credit, debit, and SNAP EBT sales of specialty crops: fruits and vegetables, tree nuts, dried fruits, horticulture, and cut flowers. As with the overall credit, debit, and SNAP EBT sales, the amount of specialty crop sales increased 47% between 2011 and 2012 (Table 9). The greatest increase (nearly $56,000) was for sales made using credit and/or debit cards (Table 9). This demonstrates that credit/debit card readers are an important way to increase specialty crop farmers sales at farmers markets.


13 TB44E Page 13 extension.wsu.edu


14 One unexpected outcome of this WSU research project was that farmer-owned technology was found to be valuable to those that could afford it. One market manager stated that many of the farmers who participated in the program for the full three years decided to get credit/debit access for themselves. Had it not been for this program, I do not believe that many of these farmers would have believed just what an advantage it is to take these payment forms. Vendor and Shopper Attitudes towards Point of Sales Technology Numerous research projects have documented that implementing programs for farmers markets to accept credit, debit, and SNAP EBT cards is very challenging (Briggs et al. 2010). As part of the WSU research project, Dr. R. Karina Gallardo, an Agricultural Economics Extension Specialist from Washington State University, researched farmers market managers, vendors, and shoppers attitudes towards specific aspects of technology. She found that, in general: Market managers are willing to pay more for the quality of the technology itself, meaning they don t want any problems with the wireless point of sale machine; Farmer vendors are willing to pay more for technology with good customer service (i.e., reliable resolution of disputes); and Farmers market shoppers place a high value on both the quality of food and supporting local farmers (Gallardo et al. 2015). TB44E Page 14 extension.wsu.edu
15 Supporting Gallardo s findings, an evaluation of the Farmers Market Access Project found that farmers and market managers will tolerate a certain level of inconvenience in order to offer SNAP EBT services at their farmers market (Cole et al. 2013). Likewise, farmers placed great importance on how fast the transactions were with customers and good technical support when there were problems (Farmers Market Access Project Advisory Committee 2012). In Gallardo s view, insights into vendors and customers attitudes to technology should be useful to those designing ways to implement wireless capability at farmers markets in order to increase adoption rates (Gallardo et al. 2015). Farmers Market Nutrition Program In 1992, the federal WIC Farmers Market Nutrition Act was signed into law. That same year, the Washington State Farmers Market Nutrition Program (FMNP) was created to serve women and children enrolled in the Women Infant and Children (WIC) program. In 2001, a second program was piloted to serve low-income seniors and has become known as the Senior FMNP. Currently, WIC and Senior FMNP (combined) are the largest public nutrition assistance program at farmers markets in terms of the total dollars spent ($1,056,576 in 2014). The FMNP has broad participation throughout the state. In 2014, this included 126 farmers markets in 34 counties. A 2010 survey of farmers markets found that approximately 88% of all farmers market locations in Washington participated in FMNP (Ostrom and Donovan 2013). FMNP issues paper checks valued at $4.00 each that must be used between June and October. They can only be used to purchase eligible products, primarily fresh fruits and vegetables, grown by authorized farms and sold at authorized farmers markets or farm stands. (See Table 1 for a summary of key program features.) Farm stands must also be authorized and typically represent a small proportion of the redemptions. Notably, the amount of FMNP redeemed at farm stands has increased both in total sales and as a percentage of the total FMNP redemptions over the last five years. In 2010, farm stands represented 7% of the FMNP redemptions whereas it increased to 15% or almost $184,000 in For the purposes of this report, we are focusing on the FMNP sales at farmers markets only. TB44E Page 15 extension.wsu.edu In Washington, the WIC FMNP is administered by the Department of Health (DOH) with most of its funding coming from the Federal Child Nutrition Reauthorization Act and a smaller proportion from state General Fund. The Senior FMNP is administered by the Department of Social and Health Services (DSHS) with most of its funding coming from the state s General Fund and some funding coming from the federal farm bill. Together, about half (51% in 2014) of the total FMNP funding each year is provided by Washington State. WIC FMNP, in particular, has experienced significant funding cuts in recent state budgets. Between 2010 and 2014, the state s contribution to WIC FMNP was cut by 75% (from nearly $418,000 to just over $106,000). During this period, the state funding for Senior FMNP held steady and even increased to over $700,000 in Over the past 15 years, the FMNP program has successfully continued in Washington State due to a sustained collaborative effort from farmers, farmers markets, the WSFMA, WIC and Senior FMNP participants, anti-hunger, farming, faith-based, nutrition, environmental, and children s organizations. By recognizing that the programs goals intersect with many state agencies, health department and local government policy initiatives to improve health outcomes and community quality of life, promote economic development and create jobs, and ensure the future of Washington s vibrant agriculture sector, these organizations and individuals have successfully advocated to ensure continued state funding at varying levels. Historically, the combined state and federal FMNP funding for the WIC FMNP program has been greater than the Senior FMNP program. This trend changed in 2012 when the amount of Senior FMNP redeemed exceeded the amount from WIC FMNP for the first time (Figure 9). Senior FMNP has remained the larger program in terms of redemptions or sales at farmers markets through However, in terms of numbers of people served by FMNP, WIC FMNP is the larger program, consistently accounting for most of the estimated participants (Figure 10).


16 TB44E Page 16 extension.wsu.edu
17 FMNP redemptions at farmers markets in Washington State saw a steady decline between 2010 and This trend was reversed in 2014 with a 19% increase in redemptions (Figure 9). Likewise, the estimated number of FMNP participants recovered in 2014, increasing by 24% (Figure 10). The number of FMNP participants is directly tied to the availability of funding; there are far more people in Washington State that qualify to receive FMNP support than there are funds available for these programs. Importance of FMNP to Farm Vendors In 2012, the WSU Small Farms Program and Farmers Market Action Team surveyed farm vendors selling at farmers markets in Washington State. Preliminary results found that 68% of farm vendors said they were authorized to accept WIC and Senior Farmers Market Nutrition Program checks in 2011 (N = 530). However, since FMNP checks can only be used for fruits, vegetables, cut herbs and sometimes honey, not all farm vendors surveyed were eligible to participate in FMNP. Farm vendors who participate in FMNP were asked how important were WIC and Senior Farmers Market Nutrition Program checks in terms of both enabling low-income WIC and senior shoppers to buy their products and increasing farm sales. Enabling low income and senior shoppers to purchase their products was important to 87% of respondents. Increasing farm sales through FMNP was important to 64% of farm vendors (Table 10). Conclusion Farmers markets around the country and in Washington State are key assets and active partners in addressing the financial and physical barriers to accessing nutritious and local food. Currently, the two key federal nutrition programs utilized at farmers markets are the Supplemental Nutrition Assistance Program (SNAP) and Farmers Market Nutrition Program (FMNP). Each program has a unique history and is administered in its own way. SNAP started in 1939 and was successful at Washington State farmers markets until farmers markets were obliged to start using Electronic Benefits Transfer (EBT) technology. SNAP sales at farmers markets dropped significantly between the late1990s and mid-2000s. TB44E Page 17 extension.wsu.edu Since then, private and public agencies have worked to provide wireless EBT technology, to build the markets capacity to manage SNAP, to create incentive programs to attract SNAP clients, and to advocate for public funding and policies to support such efforts. Statewide, over a five-year period (2010 to 2014), farmers market SNAP sales increased 82% and the number of farmers markets authorized to accept SNAP increased 48%. The average SNAP sales at farmers markets was $5,760 in Despite this progress, SNAP sales at farmers markets in Washington State represented less than 0.03% of the total SNAP benefits spent each year.
18 The FMNP program is the only federal nutrition program designed specifically for farmers markets. The WIC FMNP began in 1992 and the Senior FMNP was added in While there are important distinctions between WIC and Senior FMNP, they both operate on a seasonal basis and provide a set amount of farmers market checks that can be redeemed for fresh fruits, vegetables, cut herbs, and (for seniors only) honey. The number of farmers markets participating in FMNP greatly exceeds the number of markets currently accepting SNAP. The total dollar amount of FMNP redeemed is greater than SNAP as well. However, over the last five years, the total amount of FMNP sales decreased (until 2014 when it rebounded) while the amount of SNAP sales steadily increased. Over the last five years, the average FMNP sales and average SNAP sales per farmers market have grown closer together (Table 2, Figure 2). In 2014, the difference was less than $2,625 (compared to a difference of over $6,300 in 2010). Understanding the causes underlying these trends should be a central focus for future research efforts. Research by the WSU Small Farms Program has evaluated the impact of offering SNAP EBT, credit and debit card technology for sales at farmers markets. This data demonstrates that over time both total sales and the total number of transactions increase when farmers markets offer point of sale (POS) technology. While SNAP EBT, credit, and debit cards all increased market sales, and especially farmers sales, debit cards were used more often. Research by Gallardo et al. (2014) documented the value that farmers market shoppers, vendors, and managers place on various attributes of farmers markets, and confirmed that managers and vendors are receptive to a model where the market is responsible for providing the technology to enable wireless sales. This report has provided a picture of the major trends in Washington State farmers market food access work over a fiveyear period (2010 to 2014). Farmers markets track records demonstrate their commitment to helping low income people buy from local farmers and processors using SNAP and FMNP benefits. These food access programs will continue to evolve as technology changes, more targeted outreach is developed, staff is trained, and data become available to inform best practices for farmers markets and farm vendors. With these changes, there will be a continued need for funding, sound public policy, and creative independent partnerships such as those between farmers markets and the anti-hunger community. TB44E Page 18 extension.wsu.edu Moreover, there needs to be a greater understanding of what support and capacity building farmers markets and vendors require in order to sustain their important roles in federal food access programs. Acknowledgements The authors are extremely grateful for the technical guidance and collaboration of: Janet Charles, Washington State Department of Health; Rosemary Biggins, Washington Department of Social and Health Services; and Des Boucher, Washington Department of Social and Health Services. Support for this project was provided by the Washington State Department of Agriculture (WSDA) Specialty Crop Block Grant Program (K515) and the United States Department of Agriculture (USDA) Agricultural Marketing Service Farmers Market Promotion Program (12-29-G 1649). All opinions, findings, conclusions, or recommendations expressed in this publication are those of the authors and do not necessarily reflect the view of the WSDA or USDA. Additional Resources For more information, see USDA s webpage on Food Access: For a brief history of food stamps in the US, see: and For a discussion of SNAP incentive programs across the country see: Information on Seattle s Fresh Bucks program: Additional information about the FMNP program is available at px and
19 References Blaustein-Rejto, D SNAP at Farmers Market Growing, but Limited by Barriers. Farmers Market Coalition. Briggs, S., A. Fisher, M. Lott, S. Miller, and N. Tessman Real Food, Real Choices: Connecting SNAP Recipients with Farmers Markets. Community Food Security Coalition and Farmers Market Coalition. Cole, K., M. McNees, K. Kinney, K. Fisher, and J.W. Krieger Increasing Access to Farmers Markets for Beneficiaries of Nutrition Assistance: Evaluation of the Farmers Market Access Project. Preventing Chronic Disease, Centers for Disease Control and Prevention. Dixit-Joshi, S., J. Burke, B. Das, and M. Steketee Nutrition Assistance in Farmers Markets: Understanding Current Operations. Final Report, Alexandria, VA: USDA, Food and Nutrition Service, Office of Research and Analysis. Farmers Market Access Project Advisory Committee Farmers Market Access Project: Expanding Nutrition Assistance at Washington Farmers Markets. Seattle, WA: King County. Gallardo, R.K., A. Olanie, R. Ordóñez, and M. Ostrom The Use of Wireless Capability at Farmers Markets: Results from a Choice Experiment Study. International Food and Agribusiness Management Review 18(1): Hulsey, L., et al The Evolution of SNAP Modernization Initiatives in Five States. Alexandria, VA: U.S. Department of Agriculture, Food and Nutrition Service, Office of Research and Analysis. Ostrom, M., and C. Donovan Summary Report: Farmers Markets and the Experiences of Market Managers in Washington State. Washington State University. Ostrom, M., C. Donovan, and J. Goldberger. n.d. Summary Report: The Experiences of Farmers Market Vendors in Washington State. Washington State University. Ostrom, M., C. Donovan, J. Goldberger, V. McCracken, J. Garcia-Pabon, and M. Flores Engines of the New Farm Economy: Assessing and Enhancing the Benefits of Farmers Markets. USDA National Institute of Food and Agriculture AFRI # TB44E Page 19 extension.wsu.edu Ostrom, M., K. Gallardo, and D. Collins Increasing High-Value, Specialty and Sustainable Crop Sales at Farmers Markets through Electronic Benefits Transfer and Credit Card Capability. Washington State USDA Specialty Crops Block Grant #K515. USDA ERS Agricultural Act of 2014: Highlights and Implications. USDA Economic Research Service. USDA ERS Number of Farmers Markets and Direct Marketing Farmers Accepting SNAP Benefits Continues to Grow. USDA ERS Charts of Note. USDA FNS SNAP Supplemental Nutrition Assistance Program State Report Fiscal Year USDA FNS Supplemental Nutrition Assistance Program State Options Report, 10th Edition. USDA. USDA FNS About FNS. USDA Food and Nutrition Services. USDA FNS SFMNP Profiles Grants and Participation. USDA Food and Nutrition USDA FNS WIC FMNP Profiles Grants and Participation. USDA Food and Nutrition Service. USDA Program Data. USDA Food Nutrition Service SNAP.
20 Copyright Washington State University WSU Extension bulletins contain material written and produced for public distribution. Alternate formats of our educational materials are available upon request for persons with disabilities. Please contact Washington State University Extension for more information. Issued by Washington State University Extension and the U.S. Department of Agriculture in furtherance of the Acts of May 8 and June 30, Extension programs and policies are consistent with federal and state laws and regulations on nondiscrimination regarding race, sex, religion, age, color, creed, and national or ethnic origin; physical, mental, or sensory disability; marital status or sexual orientation; and status as a Vietnam-era or disabled veteran. Evidence of noncompliance may be reported through your local WSU Extension office. Trade names have been used to simplify information; no endorsement is intended. Published November TB44E Page 20 extension.wsu.edu
GrowNYC s Healthy Exchange Project 2017 Highlights
 GrowNYC s Healthy Exchange Project 2017 Highlights Increasing food access, improving health, building community, growing the economy and improving farm viability in the New York State Region Project Description
Washington State s Large-scale FINI Project. Bridget Igoe, MPH, RD Office of Healthy Communities Washington State Department of Health March 2017
 Washington State s Large-scale FINI Project Bridget Igoe, MPH, RD Office of Healthy Communities Washington State Department of Health March 2017 Outline Scope and structure of project Key outcomes (so
Year One of the USDA FINI Program:
 April 2017 Year One of the USDA FINI Program: Incentivizing the Purchase of Fruits and Vegetables Among SNAP Customers at the Farmers Market FINI-supported programs at farmers markets resulted in 16-32
A Food and Farm Bill. A Guide to Farm Bill Programs At Work in Northeast Ohio
 A Food and Farm Bill A Guide to Farm Bill Programs At Work in Northeast Ohio UNITED STATES DEPARTMENT OF AGRICULTURE GRANTS AND PROGRAMS SUSTAINABLE AGRICULTURE RESEARCH AND EDUCATION (SARE) PRODUCER GRANTS
DOUBLE UP FOOD BUCKS
 DOUBLE UP FOOD BUCKS Table of Contents Organization Overview 3 Program Summary 4 Double Up! 5 How it Works 6 It s a Win-Win-Win! 7 Development Plan 8 Partnership Opportunities 10 Marketing Materials 11
Reaching Out to the Market Community
 Farmers Market Managers Professional Certification Program Module 2: Unit 2.2 Reaching Out to the Market Community Nutrition Programs to Grow Your Market UNIT OVERVIEW This unit will give an overview of
PROFILE OF SMALL FARMS IN WASHINGTON STATE
 PROFILE OF SMALL FARMS IN WASHINGTON STATE 2015 Update By Dr. Marcia Ostrom, Associate Professor, Washington State University Small Farms Program, Center for Sustaining Agriculture and Natural Resources.
PROFILE OF SMALL FARMS IN WASHINGTON STATE
 PROFILE OF SMALL FARMS IN WASHINGTON STATE 2015 Update By Dr. Marcia Ostrom, Associate Professor, Washington State University Small Farms Program, Center for Sustaining Agriculture and Natural Resources.
So Your Market Wants to Accept SNAP Benefits? Getting started in accepting SNAP benefits
 So Your Market Wants to Accept SNAP Benefits? Getting started in accepting SNAP benefits History of SNAP and Farmers The original 1939 Food Stamp Plan was to help two groups of persons in America: Low
Focus Group Findings
 Increasing Access to Produce in South Carolina through the SNAP-Ed Program Key Points: SC residents with a low-income experience higher rates of negative health outcomes, in part from barriers to accessing
Applying for and Starting your SNAP/EBT Program THE BASICS FOR FARMERS MARKETS IN VIRGINIA
 Applying for and Starting your SNAP/EBT Program THE BASICS FOR FARMERS MARKETS IN VIRGINIA Table of Contents Glossary of Terms p. 2-3 Market Day Procedures p. 4 EBT, Credit/Debit Transactions p. 4 Vendor
MICROFARMING: GROWING FOR
 MICROFARMING: GROWING FOR FARMERS MARKETS GROW YOUR CUSTOMER BASE & YOUR SALES AUGUST 27, 2014 BY DON WAMBLES Expand Your Customer Base Less than 40% of current FMNP clients are enrolled in SNAP; therefore,
TESTIMONY BEFORE THE COMMITTEE ON AGRICULTURE, NUTRITION, AND FORESTRY OF THE UNITED STATES SENATE
 TESTIMONY BEFORE THE COMMITTEE ON AGRICULTURE, NUTRITION, AND FORESTRY OF THE UNITED STATES SENATE Field hearing: Growing Jobs and Economic Opportunity: Perspectives on the 2018 Farm Bill from Michigan
Why should. Do low-income. Which is really. General Questions. Frequently Asked Questions The Healthy Purchase Pilot Program AB 2384
 Frequently Asked Questions The Healthy Purchase Pilot Program AB 2384 Assembly Member Mark Leno has introduced legislation to launch the Healthy Purchase Pilot Program (AB 2384). The goal of the legislation
FARMERS MARKET IMPACT STUDY DOWNTOWN FOND DU LAC MARKET PROFILE
 FARMERS MARKET IMPACT STUDY DOWNTOWN FOND DU LAC MARKET PROFILE The Saturday Farmers Market attracted an average of 1,750 visitors each weekend to downtown, with 9% traveling more than 10 miles to visit
REUNITING SNAP PARTICIPANTS AND FARMERS MARKETS BY FUNDING EBT PROGRAMS
 SUMMER 2012 www.jhsph.edu/clf FARM BILL REUNITING SNAP PARTICIPANTS AND FARMERS MARKETS BY FUNDING EBT PROGRAMS A PUBLIC HEALTH PRIORITY 615 N. Wolfe Street W7010 Baltimore MD 21205-2179 410-502-7578 Fax:
Black Hawk County Food Assessment 2012 Population: 131,820
 Black Hawk County Food Assessment 2012 Population: 131,820 Human Health & Wellbeing Access & Consumption Units of food and water available for emergency preparedness 1 : In the event of an emergency, the
New York City Food Policy
 New York City Food Policy The mission of the Office of the Food Policy Director is to advance the City s efforts to increase food security, promote access to and awareness of healthy foods, and support
WASHINGTON S FINI GRANT. March 2018
 WASHINGTON S FINI GRANT March 018 Agenda Overview of FINI grant Current Outcomes How to Get Involved Q/A WA State DOH Overview Start End April 1, 015 March 31, 00 Award $5.86M Subawardees 11 diverse food
Food Policy 101. May, 2017
 Food Policy 101 May, 2017 Food Policy describes the set of laws and regulations that inform how, why, and when food is produced, transported, distributed, and consumed. Who are key food policy actors?
Farmers Market in Low-Income Communities: Strategies & Best Practices
 FEATURED SPEAKERS Jordan Tucker Project Coordinator The Food Trust Mukethe Kawinzi Project Coordinator The Food Trust Oran Hesterman President & CEO Fair Food Network Jennifer O Brien Executive Director
FOOD SECURITY IN NEVADA
 FOOD SECURITY IN NEVADA 2/7/2013 Nevada s Plan for Action In March 2012, The Nevada Department of Health and Human Services (DHHS) Grants Management Unit (GMU) implemented a strategic planning process
Stabilizing and fostering an active and productive agricultural industry is critical to retaining viable farms. Facilitating investments in
 E C O N O M I C D E V E L O P M E N T Stabilizing and fostering an active and productive agricultural industry is critical to retaining viable farms. Facilitating investments in agricultural infrastructure
Greenmarket/GrowNYC Healthy Exchange Project 2015 Highlights
 Greenmarket/GrowNYC Healthy Exchange Project 2015 Highlights GrowNYC s Healthy Exchange Project provides the framework for making healthy, regional food accessible to all New Yorkers by overseeing GrowNYC
National Conference of State Legislatures Feeding People, Not Landfills Why Reducing Food Waste Matters
 National Conference of State Legislatures Feeding People, Not Landfills Why Reducing Food Waste Matters May 3, 2013 1 FEEDING AMERICA, NCSL Presentation 2013 THE FEEDING AMERICA NETWORK 202 Community Food
The A to Z of EBT, Credit and Debit Cards in Washington State
 Washington State Farmers Market Management Toolkit The A to Z of EBT, Credit and Debit Cards in Washington State Chapter 7: Accepting Multiple Currencies at Your Farmers Market July 2013 By Karen Kinney
2013 Produce Perks EBT Incentive Program Application for Farmers Markets in Cuyahoga County
 2013 Produce Perks EBT Incentive Program Application for Farmers Markets in Cuyahoga County The (FPC) is accepting applications from farmers markets in Cuyahoga County to participate in an incentive program
Food Security in San Francisco
 Food Security in San Francisco Presentation to: Neighborhood Services and Safety Committee San Francisco Board of Supervisors November 21, 2013 1 Outline of the Presentation 1. Present framework for understanding
Farm to Institution: From Policy to Programs
 Farm to Institution: From Policy to Programs Holly Freishtat, MS, CN Sustainable Food Specialist, Cultivate Health, LLC Food & Society Policy Fellow September 19, 2008 Overview Community Food System Federal
Farmers Markets Are Good for Everyone
 Farmers Markets Are Good for Everyone Here s how to make them better! Autumn 2005 Position Paper Prepared by the Farmers Market Coalition for its public policy summit at the International Public Markets
Maryland Market Money 2017 Annual Report
 Maryland Market Money 2017 Annual Report About MDFMA MDFMA is a 501(c)(3) nonprofit organization working to cultivate a vibrant and sustainable farmers market community in Maryland. Specifically, MDFMA
SHARE FOOD NETWORK 101
 SHARE FOOD NETWORK 101 SHARE provides packages of affordable, nutritious store quality grocery packages monthly: fresh fruits and vegetables, frozen meats and fish and grocery and staple items. The food
Nutrition Priorities for the 2018 Farm Bill
 Nutrition Priorities for the 2018 Farm Bill The undersigned organizations offer the following recommendations to address hunger while improving nutrition and health, and to increase access to affordable,
Description of operation of a Central POS/Market Scrip System
 A Simple Guide for Electronic Benefits Transfer (EBT) Of Food Stamp Benefits at California Farmers Markets Using a Central Point of Sale (POS) Device and Market Scrip Description of the system (1) Authorization
Greenmarket Customer Survey 2012
 Greenmarket Customer Survey 2012 Compiled by Alyssa Adkins December 2012 Introduction GrowNYC s Greenmarket program operates under a two-part mission: to promote regional agriculture by connecting local
POLICY BRIEF: OPTIONS TO IMPROVE ACCESS TO NUTRITIOUS, AFFORDABLE FOOD THE CHALLENGE
 POLICY BRIEF: OPTIONS TO IMPROVE ACCESS TO NUTRITIOUS, AFFORDABLE FOOD THE CHALLENGE Nutrition has lifelong consequences. It affects a child s growth and development, and the ability to learn in school.
SNAP Myths, Facts & Trends
 SNAP Myths, Facts & Trends Alan Shannon Public Affairs Director Food & Nutrition Service Midwest Region U.S. Department of Agriculture About FNS Our Vision: To End Hunger and Improve Nutrition in America
Produce Plus Program 2017 Season Report
 Produce Plus Program 2017 Season Report This program is funded by the Government of the District of Columbia, Department of Health, Community Health Administration What is the Produce Plus Program? The
FARMERS MARKET IMPACT STUDY DOWNTOWN FOND DU LAC MARKET PROFILE
 FARMERS MARKET IMPACT STUDY DOWNTOWN FOND DU LAC MARKET PROFILE The Downtown Fond du Lac market is estimated to be in its 45th season in 2016. The market is coordinated by the Downtown Fond du Lac Partnership
FEASIBILITY OF DIFFERENT HARVEST METHODS FOR CIDER APPLES: CASE STUDY FOR WESTERN WASHINGTON
 FEASIBILITY OF DIFFERENT HARVEST METHODS FOR CIDER APPLES: CASE STUDY FOR WESTERN WASHINGTON By Suzette P. Gallinato, Research Associate, IMPACT Center, School of Economic Sciences, Washington State University,
The link between improving healthy food access and economic opportunity: challenges and opportunities
 The link between improving healthy food access and economic opportunity: challenges and opportunities NC House Committee on Food Desert Zones, Raleigh, NC January 27, 2014 Alice Ammerman DrPH Director,
California Agriculture Vision A Needs and Vision Statement
 California Agriculture Vision A Needs and Vision Statement 2008 CALIFORNIA AGRICULTURE VISION A Needs and Vision Statement Submitted by California School Nutrition Association INTRODUCTION The California
Important points to bear in mind:
 The Emerson-Garfield Farmers' Market is entering its seventh season and invites growers, ranchers, farmers, bakers, specialty vendors, artists, chefs, artisans, crafters and musicians to participate. Overview:
Page 2 of 14 benefits through electronic benefits transfer (EBT) cards rather than paper coupons. Although USDA provided EBT card-reading terminals to
 cards rather than paper coupons. Although USDA provided EBT card-reading terminals to") Page 1 of 14 ORIGINAL RESEARCH Volume 10 October 03, 2013 Increasing Access to Farmers Markets for Beneficiaries of Nutrition Assistance: Evaluation of the Farmers Market Access Project Kate Cole, MPH;
Page 1 of 14 ORIGINAL RESEARCH Volume 10 October 03, 2013 Increasing Access to Farmers Markets for Beneficiaries of Nutrition Assistance: Evaluation of the Farmers Market Access Project Kate Cole, MPH;
Dear New York Senator,
 Dear New York Senator, Food and agricultural policy affects everyone in New York State, from how we access food, to what we eat, and how we grow that food. The 2018 Farm Bill provides an opportunity to
Hungry in Washington September 2013
 Hungry in Washington September 2013 Economic recovery has yet to reach Washington families struggling with hunger. The rate of hunger remains high 6.1 percent of all Washington households. According to
FOOD AND NUTRITION SERVICE RESEARCH AND EVALUATION PLAN FISCAL YEAR 2015
 FOOD AND NUTRITION SERVICE RESEARCH AND EVALUATION PLAN FISCAL YEAR 2015 May 4, 2015 CONTENTS STRATEGIC GOAL: ALL OF AMERICA S CHILDREN HAVE ACCESS TO SAFE, NUTRITIOUS, AND BALANCED MEALS IMPROVE PROGRAM
2016 3SquaresVT/EBT at Farmers Market Project Request for Proposals for markets not currently accepting EBT
 February 12, 2016 2016 3SquaresVT/EBT at Farmers Market Project Request for Proposals for markets not currently accepting EBT Dear Farmers Market Coordinator, Thank you for the interest in the 2016 3SquaresVT/EBT
Agency Information Collection Activities: Evaluation of Technology Modernization for
 This document is scheduled to be published in the Federal Register on 07/30/2018 and available online at https://federalregister.gov/d/2018-16220, and on govinfo.gov BILLING CODE 3410-30-P DEPARTMENT OF
two thousand thirteen vermont MAR KET CURR ENCY feasibility report PA GE
 two thousand thirteen vermont MAR KET CURR ENCY feasibility report GE 1 DARLENE WOLNIK INTRO DUCTION i n 2012, the Vermont Agency of Agriculture, Food and Markets (VAAFM) and Northeast Organic Farming
Administrative Solutions: Support the Administrative Solutions Project by. Objective 4.1: Increase Access to Nutritious Food
 FOOD AND NUTRITION SERVICE FY 2013 STRATEGIC PRIORITIES The Food and Nutrition Service (FNS) mission is to increase food security and reduce hunger in partnership with cooperating organizations by providing
Important points to bear in mind:
 The Emerson-Garfield Farmers' Market is entering its fifth season and invites growers, ranchers, farmers, bakers, specialty vendors, artists, chefs, artisans, crafters and musicians to participate. Overview:
NEAFCS Award Application: Food Safety Award
 Introduction NEAFCS Award Application: Food Safety Award PROGRAM OBJECTIVES Local food markets are springing up across the country. The U.S. Department of Agriculture (USDA) estimates over 1,000,000 people
Purpose of SNAP EBT FUNDING:
 Purpose of SNAP EBT FUNDING: Increase SNAP redemptions/participation at farmers markets by providing wireless SNAP EBT equipment to: FARMERS MARKETS and/or DIRECT MARKET FARMERS not currently participating
Wholesome Wave s mission is to empower under-served consumers to make better food choices by increasing affordable access to healthy produce.
 Wholesome Wave s mission is to empower under-served consumers to make better food choices by increasing affordable access to healthy produce. 44 million Americans rely on food stamps, eating on dollars
DEPARTMENT OF AGRICULTURE
 DEPARTMENT OF AGRICULTURE Funding Highlights: Promotes economic and job creation opportunities for rural America by focusing on five core areas: access to broadband services, innovative local and regional
Food With Benefits: Increasing the Accessibility of Farmers Markets to SNAP Recipients
 Galena Duba December 14, 2011 Environmental Advocacy Food With Benefits: Increasing the Accessibility of Farmers Markets to SNAP Recipients 1. Introduction In his July 2011 Proclamation of National Farmers
ASSESSING THE IMPACT OF A LABOR SHORTAGE ON POST-HARVEST ACTIVITIES AND MARKETS
 ASSESSING THE IMPACT OF A LABOR SHORTAGE ON POST-HARVEST ACTIVITIES AND MARKETS By Andrew J. Cassey, Associate Professor, School of Economic Sciences, Community and Economic Development Extension, Washington
Results from the NWA Fruit and Vegetable CVV Redemption Survey
 Results from the NWA Fruit and Vegetable CVV Redemption Survey CE Cecilia Richardson, MS, RD, LD Washington Leadership Conference March 5, 2013 crichardson@nwica.org Why We Did a Survey We were hearing
What Is the Farm Bill?
 Order Code RS22131 Updated September 23, 2008 What Is the Farm Bill? Renée Johnson Specialist in Agricultural Policy Resources, Science, and Industry Division Summary The 2008 farm bill (P.L. 110-246,
GoGreen Seattle 2014 Sustainable Food Charette Report
 GoGreen Seattle 2014 Sustainable Food Charette Report Overview The GoGreen Seattle Conference s Mini-Charette: Defining Actionable Solutions to Local Food Movement Challenges in the Puget Sound Region
General Population and Low-Income Population Focus Groups
 General Population and Low-Income Population Focus Groups Summary The purpose of the group discussions was to assess how people get food in an effort to understand how our community can improve the accessibility
2011 Cost of Producing Peppermint under Rill and Center-Pivot Irrigation in Washington State
 0 Cost of Producing Peppermint under Rill and Center-Pivot Irrigation in Washington State WASHINGTON STATE UNIVERSITY EXTENSION FACT SHEET FS077E Preface The study results presented in this WSU publication
FOOD SECURITY IN NEVADA. Angela Owings Food Security Coordinator Grants Management Unit, DHHS State of Nevada
 FOOD SECURITY IN NEVADA Angela Owings Food Security Coordinator Grants Management Unit, DHHS State of Nevada A PROBLEM WE CANNOT IGNORE To be From 2007 to 2010, Nevada experienced a 50 percent increase
Maple Grove Indoor Farmers Market Market Information and Guidelines
 Maple Grove Indoor Farmers Market Market Information and Guidelines Thursdays 3-6pm 2017: November 2 &16 / December 7 & 21 2018: February 1 / March 8 & 29 Thursdays 3-7pm 2018: April 12 & 26 / May 10 Address
DOUBLE UP FOOD BUCKS WESTERN NY REPORT
 DOUBLE UP FOOD BUCKS WESTERN NY REPORT DOUBLE UP FOOD BUCKS $24,564* $101,814 $144,912 Indicates what was spent at the seven pilot * markets prior to the implementation of the DUFB program er Evaluation
Wellness at Retail: An Introduction
 Wellness at Retail: An Introduction Use of the retail format to deliver medication, as well as healthcare information and products, has been a key path of access to care throughout American history. From
Notes from Strategy Session 4: Expanding and Securing Long-Term Funding for Double Up Food Bucks
 Notes from Strategy Session 4: Expanding and Securing Long-Term Funding for Double Up Food Bucks Strategy #1 Farmers Markets (9 votes) - identified barriers o farmers perceptions of SNAP users o sustainability
Farmers markets are found
 Kristin Krokowski A4013 Creating a Successful EBT Program: A Guide for Wisconsin Farmers Markets Farmers markets are found throughout Wisconsin in communities large and small, rural and urban. At these
Number of Households, ACS Five-Year Estimate Population Density (People / Square Mile), 2010b
, 2010b") Maryland Food System Profile II Baltimore City, MD Demographics These county profiles present the data compiled by the Maryland Food System Map Project, at the Johns Hopkins Center for a Livable Future.
Maryland Food System Profile II Baltimore City, MD Demographics These county profiles present the data compiled by the Maryland Food System Map Project, at the Johns Hopkins Center for a Livable Future.
An Introduction to MarketLink:
 An Introduction to MarketLink: Are you eligible to receive a free SNAP/EBT system for your market? August 13, 2014 Wholesome Wave & Farmers Market Coalition Wholesome Wave strives to create a vibrant,
Carbondale Community Farmers Market Vendor Application Packet
 Carbondale Community Farmers Market Vendor Application Packet Greetings from the Carbondale Community Farmers Market (CCFM)! We appreciate your interest in our year round marketplace. All vendors wishing
Farmers Markets. Bridging Access & SNAP-Ed Education in Low-Income Communities. Heidi Gorniok Nichole Proctor-English Susan Shuller-Frantz
 Farmers Markets Bridging Access & SNAP-Ed Education in Low-Income Communities Heidi Gorniok Nichole Proctor-English Susan Shuller-Frantz Presentation Overview Food Access + Nutrition Education = Impact!
All Regional Directors Supplemental Nutrition Assistance Program
 USDA ~ United States Department of Agriculture SEP 0 5 2014 Food and Nutrition Service 3101 Park Center Drive Alexandria, VA 22302-1500 SUBJECT: TO: Supplemental Nutrition Assistance Program -Retailer,
MAKING AN INFORMED DECISION: A GUIDE TO EXTENSION PROJECT PRIORITIZATION
 MAKING AN INFORMED DECISION: A GUIDE TO EXTENSION PROJECT PRIORITIZATION By Debra Hansen, WSU Extension County Director and Associate Professor, Community and Economic Development Unit, Washington State
Sample SNAP Token Transaction, Step by Step
 Sample SNAP Token Transaction, Step by Step 1) SNAP customers should start at the Farmer s Market Information Booth where they may purchase SNAP tokens using their EBT card. The tokens are green and only
Instructions for Webinar Participation
 Instructions for Webinar Participation Getting Started The webinar will start soon Audio is through your computer speakers or headset you may not hear sound until webinar begins If you see presenters talking
Specialty Crops: 2007 Farm Bill Issues
 Order Code RL33520 Specialty Crops: 2007 Farm Bill Issues Updated February 1, 2008 Jean M. Rawson Specialist in Agricultural Policy Resources, Science, and Industry Division Specialty Crops: 2007 Farm
INGREDIENTS FOR SUCCESS. How commercial and non-profit organizations are providing food services and increasing access to healthy foods
 INGREDIENTS FOR SUCCESS How commercial and non-profit organizations are providing food services and increasing access to healthy foods 1 Context This document provides an overview of how organizations
Navigating Difference Cultural Competency Training
 Navigating Difference Cultural Competency Training Overview By Mary Katherine Deen Diversity Director, WSU Extension Issued by Washington State University Extension and the U.S. Department of Agriculture
Increasing 3SquaresVT/EBT Usage At Farmers Markets in Vermont
 Increasing 3SquaresVT/EBT Usage At Farmers Markets in Vermont Toolkit Items: 1. Why Do Outreach? 2. Overview of Basic Outreach Opportunities 3. Two Successful Models of Outreach in Vermont 4. Community
Cuyahoga County Community Food Assessment Part 1: Current Conditions
 2016-2017 Cuyahoga County Community Food Assessment Part 1: Current Conditions Prepared by: Cuyahoga County Planning Commission 2079 East 9 th Street, Suite 5-300 Cleveland, Ohio 44115 Prepared for: Cuyahoga
2015 COST ESTIMATES OF ESTABLISHING AND PRODUCING RED RASPBERRIES IN WASHINGTON STATE
 2015 COST ESTIMATES OF ESTABLISHING AND PRODUCING RED RASPBERRIES IN WASHINGTON STATE By Suzette P. Galinato, Research Associate, IMPACT Center, School of Economic Sciences, Washington State University,
People Sure Are STRANGE Coming to Understand the Customer
 People Sure Are STRANGE Coming to Understand the Customer Marketing Webinar for Direct Marketing Farmers 1/15/13 and 1/16/13 Presenter: Marty Butts, Small Potatoes Marketing Webinar Questions and Answers
The Food Stamp Program is the
 All Food Stamp Benefits To Be Issued Electronically Victor Oliveira and J. William Levedahl (202) 694-5434 (202) 694-5431 The Food Stamp Program is the Nation s largest domestic food-assistance program,
The Science of Maryland Agriculture
 Edition 3 (2016) GOAL STATEMENT: Students will simulate a farmers market to learn about the benefits of locally grown food. OBJECTIVES: Students will understand the benefits of purchasing and consuming
Farmers Market Incentive Programs: SNAP and KSFMNP
 Farmers Market Incentive Programs: SNAP and KSFMNP Food Assistance in Kansas Supplemental Nutrition Assistance Program or SNAP formerly known as Food Stamps. o USDA federally funded o One of the largest
FOR KENTUCKY SCHOOL OF HUMAN ENVIRONMENTAL SCIENCES FAMILY & CONSUMER SCIENCES EXTENSION
 2014 FOR KENTUCKY SCHOOL OF HUMAN ENVIRONMENTAL SCIENCES FAMILY & CONSUMER SCIENCES EXTENSION Download PDFs of the Building Strong Families materials, including state and county profiles, at: http://hes.uky.edu/strongfamilies
The Appalachian (F)armacy
armacy") The Appalachian (F)armacy An initiative to improve Health outcomes of low income families RHAT 24 th Annual Conference Theme: Rural Healthcare Infrastructure: Vital to Population Health K. Munene Mwirigi,
The Appalachian (F)armacy An initiative to improve Health outcomes of low income families RHAT 24 th Annual Conference Theme: Rural Healthcare Infrastructure: Vital to Population Health K. Munene Mwirigi,
SUBJECT: WIC Policy Memorandum # Vendor Management: Incentive Items, Vendor Discounts and Coupons
 United States Department of Agriculture Food and Nutrition Service 3101 Park Center Drive Alexandria, VA 22302-1500 February 7, 2014 SUBJECT: WIC Policy Memorandum #2014-3 Vendor Management: Incentive
Using Administrative Advocacy to Improve Access to Public Benefits. by Suzanne Wikle
 Using Administrative Advocacy to Improve Access to Public Benefits by Suzanne Wikle Using Administrative Advocacy to Improve Access to Public Benefits by Suzanne Wikle The Supplemental Nutrition Assistance
Demand for Locally-Grown Foods: An Opportunity to Grow Chaffee County s Economy through Local Markets
 Demand for Locally-Grown Foods: An Opportunity to Grow Chaffee County s Economy through Local Markets Background In February 2011, LiveWell Chaffee County (LWCC) received a grant from the Colorado Health
Public Policy and Agriculture
 Public Policy and Agriculture Dr. Jeff Burkhardt With Dr. John VanSickle Food & Resource Economics Department University of Florida Florida Outlook Conference November 13, 2012 Why Public Policy? Why Public
Kentucky Top Ten Assets Supporting Local, Community, and Regional Food Systems
 Kentucky Top Ten Assets Supporting Local, Community, and Regional Food Systems Accessing Nutritious Foods Initiative, School of Human Environmental Sciences Contact Person: Jackie Walters, Extension Specialist,
Food Access in Saint Paul and Ramsey County Minnesota
 Food Access in Saint Paul and Ramsey County Minnesota Demographics of Ramsey County Population: Ramsey County is a fully developed urban center that has the second largest county population in Minnesota
Starting and Managing Successful Farmer s Markets
 Starting and Managing Successful Farmer s Markets The 2012 Educational Program Committee is pleased to share conference educational materials with you under the condition that they are used without alteration
California Department of Food and Agriculture 2013 Specialty Crop Block Grant Program. Marketing Enhancement
 Alameda County Deputy Sheriffs' Activities League $82,900 Title: Bay Area Urban Agriculture Marketing Association Abstract: The project will strengthen the growth and development of urban production farms
Finding Common Measures for the Nation s Food Hubs
 Finding Common Measures for the Nation s Food Hubs Update on a Preliminary Exploration Presented at: National Good Food Network Food Hub Collaboration Spring 2014 Conference Presented by: Shanna Ratner
2012 Cost Estimates of Establishing, Producing, and Packing Red Delicious Apples in Washington
 202 Cost Estimates of Establishing, Producing, and Packing Red Delicious Apples in Washington WASHINGTON STATE UNIVERSITY EXTENSION FACT SHEET FS099E Preface The information in this publication serves
Exploring Regional Food Systems. An Overview
 Exploring Regional Food Systems An Overview Exploring Regional Food Systems Part 1: Regional Food Systems Overview Local/Regional Food Systems: Definition and Components Marketing Channels Trends Farmers