Agriculture-Based Economic Development in New York State: Assessing the Inter-industry Linkages in the Agricultural and Food System
|
|
|
- Amberly Phillips
- 5 years ago
- Views:
Transcription
1 March 2014 EB Agriculture-Based Economic Development in New York State: Assessing the Inter-industry Linkages in the Agricultural and Food System Todd M. Schmit and Richard N. Boisvert Charles H Dyson School of Applied Economics and Management College of Agriculture and Life Sciences Cornell University Ithaca, New York
2 It is the Policy of Cornell University actively to support equality of educational and employment opportunity. No person shall be denied admission to any educational program or activity or be denied employment on the basis of any legally prohibited discrimination involving, but not limited to, such factors as race, color, creed, religion, national or ethnic origin, sex, age or handicap. The University is committed to the maintenance of affirmative action programs which will assure the continuation of such equality of opportunity.


3 Agriculture-Based Economic Development in New York State: Assessing the Interindustry Linkages in the Agricultural and Food System Todd M. Schmit and Richard N. Boisvert March 31, 2014 This publication was supported by funds provided by the New York Farm Viability Institute, Inc. and the Cornell University Agricultural Experiment Station federal formula funds, National Institute of Food and Agriculture, U.S. Department of Agriculture. Any opinions, findings, conclusions, or recommendations expressed in this publication are the authors and do not necessarily reflect the views of Cornell University, the U.S. Department of Agriculture, or the New York Farm Viability Institute, Inc.
4 Agriculture-Based Economic Development in New York State: Assessing the Interindustry Linkages in the Agricultural and Food System 1. Introduction Structural changes in New York s farm and food industry continue as agricultural producers and agribusiness firms adapt to changing economic conditions and consumer preferences, and to technological advancements. To retain or grow their share of the consumer food dollar, agricultural producers and agribusinesses continually seek innovative methods to expand existing markets and to develop new markets for their commodities and products. Many farm growers may also increase their bottom line by diversifying into high-valued specialty crops, vertically integrating their operations, developing branded products, or cooperating with other industry partners to improve access to consumer markets. Other farm operators continue to blend commodity production with employment off the farm or in alternate business pursuits to meet family income and lifestyle objectives. These various initiatives underscore the importance of expanding farm-to-food activities on the farm, as well as fostering greater interaction with the agribusiness industry. In order to define appropriate firm, industry, and public policy strategies to strengthen opportunities for economic development and improve the competitiveness of New York State's agribusiness industry, we must first identify and understand the linkages among agricultural production, service, manufacturing, distribution and consumer markets (both domestic and abroad). This report is part of a larger effort to update and document the importance of New York s major agricultural industries to the State s economy. The first report in this series provides updated baseline economic information on the current status and trends in the economic activity of New York State s agricultural and food system (Schmit and Bills 2012). This report focuses on a closer inspection of inter-industry transactions to obtain a clearer picture of the structure of the NYS economy, with particular emphasis on sectors within the agricultural and food system. This is a necessary first step to estimate the importance of the State s agricultural and food system to the NYS economy, both in total and most especially at the margin as various components of the agricultural and food system expand and/or contract in response to the changing economic conditions and policy related incentives. To provide the necessary conceptual background, we begin the remainder of this report with a discussion of input-output models and methods of economic impact analysis. We go on to discuss how the inter-industry accounts used in input-output methods can provide a clear picture of the structure economy. Next, we discuss the data and methods by which we construct an input-output model of the New York economy in which the important sectors of production agriculture and food manufacturing are identified explicitly. Through this input-output framework, we are able to describe the major differences in the patterns of sales and input 1
5 purchases of the State s major sectors of production agriculture and food manufacturing. In turn, these differences help to explain the major differences by sector in the magnitudes of the several economic multipliers for major components of the state s agricultural and food system. Through these economic multipliers, we can begin to identify the differential economic benefits and/or costs to the New York economy as various components of the agricultural and food system expand and/or contract. 2. Input-Output Methods and Economic Impact Analysis Input-output (I-O) methods, developed in the late 1930s by W. Leontief, have, since that time, proven to be an effective tool to assess the economic effects from expenditures or the initial expansion of output in specific sectors of the economy that come about as the result of public policy or private sector initiatives at the national, state, and local levels. In this report, we concentrate our efforts on estimating the effects throughout the broader New York economy from expanding key sectors in agricultural production, support services, and manufacturing. I-O methods are well designed for this purpose, because, in contrast to more aggregate economic analyses, I-O methods differentiate the effects of policy or private sector initiatives by important economic sectors. Conventional macroeconomic models trace changes in aggregate economic indicators such as national or regional income, gross national or regional product and employment and investment due to changes in taxes, spending, etc. These models, however, do not address the composition of these changes by production sector, nor do they trace the resultant effects throughout the economy. Since there is no reason to believe that the effects of public or private sector initiatives to stimulate sectors of the agricultural economy in New York State are distributed evenly throughout the economy, we rely on I-O methods to estimate the size of these impacts and trace these changes throughout the various sectors of the economy. The I-O model provides an insightful way to depict and investigate the underlying processes that bind an economy together. Its strengths lie in a detailed representation of: a) the primary and intermediate input requirements by production sector, b) the distribution of sales of individual industries throughout an economy, and c) the interrelationships among these industries and other economic sectors of an economy. The methodology s analytical capacity lies in its ability to estimate the indirect and induced economic effects stemming from the direct expenditures that lead to additional purchases by final users in an economy. These indirect and induced changes in economic activity result from what are now commonly known as multiplier or ripple effects throughout the various sectors in the economy. An initial expenditure of one dollar and/or the expansion of output in one sector set in motion a cascading series of impacts in the form of additional expenditures in other sectors by each business whose sales have increased; it is the cumulative impacts across all affected businesses or industries that are of most interest. Depending on the nature of the initial policy expenditures 2
6 or output expansion, these indirect impacts could be in the form of additional purchases of a variety of goods and services, for example: a) raw materials and primary factors of production; b) semi-finished or intermediate goods; or c) capital equipment. Moreover, the initial policyrelated direct spending and resultant indirect increases in business spending are associated with changes in output or sales, changes in employment and income, and changes in payments to land, capital and other primary factors of production. Part of these direct and indirect effects is in the form of the increased labor income generated in the economy due to the increased economic activity. To the extent that part or all of this additional income is spent within the economy, there are some additional ripple effects that are now commonly referred to as induced impacts, and they also can be estimated using the I-O methodology. The magnitudes of both the indirect and induced effects differ by economic sector. At the most basic level, I-O models require that the direct changes in purchases or expenditures must be specified in the form of additional sales to final users of products. Some of these direct effects will also be in the form of intermediate purchases by production sectors of the economy or changes in consumption patterns by households or input use by firms. There may also be changes in the composition of the imports into the state from other regions. Rather than being reflected in changes in sales to final users, these types of direct effects potentially change the structure of the input requirements for some sectors of the economy, as well as the proportion of inputs purchased from New York firms relative to those imported from elsewhere. 2.1 The Components of an Input-Output Model of an Economy To understand and trace by sector these indirect and induced economic effects resulting from initial direct changes in deliveries to final demand, we first examine the input structure of the major sectors or industries within the NYS economy. Given certain assumptions about the nature of production in the economy, the information about the purchases and sales of products among these sectors can be used to define an industry s input structure. In turn, this input structure provides the analytical and empirical basis for estimating the indirect and induced impacts resulting from private business development activity or policy initiatives directed at the state s agriculturally-related sectors of the economy. 1 To engage in business activity, the firms in various industries must purchase inputs, as well as sell their products and/or services. These firms purchase raw materials, labor, capital equipment, and intermediate inputs from firms in other industries. Some of these purchases may be from outside the state, the region, or even the country. In turn, firms in these industries sell products and/or services to firms in other industries as intermediate inputs, to governments and to final consumers. Moreover, some of these sales may also be to firms or consumers outside the state 1 There are many standard texts on I-O methods, for example, Yan (1969), Richardson (1972), Miller et al. (1989), and Miller and Blair (2009) discuss some of the more advanced topics in I-O analysis. For the interested reader, we provide detail on the analytical structure of I-O models in Appendix A. 3
7 and beyond. These patterns of purchases and sales are conveniently summarized in the interindustry transactions table that is defined at the major industry or sector level, and the data in the table form the basis for constructing the I-O model of an economy. In the inter-industry transactions table, total output for any sector or industry is defined by the value of its production for a given time period, typically a year. It can be measured in either of two ways: by the total value of purchases made by intermediate users and final consumers of the industry s output, or by the sum of the industry s intermediate input purchases, payments to labor and other components of value added, and value in inputs imported from outside the state that are needed to produce its products. The data in an inter-industry transactions table for a given state or region provide a representation of the region s economy from both of these perspectives. The patterns of sales and purchases will differ across industrial sectors and it is those differences that determine the nature of the economic impacts from direct output expansion, be it from public policy-related expenditures or private initiatives. The structure of a typical state or regional inter-industry transactions table is illustrated in Figure 1. 2 For purposes of illustration, the regional economy is aggregated into a small number of industrial sectors (agriculture, manufacturing, and retail trade). 3 As is evident from this table, the transactions reflect activity by these sectors of the economy that both produce goods (outputs) and consume goods from other industries (intermediate inputs) in the process of producing each sector s output. Thus, the transactions data measure the flows of products from each sector considered a producer to itself and other sectors of the economy as consumers. Agriculture Manufacturing Retail trade VA- Employee compensation a VA-Proprietor income VA-Other property income VA-Indirect business taxes Imports a VA = Value Added Retail trade Agriculture Intermediate Demand Manufacturing Households Final Demand Government Investment Exports Figure 1. An Example of an Input-Output Transactions Table 2 This figure, as well as some of the discussion of the transactions table is adapted from Miller and Blair (2009). 3 The sector columns and rows (shaded area) generally make up the largest area in the inter-industry transactions table. For example, IMPLAN s full inter-industry transactions table comprises 440 individual sectors. 4
8 The shaded portion of the table contains these inter-industry exchanges. For example, the cells in the first row of the shaded portion of the table contain the sales of agricultural goods to the agricultural sector itself, and to the other downstream sectors of the economy (the various food processing/manufacturing sectors are perhaps the best example). In addition to these sales to other industries who use agricultural goods as intermediate inputs, the elements in any row for the remaining columns in the table (labeled Final Demand) record deliveries from a production sector (or industry) to final markets for such things as personal consumption (households), government purchases of goods, capital investment, and goods exported to markets in other regions of the country or abroad. The relative proportions of sales to intermediate and final users reflect the importance of different markets for any sector s output. These markets include firms in other sectors of the state s economy, as well as consumer markets within the state. Sales to governments at all levels may be important for some sectors, but not for others. Markets for a sector s output to be used as intermediate inputs by firms outside the state may also be important for different sectors, as are consumer markets in nearby states or across the country. The extent to which industries have access to these various markets (as measured by the share of sales) reflects the importance of these various downstream linkages. These linkages differ across sectors, perhaps reflecting differential opportunities for certain sectors to participate in these different markets. In contrast with the rows of the table, each column of the shaded portion of the table records the composition of intermediate inputs required by a particular industry to produce its output. For example, the cells in the shaded portion of the first column record the intermediate inputs purchased by agriculture from itself and from the other production sectors in the economy. The remaining rows, labeled value added, record purchases of labor and other non-industrial inputs needed in the production of a sector s outputs. Expenditures on these inputs include employee compensation, proprietor income, other property income (e.g., rent, interest, corporate profits, depreciation), and indirect business taxes (any taxes and fees paid to governments, including sales and excise taxes). The final row, labeled imports, accounts for both intermediate inputs and labor purchased by the sector from regions outside the local economy. 4 The columns of the inter-industry transaction table provide evidence on the distribution of purchases ( upstream linkages ) by a particular sector. Furthermore, the nature of any sector s production process is revealed by dividing the transactions within each cell by the total value of all inputs purchased by that sector (i.e., by the column sum in the transactions table). Interpreted as input requirements, these ratios provide estimates of the dollar value of inputs from the sector in the row per dollar of output for the sector in the column. Since all data in the transactions table 4 Technically, the transactions table will include one additional row for institutional outlays; i.e., purchases of nondurable goods and services produced by governments in the study area. As these outlays are relatively small (around 2% or less of total purchases for agricultural industries), we do not include them in this conceptual discussion. 5
9 are in value terms, these ratios also provide estimates of the proportions of a sector s total input costs that are from the purchase of intermediate inputs from other sectors of the economy; are due to payments to labor or other components of value added; or are due to input purchases from outside the region. This input structure, in turn, has much to do with the size of a sector s economic multipliers. Since all intermediate input purchases from other sectors in the economy are turned over within the economy, the multiplier effects are likely to be higher the higher is the proportion of total input costs accounted for by intermediate input purchases. While much of employee compensation also goes to additional purchases of goods and services produced in the state, some portion may also be saved or used to buy consumer goods from outside the state. To the extent that these funds are spent within the region, they will likely increase both the indirect and induced multiplier effects of direct increases in a sector s sales to final demand. As a consequence of the effects of globalization, states and regions throughout the country have seen a rise in the proportion of inputs by many industries purchased from outside the region or the country. Monies spent on these imports are not retained locally, and they represent leakages outside the local economy. Since these leakages are not turned over within the economy, any increase over time in the proportion of a sector s input costs from inputs imported from outside the region is likely to reduce the indirect and induced economic impacts from output expansion in that sector. Through a careful examination of the nature of these imports, we may identify opportunities for expansion of other sectors in the economy through import substitution; i.e., providing an industry within an economy a way to reduce reliance on imports through expansion of local production of the imported input. Finally, to avoid double counting as goods move along the supply chain, sales to wholesale and retail trade sectors are margined to reflect only the value of the services provided by these sectors in delivering commodities from producers establishments to purchasers (sales less cost of goods sold). The values of the commodities (in producer prices) are apportioned to one or more deliveries to final demand, depending on the location and allocation of final deliveries (e.g., to households, exports, etc.). For example, consider a vegetable production sector with $100 of total sales, where $60 of output is sold to food processors, $35 is sold to retail groceries, and $5 is sold directly to households (e.g., through a farm stand or farmers market). The first transaction would be recorded in the I-O transactions table with a cell showing the intersection of vegetable production and food manufacturing. That cell registers a purchase of $60 of vegetables (looking down the column) by food manufacturing and a sale by that farm sector (looking across the row). For sales to the retail grocer, the producer value of the sales is attributed to final household demand (say $25) and is represented in the cell at the intersection of the vegetable production row and the (local) household demand column. The balance ($10) represents the retail margin enjoyed by the retailer and is recorded in the cell at the intersection of the vegetable 6
10 production row and the retail grocer column. Finally, the direct sales to consumers ($5) by vegetable producers are also included in the final demand deliveries to households. In the case where product moves from producers to wholesalers and then to retailers, margins would be applied in both the wholesale and the retail trade sectors. 2.2 Ranking the Effects by Sector using Traditional Economic Multipliers From this discussion, we know that the size and distribution of the ripple effects experienced throughout the economy associated with the expansion or contraction of any particular sector or industry depend on the pattern of sales and input use within that sector or industry. From a policy perspective, the relative economic impacts are captured by the several economic multipliers that can be defined for each sector or industry. To conduct such a comparative economic impact analysis on a sector by sector basis, we can define three separate particularly important economic multipliers; i.e., a sales or output multiplier, an income multiplier, and an employment multiplier The Output or Sales Multiplier For any individual sector, call it sector j, the sales or output multiplier is defined as the direct plus indirect plus induced sales throughout the economy resulting from a one dollar increase in sales to final demand in sector j. By comparing these multipliers across sectors, we identify those sectors in which a change in sales to final demand generate the largest combined direct plus indirect plus induced change in sales in all sectors of the economy The Income Multiplier Total sales or output generated throughout the economy is only one measure of the economic impact due to a direct increase in sales to final demand in one particular sector. It is also essential to know what happens to income and employment. To develop comparable measures for income or employment multipliers, we must change the base of comparison. In the case of a sales multiplier, the natural base of comparison is in terms of the same direct change in output (in this case a dollar of goods or services delivered to final demand in each sector). To construct an income multiplier, however, the natural base of comparison is in terms of a direct dollar change in income. As a point of departure, we must consider an increase in final demand in sector j by enough to generate directly a dollar of income in sector j. These multipliers are thus defined as the direct plus indirect plus induced income (e.g., perhaps payrolls) effect throughout the economy due to a direct increase in payrolls of a dollar in sector j. Thus, by comparing these multipliers, one can determine which sectors generate the largest change in income economy-wide when payrolls are increased by the same amount, ceteris paribus, in each sector of the economy. This transformation allows one to level the playing field across sectors in terms of direct income changes. In so doing, the size of the income multiplier varies inversely with the direct 7
11 income coefficient (i.e., the dollars of income needed to produce one dollar of goods in a particular sector). The smaller is the share of payments to labor in the total value of inputs, the larger is the income multiplier for that sector. This may appear counter intuitive at first blush, but it is as it should be: the smaller the direct income coefficient, the larger the direct change in output per additional dollar of income in that sector. Thus, there is a larger direct change in output to generate indirect and induced changes in sales and income throughout the economy The Employment Multiplier The logic of changing the base of comparison for the income multiplier extends directly to the notion of an employment multiplier, which is defined as the direct plus indirect plus induced employment for a direct unit change in employment by sector j. As in the case of the income multiplier, the employment multiplier tends to be large when the direct employment coefficient (the employment per dollar of output) is small. Furthermore, since wage rates differ by sector, it is unlikely that the employment and income multipliers will be ranked the same across sectors of the economy. 3. An Input-Output Model for New York State To examine the nature of inter-industry transactions for sectors of agricultural and food system in New York State, we must construct an I-O model for the state, including the associated transactions table. Several decades ago, many state governments invested substantial resources to maintain input-output models that could serve as the empirical basis for conducting economic impact analyses at the state level. Even at that time, it was difficult and expensive to maintain these models, and consequently, the data on which they were based became out of date rather quickly. In addition, the models usually contained a limited number of economic sectors. For this reason, it was impossible to conduct impact analyses of rather specific and disaggregate sectors, thus limiting the applicability of many results of impact analyses. These state-level initiatives to maintain inter-industry models have been abandoned. As an alternative, these kinds of impact analyses now commonly rely on state-level I-O tables generated from commercially available data bases and software designed specifically for that purpose. In this analysis, we use the IMPLAN economic impact assessment software system, and associated data bases to construct a New York State I-O model. The data bases included in the IMPLAN software are ideal for this purpose. 5 Using the IMPLAN data bases, it is possible to examine inter-industry transactions among 440 industrial sectors of an economy as defined by the North American Industry Classification System (NAICS), the standard used by Federal statistical agencies to classify business establishments for the purpose of collecting, analyzing, and publishing statistical data related to the U.S. business economy. 5 The data bases used by the IMPLAN software to construct input-output models and SAMs for multi-state, state level and sub-state regions are described in some detail in Appendix B and at 8
12 3.1 A Sectoring Plan Focusing on the Agriculture and Food System To gain a better understanding of the structure of industries within New York s agricultural and food system, we construct an I-O model for New York in which the 440 industries in the IMPLAN data base are aggregated into 32 economic sectors. In this process of aggregation, we define 20 of these industry sectors specifically aligned with the major components of the State s agricultural and food system, including agricultural production, service, manufacturing, retail trade, and food service sectors. These sectors are listed in the top section of Table 1, along with the respective IMPLAN sectors contained within them. 6 For our analysis, we consider seven agricultural production sectors, one agricultural support sector, and ten agricultural and food manufacturing sectors. To focus on important downstream sectors, we also identify sectors for: food and beverage retail trade, and food service. The other 12 economic sectors are defined by aggregating the remaining industries at the 2-digit NAICS level (Table 1). 4. The Structure of Important Sectors in the State s Agricultural and Food System The data in Tables 2, 3 and 4 are derived from the inter-industry transactions embodied in the I- O model of New York State. Through an examination of these data, we begin to understand the structure of the sectors of the State s agricultural and food system and the differences in this structure among the various sectors. Table 2 contains summaries of employment, output and value added for each of the important sectors of the State s agricultural and food system. From this table, we see the total value of output of the State s agricultural and food system broken down into its five major sectors as defined by Schmit and Bills (2012). Output represents the value of industry production in producer prices, generally defined as sales. For manufacturers, however, output includes changes in inventories, and, as discussed above, output for wholesale and retail sectors is calculated as a gross margin (sales minus the cost of goods sold). Value added can be calculated as the difference between an industry s total output and the cost of its intermediate inputs; thus, it is a measure of the industry s contribution to gross domestic product (GDP). The major components of value added include: employee compensation, proprietor (self-employment) income, indirect business taxes, and other property-type income (i.e., dividends, interest, rent, corporate profits, and capital depreciation). 6 Detailed mapping information of IMPLAN default industry sectors to the New York Model sectors is shown in Appendix C. 9
13 Table 1. Economic Sectors in the Agriculture and Food System defined for New York State s Input- Output Model Sector/industry I-O Sector Number Implan Sectors AG AND FOOD SYSTEM ECONOMIC SECTORS Production Agriculture Dairy cattle and milk production 1 12 Cattle ranching and farming 2 11 Other animal production Fruit and vegetable farming Greenhouse and nursery 5 6 Grain and oilseed farming All other crop farming Ag and forestry support services 8 19 Agricultural and Food Manufacturing Dairy product manufacturing Fruit and vegetable manufacturing Bakery, confectionary, flavorings, snack food manufacturing , Animal food manufacturing Animal slaughter and processing Milling and oilseed processing and refining All other food manufacturing 15 61, 69 Alcoholic beverage manufacturing Soft drink and ice manufacturing Ag chemical and equipment manufacturing , Food and beverage retail trade Food services and drinking places OTHER ECONOMIC SECTORS Forestry, Fishing, Hunting Mining Utilities, Transportation, Information , Construction Tobacco, Textile, Wood, and Paper Product Manufacturing Chemicals & Plastics Manufacturing , Stone, Clay, Glass, Metal Products Manufacturing Equipment and Instrument Manufacturing Wholesale and Retail (non-food) Trade , , Finance, Insurance, and Real Estate Services (non-food) , , Government ,
14 Table 2. Measures of Economic Activity for Sectors of New York State's Agriculture and Food System, Output 1 Value Added 1 Sector/Industry Employment ($ Million) ($ Million) Production Agriculture Dairy farming 20,874 2,804 1,018 Cattle farming 2, All other animal farming 2, Fruit and vegetable farming 4, Greenhouse and nursery 3, Grain and oilseed farming 10, All other crop farming 1, Subtotal 46,180 5,500 2,164 Ag and forestry support services 8, Agriculture Manufacturing Dairy products 8,504 7, Fruits and Vegetables 6,957 2, Bakery, confectionary, snack foods, & flavorings 26,922 8,425 2,009 Animal foods 1,630 1, Animal slaughter and processing 3,770 1, Grain and oilseed processing 1,059 1, Other foods 2, Alcoholic beverages 4,192 3,861 1,920 Soft drink and ice 2,458 1, Ag chemical and equipment 1,591 1, Subtotal 59,946 31,898 6,866 Retail Trade Food and Beverage 222,007 13,513 9,665 Food Services and Drinking Places 624,379 39,888 23,942 Total 961,389 91,012 42,789 Source: Implan (2012) 1 Output represents the value of industry production in producer prices, generally defined as sales. For manufacturers, however, output includes changes in inventories. Output for wholesale and retail sectors is calculated as a gross margin (sales minus the cost of goods sold) rather than gross sales. 11
15 The total value of farm commodity production in 2011, including all crop and livestock industries, was about $5.5 billion. The $2.2 billion of value added in these industries accounts for about 40% of the value of total output, and employment is estimated at just over 46 thousand. Dairy farming, of course, continues to dominate production agriculture, accounting for 51% of the total value of output. The next three largest components of production agriculture combined - fruit and vegetables, greenhouse and nursery, and grains and oilseeds - account for another 34% of the value of production agriculture. The relative contributions of each of these components to the total employment, output and value added in production agriculture do differ somewhat. In 2011, support services for agriculture and forestry accounted for an additional $212 million in output throughout the State. Total value added from these support services was $152 million-- just over 71% of the value of total output. Employment in this support services sector in 2011 was estimated at about 8,900. From the perspective of production agriculture, those downstream sectors engaged in the manufacture of food, beverage, and kindred products, as well as agricultural chemicals and equipment manufacturing, also contribute importantly to the value of output in New York s agricultural and food system. The combined value of output from the 10 industries in this sector totaled nearly $32 billion in The nearly $7.0 billion of value added in these sectors account for just over 21% of the value of total output, and employment is estimated at about nearly 60 thousand. Over 70% of the value of total output of agricultural and food manufacturing is accounted for by the top four industries in term of value of output: bakery and related products (26%), dairy products (24%), alcoholic beverages (12%), and fruits and vegetables (9%). The two other major sectors that are even further downstream from production agriculture include retail food and beverage stores and the services provided by eating and drinking establishments. 7 In 2011, the total value of output (gross margin) in the retail food and beverage sector was over $13.5 billion. Not surprisingly, the nearly $9.7 billion of value added accounts for nearly three-quarters of the total value of sales of retail food and beverage firms. In 2011, the total value of the services provided by eating and drinking establishments was $39.9 billion, and this is about three times the value of output from retail food and beverage stores. The nearly $24 7 Wholesale trade sectors related to food and beverages, agricultural equipment and nursery supplies are also important downstream sectors relative to production agriculture. Unfortunately, data for these individual components of wholesale trade sector are not available in the IMPLAN databases. It was, therefore, impossible to disaggregate the wholesale trade sector for purposes of constructing the New York State IO model. Schmit and Bills (2012), however, begin with total output for the wholesale trade sector in IMPLAN and estimate relative shares for the important component sectors related to agriculture and the food system from the detailed data reported in the 2007 Economic Census. In the Census, food and beverage wholesale trade includes include farm product, grocery, and alcoholic beverage merchant wholesalers, agents and brokers. Agricultural equipment, suppliers, and nursery wholesale trade included farm and garden equipment, food-processing equipment, farm supplies, and flower, nursery stock, and florists supplies merchant wholesalers. The total value of output for these components was estimated to be around $13.1 billion in
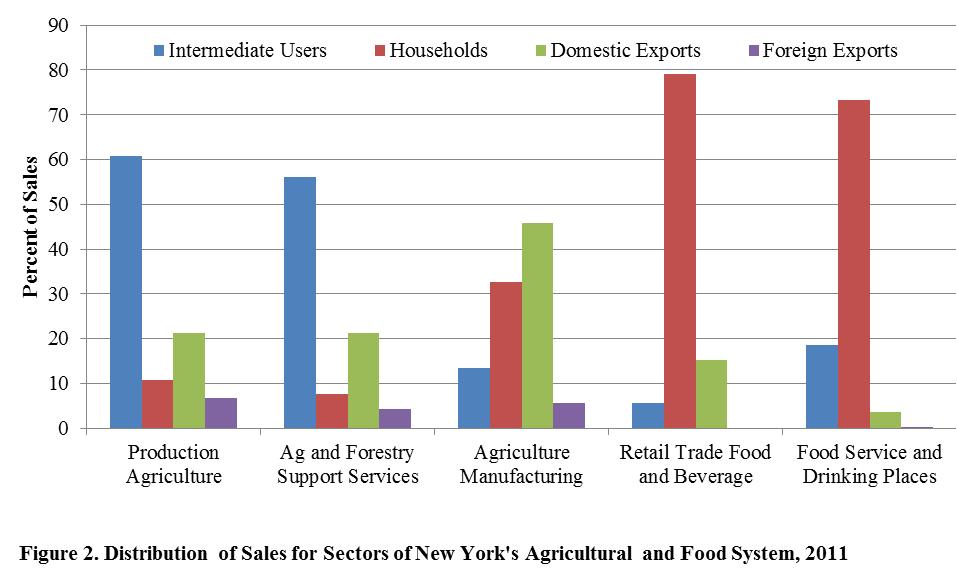
16 billion of value added in these eating and drinking establishments accounts for about 60% of the total value of sales. While these totals provide an important perspective on the relative size of the major sectors in New York State s agriculture and food system, they tell only part of the story about differences in their economic structure. The differences in this structure among the sectors are revealed through an examination of the patterns and distributions of both sales and outlays, which differ dramatically by sector and by industry within a sector. Table 3, along with Figures 2, 2A, and 2B, summarize by sector/industry the distribution of sales between intermediate and final users of a sector s output. Similarly, Table 4, along with Figures 3, 3A and 3B summarize by sector/industry the distribution of production expenses between those purchases of intermediate inputs from other sectors of New York s economy, those purchases of labor capital and other components of value added, and those purchases from out of state. 4.1 Patterns and Distribution of Industry Outputs (Sales) The distribution of sales identifies the importance of various markets for a sector s or industry s products. These markets include the intermediate sales to other sectors or industries in the New York economy for use as inputs in the production of their goods and services. Most of these intermediate sales are likely to downstream sectors in the agricultural and food system, but some sales are also to firms in some of the other 12 aggregate sectors of the New York economy listed in Table 1. Other sales go directly to final users, which include deliveries to households within New York, as well as exports to other states or to foreign countries. 8 Recall that only the margins for wholesale and retail trade transactions would be included as sales to intermediate users, while the remaining product values (in producer prices) are reflected in one or more deliveries to final demand. The first row in Table 3 (and Figure 2) displays the distribution of production agriculture s total output between sales to intermediate and to final demands. The nearly $3.3 billion in sales to other sectors as intermediate inputs (e.g., as intermediate inputs in food processing) account for 8 Both domestic and foreign exports are considered final demand sectors from the perspective of the New York State economy, but these sales could be to foreign households or to households in other states. Some sales could also go to foreign firms or to firms outside the state to be used as intermediate inputs. In addition, it is worth noting that foreign exports at the state level cannot be measured directly due to unsurmountable measurement issues in untangling point of origin and point of shipment data for goods and commodities. As noted by the USDA Economic Research Service U.S. agricultural commodity exports are often produced in inland States and pass through several marketing or processing points before arriving at a port. As the commodity passes through other States before being exported, the State-of-origin often is lost or the product commingled with similar product from other States. Frequently, the State from which the commodity last started its export journey, not necessarily the State in which the commodity was produced, is the State of origin reported by the exporter. and further Tracking the source State is even more complicated for processed agricultural products. Processors and manufacturers may use raw materials from a number of States, and final processed products may undergo multiple processing steps in different States before reaching the port for foreign shipment. ( As such, alternative methods are used to indirectly compute foreign export shares at the state level, generally allocating exports by production shares. 13
17 just over 60% of the total value of the output from production agriculture. The remaining 39% is delivered to final users, with just over 10% allocated to households within New York (either as direct sales to consumers or the producer value of product sales (i.e., cost of goods sold) to wholesale and retail trade sectors that are sold to households), and 29% of the sales to domestic and foreign export markets (either directly by producers or through intermediary handlers; e.g., wholesalers). The distributions of sales differ substantially by individual industry within production agriculture, and it is these differences across industries that reflect the importance of different markets for each of the industry s output (See Table 3 and Figure 2A). Not unexpectedly, over 80% of the sales from dairy farming are purchased as intermediate inputs by other in-state firms - - almost exclusively milk handlers and processors. Another 18% of sales are delivered to milk handlers and processors in other states. In both cases, the milk is processed further for sale in fluid markets or in markets for manufactured dairy or other food products. In turn, the combined deliveries of the state s dairy farm products to households or to foreign markets are less than 1% of the total. The 89% of the sales from cattle farming to intermediate users underscores the importance of downstream processing industries within the state for this industry whose sales constitute a relatively small proportion of the total for the State s production agriculture sector. Nearly 80% of the sales by all other crop farms also are used as intermediate inputs, primarily by bakery operations, textiles and wood manufacturing, and dairy farming (as feed inputs). About 36% of the sales of grains and oilseeds are used as intermediate inputs by other firms within New York, primarily animal food manufacturers and grain and oilseed processors. However, about 61% of the deliveries are split between exports to other states or to foreign countries, and it is likely these deliveries also go primarily to animal food manufacturers and grain and oilseed millers and processors outside the state. In contrast, much larger proportions of sales of fruit and vegetable operations, greenhouse and nursery operations, and other animal farming are purchased by final users, either within or outside the State. While only 30% of the total output of fruit and vegetable producers is sold as intermediate inputs, 45% is delivered to households (directly or through wholesale/retail handlers) within the State. Other animal farming and greenhouse and nursery operations also deliver relatively large proportions of their output to final users--to households within the state, but also particularly to domestic markets outside the state (i.e., domestic exports). As expected, most of the sales of agricultural and forestry support services (56%) are utilized primarily as intermediate inputs by crop, livestock, and forestry producers. An additional 21% of the sales of these services go to domestic export markets--services provided to crop, livestock, and forestry producers in nearby states. 14
18 Table 3. Distribution of sales (output) to intermediate and final demands by sector for New York's agriculture and food system, Deliveries to Final Demand Sales to New York Exports Total Sector/Industry Intermediate Users Households Domestic Foreign Other 1 Output Production Agriculture ($ million) $3,345 $588 $1,166 $368 $33 $5,500 Percent of Total 61% 11% 21% 7% 1% Percent of Individual Industry Total Dairy farming 81% <0.5% 18% <0.5% <0.5% $2,804 Cattle farming 89% 1% 11% <0.5% <0.5% $253 All other animal farming 19% 27% 52% 2% 1% $217 Fruit and vegetable farming 30% 45% 10% 15% 1% $886 Greenhouse and nursery 11% 24% 60% 3% 3% $399 Grain and oilseed farming 36% 2% 27% 34% 1% $578 All other crop farming 79% 3% 9% 7% 1% $364 Ag and forestry support services ($ million) $119 $16 $45 $9 $23 $212 Percent of Total 56% 8% 21% 4% 11% Agriculture Manufacturing ($ million) $4,313 $10,415 $14,620 $1,800 $751 $31,898 Percent of Total 14% 33% 46% 6% 2% Percent of Individual Industry Total Dairy products 20% 32% 42% 3% 3% $7,618 Fruits and Vegetables 9% 31% 51% 7% 2% $2,972 Bakery, confectionary, snack foods, & flavorings 10% 27% 59% 4% 1% $8,425 Animal foods 19% 39% 37% 4% <0.5% $1,877 Animal slaughter and processing 10% 45% 27% 15% 3% $1,202 Grain and oilseed processing 19% 13% 57% 10% <0.5% $1,802 Other foods 14% 26% 46% 12% 2% $963 Alcoholic beverages 6% 38% 48% 7% 1% $3,861 Soft drink and ice 9% 83% 6% 1% <0.5% $1,766 Ag chemical and equipment 25% 9% 34% 15% 17% $1,411 Retail Trade Food and Beverage ($ million) $755 $10,682 $2,044 $0 $33 $13,513 Percent of Total 6% 79% 15% 0% <0.5% Food Services and Drinking Places ($ million) $7,421 $29,242 $1,408 $55 $1,762 $39,888 Percent of Total 19% 73% 4% <0.5% 4% Source: Implan (2012). Detail may not add due to rounding; zero values are < Other includes government demands, capital allocation, and inventory adjustments. 15
19 16
20 The 10 industries in the agricultural and food manufacturing sector of the New York economy are downstream from the industries in production agriculture. While the industries in this sector still produce goods and services used as intermediate inputs by other sectors of the economy, they also produce many finished food products that are delivered to households (either directly or through wholesale/retail sectors). Therefore, it should come as no surprise that for the sector as a whole only 14% of sales in 2011 were used by other firms as intermediate inputs. In contrast, the remaining 86% of the total sales were delivered to final users-- 33% to New York households and 46% to households and other final users in neighboring states or other regions of the country. Only 6% of deliveries are to foreign markets (See Table 3 and figure 2B.) The distribution of sales between intermediate and final users for industries within the agricultural and food manufacturing sector, however, does differ substantially around these sector-wide averages. About one-quarter of the output of agricultural chemicals and equipment is sold to other industries as intermediate inputs (e.g., fertilizers and pesticides as farm inputs), as is about 19% of the output from grain and oilseed processing which is used as input in numerous bakery and snack food products. Similarly 20% of manufactured dairy products, much of which (e.g., fluid milk, milk components, etc.) is used as intermediate inputs by other firms within the same industry (e.g. yogurt, cheese, etc.) or also used as intermediate inputs in bakery goods and related products. In contrast, about 83% of soft drink and ice production is delivered to households (predominantly through wholesale and retail trade outlets). About 45% of the value of products from animal slaughter and processing are ultimately delivered to New York households, as are 39% of animal foods (pet foods, etc.) and 38% of alcoholic beverages. 17
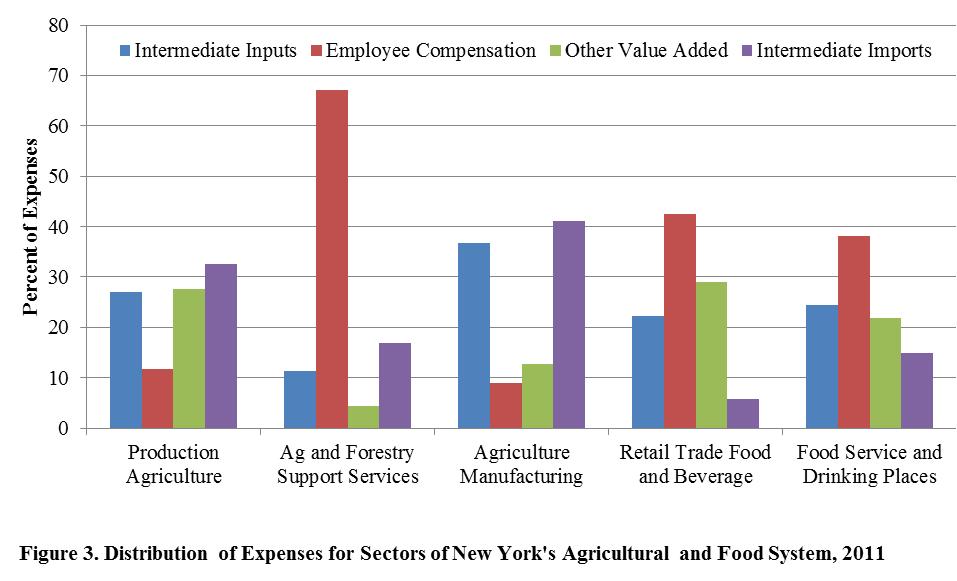
21 It is perhaps somewhat surprising that only about one-third of manufactured dairy products are consumed by households within the state. This is in part explained by the importance of domestic markets outside the state for six of the industries within the manufacturing sector, including manufactured dairy products. For these six industries, over 40% of the output is sold in domestic consumer markets and/or to firms that are beyond the state s borders. The percentages are highest for bakery goods and related products (59%) and processed grains and oilseeds (57%) followed in rank order by fruits and vegetables (51%), alcoholic beverages (48%), other manufactured foods (46%), and dairy products (42%). When viewed from a sales perspective, the two sectors that are furthest downstream from production agriculture are made up of retail firms in food and beverages and food service establishments and drinking places (Table 3 and Figure 2). Since the food and beverage retail trade sector includes grocery stores of all kinds; meat, fish, vegetable and fruit markets; bakeries, etc., the fact that nearly 79% of the value of total sales are to consumers within the state is not unexpected. Because the food service sector includes food service contractors and caterers in addition to bars and restaurants of all kinds, a lower level of deliveries are made to final consumers (73%), while 19% of the sales serve as intermediate inputs to other firms. Any sales to domestic markets outside of New York (15% and 4% for retail trade and food services, respectively) are likely to be in neighboring states and follow similar patterns between final sales and intermediate sales as we see in the New York markets. The heterogeneous sales allocations across agricultural production and manufacturing sectors highlight the need for differential marketing strategies employed by firms in the different sectors. Understanding these differences can help guide marketing development programs for firms and highlight market segments to target, including important opportunities beyond state domestic markets. 4.2 Patterns and Distribution of Industry Outlays (Inputs) The distribution of sales to intermediate and final markets provides one perspective (a downstream perspective if you will) on the structure of industries within New York s agricultural and food system. The upstream perspective gives an alternative, but equally important, view the structure of the state s agricultural and food system. From this perspective, we delineate the distribution of purchases of inputs needed by a particular sector in the production of its goods and services. As discussed above, the columns of the inter-industry transaction table provide this upstream perspective on the distribution of inputs purchases by each sector in the agricultural and food system. 9 In addition to providing this second important 9 Most purchases of intermediate inputs by sectors in New York s agricultural and food system are likely to be from downstream sectors in the agricultural and food system, but some of the other sectors in New York s economy (listed in Table 1) also sell intermediate inputs to sectors in New York s agricultural and food system. 18
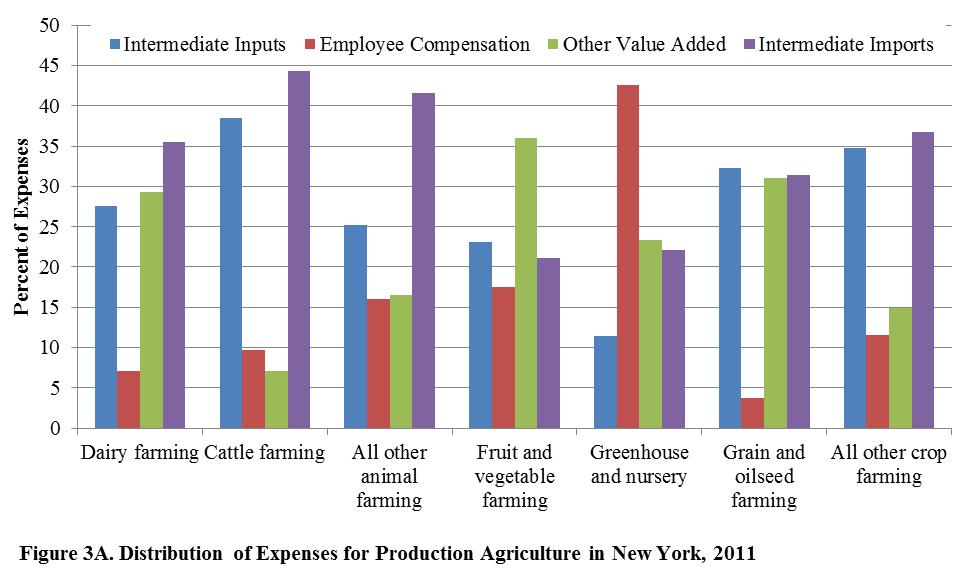
22 view of the structure of the agricultural and food system, this upstream distribution of expenditures on productive input, particularly among intermediate inputs, the several components of value added, and those inputs purchased from outside the state, have much to do with the differential magnitudes of the economic multipliers across sectors. For the industries in the state s agricultural and food system, these patterns of input purchases are detailed in Table 4 and Figures 3, 3A, and 3B. For the production agriculture sector as a whole, expenditures are distributed rather evenly among the three primary categories: 27% of total expenditures are for intermediate inputs, 39% are payments to labor and the other components of value added, and 33% are for intermediate inputs purchased from outside the state (Table 4 and Figure 3). The breakdown differs substantially across the seven industries within the sector (Table 4 and Figure 3A). The distribution of expenditures in dairy farming mirrors that for the entire sector, with 28%, 36%, and 35% going to intermediate inputs, value added, and intermediate imports, respectively. The labor and capital intensive nature of fruit and vegetable farming and greenhouses and nurseries is evidenced by the fact that 53% and 66% of production expenses, respectively, are payments to value added most of which are in the form of employee compensation and proprietor income. In percentage terms, intermediate input purchases in fruit and vegetable production (23%) are twice as large as for greenhouses and nurseries (11%). Intermediate input purchases are highest in percentage for cattle farming (39%), grains and oilseeds (32%) and other crop farming (35%). Of the seven industries within production agriculture, fruit and vegetable farming and greenhouses and nurseries spend the least in percentage terms (21-22%) on intermediate inputs from outside the state. This is in contrast to the other crop and livestock farming industries, where between 31% and 44% of input costs are for intermediate inputs from outside the state. When taken as a whole, the distribution of payments for agricultural and food manufacturing differ somewhat from that for production agriculture sector (Table 4 and Figure 3). Purchases of intermediate inputs as a percent of the total expenditures (37%) is slightly higher for agricultural and food manufacturing, but the payments to value added account for only 22% of total expenditures. About 41% of total production expenditures are for inputs purchased from out-ofstate. The distribution of production expenditures differs considerably across industries within the agricultural and food manufacturing sector (Table 4 and Figure 3B). At one extreme, for example, dairy manufacturing expenditures on intermediate inputs from within the state accounts for 59% of its total input costs. This is hardly a surprising result since a large portion of its inputs can be purchased from the local dairy producers. This also means that dairy products manufacturers are able to rely less on firms from outside the state spending only 27% of the 19
23 Table 4. Distribution of purchases (outlays) by sector for New York's agriculture and food system, Payments to Value Added Purchase Intermediate Inputs Total Employee Compensation Proprietor Income Other Property Income 1 Indirect Business Taxes Intermediate Imports Institutional Purchases 2 Sector/Industry Production Agriculture ($ million) $1,487 $2,164 $644 $874 $684 -$38 $1,788 $61 $5,500 Percent of Total 27% 39% 12% 16% 12% -1% 33% 1% Percent of Individual Industry Total Dairy farming 28% 36% 7% 1% 29% -1% 35% 1% $2,804 Cattle farming 39% 17% 10% 0% 8% -1% 44% 0% $253 All other animal farming 25% 33% 16% 6% 11% -1% 42% 1% $217 Fruit and vegetable farming 23% 53% 17% 49% -12% -1% 21% 2% $886 Greenhouse and nursery 11% 66% 43% 56% -32% 0% 22% 1% $399 Grain and oilseed farming 32% 35% 4% 18% 13% 0% 31% 1% $578 All other crop farming 35% 26% 12% 22% -5% -2% 37% 2% $364 Ag and forestry support services ($ million) $24 $152 $142 $45 -$41 $4 $36 $0 $212 Percent of Total 11% 71% 67% 21% -19% 2% 17% 0% Agriculture Manufacturing ($ million) $11,715 $6,866 $2,834 $283 $2,353 $1,395 $13,088 $229 $31,898 Percent of Total 37% 22% 9% 1% 7% 4% 41% 1% Percent of Individual Industry Total Dairy products 59% 13% 6% 0% 6% 0% 27% 0% $7,618 Fruits and Vegetables 32% 20% 12% 1% 8% 0% 47% 1% $2,972 Bakery, confectionary, snack foods, & flavorings 31% 24% 12% 1% 11% 0% 44% 1% $8,425 Animal foods 31% 16% 5% 0% 10% 0% 53% 1% $1,877 Animal slaughter and processing 33% 12% 14% 1% -2% 0% 54% 1% $1,202 Grain and oilseed processing 32% 10% 4% 0% 5% 0% 57% 1% $1,802 Other foods 30% 24% 16% 1% 7% 0% 45% 1% $963 Alcoholic beverages 20% 50% 6% 3% 7% 34% 30% 1% $3,861 Soft drink and ice 30% 13% 8% 2% 2% 0% 57% 1% $1,766 Ag chemical and equipment 32% 19% 7% 1% 11% 0% 49% 1% $1,411 Retail Trade Food and Beverage ($ million) $2,995 $9,665 $5,746 $1,564 $301 $2,053 $769 $83 $13,513 Percent of Total 22% 72% 43% 12% 2% 15% 6% 1% Food Services and Drinking Places ($ million) $9,740 $23,942 $15,206 $1,464 $4,252 $3,021 $5,960 $246 $39,888 Percent of Total 24% 60% 38% 4% 11% 8% 15% 1% Source: Implan (2012). Detail may not add due to rounding; zero values are < Other property type income includes dividends, interest, rent, corporate profits, and depreciation. 2 Institutional purchases include purchases from inventories, government, and households. 20 Total
24 21
The Economic Contributions of Agriculture in New York State (2014)
") August 2016 EB 2016-09 The Economic Contributions of Agriculture in New York State (2014) Todd M. Schmit Dyson School of Applied Economics and Management College of Agriculture and Life Sciences Cornell
August 2016 EB 2016-09 The Economic Contributions of Agriculture in New York State (2014) Todd M. Schmit Dyson School of Applied Economics and Management College of Agriculture and Life Sciences Cornell
Economic Contributions of Agriculture, Natural Resources, and Food Industries in Florida in
 FE969 Economic Contributions of Agriculture, Natural Resources, and Food Industries in Florida in 2013 1 Alan W. Hodges, Mohammad Rahmani, and Thomas J. Stevens 2 Executive Summary Agriculture, natural
Economic Impact of Agriculture and Agribusiness in Miami-Dade County, Florida
 Economic Impact of Agriculture and Agribusiness in Miami-Dade County, Florida Florida Agricultural Marketing Research Center, Industry Report 2000-1 October, 2000 by Robert Degner Tom Stevens David Mulkey
Contribution of Agribusiness to the Magic Valley Economy, 2010
 CIS 1193 Contribution of Agribusiness to the Magic Valley Economy, 2010 by S. Hines, J. Packham, and G. Taylor Introduction Irrigation has transformed the Magic Valley desert (Cassia, Lincoln, Minidoka,
Contribution of Agribusiness to the Magic Valley Economy, 2013
 BUL 916 Contribution of Agribusiness to the Magic Valley Economy, 2013 Steven Hines University of Idaho Extension, Jerome County Joel Packham UI Extension, Cassia County Carmen Wilmore UI Extension, Lincoln
USING IMPLAN TO ASSESS LOCAL ECONOMIC IMPACTS. David Mulkey and Alan W. Hodges. Introduction 1
 USING IMPLAN TO ASSESS LOCAL ECONOMIC IMPACTS David Mulkey and Alan W. Hodges Introduction 1 Policymakers, industry officials, and others often need information on the total economic impacts of specific
Economic Contributions of Agriculture, Natural Resources, and Food Industries in Florida in 2016 Executive Summary
 Economic Contributions of Agriculture, Natural Resources, and Food Industries in Florida in 2016 Executive Summary Christa D. Court, PhD, Alan W. Hodges, PhD, and Mohammad Rahmani, PhD University of Florida-IFAS,
The Measure of California Agriculture, 2006 CHAPTER FIVE AGRICULTURE S ROLE IN THE ECONOMY
 PREPRINT DRAFT November 29, 2006 The Measure of California Agriculture, 2006 CHAPTER FIVE AGRICULTURE S ROLE IN THE ECONOMY The direct economic contribution of agriculture Additional economic linkages
The Economic Importance of New Jersey s Food System in 2002
 The Economic Importance of New Jersey s Food System in 2002 Brian J. Schilling Kevin P. Sullivan June 2006 About Us The Food Policy Institute (FPI) is an academic research unit of Rutgers, the State University
AN ECONOMIC DESCRIPTION OF THE AGRICULTURAL SECTOR IN PERSHING COUNTY
 TECHNICAL REPORT UCED 2006/07-15 AN ECONOMIC DESCRIPTION OF THE AGRICULTURAL SECTOR IN PERSHING COUNTY UNIVERSITY OF NEVADA, RENO An Economic Description of the Agricultural Sector in Pershing County Report
Measuring the Effect of Louisiana Agriculture on the State Economy Through Multiplier and Impact Analysis
 October 1995 Number 849 Measuring the Effect of Louisiana Agriculture on the State Economy Through Multiplier and Impact Analysis By David W. Hughes 1 Table of Contents Introduction... 3 Input-Output Model
Economic Impacts of the Green Industry in the United States
 Economic Impacts of the Green Industry in the United States Final Report to the National Urban and Community Forestry Advisory Committee by Charles R. Hall, PhD, University of Tennessee 2621 Morgan Circle
The Iowa Pork Industry 2008: Patterns and Economic Importance by Daniel Otto and John Lawrence 1
 The Iowa Pork Industry 2008: Patterns and Economic Importance by Daniel Otto and John Lawrence 1 Introduction The Iowa pork industry represents a significant value-added activity in the agricultural economy
Contribution of Agribusiness to the Idaho Economy, 2011
 BULLETIN 890 Contribution of Agribusiness to the Idaho Economy, Garth Taylor, Ben Eborn, Philip Watson, and Willem Braak Executive summary In, the total output (sales of goods and services) of the Idaho
Contribution of Agribusiness to the Idaho Economy, 2013
 BULLETIN 900 Contribution of Agribusiness to the Idaho Economy, 2013 Garth Taylor, Ben Eborn, and Philip Watson Executive summary In 2013, the output (sales of goods and services) of the Idaho economy
The Iowa Pork Industry 2003: Patterns and Economic Importance
 The Iowa Pork Industry 2003: Patterns and Economic Importance by Daniel Otto and John Lawrence* Introduction The pork industry of Iowa represents a major value-added activity in the agricultural economy
Bank of America Corporation Estimated economic benefits of the Environmental Business Initiative September 2017
 Bank of America Corporation Estimated economic benefits of the Environmental Business Initiative 2013-2016 September 2017 Contents Executive summary... 1 1. Bank of America Environmental Business Initiative...
Kansas. Estimated Economic Impact of Agriculture, Food, and Food Processing Sectors 08/01/2017
 Estimated Economic of Agriculture, Food, and Food Processing Sectors 08/01/2017 Using the most recent IMPLAN data available (2015) adjusted for 2017, 65 agriculture, food, and food processing sectors were
Assessing the Economic Impacts of Regional Food Hubs: the Case of Regional Access
 Assessing the Economic Impacts of Regional Food Hubs: the Case of Regional Access Todd M. Schmit, Cornell University Becca B.R. Jablonski, Cornell University David Kay, Cornell University December 2013
EBERHARDT SCHOOL OF BUSINESS BusinessForecasting Center 12 Lodi REGIONAL
 EBERHARDT SCHOOL OF BUSINESS BusinessForecasting Center 12 Lodi 99 in partnership with San Joaquin Council of Governments 26 5 4 Stockton Lathrop 205 120 Manteca Ripon Tracy Escalon analyst REGIONAL september
Economic Impact Study of Agriculture-Related Industries
 Economic Impact Study of Agriculture-Related Industries 12-County Area in Southwest Missouri Presented by: SPRINGFIELD AREA CHAMBER OF COMMERCE AGRIBUSINESS ROUNDTABLE Economic Impact of Springfield Economic
Estimated Economic Impact of Agriculture, Food, and Food Processing Sectors 9/8/2016
 Estimated Economic Impact of Agriculture, Food, and Food Processing Sectors 9/8/2016 This study was commissioned by the Agricultural Business Council of Kansas City and the American Royal and performed
Economic Impact Report
 Economic Impact Report The Economic & Fiscal Impact on Maine of the State s Beer & Wine Distributors For: The Maine Beer & Wine Distributors Association P.O. Box 615 Augusta, ME 04332 From: Planning Decisions,
Economic Contributions of Agricultural and Rural Electric Cooperatives in New York State Economy
 Economic Contributions of Agricultural and Rural Electric Cooperatives in New York State Economy Economic Contributions of Agricultural and Rural Electric Cooperatives In New York State Todd Schmit, Associate
Examining Ag & Food Systems in New York State
 Agricultural Economic Development: 1 Examining Ag & Food Systems in New York State Todd M. Schmit Ruth and William Morgan Assistant Professor in Applied Economics & Management Director, Cornell Program
Economic Contribution of the Agriculture Industry in New Hampshire. Calendar Year Prepared for New Hampshire Department of Agriculture
 Economic Contribution of the Agriculture Industry in New Hampshire Calendar Year 2013 Prepared for New Hampshire Department of Agriculture by Daniel S. Lee and Mark Okrant The Institute for New Hampshire
Contribution of Agriculture to Oklahoma s Economy: 2015
 Contribution of Agriculture to Oklahoma s Economy: 2015 E-1046 Department of Agricultural Economics Division of Agricultural Sciences and Natural Resources Oklahoma State University Dave Shideler, Ph.D.
Sectoral engines of job-rich growth: Some lessons from ILO sectoral country studies
 Sectoral engines of job-rich growth: Some lessons from ILO sectoral country studies Frédéric Lapeyre CEPOL Employment Policy Department Job-rich Growth and Sectoral Policy: Some analytical tools Poverty
A Comparison of Contributions to the Canadian Economy of Key Bulk Commodity Shippers and Rail Freight Carriers
 Policy and Economic Analysis Program Rotman School of Management University of Toronto 140 St. George St., Ste 325 Toronto, Ontario M5S 3G6 Final Report October 2009 A Comparison of Contributions to the
ESTIMATED ECONOMIC IMPACTS OF THE CATTLE RANCHING AND FARMING SECTOR ON THE ELKO COUNTY ECONOMY
 TECHNICAL REPORT UCED 2005/06-26 ESTIMATED ECONOMIC IMPACTS OF THE CATTLE RANCHING AND FARMING SECTOR ON THE ELKO COUNTY ECONOMY UNIVERSITY OF NEVADA, RENO ESTIMATED ECONOMIC IMPACTS OF THE CATTLE RANCHING
Economic Contribution of the U.S. Lead Battery Industry
 Economic Contribution of the U.S. Lead Battery Industry Prepared for: Battery Council International 330 N. Wabash Ave., Suite 2000 Chicago, IL 60611 Prepared by: Economic Development Research Group, Inc.
The Economic Impact of the Ophthalmic Goods Manufacturing Industry on the Southern California Economy
 The Economic Impact of the Ophthalmic Goods Manufacturing Industry on the Southern California Economy March 2017 Introduction and Study Objectives The goal of this research overview is to quantify how
The Contributions of Agriculture to Idaho s Economy: 2006
 [In 26, Idaho] agriculture was responsible for generating $21 billion in total sales, 156,599 jobs, $4.2 billion in wages, and $8.4 billion in gross state product (GSP)... Based on this analysis, agriculture
Economic Contribution of Maine s Food Industry
 Maine Policy Review Volume 20 Issue 1 Maine's Food System 2011 Economic Contribution of Maine s Food Industry Todd M. Gabe University of Maine, TODD.GABE@UMIT.MAINE.EDU James C. McConnon Jr. University
EXTENSION. The Economic Impact of a Commercial Cattle Operation in a Rural Nebraska County. Key Findings EC856
 EXTENSION The Economic Impact of a Commercial Cattle Operation in a Rural Nebraska County David J. Peters Extension Rural Economic Development Specialist EC856 The purpose of this analysis is to estimate
CONTRIBUTION OF THE ETHANOL INDUSTRY TO THE ECONOMY OF THE UNITED STATES
 CONTRIBUTION OF THE ETHANOL INDUSTRY TO THE ECONOMY OF THE UNITED STATES Prepared for the Renewable Fuels Association by John M. Urbanchuk Managing Partner February 17, 2014 The environment facing the
Assessing the Economic Impacts of Local Food System Producers by Scale: A Case Study From New York
 657156EDQXXX10.1177/0891242416657156Economic Development QuarterlySchmit et al. research-article2016 Research and Practice Assessing the Economic Impacts of Local Food System Producers by Scale: A Case
Presidents Forum of the Distilled Spirits Industry Economic Impact Study. Methodology and Documentation Prepared for:
 Presidents Forum of the Distilled Spirits Industry Economic Impact Study Methodology and Documentation Prepared for: By John Dunham & Associates July 27, 2017 Executive Summary: The 2017 Presidents Forum
Economic Contribution of the Agricultural Sector to the Arkansas Economy in 2011
 Economic Contribution of the Agricultural Sector to the Arkansas Economy in 2011 Leah English, Jennie Popp, and Wayne Miller ARKANSAS AGRICULTURAL EXPERIMENT STATION October 2013 Research Report 992 Technical
Implications for Producer s Risk Management Strategies
 August 2007 EB 2007-12 Quantifying the Contributions to Dairy Farm Business Risk: Implications for Producer s Risk Management Strategies Todd M. Schmit, Hung-Hao Chang, Richard N. Boisvert, and Loren W.
THIS IS AN UPDATE OF A PREVIOUS STUDY. This study, like its 1996
 INTRODUCTION THIS IS AN UPDATE OF A PREVIOUS STUDY. This study, like its 1996 predecessor, looks at the economic impact of agriculture and agribusiness to Hillsborough County. The study also analyzes fiscal
Economic Impacts. Refineries in Skagit County
 Economic Impacts of the Refineries in Skagit County February 13, 2015 Center for Economic and Business Research Prepared for the Economic Development Association of Skagit County Table of Contents Executive
Yolo County Workforce Innovation Board Industry Clusters of Opportunity
 This report was prepared by the Labor Market Information Division (LMID) of the California Development Department to provide the Workforce Innovation Board () a resource for workforce development and planning.
Input-output models for agriculture and agri-food industries
 Input-output models for agriculture and agri-food industries Pre-conference: Canadian Agricultural Economics Society Andreas Trau 613-951-3466 andreas.trau@statcan.gc.ca January 11, 2017 Overview Introduction
Economic Impacts from Agricultural Production in Arizona
 Economic Impacts from Agricultural Production in Arizona Jorgen R. Mortensen Department of Agricultural and Resource Economics The Cardon Endowment for Agricultural Economics and Policy The College of
Agribusiness Industry to Idaho s Economy
 BUL 836 The Contribution of the Agribusiness Industry to Idaho s Economy R. G. Taylor Department of Agricultural Economics University of Idaho 2 The Contribution of the Agribusiness Industry to Idaho s
The Economic Performance of Food-Manufacturing Industries in Idaho
 The Economic Performance of Food-Manufacturing Industries in Idaho Yuliya Bolotova As part of the global economy, agriculture and agribusiness of the State of Idaho have been significantly affected by
Dairy Replacement Programs: Costs & Analysis 3 rd Quarter 2012
 February 2014 EB 2014-02 Dairy Replacement Programs: Costs & Analysis 3 rd Quarter 2012 Jason Karszes PRO-DAIRY Department of Animal Science Charles H. Dyson School of Applied Economics and Management
2015 Illinois Agriculture Economic Contribution Study. Prepared by:
 2015 Illinois Agriculture Economic Contribution Study Prepared by: Table of Contents 4 7 9 10 14 15 16 17 19 21 22 24 25 26 27 29 30 33 34 35 List of Figures List of Tables Executive Summary Key Findings
4 Agribusiness and economy-wide effects of the Agenda 2000 CAP EU reform
 4 Agribusiness and economy-wide effects of the Agenda 2000 CAP EU reform Alan Matthews and Ronnie O Toole Trinity College Dublin Introduction The FAPRI-Ireland agricultural sector model is used to make
THE AGRICULTURE AND AGRI-FOOD SYSTEM IN CANADA. Paper submitted by Statistics Canada *
 WORKING PAPER No 16 6 June 2005 ENGLISH ONLY STATISTICAL COMMISSION and ECONOMIC COMMISSION FOR EUROPE CONFERENCE OF EUROPEAN STATISTICIANS Joint UNECE/EUROSTAT/FAO/OECD Meeting on Food and Agricultural
Commodity Value Enhancement Fund Analysis
 Commodity Value Enhancement Fund Analysis AFPC Issue Paper 01-2 Abner W. Womack Edward G. Smith Agricultural and Food Policy Center Department of Agricultural Economics Texas Agricultural Experiment Station
Economic Impacts of Drought on the Florida Environmental Horticulture Industry 1
 FE385 Economic Impacts of Drought on the Florida Environmental Horticulture Industry 1 Alan W. Hodges and John J. Haydu 2 Abstract An economic impact study of Florida s environmental horticulture industry
TMD DISCUSSION PAPER NO. 91 ASSESSING IMPACTS OF DECLINES IN THE WORLD PRICE OF TOBACCO ON CHINA, MALAWI, TURKEY, AND ZIMBABWE
 TMD DISCUSSION PAPER NO. 91 ASSESSING IMPACTS OF DECLINES IN THE WORLD PRICE OF TOBACCO ON CHINA, MALAWI, TURKEY, AND ZIMBABWE Xinshen Diao Sherman Robinson Marcelle Thomas Peter Wobst International Food
CONTRIBUTION OF THE ETHANOL INDUSTRY TO THE ECONOMY OF MINNESOTA. February 29, 2016
 CONTRIBUTION OF THE ETHANOL INDUSTRY TO THE ECONOMY OF MINNESOTA February 29, 2016 Prepared for the Minnesota Bio-Fuels Association John M. Urbanchuk Managing Partner Stuart D. Norvell Senior Economist
USING A SOCIAL ACCOUNTING MATRIX TO CALCULATE OUTPUT AND EMPLOYMENT EFFECTS IN TANZANIA
 USING A SOCIAL ACCOUNTING MATRIX TO CALCULATE OUTPUT AND EMPLOYMENT EFFECTS IN TANZANIA Max Mendez-Parra June 2015 Website Acknowledgements Thanks to Dirk W. te Velde for his useful comments and suggestions.
2014 Iowa Ag Economic Contribution Study
 2014 Iowa Ag Economic Contribution Study Prepared for: Prepared by: September 2014 2014 Iowa Ag Economic Contribution Study September 2014 Contents List of Figures... 4 List of Tables... 6 Executive Summary...
CONTRIBUTION OF THE ETHANOL INDUSTRY TO THE ECONOMY OF THE UNITED STATES
 CONTRIBUTION OF THE ETHANOL INDUSTRY TO THE ECONOMY OF THE UNITED STATES Prepared for the Renewable Fuels Association by John M. Urbanchuk Technical Director February 2011 2010 was a year of continued
Prepared by: Agricultural Marketing Services Division Minnesota Department of Agriculture 90 West Plato Boulevard St.
 KANDIYOHI COUNTY LIVESTOCK INDUSTRY ECONOMIC IMPACTS Prepared by: Agricultural Marketing Services Division Minnesota Department of Agriculture 90 West Plato Boulevard St. Paul, MN 55107 www.mda.state.mn.us
Strathprints Institutional Repository
 Strathprints Institutional Repository McGilvray, J W and McNicoll, I H (1984) Scottish input-output tables for 1979. Quarterly Economic Commentary, 10 (2). pp. 85-90. ISSN 0306-7866, This version is available
6.1 Direct Requirements Coefficients
 Chapter 6 Data Base Summary: Input-Output Multipliers Betina V. Dimaranan and Robert A. McDougall For many purposes it is useful to know the answer to the following question: If the final demand for a
Appendix B. General Explanation and Report Form
 Appendix B. General Explanation and Report Form DEVELOPMENT OF THE REPORT FORM Planning for the NASS organic production survey began in the fall of 2013. Report form content was developed with individuals
The Importance of the Petroleum Industry to the Economy of the Western States
 The Importance of the Petroleum Industry to the Economy of the Western States The Importance of the Petroleum Industry to the Economy of the Western States José Alberro, Ph.D. Director, LECG April 2007
ECONOMIC EMERGENCY PROGRAM Economic Impact of Lost Poultry Processing Jobs in Faribault, Minnesota
 ECONOMIC EMERGENCY PROGRAM Economic Impact of Lost Poultry Processing Jobs in Faribault, Minnesota In late winter 2015, avian influenza was discovered in a flock of commercial turkeys in Minnesota. After
The University of Georgia
 The University of Georgia Center for Agribusiness and Economic Development College of Agricultural and Environmental Sciences Economic Contribution of Turfgrass Production, Ornamental Horticulture, Landscape
National Pork Producers Council
 National Pork Producers Council Economic Impact Studies OKLAHOMA PORK PRODUCTION AT-A-GLANCE 1,947 FARMS PRODUCING HOGS 2,150,000 TOTAL HOGS 12,100 JOBS IN PORK PRODUCTION $473.3 MILLION OF PERSONAL INCOME
There is much debate on the size and importance of
 Cooperative Extension Service Economic Issues Feb. 2 EI-2 Agriculture s Contribution to Hawaii s Economy PingSun Leung 1, Khem R. Sharma 1, and Stuart T. Nakamoto 2 There is much debate on the size and
Economic Impacts of Cost-Effective Energy Efficiency: Final Report on Proposed CPS Programs
 Economic Impacts of Cost-Effective Energy Efficiency: Final Report on Proposed CPS Programs Prepared for: City Public Service San Antonio, Texas Prepared by: Economic Development Research Group, Inc. Boston,
Chapter 1. The Intertemporal General Equilibrium Model (IGEM) 1.1 Introduction Intertemporal general equilibrium models represent worthwhile
 1.1 Introduction Intertemporal general equilibrium models represent worthwhile") Chapter 1. The Intertemporal General Equilibrium Model (IGEM) 1.1 Introduction Intertemporal general equilibrium models represent worthwhile additions to the portfolio of methodologies for evaluating the
Chapter 1. The Intertemporal General Equilibrium Model (IGEM) 1.1 Introduction Intertemporal general equilibrium models represent worthwhile additions to the portfolio of methodologies for evaluating the
AGRICULTURAL & APPLIED ECONOMICS
 University of Wisconsin-Madison Department of Agricultural & Applied Economics March 2004 Staff Paper No. 471 Wisconsin and the Agricultural Economy By Steven C. Deller AGRICULTURAL & APPLIED ECONOMICS
Working Paper. Assessing the Economic Impacts of Food Hubs to Regional Economies: a framework including opportunity cost
 WP 2015-03 February 2015 Working Paper Charles H. Dyson School of Applied Economics and Management Cornell University, Ithaca, New York 14853-7801 USA Assessing the Economic Impacts of Food Hubs to Regional
2011 Input-Output Tables for Japan
 2011 Input-Output Tables for Japan Joint Compilation Ministry of Internal Affairs and Communications Cabinet Office Financial Services Agency Ministry of Finance Ministry of Education, Culture, Sports,
Kiyoshi Kobayashi (Kyoto University)
") Online Publication Date: 10 March, 2012 Publisher: Asian Economic and Social Society Vietnam Economic Structure Change Based on Input-Output Table (2000-2007) Bui Trinh (National Account Department of
Online Publication Date: 10 March, 2012 Publisher: Asian Economic and Social Society Vietnam Economic Structure Change Based on Input-Output Table (2000-2007) Bui Trinh (National Account Department of
Economic Contributions of Agriculture, Natural Resources, and Food Industries in Florida in 2016
 Economic Contributions of Agriculture, Natural Resources, and Food Industries in Florida in 2016 Christa D. Court, PhD, Alan W. Hodges, PhD, and Mohammad Rahmani, PhD University of Florida-IFAS, Food &
The CTAHR Economic Issues publication EI-3,
 Economic Issues Aug. 2002 EI-4 The Linkages of Agriculture to Hawaii s Economy Junning Cai 1 and PingSun Leung 2 1 Department of Economics, University of Hawaii at Manoa; 2 CTAHR Department of Molecular
UPDATE OF TRUCKEE RIVER OPERATING AGREEMENT (TROA) INTERINDUSTRY MODEL: BACKGROUND AND USER S MANUAL
 INTERINDUSTRY MODEL: BACKGROUND AND USER S MANUAL") TECHNICAL REPORT UCED 2005/06-13 UPDATE OF TRUCKEE RIVER OPERATING AGREEMENT (TROA) INTERINDUSTRY MODEL: BACKGROUND AND USER S MANUAL UNIVERSITY OF NEVADA, RENO PAGE 2 Update of Truckee River Operating
TECHNICAL REPORT UCED 2005/06-13 UPDATE OF TRUCKEE RIVER OPERATING AGREEMENT (TROA) INTERINDUSTRY MODEL: BACKGROUND AND USER S MANUAL UNIVERSITY OF NEVADA, RENO PAGE 2 Update of Truckee River Operating
Economic Contribution of Proposed South St. Paul Union Pacific Rail Yard Improvements
 EXTENSION CENTER FOR COMMUNITY VITALITY Economic Contribution of Proposed South St. Paul Union Pacific Rail Yard Improvements A REPORT OF THE ECONOMIC IMPACT ANALYSIS PROGRAM Brigid Tuck, Owusua Yamoah,
Economic Impacts of Agricultural and Natural Resource Industries in Florida,
 FE627 Economic of Agricultural and Natural Resource Industries in Florida, 2003 1 Alan W. Hodges and W. David Mulkey 2 Estimates of economic impacts were developed for the agricultural and natural resource
MANUFACTURING IN IOWA
 MANUFACTURING IN IOWA NOVEMBER 2011 INSIDE: SECTOR SIZE 2 KEY INDUSTRIES EARNINGS 4 EXPORTS 5 JOB TRENDS 6 GDP TRENDS 7 COUNTY DEPENDENCE 3 8 OVERVIEW Iowa s competitive strengths in manufacturing emerged
Turkey. Mustafa Acar The original input-output table
 14.12 Turkey Mustafa Acar 14.12.1 The original input-output table The source table for Turkey s input-output (I/O) table is The Input-Output Structure of the Turkish Economy 1990, published by the State
Economic Impact of a Second Generation Biofuels Facility
 EXTENSION CENTER FOR COMMUNITY VITALITY Economic Impact of a Second Generation Biofuels Facility A Report of the Economic Impact Analysis Program Authored by Brigid Tuck and William Lazarus Economic Impact
The Economic Impact of the Auto Care Industry, 2017
 The Economic Impact of the Auto Care Industry, 2017 Methodology and Documentation Prepared for The Auto Care Association 7101 Wisconsin Ave. Suite 1300 Bethesda, MD 20814 by John Dunham & Associates, Inc.
Economic Contribution of Projects Leveraged with AURI Assistance: Fiscal Years
 EXTENSION CENTER FOR COMMUNITY VITALITY Economic Contribution of Projects Leveraged with AURI Assistance: Fiscal Years 2011-2017 A REPORT OF THE ECONOMIC IMPACT ANALYSIS PROGRAM Authored by Brigid Tuck
Economic Impact of the Maine Food System and Farm Vitality Policy Implications
 Economic Impact of the Maine Food System and Farm Vitality Policy Implications A Report to the Joint Standing Committee on Agriculture, Conservation and Forestry Second Regular Session of the 120 th Maine
Rising Flathead Valley 32 nd Annual Montana Economic Outlook Seminar February 6, 2007
 Rising Flathead Valley 32 nd Annual Montana Economic Outlook Seminar February 6, 2007 Center for Business Information and Research Flathead Valley Community College Director: Gregg Davis, Ph.D. Business
CONTRIBUTION OF THE ETHANOL INDUSTRY TO THE ECONOMY OF THE UNITED STATES
 CONTRIBUTION OF THE ETHANOL INDUSTRY TO THE ECONOMY OF THE UNITED STATES Prepared for the Renewable Fuels Association by John M. Urbanchuk Technical Director Environmental Economics Updated January 31,
Agriculture and Oregon's Economy
 Agriculture and Oregon's Economy Special Report 648 January 1982 Oregon State University Extension Service and Agricultural Experiment Station Frederick W. Obermiller, Associate Professor and Extension
Economic Impacts of Agricultural, Food, and Natural Resource Industries in Florida in
 FE680 Economic of Agricultural, Food, and Natural Resource Industries in Florida in 2004 1 Alan W. Hodges, Mohammad Rahmani, and W. David Mulkey 2 The agricultural, food and natural resource industries
Calculating the Economic Benefits of U.S. LNG Exports
 Calculating the Economic Benefits of U.S. LNG Exports Prepared for LNG Allies April 17, 18 ICF 9300 Lee Highway, Fairfax, VA 231 USA +1.703.934.3000 +1.703.934.3740 fax icf.com Calculating the Economic
A Procedure For Determining Food and Fiber Output, Employment, and Value-added by Agricultural Sector
 A Procedure For Determining Food and Fiber Output, Employment, and Value-added by Agricultural Sector by William Edmondson Economist, FRED, Economic Research Service and Gerald Schluter Agricultural Economist,
Economic Impacts of Connecticut s Agricultural Industry Update 2015
 Economic Impacts of Connecticut s Agricultural Industry Update 2015 Presented to The Connecticut Farm Bureau Association on February 16, 2017 The Connecticut Department of Agriculture on March 10, 2017
Cultivating Trade: The Economic Impact of Indiana s Agricultural Exports
 Cultivating Trade: The Economic Impact of Indiana s Agricultural Exports April 2012 Research conducted by Indiana Business Research Center, Kelley School of Business, Indiana University Cultivating Trade:
The Economic Importance of Food and Fiber
 The Economic Importance of Food and Fiber A Spotlight on Polk County, Georgia Prepared by: July 2018 Agriculture in Georgia Georgia's 2016 Farm Gate Value was over $13.75 billion. Adding the value of $2.5
CULTURE SATELLITE ACCOUNT FREQUENTLY ASKED QUESTIONS April 2015
 CULTURE SATELLITE ACCOUNT FREQUENTLY ASKED QUESTIONS April 2015 CSA 101 Questions What is the Canadian Culture Satellite Account (CSA)? The CSA is an accounting framework or, simply stated, a tool developed
Construction and Operational Impacts
 The Economic Impacts of a Sangamon County Power Plant Construction and Operational Impacts August 2017 Prepared By: 148 N. Third Street DeKalb, IL 60115 www.cgs.niu.edu The Economic Impacts of a Sangamon
ASSESSMENT OF BACKWARD AND FORWARD LINKAGES IN INDIAN ECONOMY: AN INPUT-OUTPUT BASED ANALYSIS
 CHAPTER 6 ASSESSMENT OF BACKWARD AND FORWARD LINKAGES IN INDIAN ECONOMY: AN INPUT-OUTPUT BASED ANALYSIS 6.1 Introduction Over the years the Indian economy has undergone a structural change in its sectoral
Economic Contributions of Agriculture, Natural Resources and Food Industries in Florida in 2014
 Economic Contributions of Agriculture, Natural Resources and Food Industries in Florida in 2014 Alan Hodges and Mohammad Rahmani, UF/IFAS Report available at http://www.edis.ifas.ufl.edu August 2016 Contents
Agriculture s Contribution to New Mexico s Economy
 Agriculture s Contribution to New Mexico s Economy Circular 675 Joel Diemer, Terry Crawford, and Michael Patrick 1 Cooperative Extension Service College of Agricultural, Consumer and Environmental Sciences
Farm Credit Canada Annual Report
 16 17 2016-17 Annual Report Annual Report 2016-17 19 Agriculture industry overview FCC advances the business of agriculture by lending money to all agriculture sectors, including primary producers, agribusinesses
Economic Contribution of the Wheat Industry to North Dakota
 Agribusiness and Applied Economics Report No. 554-S February 2005 Economic Contribution of the Wheat Industry to North Dakota Dean A. Bangsund and F. Larry Leistritz * North Dakota, like other Great Plains