What is a Watershed? Understanding Surface Runoff. Controlling Erosion and Sediment.
|
|
|
- Bruno Goodman
- 5 years ago
- Views:
Transcription
1 What is a Watershed? Understanding Surface Runoff. Controlling Erosion and Sediment. Aleksey Sheshukov Assistant Professor and Water-Quality Specialist Biological & Agricultural Engineering ashesh@ksu.edu, (785)

2 WHAT IS A WATERSHED? HOW MANY WATERSHEDS IN KANSAS? HOW TO DEFINE A WATERSHED?

3 Watershed Terminology A watershed refers to an area of land that drains to a common water body such as a lake or a stream Watershed characteristics: Watershed divide Stream network Watershed outlet Subwatersheds

4 Watershed Hierarchy National Program by USGS and USDA-NRCS Hydrologic Unit Code, or HUC, is used to identify specific watersheds at different scales The number of digits in a HUC indicates the relative size of the watershed Large watersheds are comprised of smaller or "nested" watersheds HUC-2 HUC Digit # HUC NHDPlus


5 HUCs in Kansas 90 HUC 8 watersheds 355 HUC 10 watersheds 2020 HUC 12 watersheds
 required as input Sources of DEM (raster")

6 Watershed Delineation Process of defining watersheds called delineation Watersheds can be delineated using GIS Digital Elevation Model (DEM) required as input Sources of DEM (raster files): USGS DEM, NED, Compiled from contour maps Interpolated from points and lines Generated photogrammetrically
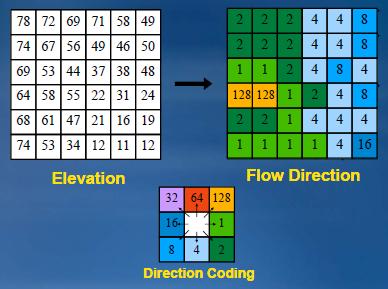
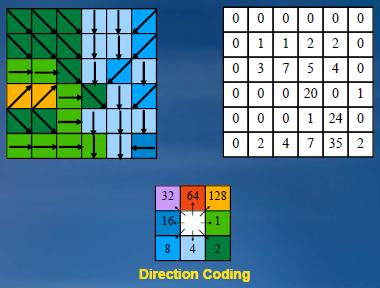
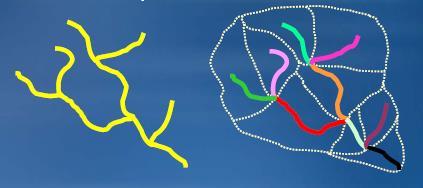
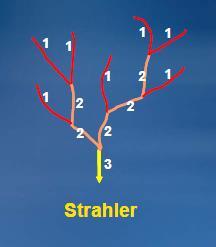
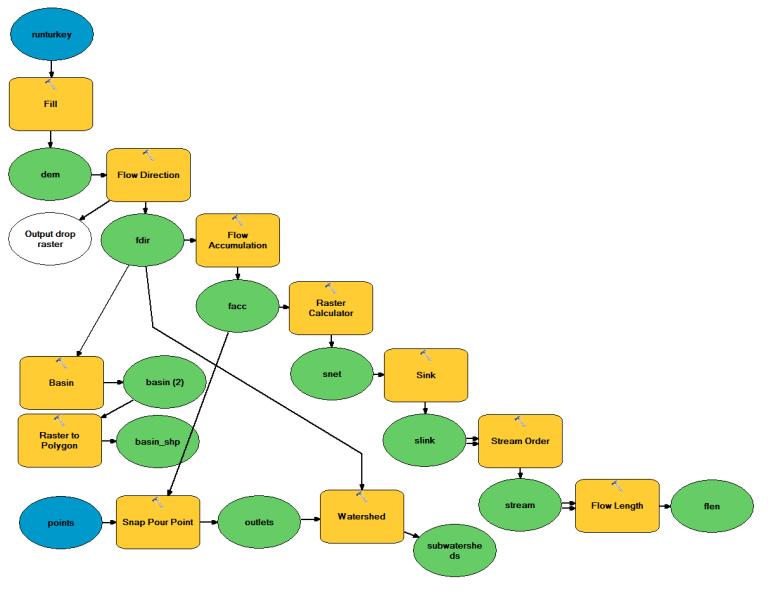
7 Watershed Delineation Steps Flow direction Flow accumulation Stream network Watershed system

8 GIS Tools ArcGIS Spatial Analyst Toolbox ArcGIS ArcHydro Toolbox ArcSWAT BASINS QGIS Delineation Toolset GIS and Delineation Tools

9 Examples and applications Delineated watershed and catchments Created streams Identified areas of swale Identified potential areas for erosion Identified potential terraces and diversions


10 Example: Flow Drainage Pathways

11 Example: Flow Drainage Pathways Before After T2 T1 T2 T B W3 W4 B 2 T3 2 T3 W5 T4 T4 3 4 D A C 3 4 W1 D A W2 C

12 HYDROLOGIC CYCLE. WATER BUDGET. SURFACE RUNOFF.
13 Distribution of Earth's Waters Location of storage Total water (acre-feet) % of total Total water on earth x Oceans 1.0 x % of fresh water Residence time (years) Total Fresh Water x ,977 Ice and Glaciers x ,210 Groundwater Deep 4.62 x Groundwater Shallow 3.63 x Lakes 9.9 x Biosphere 8.1 x Soil Moisture 1.98 x Atmosphere x Rivers 9.9 x Residence time (yr) = total amount stored (volume) / total annual inflow (volume/yr)

14 The Hydrologic Cycle From: 1955 Yearbook of Agriculture, USDA
15 Precipitation Hydrologic Cycle Components rain, snow, hail, freezing rain, fog, etc Depression storage / Interception Infiltration / Interflow Percolation / Aquifer recharge Overland flow / Surface runoff Baseflow / Deep groundwater Channel flow
16 Distribution of Precipitation Input i Precipitation Input (hyetograph) Precipitation distribution Streamflow (hydrograph) E ET Q time Interception Depression storage ET ET E time Infiltration Interflow Channel input Overland flow Aquifer recharge Channel input Deep groundwater Channel input
17 The Water Budget PR RO GW ET = S PR RO GW ET S precipitation surface runoff groundwater flow evapotranspiration change in storage

18 Infiltration Excess Runoff Rainfall rate exceeds soil Infiltration capacity. Areal source of runoff tends to be widespread More common in arid/semi arid regions areas with disturbed soil areas with sparse vegetation Function of storm, soil permeability Modeled by CN Method. Saturation Excess Runoff Runoff occurs from saturated soil. Source of runoff tends to be local, often lower in the landscape Function of position on landscape, antecedent soil moisture Partial source-area hydrology Requires other modeling approach. Surface Runoff Types What causes water to run across the soil rather than into it?
19 Surface Runoff Rate = Rainfall Rate Storage Rate Surface Runoff Storage (abstractions) are defined as those processes that remove rainfall from surface runoff: Storage (Rainfall abstraction) rate = Vegetative interception rate + Depressional storage rate + Infiltration rate + Evaporation rate + Other losses
20 Curve Number (CN) Model Where 2 PR Ia RO = PR Ia + S S = 1000/CN 10 Value of CN found from table No surface storage: CN = 100 or S = 0 No runoff: CN = 0 or S=infinity From experimental data: I a = 0.2 S
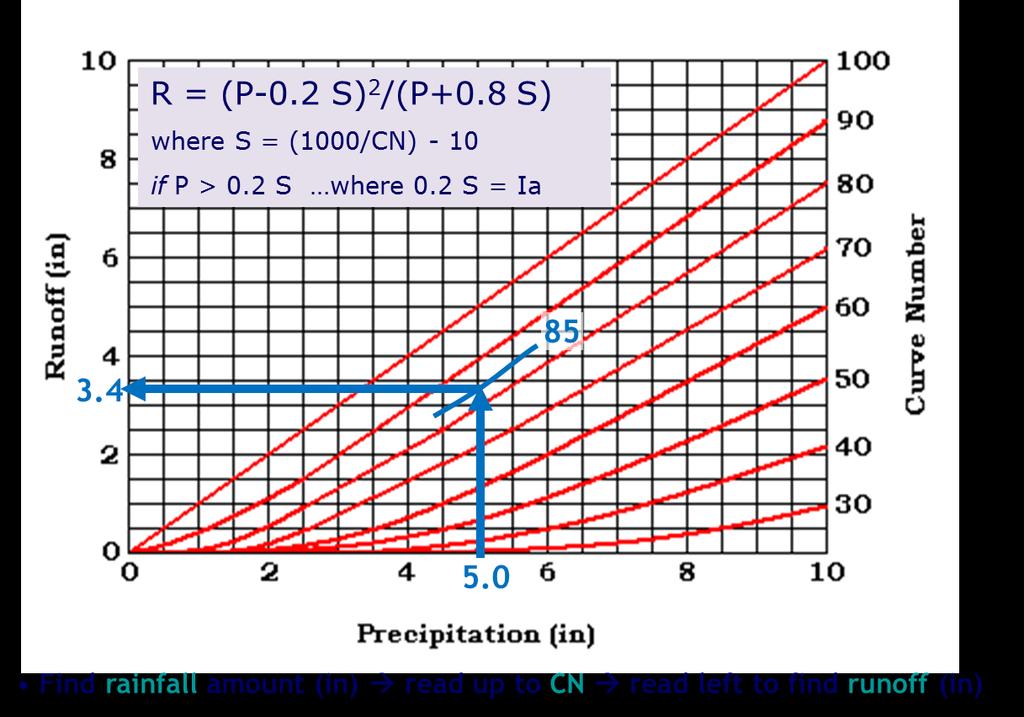
21 CN Method
22 CN Estimation Land Use: What is covering the ground? Treatment or Practice: How is cover managed? Hydrologic Condition: How well does the land use protect the ground? Hydrologic Soil Group: How much runoff (infiltration) does the soil allow? A: high infiltration (low runoff) D: low infiltration (high runoff)
 Field scale vs watershed scale (small single area vs. multi-area basin) Continuous vs.")
23 Watershed Models Watershed model is a representation of an environmental system through the use of mathematical equations Model types Physically-based vs. lumped (mechanistic vs. empirical) Field scale vs watershed scale (small single area vs. multi-area basin) Continuous vs. event-based

24 Input to Watershed Models Weather data Precipitation, Temperature, Relative humidity, Solar radiation, etc Soil type distribution within the watershed Topography Land Use / Land Cover Hydrography / Stream channel network Monitoring data Land management Other items?
25 Models WinTR-55; TR-20 SWAT; APEX; HSPF; AGNPS STEPL; Region-5; L-THIA; RUSLE Applications Runoff analysis Watershed assessment Sources of NPS Examples and Applications

26 SOIL EROSION AND TYPES. EROSION PROCESSES. EROSION FACTORS.
27 What is Soil Erosion? Soil erosion by water is the process of detachment and transport of soil from land by water flow. Forms of soil erosion Sheet & rill erosion rates in Kansas (in tons/acre/year) National Resources Inventory:


28 Splash Erosion Splash erosion Dislodges soil particles Breaks soil particles into smaller pieces that are more-easily transported Seals surface, which reduces infiltration Raindrop impact USDA NRCS Photo

 Ephemeral gully erosion Larger")
 gully erosion Larger")

29 Four Major Forms Sheet (interrill) erosion Small, nondistinct rills Rill erosion Larger rills (flow paths over soil) Ephemeral gully erosion Larger channels, removed by tillage (Classical) gully erosion Larger channels, not removed by tillage Rill erosion Gully erosion Sheet and Rill erosion Ephemeral gully erosion

30 Other Erosion Forms Channel erosion Streambank Channel bed Can be significant Streambank erosion

31 Sediment Deposition Where sediment can be deposited? Riparian buffers Grass waterways Channel bed Ponds, Wetlands Riparian buffers


32 Sediment Deposition Where sediment can be deposited? Riparian buffers Grass waterways Channel bed Ponds, Wetlands Grass Waterways Terraces Channel bed Wetlands
 58% (0.")

33 Sediment Delivery Deposition of sediment Riparian buffers Grass waterways Channel bed Ponds, Wetlands Net delivery rate: (Holland, 1971, Fig. 5) 58% (0.1 mi 2 watershed) to 22% (10 mi 2 watershed) Larger watersheds give more opportunity for settling Point Bar Cut Bank Flow Direction Slow water: Channel deposition Riparian buffer
34 Erosion Factors Features Rill erosion Ephemeral gully erosion Classical gully erosion Tillage Size Geometry Rills can be erased by tillage; Rills usually do not occur in the same places May be of any size but are smaller than ephemeral gullies Cross sections tend to be narrow relative to depth Ephemeral gullies are temporary channels; Ephemeral gullies can be obscured by tillage; Ephemeral gullies recur in the same location May be of any size but are larger than rills and smaller than permanent gullies Cross sections tend to be wide relative to depth; sidewalls frequently are not well defined; headcuts are usually not readily visible and are not prominent because of tillage Classical gullies cannot be obscured by normal tillage operations Larger than ephemeral gullies Cross sections of many gullies tend to be narrow relative to depth; sidewalls are steep; headcut usually prominent Flow pattern Flow pattern develops as many small disconnected parallel channels ending at ephemeral cropland gullies, terrace channels, or where deposition occurs; Rills are generally uniformly spaced and sized A dendritic pattern develops along depressional water courses, beginning where overland flow, including rills, converge; Flow patterns may be influenced by tillage, crop rows, terraces, or other unnatural features A dendritic pattern develops along natural water courses; Non-dendritic patterns may occur in road ditches, terrace, or diversion channels Location Rills occur on smooth side slopes above drainageways Occur along shallow drainageways upstream from incised channels or gullies Generally occurs in well-defined drainageways Soil removal Soil is removed in shallow channels but annual tillage causes the soil profile to become thinner over the entire slope Soil is removed along a narrow flow path, typically to the depth of the tillage layer where the untilled layer is resistant to erosion, or deeper where the untilled layer is less resistant; soil is moved into the voided area from adjacent land by mechanical action (tillage) and rill erosion, damaging an area wider than the eroded channel Soil may be eroded to depth of the profile and can erode into soft bedrock
35 Erosion depends on several factors Storm energy Soil erodibility Topography Land cover Land management Erosion Factors
36 USLE Universal Soil Loss Eq. USLE developed by USDA Soil Conservation Service Published in 1965 Based on data collected from 1930s Annual soil loss, A (tons/yr): A = R K LS C P USLE includes several factors Storm energy R Soil erodibility K Topography LS Land cover C Land management P


37 Rainfall: USLE R Factor Rainfall depth and intensity pattern controls runoff dynamics during rainfall events. Higher the intensity and larger rainfall depth, more water can flow on the surface and higher potential for soil erosion. The timing of rainfall (spring or winter when soil is bare) can cause more soil movement
38 Soil: USLE K Factor Soil allows water to drain and controls runoff. More silty soils are less cohesive and produce higher erosion rates. Soil moisture can prevent infiltration and cause higher runoff. Subsurface flow toward gullies makes soils less cohesive. USLE-K factor available for every soil type in U.S. Soil Texture, Organic Matter 324 soil types in Kansas

39 Slope shape plays an important role in overland flow converging from sheet flow to concentrated flow. Topography: USLE LS Factor Slope length and steepness determines areas of soil erosion and soil detachment.
40 Land Cover: USLE C Factor USLE-C factor is the ratio of soil loss from land cropped under specified conditions to corresponding loss under tilled, continuous fallow conditions. Management decisions about crop rotation and tillage system affect C.
41 USLE P Factor Management practices that reduce the erosivity of water moving across slopes will reduce soil erosion. Contouring, strip-cropping, terraces, and grassed waterways are all examples of erosion control practices used to establish the USLE-P factor.
42 Input USLE Example Rangeland Cropland Manhattan R Clay loam soil K 0.21 (4% OM) 0.25 (2%) 500 ft LS 1.2 (5%) 0.5 (3%) Crop cover C No terraces P A (tons/yr) = R K LS C P Rangeland: A = = 1.9 t/ac Construction (C = 1.0) A = 47.9 t/ac!! Cropland: A = = 7.1 t/ac Add terraces (P = 0.5) A = 3.5 t/ac (erodes) Add terraces (P = 0.1) A = 0.7 t/ac (leaves field) Less slope (S = 2%, LS = 0.35) A = 5.0 t/ac

, where there is an abrupt change in elevation.")
43 Ephemeral Gullies Ephemeral gullies form in drainageways or where opposing slopes meet Gullies are termed ephemeral because their occurrence is ephemeral, depending on rainfall and runoff conditions, the soil s resistance to erosion, and land use and treatment. Normal farming practices may completely or partially fill gullies with sediment, but occasionally, gullies recur in the same place later in the year. Active ephemeral gullies are recognized by headcuts (initiation or nick points), where there is an abrupt change in elevation. The channel below the headcut is formed by plunging flow and soil erosion, and reminds shallow river channels. Secondary nickpoints may be located downstream due to sudden grade change, field management, or crop canopy. Nick points travel upstream as gully system enlarges and expand in response to runoff flow and cover conditions
44 CONSERVATION PRACTICES TO CONTROL SURFACE RUNOFF AND EROSION
45 BMP Processes Reduce sediment availability Amount, timing, placement Increase infiltration Reduces runoff Less runoff energy and reduced transport capabilities Reduce erosion Reduces sediment yield Trap sediment in a structure Detain water, sediment Stream processes?
46 Runoff/Erosion Control Conservation practices BMPs for Cropland (1) No-till or Conservation tillage (residue > 30%) (10) Critical planting area (perennial plants in erodible land) (2) Conservation farming (follow contour) (5) Contour strip crop (2+alt. crop) Conservation structures ( in-field ) (3) Gradient terraces (drain toward waterway) (4) Level terraces (hold water behind terrace) Treatment structures ( between field and surface water ) (6) Grass waterway (carries field runoff) (7) VFS (between field and water) (8) Constructed wetland (shallow water w/ plants) (9) Sediment-control basin (detains water)

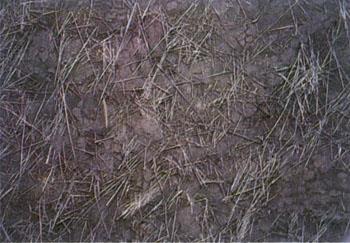
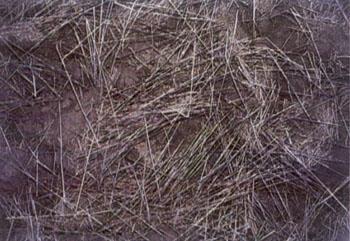
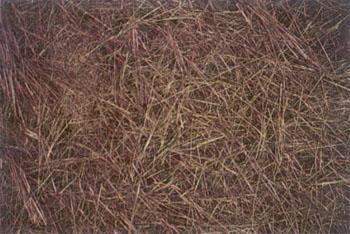
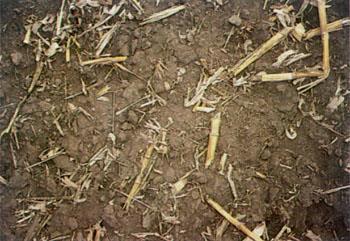
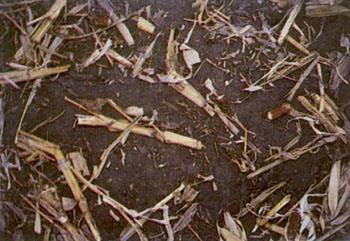
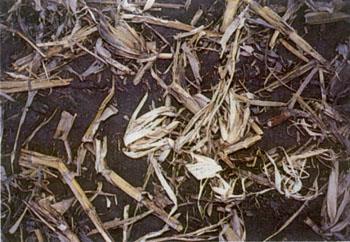
47 CROP RESIDUES: Conservation tillage (residue > 30%) 25% 50% 25% 50% WHEAT CORN 75% 75% 90% 90%

48 Contour Strip Cropping

49 Gradient terraces/contour farming Grass waterway (carries field runoff)

50 Vegetative Filter Strip (or Vegetative Buffer Strip)

51 Diversion A diversion is a channel running across a slope that directs water to a safe discharge area.

52 Sediment basin A temporary pond built on a site to capture eroded soil during rain storms
53 Conventional tillage Soluble Phosphorus Nutrients Total Phosphorus Nitrogen Suspended Solids Crop rotations Establish vegetative buffer strips Conservation tillage farming (>30 percent residue cover following planting) No-till farming Contour farming (without terraces) Terraces with tile outlets Terraces with grass waterways (with contour farming) Cover Crops (fall, winter, spring) Sediment Basin Wetlands Best Management Practice for No-till Crop rotations Establish vegetative buffer strips Contour farming (without terraces) Terraces with tile outlets Terraces with grass waterways (with contour farming) Cover Crops (fall, winter, spring) Insufficient data Sediment Basin Wetlands
54 KSRE Resources Water Primer MF3021: Part2, Hydrologic Cycle MF3023: Part 4, Surface Water MF3024: Part 5, Water Law MF3210: Part 9, The Kansas Water Budget and Water Footprint Water Quality and BMPs MF2572: Water Quality Best Management Practices MF2501: Total Maximum Daily Loads #6: Suspended Solids: A Water Quality Concern for Kansas MF3030: Cheney Lake Watershed: Erosion From Ephemeral Gullies MF2907: Impacts of No-till on Water Quality MF2682: Effects of Conservation Practices on Water Quality: Sediment
55 Thank You! Questions? Aleksey Sheshukov (785)
AnnAGNPS. Annualized AGricultural Non-Point Source Pollurant Loading Model. Annualized Agricultural Non-Point Source Pollutant Loading Model
 AnnAGNPS Annualized AGricultural Non-Point Source Pollurant Loading Model 1 Erosion Erosion can be expresed as: E=f(C, S, T, SS, M) E = erosion C = climate S = soil properties T = topography SS = soil
Runoff and soil loss. (Quantification and modeling of watershed discharge and sediment yield) Kassa Tadele (Dr.Ing) Arba Minch University
 Kassa Tadele (Dr.Ing) Arba Minch University") Runoff and soil loss (Quantification and modeling of watershed discharge and sediment yield) Kassa Tadele (Dr.Ing) Arba Minch University Part I. Runoff Contents 1. Fundamental Concepts 2. Generation of
Runoff and soil loss (Quantification and modeling of watershed discharge and sediment yield) Kassa Tadele (Dr.Ing) Arba Minch University Part I. Runoff Contents 1. Fundamental Concepts 2. Generation of
OVERVIEW OF RUSLE 2 DICK WOLKOWSKI DEPT. OF SOIL SCIENCE UW-MADISON
 OVERVIEW OF RUSLE 2 DICK WOLKOWSKI DEPT. OF SOIL SCIENCE UW-MADISON WHAT IS RUSLE 2 GREAT GRANDSON OF USLE MODEL TO PREDICT SOIL LOSS WHERE OVERLAND FLOW OCCURS COMPUTES ANNUAL SHEET/RILL EROSION COMPUTES
Degradation of the resource Fertility loss Organic matter Tilth degradation. Water quality Sediment Nutrients
 Near Blue River ca. 1980 Degradation of the resource Fertility loss Organic matter Tilth degradation Water quality Sediment Nutrients Program cost Cheaper to prevent Still expensive Long-term productivity
Models Overview: Purposes and Limitations
 Models Overview: Purposes and Limitations Pollutant load originates from: Point-source discharges (NPDES facilities) Info is available on the discharges (DMRs, etc.) Some are steady-flow, others are precip-driven
Evaluating BMP selection and placement in intermittent channels in Fort Cobb watershed
 Evaluating BMP selection and placement in intermittent channels in Fort Cobb watershed Preliminary Research Solmaz Rasoulzadeh, Arthur Stoecker Ph.D Student, Environmental Science Professor, Agricultural
New Practices for Nutrient Reduction: STRIPs and Saturated Buffers. Matthew Helmers and Tom Isenhart Iowa State University
 New Practices for Nutrient Reduction: STRIPs and Saturated Buffers Matthew Helmers and Tom Isenhart Iowa State University Situation Increasing concern for local and regional waters Substantial demand for
BAEN 673 / February 18, 2016 Hydrologic Processes
 BAEN 673 / February 18, 2016 Hydrologic Processes Assignment: HW#7 Next class lecture in AEPM 104 Today s topics SWAT exercise #2 The SWAT model review paper Hydrologic processes The Hydrologic Processes
History of Model Development at Temple, Texas. J. R. Williams and J. G. Arnold
 History of Model Development at Temple, Texas J. R. Williams and J. G. Arnold INTRODUCTION Then Model development at Temple A long history (1937-present) Many scientists participating in: Data collection
Definitions 3/16/2010. GG22A: GEOSPHERE & HYDROSPHERE Hydrology
 GG22A: GEOSPHERE & HYDROSPHERE Hydrology Definitions Streamflow volume of water in a river passing a defined point over a specific time period = VxA discharge m 3 s -1 Runoff excess precipitation - precipitation
What is runoff? Runoff. Runoff is often defined as the portion of rainfall, that runs over and under the soil surface toward the stream
 What is runoff? Runoff Runoff is often defined as the portion of rainfall, that runs over and under the soil surface toward the stream 1 COMPONENTS OF Runoff or STREAM FLOW 2 Cont. The types of runoff
4. Ponds and infiltration BMPs can achieve 60 to 100% removal efficiencies for sediment.
 Landscape BMPs For the purposes of this project, preventive measures have been categorized into two categories: landscape BMPs and source prevention BMPs. Landscape BMPs includes both vegetative practices
Estimating Field-Scale Runoff and Sediment Delivery. Seth M. Dabney, USDA-ARS Dalmo A. N. Vieira, USDA-ARS Daniel C. Yoder, Univ.
 Estimating Field-Scale Runoff and Sediment Delivery Seth M. Dabney, USDA-ARS Dalmo A. N. Vieira, USDA-ARS Daniel C. Yoder, Univ. of Tennessee Organization Buffers for concentrated flow control Distributed
Modeling Nutrient and Sediment Losses from Cropland D. J. Mulla Dept. Soil, Water, & Climate University of Minnesota
 Modeling Nutrient and Sediment Losses from Cropland D. J. Mulla Dept. Soil, Water, & Climate University of Minnesota Watershed Management Framework Identify the problems and their extent Monitor water
Hydrologic cycle, runoff process
 Hydrologic cycle, runoff process Motivation of hydrological modelling What happens at the catchment and in the stream when it rains? How does the increased/decreased runoff affect (not only) the landowners
NREM 407/507 WATERSHED MANAGEMENT Day 2
 NREM 407/507 WATERSHED MANAGEMENT 1-15-09 - Day 2 1. Review Hydrologic Cycle Terminology/Model 2. Summarize Differences Cropfield vs Perennial Watershed 3. Tues Lab Develop International River PPT bring
Precipitation Surface Cover Topography Soil Properties
 Precipitation Surface Cover Topography Soil Properties Intrinsic capacity of rainfall to cause erosion Influenced by Amount, intensity, terminal velocity, drop size and drop size distribution of rain.
L-THIA Online and LID in a watershed investigation
 L-THIA Online and LID in a watershed investigation Larry Theller Agricultural and Biological Engineering, Purdue University Great Lakes Sedimentation Workshop Ann Arbor Mi. L-THIA On-line watershed delineation
56 JOURNAL OF THE ALABAMA ACADEMY OF SCIENCE
 Reprinted from the Journal of the Alabama. Academy of Science, Volume 29. October 1, 1957. SECTION IV EFFECTS OF LAND USE ON STREAMFLOW By DONALD E. WHELAN Coweeta Hydrologic Laboratory, Dillard, Georgia
Soil Properties that influence detachment and runoff
 Soil Properties that influence detachment and runoff Texture Structure Aggregation Density/compaction Wettability Antecedent soil moisture Organic Matter Sandy soils Sands are easily detacted However,
Saturated Buffer. Subsurface Drainage PURPOSE N REDUCTION LOCATION COST BARRIERS
 Saturated Buffer To intercept tile drainage prior to discharging to surface waters and redistribute the water laterally in the soil profile of the streamside buffer. Subsurface drainage, also known as
CHAPTER ONE : INTRODUCTION
 CHAPTER ONE : INTRODUCTION WHAT IS THE HYDROLOGY? The Hydrology means the science of water. It is the science that deals with the occurrence, circulation and distribution of water of the earth and earth
LAKE COUNTY HYDROLOGY DESIGN STANDARDS
 LAKE COUNTY HYDROLOGY DESIGN STANDARDS Lake County Department of Public Works Water Resources Division 255 N. Forbes Street Lakeport, CA 95453 (707)263-2341 Adopted June 22, 1999 These Standards provide
Interpretations and Management of Soil
 Interpretations and Management of Soil Lesson 12: Interpretations and Management of Soil The first steps in evaluating soils involve learning how to identify horizons and site characteristics, and how
CHECKLIST FORM FOR ASSESSING GRAZING OPERATIONS
 CDQAP - RB2 Conditional Waiver Reference Binder Tab 8.1 May, 2017 CDQAP 2017 CHECKLIST FORM FOR ASSESSING GRAZING OPERATIONS Date: Name of Person Completing checklist: Facility Information Facility Name:
2010 Growing Season - Cowley County, Kansas Land Cover Summary
 2010 Growing Season - Cowley County, Kansas Land Cover Summary Number of Fields Percent of Total Fields Total Acres Percent of Acres ALFALFA 3 0.7% 68.5 0.2% CORN 35 8.4% 2,494.7 8.9% CRP - - - - FALLOW
Calculating Soil Loss
 Lesson C7 3 Calculating Soil Loss Unit C. Plant and Soil Science Problem Area 7. Soil Erosion and Land Management Lesson 3. Calculating Soil Loss New Mexico Content Standard: Pathway Strand: Problem Solving
Alan Keninger March 5, 2010
 Alan Keninger March 5, 2010 Acknowledgements Allan Ciha Jesse Drew Tom Schultz Kenneth Moore Tom Lonachyn Shari, Alyssa, and Dustin My Roots Family farm in North Central Iowa Six brothers and sisters Raised
A Toolbox for Water Management. By Nick Schneider, Winnebago County Ag Agent and Doral Kemper
 A Toolbox for Water Management By Nick Schneider, Winnebago County Ag Agent and Doral Kemper On-Farm Bioreactors by Madeline Fisher, Crops and Soils, Nov-Dec 2010 AKA: Denitrifying biofilter reactors Removes
Prioritizing Water-Quality Improvement Efforts on Agricultural Lands Using LiDAR Elevation Data
 Prioritizing Water-Quality Improvement Efforts on Agricultural Lands Using LiDAR Elevation Data Aaron Ruesch and Theresa Nelson Wisconsin Department of Natural Resources WLWCA March 11, 2014 Outline WLWCA
NREM 407/507 WATERSHED MANAGEMENT
 NREM 407/507 WATERSHED MANAGEMENT Please pick up Syllabus, Reading Material & Today s Lab on the Table in the Front Dick Schultz Instructor Sara Berges Teaching Assistant January 13, 2009 1. Conduct Get
Modeling the Impacts of Agricultural Conservation Strategies on Water Quality in the Des Moines Watershed
 Modeling the Impacts of Agricultural Conservation Strategies on Water Quality in the Des Moines Watershed Presenter: Jeff Arnold, Supervisory Research Engineer, USDA-ARS C. Santhi, M. White, M. Di Luzio
2010 Growing Season - Barton County, Kansas Land Cover Summary
 2010 Growing Season - Barton County, Kansas Land Cover Summary Number of Fields Percent of Total Fields Total Acres Percent of Acres ALFALFA 39 7.1% 3,075.5 6.4% CORN 45 8.1% 5,328.6 11.1% CRP 4 0.7% 408.5
CHAPTER 2 EROSION CONTROL
 CHAPTER 2 EROSION CONTROL 2.1 EROSION AND EROSION CONTROL Understanding Erosion Erosion occurs when soil particles are detached from the land surface and carried downslope by moving water. Figure 2.1-1
Introduction. Welcome to the Belgium Study Abroad Program. Courses:
 Introduction Welcome to the Belgium Study Abroad Program Courses: AGSM 335: Soil and Water Management BAEN 460: Principals of Environmental Hydrology BAEN 460 / AGSM 335 Combined lecture and HW sessions
Hydrology 101. Impacts of the Urban Environment. Nokomis Knolls Pond Summer June 2008
 Hydrology 101 Nokomis Knolls Pond Summer 2002 Impacts of the Urban Environment Hydrologic Cycle; What is it? Geography, Topography, Geology, Land Cover and Climate determine the Amount and Behavior of
Deep River-Portage Burns Waterway Watershed 2015
 2.4 Soils Soil development is the product of the interaction of parent material, topography, climate, organisms and time. Understanding the types of soils that exist within a watershed and their characteristics
The Phosphorus Management Tool
 The Phosphorus Management Tool Heather Hutchinson Nutrient Management Specialist June 18, 2013 Understanding Phosphorus Why are soils high in phosphorus? Why is phosphorus a problem? How is phosphorus
General Groundwater Concepts
 General Groundwater Concepts Hydrologic Cycle All water on the surface of the earth and underground are part of the hydrologic cycle (Figure 1), driven by natural processes that constantly transform water
Shelbyville, Kentucky Stormwater Best Management Practices (BMPs) Stormwater Pollution Treatment Practices (Structural) DRAFT
 Stormwater Pollution Treatment Practices (Structural) DRAFT") Shelbyville, Kentucky Stormwater Best Management Practices (BMPs) Stormwater Pollution Treatment Practices (Structural) Activity: Infiltration Systems PLANNING CONSIDERATIONS: Design Life: Short IS Acreage
Shelbyville, Kentucky Stormwater Best Management Practices (BMPs) Stormwater Pollution Treatment Practices (Structural) Activity: Infiltration Systems PLANNING CONSIDERATIONS: Design Life: Short IS Acreage
Nutrient Management in. A presentation to the West Metro Water Alliance
 Nutrient Management in Developing and Agricultural Areas A presentation to the West Metro Water Alliance Chris Meehan, P.E. May 25, 2011 Agenda Physical Improvements Planning Improvements How to get it
Appendix 12. Pollutant Load Estimates and Reductions
 Appendix 12. Pollutant Load Estimates and Reductions A pollutant loading is a quantifiable amount of pollution that is being delivered to a water body. Pollutant load reductions can be calculated based
River Channel Characteristics
 River Channel Characteristics Storages and Transfers in Drainage Basins Precipitation Evapotranspiration SURFACE STORAGE INTERCEPTION STORAGE CHANNEL STORAGE Soil Moisture Storage Aeration Zone Storage
EXTENSION Know how. Know now. EC195 (Revised August 2012)
") EXTENSION Know how. Know now. EC195 (Revised August 2012) The Nebraska Phosphorus Index (2012): Background And Users Guide Charles S. Wortmann, Extension Soils Specialist Charles A. Shapiro, Extension
EXTENSION Know how. Know now. EC195 (Revised August 2012) The Nebraska Phosphorus Index (2012): Background And Users Guide Charles S. Wortmann, Extension Soils Specialist Charles A. Shapiro, Extension
CENTRAL COAST POST-CONSTRUCTION REQUIREMENTS IMPLEMENTATION GUIDANCE SERIES 1
 CENTRAL COAST POST-CONSTRUCTION REQUIREMENTS IMPLEMENTATION GUIDANCE SERIES 1 SERIES ISSUE #2: DECENTRALIZED STORMWATER MANAGEMENT TO COMPLY WITH RUNOFF RETENTION POST-CONSTRUCTION STORMWATER CONTROL REQUIREMENTS
Conservation. Conservation Practice. Cover 327. What is it? How it Works. Which Resource Concerns? Where it Works Best
 Cover 327 Cover - Perennial vegetation cover that protects soil and water resources on land retired from agricultural production. Wind After harvest, a cover crop such as rye, oats or a legume is planted.
DRAFT USER S REFERENCE GUIDE
 DRAFT USER S REFERENCE GUIDE Revised Universal Soil Loss Equation Version 2 (RUSLE2) Prepared for USDA-Agricultural Research Service Washington, D.C. May 15, 2008 2 Acknowledgements RUSLE2 was developed
DEPARTMENT OF GEOGRAPHY POST GRADUATE GOVT. COLLEGE FOR GIRLS.SECTOR-11 CHANDIGARH CLASS-B.A.II PAPER-A RESOURCES AND ENVIRONMENT: WORLD PATTERNS
 DEPARTMENT OF GEOGRAPHY POST GRADUATE GOVT. COLLEGE FOR GIRLS.SECTOR-11 CHANDIGARH CLASS-B.A.II PAPER-A RESOURCES AND ENVIRONMENT: WORLD PATTERNS Hydrological cycle The sun, which drives the water cycle,
M.L. Kavvas, Z. Q. Chen, M. Anderson, L. Liang, N. Ohara Hydrologic Research Laboratory, Civil and Environmental Engineering, UC Davis
 Assessment of the Restoration Activities on Water Balance and Water Quality at Last Chance Creek Watershed Using Watershed Environmental Hydrology (WEHY) Model M.L. Kavvas, Z. Q. Chen, M. Anderson, L.
Cost-effective Allocation of Conservation Practices using Genetic Algorithm with SWAT
 Cost-effective Allocation of Conservation Practices using Genetic Algorithm with SWAT Manoj Jha Sergey Rabotyagov Philip W. Gassman Hongli Feng Todd Campbell Iowa State University, Ames, Iowa, USA Raccoon
WASA Quiz Review. Chapter 2
 WASA Quiz Review Chapter 2 Question#1 What is surface runoff? part of the water cycle that flows over land as surface water instead of being absorbed into groundwater or evaporating Question #2 What are
Climate Simulation Irrigation Winter Processes Surface Hydrology Water Balance & Percolation Subsurface Hydrology Soil Component Plant Growth Residue
 Climate Simulation Irrigation Winter Processes Surface Hydrology Water Balance & Percolation Subsurface Hydrology Soil Component Plant Growth Residue Decomposition and Management Overland Flow Hydraulics
The Texas A&M University and U.S. Bureau of Reclamation Hydrologic Modeling Inventory (HMI) Questionnaire
 Questionnaire") The Texas A&M University and U.S. Bureau of Reclamation Hydrologic Modeling Inventory (HMI) Questionnaire May 4, 2010 Name of Model, Date, Version Number Dynamic Watershed Simulation Model (DWSM) 2002
The Texas A&M University and U.S. Bureau of Reclamation Hydrologic Modeling Inventory (HMI) Questionnaire May 4, 2010 Name of Model, Date, Version Number Dynamic Watershed Simulation Model (DWSM) 2002
Integrating erosion and phosphorus runoff assessment with nutrient management planning in SnapPlus
 Integrating erosion and phosphorus runoff assessment with nutrient management planning in SnapPlus L Laura Ward Good Department of Soil Science University of Wisconsin-Madison What is nutrient management
Hydrology Review, New paradigms, and Challenges
 Hydrology Review, New paradigms, and Challenges Intent quick introduction with emphasis on aspects related to watershed hydrochemistry and new paradigms Watershed / Catchment Definition Portion of landscape
Antonio Mallarino Professor, Department of Agronomy. Introduction
 2003 Integrated Crop Management Conference - Iowa State University 121 USING THE IOWA PHOSPHORUS INDEX FOR AGRONOMIC AND ENVIRONMENTAL MANAGEMENT OF FERTILIZER AND MANURE PHOSPHORUS Antonio Mallarino Professor,
Chapter 2: Selecting Best Management Practices (BMPs)
") Chapter 2: Selecting Best Management Practices (BMPs) 2.1 - Temporary versus Permanent BMPs The same level of care should be taken to select both temporary BMPs and permanent BMPs. The same level of care
Chapter 2: Selecting Best Management Practices (BMPs) 2.1 - Temporary versus Permanent BMPs The same level of care should be taken to select both temporary BMPs and permanent BMPs. The same level of care
HYDROLOGY WORKSHEET 1 PRECIPITATION
 HYDROLOGY WORKSHEET 1 PRECIPITATION A watershed is an area of land that captures rainfall and other precipitation and funnels it to a lake or stream or wetland. The area within the watershed where the
Hydrology and Water Management. Dr. Mujahid Khan, UET Peshawar
 Hydrology and Water Management Dr. Mujahid Khan, UET Peshawar Course Outline Hydrologic Cycle and its Processes Water Balance Approach Estimation and Analysis of Precipitation Data Infiltration and Runoff
Best Management Practices (BMPs) are structural
 are structural") Agriculture and Natural Resources WATER QUALITY: Controlling Nonpoint Source (NPS) Pollution A L A B A M A A & M A N D A U B U R N U N I V E R S I T I E S ANR-790-4.2.3 The Rural Environment And NPS Pollution
Agriculture and Natural Resources WATER QUALITY: Controlling Nonpoint Source (NPS) Pollution A L A B A M A A & M A N D A U B U R N U N I V E R S I T I E S ANR-790-4.2.3 The Rural Environment And NPS Pollution
Soil and Water Conservation and Management as a Potential Strategy for Climate Change Adaptation
 Soil and Water Conservation and Management as a Potential Strategy for Climate Change Adaptation by Victor B. Ella, Ph.D. Professor Land and Water Resources Division, Institute of Agricultural Engineering
How Climate Change Impacts Urban Runoff and Water Quality Design
 How Climate Change Impacts Urban Runoff and Water Quality Design by J. C. Hayes, C. Privette, III and S. J. Klaine AWRA Conference Anchorage, AK May 4-7, 2009 Presentation Outline Introduction: Why manage
M.L. Kavvas, Z. Q. Chen, M. Anderson, L. Liang, N. Ohara Hydrologic Research Laboratory, Civil and Environmental Engineering, UC Davis
 Assessment of the Restoration Activities on Water Balance and Water Quality at Last Chance Creek Watershed Using Watershed Environmental Hydrology (WEHY) Model M.L. Kavvas, Z. Q. Chen, M. Anderson, L.
PLACEMENT OF RIPARIAN FOREST BUFFERS TO IMPROVE WATER QUALITY
 PLACEMENT OF RIPARIAN FOREST BUFFERS TO IMPROVE WATER QUALITY Mark D. Tomer, USDA/ARS National Soil Tilth Laboratory, Ames, IA Michael G. Dosskey, USDA/FS National Agroforestry Center, Lincoln, NE Michael
HOW CHANGES IN NUTRIENT MANAGEMENT REGULATIONS WILL AFFECT FORAGE PRODUCTION
 HOW CHANGES IN NUTRIENT MANAGEMENT REGULATIONS WILL AFFECT FORAGE PRODUCTION Dick Wolkowski and Larry Bundy Department of Soil Science University of Wisconsin What are the issues Forage producers typically
DRAFT USER S REFERENCE GUIDE
 DRAFT USER S REFERENCE GUIDE Revised Universal Soil Loss Equation Version 2 (RUSLE2) George R. Foster, Research Hydraulic Engineer (retired) National Sedimentation Laboratory USDA-Agricultural Research
Evaluating the Reduction Effect of Nonpoint Source Pollution Loads from Upland Crop Areas by Rice Straw Covering Using SWAT
 SESSION J2 : Water Resources Applications - I New Delhi, India 2012 International SWAT Conference Evaluating the Reduction Effect of Nonpoint Source Pollution Loads from Upland Crop Areas by Rice Straw
Modeling the Influence of Agricultural Practices on Watershed Export of Phosphorus
 Modeling the Influence of Agricultural Practices on Watershed Export of Phosphorus Rem Confesor Jr., Ph.D. Sr. Research Scientist NCWQR, Heidelberg University 310 E. Market St., Tiffin, OH rconfeso@heidelberg.edu
Black River Watershed Management Plan Plan
 Black River Watershed Management Plan Plan Final Report Part II: Appendices May 2010 This watershed management plan was prepared for the New York State Department of State Division of Coastal Resources
Ponds Planning, Design, Construction
 United States Department of Agriculture Natural Resources Conservation Service Ponds Planning, Design, Construction Agriculture Handbook Number 590 Estimating storm runoff The amount of precipitation,
Bob Broz University of Missouri Extension
 Bob Broz University of Missouri Extension brozr@missouri.edu 573-882-0085 What is the purpose on the nutrient reduction committee? Reduce nutrient loading into the Mississippi River and into the Gulf of
GLASI GLASI. Priority Subwatershed Project. Great Lakes Agricultural Stewardship Initiative
 GLASI GLASI Great Lakes Agricultural Stewardship Initiative Priority Subwatershed Project Wigle Creek Priority Subwatershed Project Essex Region Conservation Authority Up to $75,000 per eligible farm business
The Relationship between the Properties and Features of Wetland Soils and the Adjacent Uplands
 The Relationship between the Properties and Features of Wetland Soils and the Adjacent Uplands By USDA Natural Resources Conservation Service Connecticut Staff Wetlands and watercourses are features of
2010 Growing Season - Harvey County, Kansas Land Cover Summary
 2010 Growing Season - Harvey County, Kansas Land Cover Summary Number of Fields Percent of Total Fields Total Acres Percent of Acres ALFALFA 12 2.6% 683.4 2.0% CORN 77 16.5% 6,627.5 19.7% CRP 1 0.2% 13.9
Webinar 2. Finding and Quantifying Credits
 Webinar 1. Overview Webinar 2. Finding and Quantifying Credits Webinar 3. Developing a Plan Webinar 4. Implementing and Verifying Offsets Adaptive Management Technical Handbook Released: 01/07/2013 http://dnr.wi.gov/topic/surfacewater/adaptivemanagement.html
Analysis of Effectiveness of Ohio NRCS Practice Standards in Addressing Five Leading Causes of Water Quality Impairment
 Analysis of Effectiveness of Ohio NRCS Practice Standards in Addressing Five Leading Causes of Water Quality Impairment March 1, 2010 By: Rick Wilson, Environmental Specialist, Ohio EPA -Division of Surface
CHELTENHAM TOWNSHIP Chapter 290: WATERSHED STORMWATER MANAGEMENT Article IV: Stormwater Management
 CHELTENHAM TOWNSHIP Chapter 290: WATERSHED STORMWATER MANAGEMENT Article IV: Stormwater Management Online ECode Available on Cheltenham Township Website at: http://ecode360.com/14477578 For all regulated
Reservoir age, increasing human population,
 B-6249 02/12 Eagle Mountain Watershed Management Brent Clayton, Justin Mechell, David Waidler and Clint Wolfe* Reservoir age, increasing human population, and changing land uses have prompted the development
Physically-based Distributed Hydrologic Modeling
 Physically-based Distributed Hydrologic Modeling Goal of Phys.-based Distrib. Hydrologic Modeling To date we have learned about: Key forcings at land surface (precipitation/net radiation) Physical processes
Chapter 6. Hydrology. 6.0 Introduction. 6.1 Design Rainfall
 6.0 Introduction This chapter summarizes methodology for determining rainfall and runoff information for the design of stormwater management facilities in the City. The methodology is based on the procedures
Theresa M. Possley Nelson, PE. Wisconsin Department of Natural Resources
 Theresa M. Possley Nelson, PE Wisconsin Department of Natural Resources WLWCA March 10, 2015 Aaron Ruesch Dave Evans Andrew Craig Adam Freihoefer Ann Hirekatur Impaired Waters & TMDLs Nonpoint Source Implementation
Appendix D. Erosion Management Sub- Plan
 Appendix D Erosion Management Sub- Plan DRENNAN SOLAR ENERGY FACILITY EROSION MANAGEMENT PLAN PRODUCED FOR ERM ON BEHALF OF SOLAIREDIRECT BY Simon.Todd@3foxes.co.za JUNE 2013 PURPOSE The purpose of the
Hands-on Session. Adrian L. Vogl Stanford University
 Hands-on Session Adrian L. Vogl Stanford University avogl@stanford.edu Questions InVEST can answer How much water is available? Where does the water used for hydropower production come from? How much energy
Modeling Sediment and Nutrient Loads Input to Great Lakes and Effects of Agricultural Conservation Practices on Water Quality
 Modeling Sediment and Nutrient Loads Input to Great Lakes and Effects of Agricultural Conservation Practices on Water Quality C. Santhi and CEAP National Assessment Team Texas A&M University System, Temple,
Design Guide for Vegetative Filter Strips Using VFSMOD
 Paper No. 99-2147 An ASAE Meeting Presentation Design Guide for Vegetative Filter Strips Using VFSMOD By Librianto Suwandono John E. Parsons Rafael Muñoz-Carpena Graduate Student Associate Professor Researcher
Parameter Calibration of SWAT Hydrology and Water Quality Focusing on Long-term Drought Periods
 2017 SWAT June 28-30, 2017 Centrum Wodne SGGW, Warsaw, Poland Theme I3 Environmental Applications Room: Assembly Hall 2 2017 International SWAT Conference Parameter Calibration of SWAT Hydrology and Water
Thanks to Bill Elliot, Research Leader U.S. Department of Agriculture Forest Service
 Thanks to Bill Elliot, Research Leader U.S. Department of Agriculture Forest Service To present an overview Forest Soil Erosion Processes 2 Precipitation or melting snow Evapotranspiration Infiltration
Application of AnnAGNPS to model an agricultural watershed in East-Central Mississippi for the evaluation of an on-farm water storage (OFWS) system
 system") Application of AnnAGNPS to model an agricultural watershed in East-Central Mississippi for the evaluation of an on-farm water storage (OFWS) system Ritesh Karki a, Mary Love M. Tagert a, Joel O. Paz a,
Application of AnnAGNPS to model an agricultural watershed in East-Central Mississippi for the evaluation of an on-farm water storage (OFWS) system Ritesh Karki a, Mary Love M. Tagert a, Joel O. Paz a,
Variable-width buffers to reduce sediment pollution from potato production on steep slopes of Black Brook Watershed using AgBufferBuilder
 Variable-width buffers to reduce sediment pollution from potato production on steep slopes of Black Brook Watershed using AgBufferBuilder Josée Owen and Sheldon Hann Agriculture and Agri-Food Canada Potato
EFFECTS OF WATERSHED TOPOGRAPHY, SOILS, LAND USE, AND CLIMATE ON BASEFLOW HYDROLOGY IN HUMID REGIONS: A REVIEW
 PROGRESS IN PHYSICAL GEOGRAPHY EFFECTS OF WATERSHED TOPOGRAPHY, SOILS, LAND USE, AND CLIMATE ON BASEFLOW HYDROLOGY IN HUMID REGIONS: A REVIEW KATIE PRICE 2011 Presented by: Jordan Martin Article Overview
Toward a Great Lakes Watershed Ecological Sustainability Strategy (GLWESS): Modeling Workshop. Lansing, MI May 3, 2012
: Modeling Workshop. Lansing, MI May 3, 2012") Toward a Great Lakes Watershed Ecological Sustainability Strategy (GLWESS): Modeling Workshop Lansing, MI May 3, 2012 Presentation Outline Overview of ecological concerns General modeling overview How
Toward a Great Lakes Watershed Ecological Sustainability Strategy (GLWESS): Modeling Workshop Lansing, MI May 3, 2012 Presentation Outline Overview of ecological concerns General modeling overview How
Hydrologic Cycle. Water Availabilty. Surface Water. Groundwater
 Hydrologic Cycle Hydrologic ydoogccyce cycle Surface Water Groundwater Water Availabilty 1 Hydrologic Cycle Constant movement of water above, on, and, below the earth s surface (Heath) Endless circulation
Single most important determinant of the establishment and maintenance of specific types of wetlands & wetland processes
 Wetland Ecology Lectures 12 & 13 Wetland Hydrology Hydrology Single most important determinant of the establishment and maintenance of specific types of wetlands & wetland processes Starting point of hydrological
APPENDIX E APPENDIX E ESTIMATING RUNOFF FOR SMALL WATERSHEDS
 APPENDIX E ESTIMATING RUNOFF FOR SMALL WATERSHEDS March 18, 2003 This page left blank intentionally. March 18, 2003 TABLES Table E.1 Table E.2 Return Frequencies for Roadway Drainage Design Rational Method
Groundwater Level and Movement
 Groundwater Level and Movement Infiltration and Recharge Infiltration Entry of rain water into the ground. Recharge Addition of infiltrated water to the aquifer. Two types of Recharge- 1. Natural 2. Artificial
Placement of Riparian Forest Buffers to Improve Water Quality
 University of Nebraska - Lincoln DigitalCommons@University of Nebraska - Lincoln USDA Forest Service / UNL Faculty Publications U.S. Department of Agriculture: Forest Service -- National Agroforestry Center
The soil is a very. The soil can. The manure. Soil Characteristics. effective manure treatment system if manures are applied at the proper rate.
 The soil is a very effective manure treatment system if manures are applied at the proper rate. The soil can filter pollutants and prevent them from reaching groundwater. The manure application rate should
Soil Erosion Causes and Effects
 Soil Erosion Causes and Effects J. Ritter, P.Eng. ORDER NO. 12-053 AGDEX 572/751 OCTOBER 2012 (replaces OMAFRA Factsheet, Soil Erosion Causes and Effects, Order No. 87-040) Soil erosion is a naturally
Red River Valley Drainage Water Management Demonstration Project
 Red River Valley Drainage Water Management Demonstration Project Aaron Janz, Margaret Wagner, Jeppe Kjaersgaard Minnesota Department of Agriculture Drainage Research Forum November 23, 2015 Project Partners
GIS Analysis of Gully Head Erosion Rates on High Ridge Tree Farm in Winona County, Minnesota
 GIS Analysis of Gully Head Erosion Rates on High Ridge Tree Farm in Winona County, Minnesota Lisa M. Worrell Department of Resource Analysis, Saint Mary s University of Minnesota, Winona, MN 55987. Keywords: