US and World Grain Supply & Demand As of 1 July 2012
|
|
|
- Derrick Rice
- 5 years ago
- Views:
Transcription
1 US and World Grain Supply & Demand As of 1 July 2012 Jay O Neil International Grains Program at Kansas State University joneil@ksu.edu

2 Who is the Worlds Largest Wheat Producer? Who is the Worlds Largest Corn Producer?
3
4

5 CORN MARKET
6
7
 2009")
8 CME Corn-Soybean Ration (SX/CZ)

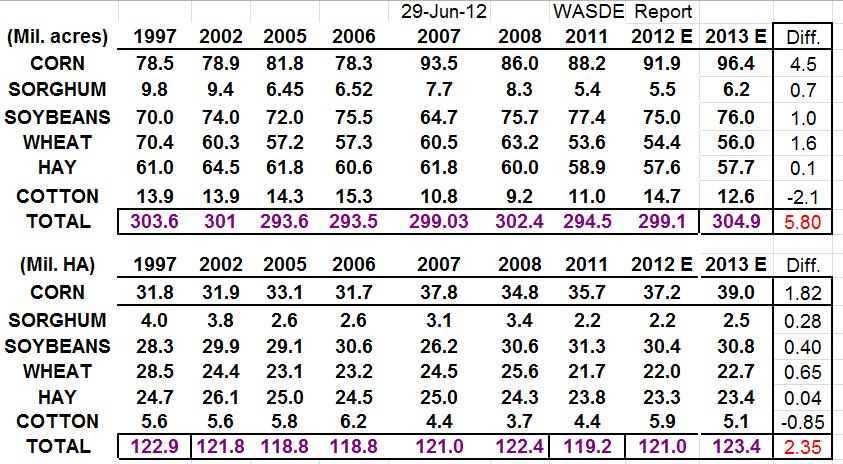
9 Major U.S. Crop Production Acres
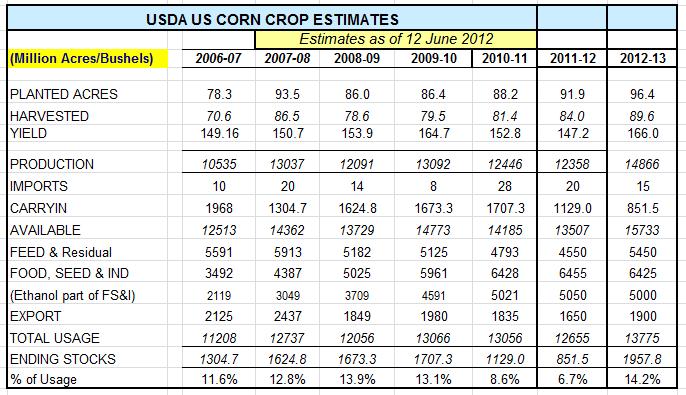
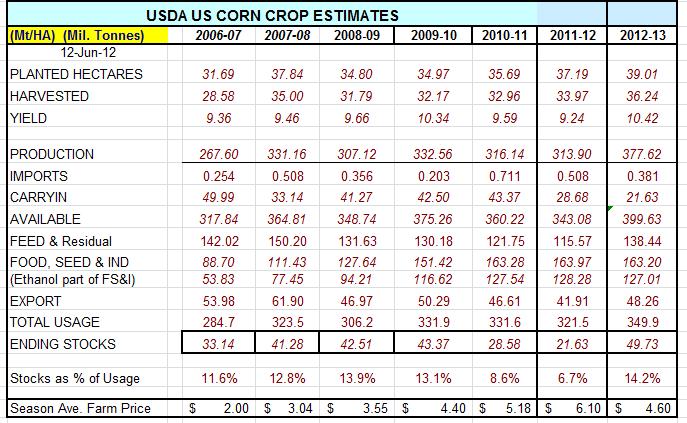
10 = 93.5 mil. Acres = mi. HA = 88.2 million Acres = mil. HA Est. =91.9 million Acres =37.19 mil. HA Est. =96.4 million Acres =39.01 mil. HA
11 = mt/ha = mt/ha = 9.59 mt/ha est. = 9.23 mt/ha (147.2 bu/acre) est. = mt/ha (166 bu/acre) Or is it 151 bu/acre = 9.48 mt/ha??
12 = mil.mt = mil. mt = mil mt Estimated = mmt Estimated Or is it?
13
14
15 = mil.mt = mil.mt = mil.mt = 46.61mil. mt est = mmt est.= mmt
16

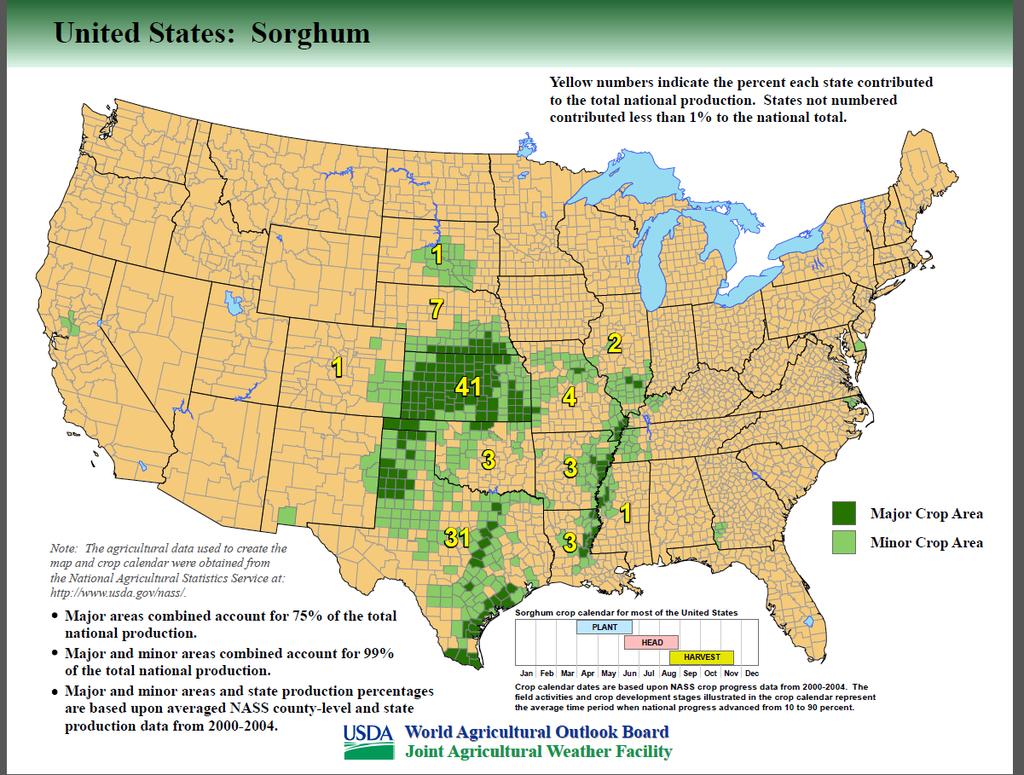
17 U.S. Grain Sorghum
18
19
20

21 Acres est.=6.21 million = 2.5 mil. HA 5.24 million Acres x Yield of 54.6 = Production of million bushels 2.12 million HA x Yield = 7.26 million mt Production
22
23
24
25
26
27
28
29

30 212 plants 2 Plants under construction/expansion April 2012 text22
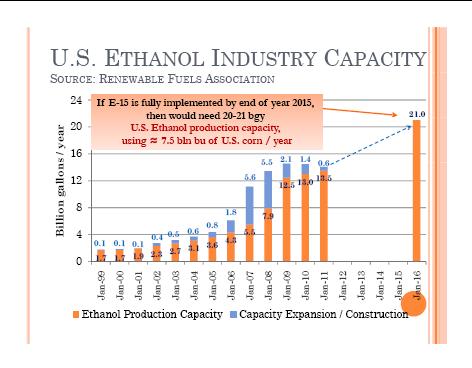
31 ETHANOL FACILITIES Total Current Ethanol Plants 209 (August 2011) Name Plate Capacity of 14.7 billion gallons Producing Billion gallons per year (52.8 billion liters) Total plants under construction or expansion - 2 Total capacity under construction 133 million Gal.+ (.503 billion liters). Total Reported Capacity after 2012 construction = Billion gallons = (56.13 billion liters). Some major companies do not report capacity. Updated: April (RFA)
32 Reported Name Plate Capacity = billion gallons Reported Operating Production = billion gallons 5 % of Capacity not operating 10 April 2012
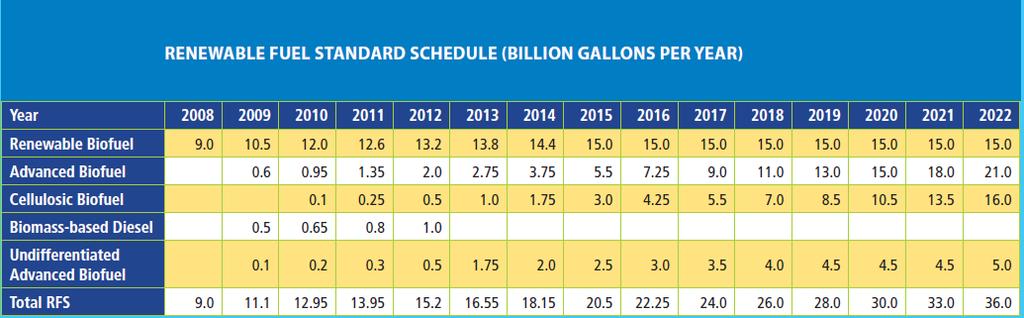
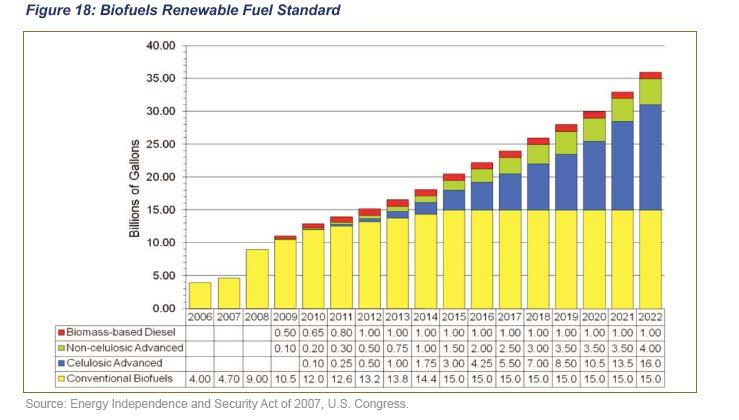
33 New U.S. Energy Bill The new energy bill calls for a 36 billion gallon/year ( bil. liters) renewable fuels standard (RFS) by Current RF Standard calls for 9 billion gallons (34 bil. liters) of renewable full production by The new mandate will require the production of 15 billion gallons (56.8 bil. liters) by 2015 and will add 3 billion gallons of fuel derived from cellulosic material (11.35 bil. liters) per year to that from 2016 to 2022 when the total mandate will reach 36 billion gallons (this is 4 times current production levels). Aside from the increased demand for corn that this will create, it will be a real challenge to develop infrastructure capabilities to blend and transport this volume of products (corn, ethanol and the DDGS).

34 Next-Generation Bio-Fuels Plants
35
36
37 New US Renewable Fuel Standard Billion Gal. Billion Liters
38
39
40
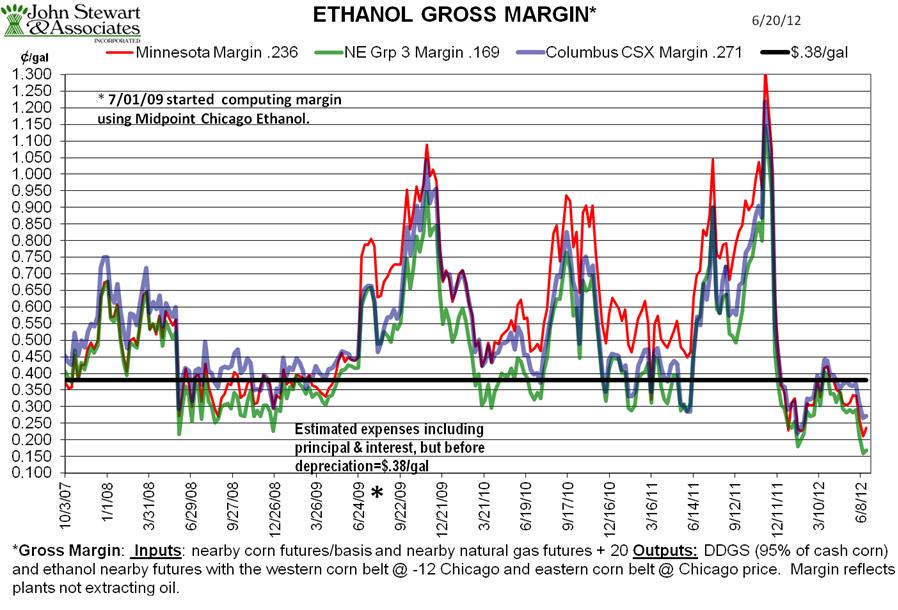
41 Fob Vessel DDGS Price vs. Corn
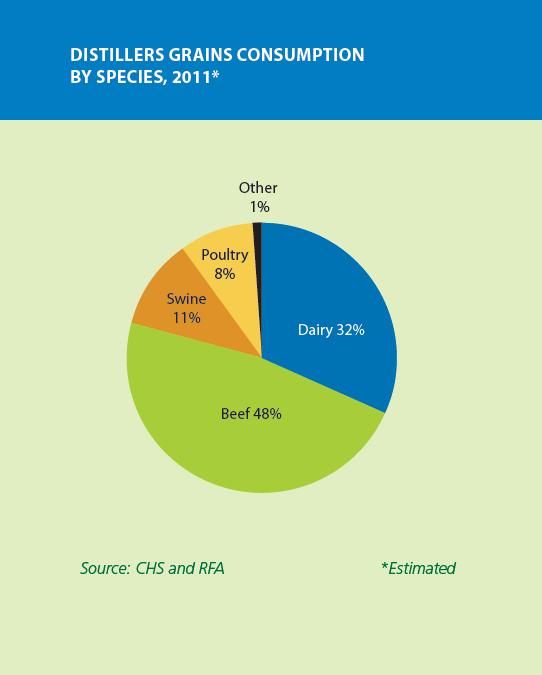
42 CORN Displaced by DDGS in Feed Rations Year Million YC bushels DDGS Production Million Tonnes DDGS Exports est est. *** The above estimates come from the ProExporter Network However- Relatively Cheap Feed Wheat and SBM is cutting DDGS demand
43 ProExporter Network
44 DDGS
45 REST of the WORLD CORN SUPPLY
46 2011 US Percentage of World Trade Corn = 45.7 % Soybeans = 43.8 % Wheat = 28.2 %
47

48 Eight Major World Corn Producers = 85% of World Crop mil.mt
49 WORLD PERCENT of CORN EXPORTS

50 6 Major Corn Exporters =90 % of World Trade
51 25.0 million MT 2013-Exports 16.0 mil.mt
52 67.0 mil. MT Exports 12.0 mil mt.
 2010-11 est.= 168 mil.mt (Some say 160 mil mt?) 2011-12 est.= 178 mil. Mt 2012-13 est.")
53 Est.= mil.mt (159?) Est.= mil.mt (Some say 145 mil. mt?) est.= 168 mil.mt (Some say 160 mil mt?) est.= 178 mil. Mt est.= 195. mil mt

54 Imports = 2.0 million mt imports = mmt?
55 UKRAINE CORN EXPORTS MILLION METRIC TONS exports Est. Corn = Production 5.5 million mt = 11.9 mil.mt (exports est. at 5.5 mmt) 2012 Est. Corn Production = 18.0 mil. mt (Exports est. at 10.0 mmt) Est. Corn production = 24.0 mmm. (Exports = 14.0 mmt) CROP YEAR BEGINNING

56 World Corn Production = million mt World Corn Consumption = million mt

57 World Corn Ending Stocks = million mt = 17 % Stocks to use Ratio (61 days of usage)
58 on Farm $275.57/mt $255.90/mt $216.53/MT $196.85/MT $157.47/MT $118.10/mt
59 CME December Corn Futures (CZ2)
60

61 SOYBEAN MARKET
62
63 est.= 75.0 mil. acres = mil. HA est.= 76.1 mil acres = 30.8 million HA
64 Estimate = 41.8 bushels/acre = 2.95 mt/ha
65 Est. Production = 3,056 mil. bushels or million mt Est. Production = 3,205 mil. bushels or million mt
66 Est. Exports = mmt est. Exports = mmt mil.mt or 50 % of this to China?

67 Ending Stocks = 140 million bushels = 3.8 million mt Stocks to Use ratio =.04 % (15.7 days usage)
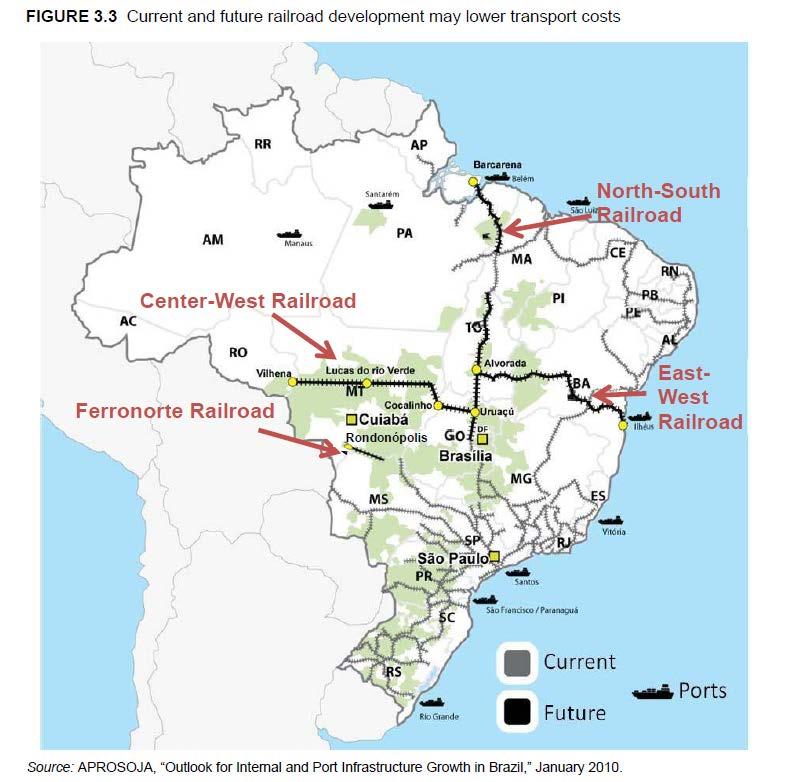
68 To Farmers $507.05/mt $367.43/mt $293.95/mt $183.71/mt $154.32/mt
69 OTHER COUNTRIES
70 Est. for Crop = mil. Mt Exports at 7.8 mmt Est. for Crop = mil. Mt Exports at mmt
71 Production Est. = 65.5 mmt Production Est. = 78.0 mmt Exports mil/mt Exports mil/mt

72 USA = mil. mt Brazil = mil mt Argentina = mil. mt = mil mt of world total mil mt mmt 81 % of World Production
73 74.52 mil. mt
74 Imports estimated at 61.0 mmt = 82 % of domestic consumption China Imports of mmt out of mil.mt of total world trade = 62 % of world trade in soybeans. (20 mil.mt from USA?)

75 World Soybean Production = million mt World Soybean Consumption = million mt

76 58.54 mil. mt = 22 % = 81 days usage

77 With a 7% annual increase in Soybean demand, the world needs to add a minimum of 6 million acres (2.4 million HA) of new soybean land each year. Total Cerrado Land Area = 510 million Acres = 206 million HA Currently Cropped for grain= 25 million acres = 10 million HA Potential new Crop Area = million acres = million HA
78
79

80 WHEAT MARKET
81 Crop Year = Est million acres = million HA
82 est. = million bushels = Est mmt

83 Production = 12.0 mmt Exports = 6.20 mil mt

84 Exports = mmt 26.0 mil.mt

85 Exports = 18.5 mil mt 27.0 mil.mt
86 Exports = 1.0 mil mt Imports = 2.5 mil. mt mil. mt

87 Exports = 14.5 mil.mt Imports = 5.5 mil. mt mil mt

88 Exports 2.50 mmt 91.0 mil.mt
89 Exports = 16.0 mil.mt est. = 53.0 million mt
 Black Earth Farming Ltd.")
90 Wheat Planting in Russia -Town of Kastoroye, Kursk Region Russia (275 miles south of Moscow) Black Earth Farming Ltd. 18,000 hectares or 44,478 acres of Wheat.

91 Production est. = 15.0 mil mt (down 7.0 mmt from last yr.) Exports = 8.5 mil mt.

92 Ukraine Wheat Production vs. Usage, MMT Production Exports Usage est. = 13.0 million mt. (down 9.1 mil mt from last yr. Exports = 4.0 mil.mt Crop Year Beginning 12

93 Production Est. = mil.mt Consumption Est. = mil.mt

94 World Ending Stocks Est. at mmt =27 % of use or 99 days of consumption
95 Highest percentage carried by China mmt mmt
96
97
98
99 So; What s Going On? What is The Market Watching?
100
101

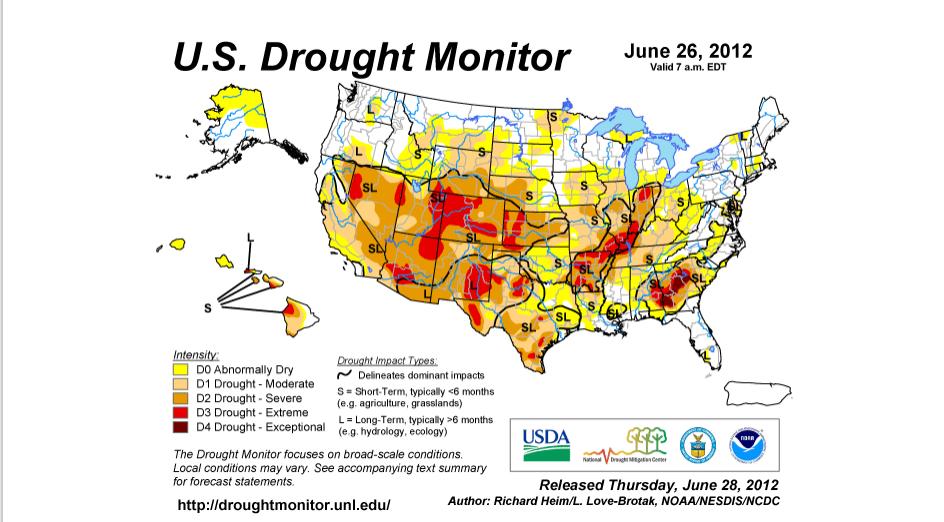
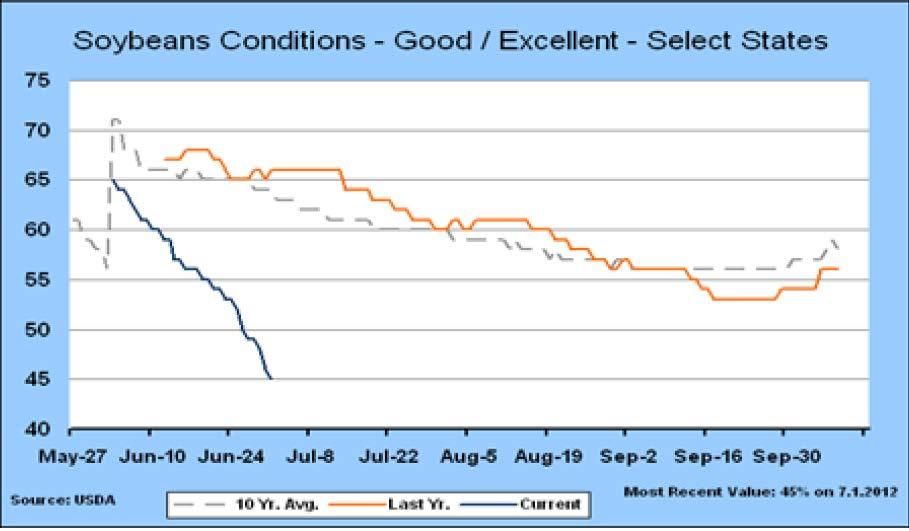
102 Central US, month of June, should rank as the #1 driest since 1988, #2 driest since 1936 and #5 driest over June 2012

103 25 June 2012
104
105
 March 2011 $410")
106 AUM s (Assets Under Management) March 2011 $410 Billion
107 GRACIAS THANK YOU Jay O Neil Kansas State University joneil@ksu.edu
Corn Producers, Ethanol Markets, and Co-Products: Jamey Cline, Director of Biofuels and Business Development
 Corn Producers, Ethanol Markets, and Co-Products: When 92 Million Acres is Not Enough Jamey Cline, Director of Biofuels and Business Development More Corn Per Acre Million Acres Acreage Production Billion
THE ECONOMICS OF CELLULOSIC ETHANOL
 THE ECONOMICS OF CELLULOSIC ETHANOL 2007 Mike Woolverton Kansas State University mikewool@agecon.ksu.edu Renewable Fuel Production Drivers 1. Energy Security 2. High Cost of Transportation Fuel 3. Post-peak
World trade in Grains and Oilseeds: Milestones for 2010
 World trade in Grains and Oilseeds: Milestones for 2010 By Dr. Robert Wisner Biofuels Economist & University Professor AgMarketing Resource Center Iowa State University Ames, Iowa U.S.A. Topics to Be Discussed
Grains Outlook for 2014 SAEA Crops Outlook Organized Symposium Dallas, TX February 4, 2014
 Grains Outlook for 2014 SAEA Crops Outlook Organized Symposium Dallas, TX February 4, 2014 Dr. Nathan B. Smith (UGA) and Dr. Mark Welch (TAMU) Corn Corn Situation Record production. Leveling off of corn-starch
Fundamental Shifts Impacting U.S. Agriculture
 Fundamental Shifts Impacting U.S. Agriculture Richard Brock California Grain & Feed Association San Diego, CA April 28, Game Changers 3 fundamental shifts Long term Impact $2 cotton in 2011 industry will
USDA lowered the 2010/11 wheat carry out by 5 million and decreased 2010/11 Yield by.3 bushels/acre.
 Tuesday November 9 th 2010 World Ag Supply & Demand Estimates Slightly Bullish for Corn More Bullish for Soybeans Friendly U.S. Wheat USDA lowered the 2010/11 corn carry out by 75 million and decreased
USDA lowered the 2010/11 wheat carry out by 49 million and decreased 2010/11 Yield by.2 bushels/acre.
 Friday October 8 th 2010 World Ag Supply & Demand Estimates Very Bullish for Corn Bullish for Soybeans Friendly U.S. Wheat USDA lowered the 2010/11 corn carry out by 214 million and decreased 2010/11 Yield
NOVEMBER 2017 USDA SUPPLY/DEMAND ESTIMATES. Overview
 NOVEMBER 2017 USDA SUPPLY/DEMAND ESTIMATES Overview Corn: This month s 2017/18 U.S. corn outlook included larger production, increased feed use and exports, and higher ending stocks. Corn production is
2019 Grain Market Outlook
 2019 Grain Market Outlook Sumner County Ag Day Wellington, Kansas January 17, 2019 DANIEL O BRIEN EXTENSION AGRICULTURAL ECONOMIST 1) U.S. Economy 2019 Grain Market Drivers A relatively strong U.S. GDP,
Reaction to USDA Reports
 August 10, 2012 Reaction to USDA Reports CROP PRODUCTION CORN: 10.779 billion bu.; trade expected 10.971 billion bu. -- compares to 12.358 billion bu. in 2011 BEANS: 2.692 billion bu., trade expected 2.786
PRX Grain Market Overview
 PRX The ProExporter Network Grain, Oilseed & Biofuel Fundamentals Updated 4/1/18 PRX Grain Market Overview US Major Grains Crop Years 217/18 & 218/19 with USDA Apr 1, 218 WASDE PRX_Overview, SDU, Apr-1-18
Grain Market Outlook for
 Grain Market Outlook for 2017-2018 KSU Ag Econ 520 Fall 2017 Manhattan, Kansas DANIEL O BRIEN EXTENSION AGRICULTURAL ECONOMIST Topics to be discussed.. 1) Grain Market Analysis & Outlook Corn & Grain Sorghum
USDA WASDE Report. Friday April 9 th 2010 World AG Supply & Demand Estimates. Office Friday April 09, 2010
 Friday April 9 th 2010 World AG Supply & Demand Estimates The trade was expecting the new carry out to incorporate additional stocks resulting from the March 31 grain stocks report which was not reflected
2016 Risk and Profit Conference General Session Speakers. GENERAL SESSION IV Grain Market Situation and Outlook
 2016 Risk and Profit Conference General Session Speakers GENERAL SESSION IV Grain Market Situation and Outlook Dan O Brien, Kansas State University Daniel O Brien was raised on a grain and livestock farm
Wednesday July 11, 2012 World Ag Supply & Demand Report
 World Ag Supply & Demand Report U.S. 2011/12 Old Crop Corn is neutral Global Old Crop Corn is neutral USDA estimates the 2011/12 U.S. corn carryout at 903 million bushels, up from 851 million bushels from
USDA Agricultural Outlook
 USDA Agricultural Outlook December 216 World Agricultural Outlook Board Office of the Chief Economist U.S. Department of Agriculture Washington, D.C. The Office of the Chief Economist is Non Political
2018 Corn & Soybean Market Outlook & Strategies Home, Kansas
 2018 Corn & Soybean Market Outlook & Strategies Home, Kansas DANIEL O BRIEN EXTENSION AGRICULTURAL ECONOMIST Topics to be discussed.. 1) Grain Market Analysis & Outlook for 2018 Corn & Grain Sorghum Soybeans
Projected U.S. Corn Exports, Acreage and Production Under E-10, E-12 and E-15 Ethanol Policies
 Projected U.S. Corn Exports, Acreage and Production Under E-10, E-12 and E-15 Ethanol Policies Daniel O Brien, Extension Agricultural Economist, K-State Research and Extension July 19, 2010 This article
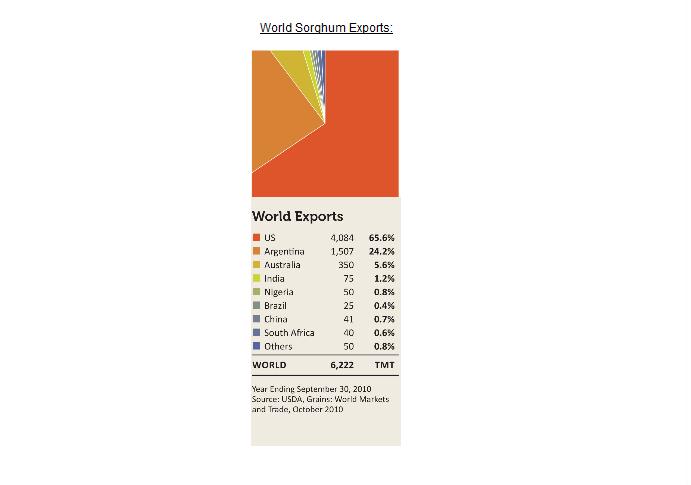
World Sorghum Grain Producers
 World Sorghum Grain Producers Million Metric Tons 18 16 14 12 12 10 8 6 7 7 6 6 4 4 4 3 2 2 2 2 0 14 MY 2014/15 MY 2015/16 MY 2016/17 Grain Sorghum Exporters Million Metric Tons 10 9 8 7 6 5 4 3 2 1 0
Understanding the 2011 Planting Outlook, Ethanol, and Food Pricing. March 31, 2011
 Understanding the 2011 Planting Outlook, Ethanol, and Food Pricing March 31, 2011 Planted acres by crop USDA Prospective Plantings report based on farmer surveys conducted during first two weeks of March
Analysis of the October 2010 USDA Crop Production & WASDE Reports
 Analysis of the October 2010 USDA Crop Production & WASDE Reports Daniel O Brien Extension Agricultural Economist, K State Research and Extension October 11, 2010 Summary of October 8 th 2010 Crop Production
Soybean Supply and Demand Forecast
 Soybean Supply and Demand Forecast U.S. soybean planted acreage is expected to increase 5.7 million acres over the forecast period. U.S. soybean yields are expected to increase 2.2 bushels per acre or
The Scoop on U.S. Wheat
 The Scoop on U.S. Wheat 2017 Spring Technical Conference And IAOM Joint District Meeting Justin Gilpin Kansas WhEAT Commission Manhattan, KS jgilpin@kswheat.com Overview A quick look at current milling
Corn & Soybeans. Corn (source WASDE) Soybean (source WASDE)
 Soybean (source WASDE)") Corn & Soybeans Corn (source WASDE) Estimate for the 2016-17 Season Global and US outlook Soybean (source WASDE) Estimate for the 2016-17 Season Global and US outlook Corn and Soybeans prices (Source CME)
Corn & Soybeans Corn (source WASDE) Estimate for the 2016-17 Season Global and US outlook Soybean (source WASDE) Estimate for the 2016-17 Season Global and US outlook Corn and Soybeans prices (Source CME)
KSU Agriculture Today Radio Notes
 KSU Agriculture Today Radio Notes Daniel O Brien, Extension Agricultural Economist, Kansas State University For Radio Program to be aired 10:00-10:15 a.m., Friday, September 8, 2017 I. Grain Futures Closes,
Commodity Outlook: September 2017 West Central Illinois: July 2017
 Commodity Outlook: September 2017 West Central Illinois: July 2017 William George Senior Agriculture Economist U.S. Department of Agriculture Foreign Agriculture Service Office of Global Analysis Commodity
March 2018 USDA SUPPLY/DEMAND ESTIMATES. Overview
 March 2018 USDA SUPPLY/DEMAND ESTIMATES Overview Corn: This month s 2017/18 U.S. corn outlook is for larger exports and increased corn used to produce ethanol. Corn used to produce ethanol was raised 50
Friday Aug 10, 2012 World Ag Supply & Demand Report
 Friday Aug 10, 2012 World Ag Supply & Demand Report U.S. 2011/12 Old Crop Corn is Supportive Global Old Crop Corn is Slightly Bearish USDA estimates the 2011/12 U.S. corn carryout at 1,021 million bushels,
Corn & Soybeans. Corn (source WASDE) Soybean (source WASDE)
 Soybean (source WASDE)") Corn & Soybeans Corn (source WASDE) Estimate for the 2015-16 Season Global and US outlook Soybean (source WASDE) Estimate for the 2015-16 Season Global and US outlook Global ending stocks Corn and Soybeans
Corn & Soybeans Corn (source WASDE) Estimate for the 2015-16 Season Global and US outlook Soybean (source WASDE) Estimate for the 2015-16 Season Global and US outlook Global ending stocks Corn and Soybeans
U.S. Agriculture: Commodity Situation and Outlook
 U.S. Agriculture: Commodity Situation and Outlook H. Scott Stiles Instructor - Economics University of Arkansas Division of Agriculture Farm Policy Education 2013 U.S. Crop Outlook Overview: Preliminary
Agricultural Markets Situation & Outlook
 Agricultural Markets Situation & Outlook VP s Outlook & Policy 3 December 2012 Matthew C. Roberts Roberts.628@osu.edu The Big Questions Progress of winter crops: SA soybean & corn NA winter wheat US export
A Letter from NCGA. In 2015, America s corn farmers showed exactly how amazing. the world of maize can be. Their ability to consistently
 Metric Version A Letter from NCGA In 201, America s corn farmers showed exactly how amazing the world of maize can be. Their ability to consistently deliver an abundant, sustainable crop offers an incredible
Australian Grain Industry Conference August 2017
 Australian Grain Industry Conference 2017 2 August 2017 WORLD WHEAT 2017/18 Themes Quality Issues The Great Pasta Drought of 2017 Why Are Cash Prices NOT Lower? Russian Export Capacity Issues US Needed
Crop Market Outlook: Where do we go from here?
 2012-13 Crop Market Outlook: Where do we go from here? Frayne Olson, PhD Crop Economist/Marketing Specialist NDSU Extension Service ND Agricultural Experiment Station Dept. of Agribusiness & Applied Economics
Corn & Soybeans. Corn (source WASDE) Soybeans (source WASDE)
 Soybeans (source WASDE)") Corn & Soybeans Corn (source WASDE) Estimate for the 2014-15 Season Global and US outlook Production, utilization and stocks Soybeans (source WASDE) Estimate for the 2014-15 Season Global and US outlook
Corn & Soybeans Corn (source WASDE) Estimate for the 2014-15 Season Global and US outlook Production, utilization and stocks Soybeans (source WASDE) Estimate for the 2014-15 Season Global and US outlook
Developing a Marketing Plan
 Developing a Marketing Plan Frayne Olson, PhD Crop Economist/Marketing Specialist frayne.olson@ndsu.edu 701-231-7377 NDSU Extension Service ND Agricultural Experiment Station Dept. of Agribusiness & Applied
2019 Corn & Soybean Market Outlook
 2019 Corn & Soybean Market Outlook Lunch & Learn Meeting, Tonganoxie, Kansas February 20, 2019 DANIEL O BRIEN EXTENSION AGRICULTURAL ECONOMIST 2019 Corn & Soybean Market Drivers 1) U.S. Economy Strong
World Corn Market Supply Demand Trends
 World Corn Market Supply Demand Trends Daniel O Brien Extension Agricultural Economist K State Research and Extension May 27, 21 The world corn market has many participants, but a small number of larger
2017 Crop Market Outlook
 2017 Crop Market Outlook Presented at the Row Crop Short Course Jackson County Agriculture Conference Center March 2, 2017 Adam N. Rabinowitz, PhD Assistant Professor and Extension Specialist Agricultural
2012 Farm Outlook. Highlights
 2012 Farm Outlook Office of the Chief Economist USDA Highlights A promising spring planting was followed by historic drought. Record high commodity prices followed. Farm incomes are expected to be near
2019 Grain Market Outlook
 2019 Grain Market Outlook Ness City, Kansas January 7, 2019 DANIEL O BRIEN EXTENSION AGRICULTURAL ECONOMIST Topics to be discussed.. 1) Macroconomic forces at work in the U.S. & where they are taking U.S.
Brenda L. Boetel UW-River Falls Extension Commodity Marketing Specialist
 Brenda L. Boetel UW-River Falls Extension Commodity Marketing Specialist 2 Total Supply = 15472 5th highest corn acreage planted (1 st in 2012) 5th highest corn acreage harvested (1 st in 2012) 3 2012/2013
Market Outlook. David Reinbott.
 Market Outlook David Reinbott Agriculture Business Specialist P.O. Box 187 Benton, MO 63736 (573) 545-3516 http://extension.missouri.edu/scott/agriculture.aspx reinbottd@missouri.edu Trending Issues Pre-2007
Market Outlook. David Reinbott.
 Market Outlook David Reinbott Agriculture Business Specialist P.O. Box 187 Benton, MO 63736 (573) 545-3516 http://extension.missouri.edu/scott/agriculture.aspx reinbottd@missouri.edu Trending Issues Volatile
Biofuels: Costs and Potential for Mitigating Greenhouse Gases
 Biofuels: Costs and Potential for Mitigating Greenhouse Gases Madhu Khanna Department of Agricultural and Consumer Economics Energy Biosciences Institute University of Illinois, Urbana-Champaign GHG Emissions
ECONOMIC IMPACT. In 2015, the ethanol industry contributed nearly $44 billion to the nation s GDP and added nearly $24 billion to household income.
 ETHANOL FAST FACTS ECONOMIC IMPACT In 2015, the ethanol industry created and supported nearly 339,000 jobs. Moving to a widespread adoption of E15 would create an additional 136,000 jobs. The U.S. renewable
The 2012 drought: impacts on the FAPRI agricultural commodity outlook
 The 2012 drought: impacts on the FAPRI agricultural commodity outlook By William H. Meyers Howard Cowden Professor of Agricultural and Applied Economics FAPRI at MU UN DESA Expert Group Meeting on the
Hog:Corn Ratio What can we learn from the old school?
 October 16, 2006 Ames, Iowa Econ. Info. 1944 Hog:Corn Ratio What can we learn from the old school? Economists have studied the hog to corn ratio for over 100 years. This ratio is simply the live hog price
World Agricultural Supply and Demand Estimates United States Department of Agriculture
 ISSN1554-9089 Office of the Chief Economist World Agricultural Supply and Demand Estimates United States Department of Agriculture Agricultural Marketing Service Farm Service Agency Economic Research Service
The Food vs. Fuel Controversy
 The Food vs. Fuel Controversy Ian Sheldon Andersons Professor of International Trade Ohio State University Great Decisions Program, 2009 sheldon.1@osu.edu http://aede.osu.edu/programs/anderson/trade/ World
Market Outlook. David Reinbott.
 Market Outlook David Reinbott Agriculture Business Specialist P.O. Box 187 Benton, MO 63736 (573) 545-3516 http://extension.missouri.edu/scott/agriculture.aspx reinbottd@missouri.edu Trending Issues Pre-2007
Fundamental Analysis for Grain
 Fundamental Analysis for Grain By Dr. Robert Wisner University Professor Emeritus Iowa State University Texas A & M University Master Marketers Conference, Amarillo, Texas, January 13, 2010 The process
U.S. Ethanol Market & Policy Outlook Prepared for 2011 Crop Insurance Workshop Series (CO, NE, KS, OK) November 1 4, 2011
 November 1 4, 2011") U.S. Ethanol Market & Policy Outlook 2011 Crop Insurance Workshops Daniel O Brien, Ph.D. Extension Agricultural Economist Kansas State University Ethanol Policy & Markets A. U.S. Ethanol Policy B. U.S.
U.S. Ethanol Market & Policy Outlook 2011 Crop Insurance Workshops Daniel O Brien, Ph.D. Extension Agricultural Economist Kansas State University Ethanol Policy & Markets A. U.S. Ethanol Policy B. U.S.
Potential Forecasted Economic Impact of Commercializing Agrisure Duracade 5307 in U.S. Corn Prior to Chinese Import Approval
 Potential Forecasted Economic Impact of Commercializing Agrisure Duracade 5307 in U.S. Corn Prior to Chinese Import Approval Author: Max Fisher, Director of Economics and Government Relations National
What are Today s Grain Markets Telling Us About the Future? 9 September 2009
 What are Today s Grain Markets Telling Us About the Future? 9 September 2009 Matthew C. Roberts, Ph.D. Grain Markets Energy Petroleum Prices Grains: Global Supplies Corn/Beans/Wheat / Biofuels Policy HR2454/Waxman
Fall Crop Outlook Webinar
 Fall Crop Outlook Webinar Chris Hurt, Professor, Department of Agricultural Economics Michael Langemeier, Associate Director, Center for Commercial Agriculture James Mintert, Director, Center for Commercial
June 12, USDA June 2013 Wheat Production for 2013 in billions of bushels - released June 12, USDA June 2013 Estimate.
 June 12, 2013 WE WILL BE UPDATING AND ADDING MATERIAL THROUGHOUT THE DAY ON JUNE 12 TO THIS LETTER BEGINNING AT 11:00 AM CST. PLEASE CHECK BACK OFTEN FOR THE LATEST INFORMATION! This morning (Wednesday,
Production, supply and demand of
 Production, supply and demand of DDGS worldwide The DDGS PHENOMENON What is DDGS Where does it emanate from? The Industry of DDGS Species performance Production Supply Demand Industry acceptance Research/Availability/Pr
Feed Grains Outlook: Shifting Trade Patterns and Implications for the US Acreage Mix. May 23, 2018
 Feed Grains Outlook: Shifting Trade Patterns and Implications for the US Acreage Mix May 23, 2018 The Growth of Chinese Imports May Reshape World Trade in Corn Brazil s Safrinha Crop Could Play a Key Role
Grain Market Outlook for
 Grain Market Outlook for 2018-2019 2018 KSU Risk & Profit Conference Manhattan, Kansas DANIEL O BRIEN EXTENSION AGRICULTURAL ECONOMIST Topics to be discussed.. 1) U.S.-China Trade & Other Key Grain Market
February Crop Market Update Department of Economic Analysis
 Corn Price ($/bu) and Ethanol Price ($/gal) February 2011 - Crop Market Update Department of Economic Analysis In this edition: Energy Update: Matt Erickson, Economist Crop Update: Todd Davis, Senior Economist
Issues Affecting Exports of DDGS in
 Researching and promoting the value of distillers grains for the fuel and beverage alcohol industries since 1945 Issues Affecting Exports of DDGS in 2014-2015 Alvaro A. Cordero Manager of Global Trade
United States Department of Agriculture. Executive Summary 8:30 AM NOVEMBER 9, 2011
 United States Department of Agriculture National Agricultural Statistics Service NOVEMBER CROP PRODUCTION Executive Summary NOVEMBER 9, 2011 8:30 AM Contents Field Crops Small Grains Update Corn Sugarbeets
What are the risks? Crop Market Outlook
 What are the risks? 2012-13 Crop Market Outlook Frayne Olson, PhD Crop Economist/Marketing Specialist NDSU Extension Service ND Agricultural Experiment Station Dept. of Agribusiness & Applied Economics
Executive Summary: The Impact of Delays in Chinese Approvals of Biotech Crops. Prepared by:
 Executive Summary: The Impact of Delays in Chinese Approvals of Biotech Crops Prepared by: May 2018 I. EXECUTIVE SUMMARY A. Introduction In recent years, China has taken considerably longer to approve
Commodity Outlook 2019: Corn and Soybeans Struggle to Find Strength
 Commodity Outlook 2019: Corn and Soybeans Struggle to Find Strength Wayne County 2019 Agricultural Outlook Ben Brown January 30, 2019 2018: A Tale of Two Halves January-May $4.00 corn and $10.50 soybean
U.S. Wheat Crop and Market Update
 U.S. Wheat Crop and Market Update IAOM Central and Wheat State District Meeting Justin Gilpin KS Wheat Commission Manhattan, KS jgilpin@kswheat.com Overview US growing areas and trade flows US Wheat Crop
Groundwater and Agricultural Bioenergy
 Groundwater and Agricultural Bioenergy Feedstock Production Noel Gollehon Natural Resources Conservation Service, USDA 2011 Ground Water Protection Council Annual Forum Atlanta GA September 26, 2011 September
The Food vs. Fuel Controversy
 The Food vs. Fuel Controversy Ian Sheldon Andersons Professor of International Trade Ohio State University ITESM, Guadalajara, August 27, 2008 UASLP, San Luis Potosí, September 1, 2008 sheldon.1@osu.edu
The Role of Agricultural Technology in the Future of Midwest Farms: A Seed Sector View
 The Role of Agricultural Technology in the Future of Midwest Farms: A Seed Sector View Jerry Flint Vice President, Global Initiatives and Sustainability November 27, 218 Insert Agriculture Risk Classification
Summary of WASDE and Production USDA
 Summary of WASDE and Production USDA The following information are summary and extracts from the latest, AUG 2016, WASDE and World Agricultural Production reports provided by the United States Department
Water Implications of Biofuel Policy in the U.S.
 Water Implications of Biofuel Policy in the U.S. Jerry Schnoor Dept of Civil & Environmental Engineering Center Global & Regional Environ Research Institute of Medicine (IOM)Roundtable Biofuels and Health
December 12, USDA World Supply and Demand Estimates
 December 12, 2017 - USDA World Supply and Demand Estimates Corn Market Reaction: March 2018 corn futures closed down 1 ¼ cents at $3.47 ¾ with a trading range for the day of $3.47 ½ to $3.53. December
Measuring Supply-Use of Distillers Grains in the United States
 Measuring Supply-Use of Distillers Grains in the United States Daniel O Brien, Extension Agricultural Economist, K-State Research and Extension Robert Wisner, University Professor Emeritus, Iowa State
World grain & protein outlook for the current crop year and observations for 2015/16 Presented by: Emily French
 World grain & protein outlook for the current crop year and observations for 215/16 Presented by: Emily French Australian Grains Industry Conference Melbourne, Australia 27 July 215 Global daily grain
Wheat Market Outlook - Spring 2017
 Wheat Market Outlook - Spring 217 Industry Outlook Conference Denver, Colorado April 2, 217 DANIEL O BRIEN EXTENSION AGRICULTURAL ECONOMIST U.S. Dollar Index (Trade Weighted) 1973 early April 217 U.S.
IMPACTS OF ETHANOL CO-PRODUCTS ON 2011/12 CORN AND SOYBEAN SUPPLIES AND ACREAGE
 IMPACTS OF ETHANOL CO-PRODUCTS ON 2011/12 CORN AND SOYBEAN SUPPLIES AND ACREAGE December 2012 KEY POINTS While biofuel critics claim 40% of the corn supply is being used for ethanol production, the actual
AFPC. Analysis of the Effects of Short Corn Crop Scenarios on the Likelihood of Meeting the Renewable Fuel Standard RESEARCH
 & RESEARCH Analysis of the Effects of Short Corn Crop Scenarios on the Likelihood of Meeting the Renewable Fuel Standard Briefing Paper 08-2 June 2008 350 300 250 200 150 100 50 0 2008 2009 2010 2011 2012
June 12, USDA World Supply and Demand Estimates
 June 12, 2018 - USDA World Supply and Demand Estimates Corn Market Reaction: July 2018 corn futures closed up 10 ¼ cents at $3.77 ½ with a trading range for the day of $3.67 ¼ to $3.79 ½. December 2018
Global Agricultural Supply and Demand: Factors contributing to recent increases in food commodity prices
 Global Agricultural Supply and Demand: Factors contributing to recent increases in food commodity prices Ron Trostle Economic Research Service U.S. Department of Agriculture Agricultural Markets and Food
FACTORS CREATING RISK IN U.S. GRAIN MARKETS
 FACTORS CREATING RISK IN U.S. GRAIN MARKETS WAY TOO EARLY GRAIN MARKET OUTLOOK TO 2050 22 ND NATIONAL WORKSHOP FOR DAIRY ECONOMISTS & POLICY ANALYSTS APRIL 30, 2015 JOHN NEWTON UNIV. OF ILLINOIS JCNEWT@ILLINOIS.EDU
Hog and Pork Situation and Outlook
 Hog and Pork Situation and Outlook September 3, 2013 Washington, Iowa Lee Schulz Department of Economics Iowa State University lschulz@iastate.edu (515) 294-3356 Feed Supply U.S. Corn Supply and Use 2009/10
FAPRI Outlook: Prospects and Uncertainties for the Next Decade
 FAPRI Outlook: Prospects and Uncertainties for the Next Decade William H. Meyers Howard Cowden Professor of Agricultural and Applied Economics and Co-Director, FAPRI University of Missouri Project LINK
January 12, USDA World Supply and Demand Estimates
 January 12, 2018 - USDA World Supply and Demand Estimates Corn Market Reaction: March 2018 corn futures closed down 2 ½ cents at $3.46 ¼ with a trading range for the day of $3.45 ½ to $3.50. December 2018
Corn and Ethanol: Green, Getting Greener. Rick Tolman National Corn Growers Association
 Corn and Ethanol: Green, Getting Greener Rick Tolman National Corn Growers Association 2007 a Very Good Year Production reaches 13.1 billion bushels Largest crop in U.S. history Average yield hits 151.1
Market Fundamentals. August October 2017
 Market Fundamentals August October 2017 1 Safe Harbor Statement & Disclosures This presentation includes forward-looking comments subject to important risks and uncertainties. It may also contain financial
Impacts of Possible Chinese Protection of 25 Percent on US Soybeans and Other Agricultural Commodities
 Impacts of Possible Chinese Protection of 25 Percent on US Soybeans and Other Agricultural Commodities Farzad Taheripour Wallace Tyner Purdue University July 10, 2018 Study Objectives Our aim was to estimate
Food and Feed vs Fuel: Renewable Fuels Perspective
 1 Food and Feed vs Fuel: Renewable Fuels Perspective Texas Ag Forum Austin June 9, 2008 John M. Urbanchuk Director, LECG LLC 1255 Drummers Lane, Suite 320 Wayne, PA 19087 Tel: 215-254-4021 E-mail: jurbanchuk@lecg.com
Nathan Kauffman Economist Federal Reserve Bank of Kansas City Omaha Branch June 6, 2013
 Nathan Kauffman Economist June 6, 213 The views expressed are those of the author and do not necessarily reflect the opinions of the Federal Reserve Bank of Kansas City or the Federal Reserve System. 6
2018 Crop Outlook. Chris Hurt, Professor, Department of Agricultural Economics. Michael Langemeier, Assoc. Director, Center for Commercial Agriculture
 2018 Crop Outlook Chris Hurt, Professor, Department of Agricultural Economics Michael Langemeier, Assoc. Director, Center for Commercial Agriculture James Mintert, Director, Center for Commercial Agriculture
World Wheat Supply and Demand. Crop Quality Seminars 2013 Ian Flagg
 World Wheat Supply and Demand Crop Quality Seminars 2013 Ian Flagg Beginning Stocks 250 200 Exporter beginning stocks down 35% from 5-year average 199 199 174 150 125 100 83 122 50 0 27 14 14 32 48 38
May 12, Dear Subscriber: We will be adding material to this shell letter after todays reports are released at 11:00 a.m.
 May 12, 2015 Dear Subscriber: We will be adding material to this shell letter after todays reports are released at 11:00 a.m. Be sure to click back on the link often for the latest information. Whle today
December 2 nd in Lafayette Indiana and Monticello Illinois December 3 rd in Jacksonville, Illinois
 November 8, 2013 WE WILL BE UPDATING AND ADDING MATERIAL THROUGHOUT THE DAY ON NOVEMBER 8 TO THIS LETTER BEGINNING AT 11:00 AM CST. PLEASE CHECK BACK OFTEN FOR THE LATEST INFORMATION! This morning (Friday,
Wheat Market Outlook in Mid June 2016
 Wheat Market Outlook in Mid June 2016 Daniel O Brien Extension Agricultural Economist, K State Research and Extension June 22, 2016 Summary Since the USDA s June 10 th Crop Production and World Agricultural
Iowa Farm Outlook. December 15, 2004 Ames, Iowa Econ. Info. 1900
 Iowa Farm Outlook December 15, 24 Ames, Iowa Econ. Info. 19 Beef and Pork Price Relationships Historically, beef and pork prices have moved somewhat together. They are substitutes in the consumer s shopping
Nathan Kauffman Economist Federal Reserve Bank of Kansas City Omaha Branch August 21, 2013
 Nathan Kauffman Economist August 21, 213 The views expressed are those of the author and do not necessarily reflect the opinions of the Federal Reserve Bank of Kansas City or the Federal Reserve System.
January 12, USDA World Supply and Demand Estimates
 January 12, 2017 - USDA World Supply and Demand Estimates Corn This month s U.S. corn outlook is for lower production, reduced feed and residual use, increased corn used to produce ethanol, and smaller
Overview. 1. Background. 2. Biofuels in the United States and Canada. 3. Policy objectives. 4. Economic consequences. 5.
 K. K. Klein and Danny Le Roy University of Lethbridge Lethbridge Alberta Canada Lethbridge, Alberta, Canada Economics of Alternative Energy Sources and Globalization Orlando Florida Orlando, November 15-17,
September 12, USDA World Supply and Demand Estimates
 September 12, 2018 - USDA World Supply and Demand Estimates Corn Market Reaction: December 2018 corn futures closed down 14 ¼ cents at $3.52 ½ with a trading range for the day of $3.50 ¾ to $3.66 ¼. December
The Outlook for Grain Markets and Texas Agriculture in Emily Kerr and Michael Plante
 The Outlook for Grain Markets and Texas Agriculture in 2013 Emily Kerr and Michael Plante Share of world production, 2000-2010 average 45% U.S. dominates world production of corn, soy 40% 40% 38% 35% 30%