Farm Record Analysis. Closeout. Procedures
|
|
|
- Hilary Park
- 5 years ago
- Views:
Transcription
1 2017 Farm Record Analysis Closeout Procedures Dec. 14, 2017
2 ii
3 Introduction This manual was developed to assist in the standardization of data collection and entry for Farm Business Management Annual Analysis Reporting. Consistency in the data entry is the key to creating a useable set of benchmark for producers. Blue text indicates current year additions/revisions. Acknowledgements Farm Business Management Instructors at Northland Community and Technical College developed this manual during the Fall of Updated annually by the Center for Farm Financial Management, University of Minnesota in consultation with Minnesota Farm Business Management, Minnesota State Colleges and Universities. This manual is funded by a National Farm Business Management and Benchmarking Grant from the USDA National Institute of Food and Agriculture. Copyright 2017 Center for Farm Financial Management, University of Minnesota and Northland Community and Technical College, Thief River Falls, Minnesota iii
4 iv
5 TABLE OF CONTENTS Timelines... Page Overview... Page 5 Balance Sheet Input... Page 11 Input Instructions for FINAN... Page 31 Organic and Specialty Crop Farm Analysis...Page 59 Downloading FINPACK Setup Files... Page 63 Importing FINAN Data... Page 67 Allocation Factors... Page 71 Special Sorts... Page 77 v
6 vi
7 I. Timelines 1
8 2
9 Key Dates December 15, 2017 Webinar on New FINPACK Release, Database process, and Closeout Manual Updates January-Early March 2018 FINAN Completions February 28, 2018 Red River Valley Files need to be completed March 1, 2018 Red River Valley Database Review in Moorhead March 5, 2018 All other files due to be included in state database March 7, 2018 Regional Database review meeting, Mankato, Southern report group March 8, 2018 Regional Database review meetings, St. Cloud and Thief River Falls, Northern report groups March 13-14, 2018 State Database Review, St. Paul March 15-21, 2018 Annual Reports created March 23, 2018 PDF of reports made available to instructors March 30, 2018 Printed reports available for distribution 3
10 4
11 II Overview 5
12 6
13 What s New? Capital Purchases and Capital Sales of Machinery and Equipment; Titled Vehicles; Buildings and Improvements; and Land. Purchase Price, Year Sold, and Sale Price have been added to the detailed entry of capital assets on the Balance Sheet. Entering a Year Purchased or Year Sold and the Purchase Price or Sale Price for an asset on the Balance Sheet will allow a user to select the asset purchased or sold and its value within the detailed Capital Purchases and Sales entry of the FINAN. Entering a Year Sold automatically removes the asset from the cost and market value total in both entry and Balance Sheet output. A listing of sold assets can be included in Balance Sheet output by going to Preview Options and checking the box for Print Sold Items by Category. When checked, an Asset Sold table is shown at the end of the Balance Sheet. Year End advances of crops sold for the following year. Balance Sheet convert the dollars received to units of the crop based on the percentage of sale received. Reduce the inventory of the crop by the advanced quantity. Price used in the calculation for determining bushels should be the underlying contract price. FINAN funds received as an advance sale are treated as a crops sale in the year received. Sale amount is the dollars of advanced payment, quantity equals the reduced inventory amount on the balance sheet. Costs associated with manure application manure application costs should be split 50/50 between the livestock and cropping enterprises. The cropping expenses should be allocated as fertilizer expense and the livestock expense should be considered custom hire. Cover Crops Cover Crop expense has been added as a Direct Crop Expense. Expenses related to planting cover crops for soil nutrient enhancement should be accumulated on the balance sheet as prepaid expenses using the Cover crop expense expense category. These prepaid expenses will then be allocated to the following year s or years crop, at the farmer s discretion. Expenses related to planting cover crops that will be harvested for sale or feed should be enterprised like any other crop. Lime fertilizer expenses these expenses should be accumulated on the balance sheet as a prepaid expense. The expense should then be allocated to the respective field/crop for a subsequent number of crop years, per the farmer s discretion. If lime is spread in the spring, for the current crop, then a portion of the initial cost would be treated as a prepaid expense on the next Jan. 1 balance sheet. If lime is spread in the fall, the entire cost is treated as a prepaid expense and allocation begins the following crop year. CSP income and related expenses Income and expenses related to the CSP government program are allowed to be included in the enterprise analysis for crop acres and applicable livestock operations. 7
14 Income received should be included as Other Income in the Crop Enterprise Analysis. This income can then be allocated to the associated crop enterprises. Expenses related to the CSP program (typically soil testing, grid sampling, or cover crop related expenses) should be included as a fertilizer or cover crop expense. These costs should be allocated to the same associated enterprises. If CSP government program funds are received for practices related to pasture management of the specific livestock enterprises, the funds should be included as Government Payment income for the applicable livestock enterprise. Expenses related to the CSP program should be included as a Government program expense under Direct Livestock Expenses. These expenses will be allocated to the specific livestock enterprise. Seed cost of sweet corn and peas for canning crops, include the actual seed cost paid by the farmer. If there is no seed cost (as the seed is provided by the canning company), enter a zero seed cost. If the farmer had to pay for seed, include the expense paid. Side Dressed Fertilizer will be added as a Special Crop Sort. Dairy Beef Enterprise definitions Feeders = animals sold or to be sold at less than 500 lbs. Backgrounding = animals sold or to be sold between 500 and 1000 lbs. Finishing = animals sold or to be sold at greater than 1000 lbs. Hired Labor Hired labor expense for non-salaried employees who do not participate in management should be allocated as a direct expense between the applicable livestock enterprises. Dairy Genomics expenses associated with dairy genomics should be accumulated under veterinary expense. The exception is embryo transfer related expenses, these are breeding expenses. Standardizing entries for Contract Growers enter the income from contract grower contracts (and number of head and weight if known) in Livestock Transferred Out. Allocating Co-op Patronage to the enterprise analysis cash patronage dividends received in a year should be allocated to the appropriate enterprise(s). Any equity redemption received in a year is a capital sale and would not be treated as income in the whole farm or to any applicable enterprise. Breeding expenses to the dairy replacement enterprise allocate the specific dollar amount of breeding expenses associated with replacements if known. Otherwise, use a split of 2/3 of breeding expense to dairy (or main livestock enterprise) and 1/3 of the breeding expense to replacements. If two 2017 FINAN s exist in the same file, make sure that the FINAN to be added to the database is previewed or printed last. 8
15 Points of Emphasis for 2017 Include the Year Born and Year Started Farming for all operators of the farming operation. If major unpaid resources are provided to the operation by a family member, it is recommended that a charge be included for the estimated value of those resources (hired labor, custom hire, or machine lease for example) with an offsetting personal income entry to balance cash. Review and correct all Net Worth Discrepancies. Farms with Net Worth Discrepancies greater than 1% of gross revenue will be deleted from the database. Include both quantity and value for all Feed Fed. Review livestock enterprise reports and correct obvious errors in feed efficiencies and other efficiency factors. Continue to tag Organic, Organic Transition, Specialty Crop, MDA Beginning Farmer Scholarships, and Veterans in whole farm special sorts. Combine Dairy and Dairy Replacements where appropriate. Review special sorts and crop production practices and make changes where appropriate. 9
16 State Database Thresholds Whole Farm Analysis Cash check discrepancy should be < 1% of gross income and < $5,000. Liabilities check discrepancy should be < $300. Net worth discrepancies should be <1% of gross income and <$5,000. All farms, except pass-through entities, must include deferred liabilities. If a farm has negative deferred liabilities, enter zero and include a Unique Situation report to your database reviewer. All farms must include both cost and market balance sheets. Total machinery and building depreciation should be <= 0. See Capital Sales and Purchases for handling gain on the sale of capital assets. All farms must include estimated labor hours. Even though FINPACK says this is optional, it is not optional for us. Personal property taxes should not be entered for Minnesota farms. Average Hired Labor Rate per Hour should be between $5 and $75. Crop Enterprises Cover crops for hay establishment (oats) should not be coded with a Double Crop type. Irrigation expense should not be allocated to non-irrigated crops. For hay crops, seed expense should only be entered on hay establishment enterprises and not on normal production enterprises unless there were re-establishment costs. See Crop Type on page 40. Rent expense should be > 0 on cash rented crops. If legitimate, enter as share rental with 100% share or delete the enterprise from the database. Real estate taxes should be > 0 on owned land. Seed expense should be > 0 on corn, soybeans and other common commodity crops. Seed expense should = 0 for canning crops such as peas and sweet corn. Drying should = 0 on forage crops. Enter preservatives as Misc. Crop Expense. Expenses should be >= 0. Negative overhead expenses are caused by over-allocating direct expenses for labor, leases, utilities and custom hire. ARC and PLC payments must be allocated to the cropping enterprises. For producers who did not participate, include a Unique Situation report for your analysis coordinator. ARC and PLC payments must not be allocated to ineligible vegetables or edible beans. Livestock Enterprises Beef calves from a cow-calf enterprise should be sold at normal calf selling weight or transferred to a grow/finish enterprise. Enterprises with an average sales weight greater than 800 pounds will be deleted unless the Cow-calf with backgrounding special sort is selected. Carefully review all items in the Other Information results, such as Calving Percentage, Feed Conversion, etc. Enter feed quantities in the proper unit, e.g., do not enter Protein in pounds. 10
17 III. Balance Sheet 11
18 12
, money market accounts, etc.")
19 Entering Data on the FINPACK Balance Sheet Valuation Method: Select Both during entry; you can still choose to print only the Market Value or Cost Value by selecting these later when you print. ASSETS: Current Farm Assets: Cash and Checking Balance: Includes all farm accounts, savings and checking, CD s (Certificates of Deposit), money market accounts, etc. Use Detail to make a detailed list. Prepaid Expense and Supplies: Include paid fuel, fertilizer and chemical in tanks, fall applied fertilizer and/or chemicals, prepaid accounts at elevators, co-ops, companies, etc. Accumulate expenses related to planting cover crops for soil nutrient enhancement using the Cover Crop Expense category. Lime fertilizer expenses should be a prepaid expense. The expense should then be allocated to the respective field/crop for a subsequent number of crop years, per the operator s discretion. Use Detail to select the expense category to help identify the total expense incurred in the FINAN enterprise analysis. 13
20 Growing Crops: Accounts Receivable: Example: Winter Wheat (cost of inputs). Expenses related to planting cover crops for sale or feed use should be considered a growing crop. Use Detail to select the expense category. Examples: Insurance payments, money owed from others, etc; estimated Disaster payments to be received next year, LDP S where paperwork is done but the check is not received (corn silage). The beginning balance sheet should include the gross value of the previous December milk which was received in January. The ending balance sheet should include the December check which will be received in the following the January. Deferred crop sales may be included in Accounts Receivable or as crop inventory. Use Detail in the entry box to enter a detailed list. Loan repayment rate locks: If the producer has a marketing loan repayment rate lock in place as of January 1 and the market price is higher than the repayment rate, show the equity gain as an account receivable. Projected ARC or PLC payments should not be included until the Marketing Year Price has been established. Hedging Accounts: Other Current Assets: Crops: Enter the amount of equity that could be withdrawn if the position were settled on the statement date. Some brokerage statements list this as Net Liquidity. Enter any item not fitting the categories listed in the Current Assets section of the Balance Sheet. Always enter the Quantity, Value/Unit and Value. Enter crops under CCC loan as normal crop inventory, valued at market value or loan rate, whichever is higher. If the market price is below the loan rate and an LDP has not been claimed, value the crop at local loan rate. If the inventory is priced or under contract, use the contract price less estimated expenses for storage and delivery. For year-end advances on crops sold for the following year, convert the dollars received on the advance to units of crop based on the percentage of the sale received. Reduce the grain inventory by this number of units. Price used in the 14
21 calculation for determining bushels should be the underlying contract price. Market Livestock: Include feeder animals intended for eventual sale. Youngstock intended to eventually enter the breeding herd should be included in Breeding Livestock. 15
22 Intermediate Farm Assets: Breeding Livestock: Farm Machinery and Equipment: Include all breeding females and males including youngstock and replacements. To-be-culled breeding animals remain as intermediate livestock until sold. Cost value for raised livestock should be set initially as the estimated cost of production (base value) and should remain the same throughout the life of the animal. Purchased animals should be separated from raised if they represent over 10% of the herd with cost value of the purchase cost less depreciation down to the base value. Enter both the Market Value and the Cost Value. For cost valuation, use an economic depreciation method that reflects the estimated actual useful life of the asset or group of assets. An easy calculation is to subtract 10 to 15% of the remaining cost value each year. Start new machinery at full purchase cost for both cost and market value and depreciate depending on use during the year. For new students, establish the cost value by creating a detailed list and estimating the purchase cost less economic depreciation on each item. If this is unworkable, begin at market and apply economic depreciation in future years. See Entering Capital Leases on the Balance Sheet for leased assets. Use the Detail to enter a detailed list. Use the Adjust Values (%) feature to do percentage depreciation on the detail list (see below). 16

23 Suggested Depreciation Rates Livestock equipment % Crop machinery 7-15 % Buildings and bins 5 % Augers and movable equipment 10 % Vehicles % Office Equipment 30 % Suggested Depreciation Percentages Based on Asset Useful Life Years Depreciation % Years Depreciation %
24 Titled Vehicles: Other Intermediate Assets: If desired, separate titled vehicles from farm machinery. Example: Cooperative Stock, (this is not to be confused with co-op patronage equities which are long term assets), Beet Stock, Farm Credit Services Stock, Wheat Growers Stock. Enter the retained value for each cooperative separately. For the market column, value stock at market value with recognition of changes if significant changes in valuation have occurred since the beginning of the year. Also include the remaining value yet to be expensed on investments in perennial crops. Use Detail to enter a detailed list. Long Term Farm Assets: Farm Land: Farm Buildings: Use Detail to enter the Acres, Value/Acre, Cost Value and Market Value. Do not change the Market Value unless a significant change occurs. Enter both Cost Value and Market Value. Use a Management Depreciation Method which depreciates the original cost over the life of the asset for the cost value. An easy calculation is to subtract 5 to 7% of the remaining cost value each year. Enter new buildings at original purchase cost for both cost and market value and depreciate based on use during the year. See Entering Capital Leases on the Balance Sheet for leased assets. Use the Detail to enter a detailed list. Note: For the same farm, you can separate land and buildings on the Cost Balance Sheet, yet lump them together on the Market Balance Sheet. Other Long Term Farm Assets: Capital Purchases & Capital Sales Enter any long term asset not already categorized above, both Cost and Market Value. Example: Co-op equities. Details regarding the purchase and sales of Machinery and Equipment; Titled Vehicles; Land; and Buildings and Improvements can be recorded on the Balance Sheet. Use Detail to enter this information. Then, the details of these transactions for the year can be selected within Capital Purchase and Sales entry in the FINAN. 18

25 The correct entry of traded assets can be found on page 38 of this manual. Personal Assets: These should be detailed as well. Enter the house in this category. The loan should follow the purpose of the loan not necessarily the collateral. A home improvement would be a personal loan. A loan for farming with the house as collateral would be a farm loan. LIABILITIES: Accounts Payable and Other Accrued Expense: Usually includes accounts payable, charge account, such as feed, fertilizer owed to local businesses, real estate taxes owed but not paid. Include any government payments received before the beginning balance sheet date but belonging to next year s crop. Do not include credit card or FarmPlan balances if expenses are included in outflows include in current notes instead. Use detail to list each account and the Expense Category. 19

26 Current Loans: Intermediate: Capital Leases List loans due in less than 1 year. If expenses financed by credit cards or FarmPlan are included as cash outflows in FINAN, list the balance as a Current Loan here. If not, include them in Accounts Payable. List loans owed on equipment and livestock; usually ten years or less. P&I payment is required for calculation of Term Debt Coverage. Principal due is amount due in the next 12-month period. (FSA setaside payments should be listed as separate loans without accrued interest or payments, 0% interest.) If this is an operating lease (the operator s intent is not to eventually own the asset), do not enter the asset or liability on the Balance Sheet. If this is a capital lease, which includes a buy-out provision: 1) Report the asset value in the appropriate asset category and depreciate on the cost balance sheet as discussed at the end of this section. 2) Report the lease as a liability with interest and a payment separated by principal and interest. 3) Use the example at the end of this section to help in the calculation of principal and interest. Long-Term Liabilities: Personal Liabilities: List loan with an original term of longer than ten years ~ usually real estate (land or buildings). P&I payment is required for calculation of Term Debt Coverage. (FSA setaside payments should be listed as separate loans without accrued interest, or payments, 0% interest.) Income and self-employment taxes payable should be estimated and included as personal income taxes payable. Be sure to enter on both the beginning and 20

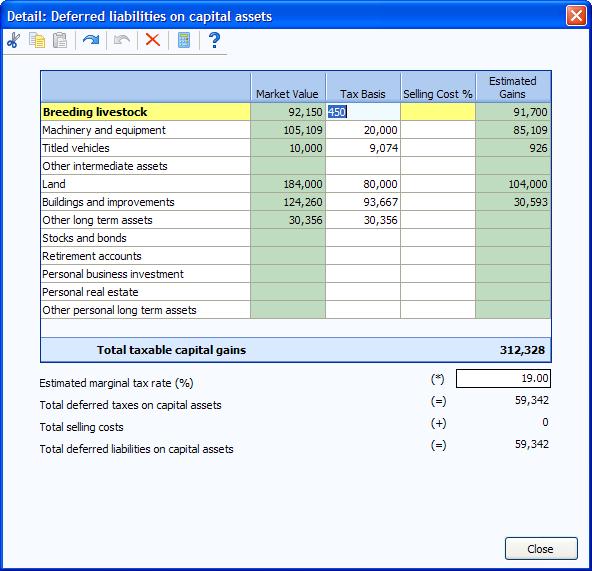
27 ending Balance Sheets. List credit cards as accounts payable if they are not included as cash outflows in FINAN. Current Personal Loans: Intermediate Personal Loans: Long Term Personal Loans: Short term loans due 12 months or less. Include credit card balances if included in cash outflows in FINAN. Car loans, boats, furniture and other personal items. Real estate, house, cabin, trailer house. Deferred Liabilities: Deferred liabilities must be included for all farms except pass-through entities, LLCs and S Corporations for which income is passed through to the owner for tax purposes. Use the detail feature to calculate deferred liabilities on the Market Balance Sheet. Deferred Liabilities include: 1) Taxes due on current inventories (grain, market livestock, etc.) include both income and self employment taxes. Enter the cost basis of purchased feeder as well as the amount of CCC loans treated as income and already taxed. 21

28 2) Taxes due on the gain from capital assets (land, stock, machinery, etc.) typically includes capital gains tax calculated on the difference between market value and the tax basis value. In accordance with the Farm Financial Standards, selling costs should have already been subtracted from the market value of assets and therefore should not be included here. 3) FINPACK defaults the cost values from the balance sheet into the tax basis column. To be accurate, you should enter the actual tax basis for each asset category. FINPACK will automatically update the tax basis using the cost values until you change them so they do not match. After you change the tax basis, you must continue to update it from year to year. 4) The chart on the following pages should be used in determining the appropriate tax rate to apply to the assets. 22
29 23
30 Approximate Average Deferred Tax Rates MINNESOTA Average Deferred Tax Rate on Current Deferred Taxable Income Non-Current Deferred Taxable Income Total Deferred Taxable Income Federal a and State Federal b and State 15,000 15% 0% 20,000 18% 0% 30,000 22% 0% 40,000 25% 3% 50,000 26% 4% 60,000 28% 6% 70,000 29% 7% 80,000 29% 9% 90,000 29% 10% 100,000 30% 11% 110,000 30% 12% 120,000 31% 14% 140,000 31% 16% 160,000 32% 17% 180,000 32% 18% 200,000 33% 19% 250,000 33% 19% 300,000 33% 20% 350,000 33% 20% 400,000 33% 20% 450,000 34% 21% 500,000 34% 21% 1,000,000 34% 21% 2,000,000 and over 34% 22% a. Includes Federal Income Tax, Social Security Tax and State Income Tax. b. Excludes Social Security Tax. 24
31 Approximate Average Deferred Tax Rates NORTH DAKOTA Average Deferred Tax Rate on Current Deferred Taxable Income Non-Current Deferred Taxable Income Total Deferred Taxable Income Federal a Only Federal b Only 15,000 15% 0% 20,000 17% 0% 30,000 18% 0% 40,000 21% 2% 50,000 22% 3% 60,000 23% 5% 70,000 24% 6% 80,000 24% 7% 90,000 24% 8% 100,000 25% 9% 110,000 25% 10% 120,000 25% 11% 140,000 26% 12% 160,000 26% 13% 180,000 28% 14% 200,000 28% 17% 250,000 28% 17% 300,000 28% 17% 350,000 28% 17% 400,000 28% 17% 450,000 29% 17% 500,000 29% 17% 1,000,000 29% 17% 2,000,000 and over 29% 17% a. Includes Federal Income Tax and Social Security Tax b. Excludes Social Security Tax. 25
32 Entering Capital Leases on the Balance Sheet The first step is to determine if the lease is a capital lease, or simply a rental arrangement. The Farm Financial Standards Council (FFSC) Guidelines, Appendix G, states, According to GAAP, a lessee should show the lease as a capital lease if the lease is noncancelable and meets any one of the following four interest tests: 1. The terms of the lease transfer ownership of the property to the lessee at the end of the lease term. 2. The lease contains a bargain purchase option. 3. The term of the lease is at least 75% of the estimated economic life of the leased property. 4. The present value of the minimum lease payments equals or exceeds 90% of the fair market value of the leased property. If the lease is determined to be a capital lease, then, for financial statement purposes, the lease payments must be capitalized and amortized over the term of the lease. It must be remembered that it is the lease investment, which is being put on the balance sheet, not the asset being leased. Treatment of capital leases is a complicated subject that is often treated incorrectly. Most farmers leasing capital assets under a capital lease probably treat a capital lease like a regular lease by deducting the entire payment as a business expense. Although simple, this is incorrect according to both GAAP and the IRS. Since our purpose is a management application, we will follow the GAAP (and FFSC) format and leave the tax implications to the tax practitioners. Since a capital lease is actually a type of purchase agreement, many lenders prefer to see the asset, and the accompanying liability, on the balance sheet. This requires the use of a present value chart (or a business calculator) to separate the payments into an interest portion and a principal amount, and an amortization calculation to further separate the principal portion into current and term debt. This is what both GAAP and FFSC recommend. The asset value (the value of the lease entered on the balance sheet) consists of the current year payment made in advance plus the capitalized value of the outstanding principal portion of future payments based upon the effective interest rate as determined through the use of a present value table or business calculator. This value may be amortized over the estimated life of the asset being leased, or may be amortized over the life of the lease. The liability entered on the balance sheet is the capitalized value of the principal portion of future payments based upon the effective interest rate, as determined using a present value table or a business calculator. This liability is further divided into current and non-current portions. Accrued interest is also entered as a current liability. 26
33 Example: An asset costing $50,000 is purchased utilizing a five-year capital lease, based on an interest rate of 10%. Option #1: There are five equal installments (lease payments) of $11, each. The first payment is due upon delivery and is entirely principal. The remaining four payments consist of both principal and interest. Using a present value table, we find that the factor for the four future payments at 10% interest is (see Present Value Table, page 25). So, the calculation of the value of the asset the first year (prior to amortization/depreciation) is: Initial payment + capitalized value of future payments, or $11, (11, X [n=4]) = 11, , = 50, Other than proving the process, this calculation would not be necessary if you know the actual value being leased. However, the value being leased may differ from the asset cost if there is a buy-out or asset value remaining at the end of the lease term. It is essential that the balance sheet reflect only the value being leased (which is not necessarily full the value of the item being leased) and the liability against that value. This asset value would be amortized (depreciated) over the estimated life of the asset, or over the term of the lease. Using a five-year term, the balance sheet value each year would be: Year Amortization Value 19x0 0 50,000 19x1 10,000 40,000 19x2 10,000 30,000 19x3 10,000 20,000 19x4 10,000 10,000 19x5 10,000 0 If, as is likely, the lease was initiated during the year (rather than on January 1), a monthly convention would be used in calculating the amortization (depreciation) schedule. For example, if the lease was initiated on April 1, the first year amortization would be $7,500 and the sixth year would be the remaining $2,500. On the liability side, the capitalized value of the lease liability is amortized over the remaining life of the lease. The capitalized value of the future payments, utilizing a present value table or business calculator would be: $11, X [n=4] = $38, This amount will be amortized over the remaining four annual payments using a standard interest-principal calculation. 27
34 Year Bgn Balance Payment Interest Principal End Balance 19x1 38,010 11,991 3,801 8,190 29,820 19x2 29,820 11, ,009 20,811 19x3 20,811 11, ,910 10,901 19x4 10,901 11, ,901 0 The 19x1 balance sheet would show the total principal liability ($38,010) divided between a current liability of $8,190 and a non-current liability of $29,820. The same procedure would be followed in subsequent years. Accrued interest on the lease is also listed as a current liability. The accrued interest is calculated on the entire principal liability adjusted to reflect the months between the lease payment date and the end of the period represented by the balance sheet. Since the asset value of the lease is actually the value of the lease, and not the value of the leased asset, any remaining end-of-lease buyout value is not reported as an asset on the balance sheet. Similarly, the buy-out price is not reported as a liability. These values, if the buy out is performed, will be entered at the time of that purchase, when the lease is finished. Other Lease Options (using the same $50,000 asset and 10% interest rate): Option #2. There is no initial payment upon delivery. The first payment is not due until the end of the first year, and there are a total of five annual payments of $13, each. AN@ on the present value chart, the number of outstanding payments, would be A5@. The interest rate is 10%. Compared to option #1, the higher annual payment of $13, reflects inclusion of the first year=s interest to the lease. The proof: $13, X [n=5] = $50, Option #3. If an asset is leased/purchased with the purchaser unaware of the purchase price and/or the interest rate; use the annual payment, the number of payments, and an imputed interest rate to determine the capitalized value of the lease and the outstanding liability. Option #4. Suppose there are unequal lease payments. The lessee makes an initial (on-delivery) payment of $6,000, a low $7,500 payment at the end of the first year, and three more annual payments of $16, a. Add the 4 remaining payments: 7, , , , = 55, b. 55, divided by 4 = 13, (average payment) c. 13, multiplied by [n=4] = 44,000 (outstanding principal) d. 44, ,000 = 50,000 (total asset cost) Option #5. An asset is leased with an initial payment (upon delivery) of $11, and four more annual payments of 11, At the end of the fifth year the asset can be purchased for a buy-out price of $2,750 a. First calculate the remaining value of the asset. It is actually $2,500 (2, interest = 2,500 remaining principal) b. 11, (annual payment) X [n=4] = 36, (remaining liability) 28
35 c. 36, , (initial principal payment) = 47,500 d. 47,500 (lease value) + 2,500 (remaining asset value = 50,000 (total asset value) e. In this case, only the 47,500 (lease value) would be amortized/depreciated as an asset value and only 36, would be amortized as a liability on the balance sheet. The buy-out value of the asset would not be shown until it was actually purchased. If you are setting up a new balance sheet during the term of an on-going capital lease, use the annual payment, the (actual or imputed) interest rate and the number of remaining payments to determine the capitalized asset and liability values remaining. In most cases, understanding the rationale is more difficult than actually performing the calculations. Importance of Procedure: The rationale behind standards, such as the FFSC ratios is the ability to compare an individual farm with a database. However, standardized calculations are worthless if the input data does not also conform to a standard reporting procedure. The decision to correctly include the capital lease value and liability on the balance sheet (rather than simply treating the lease payment as an annual operating expense) impacts thirteen of the sixteen FFSC ratios: Current Ratio, Working Capital, Debt to Asset Ratio, Equity to Asset Ratio, Debt to Equity Ratio, Return on Assets, Return on Equity, Term Debt Coverage Ratio, Asset Turnover Rate and all four Operational Ratios. Reporting capital lease payments correctly in their component parts of interest and principal, rather than as a single operating expense (lease payment) will impact the remaining three financial ratios; Operating Profit Margin, Net Farm Income, and Capital Replacement and Term Debt Repayment Margin. In management, being able to make consistent and accurate comparisons is important. Admittedly, one can compare with one=s own trends over the years using non-standard measures or non-standard data to calculate these measures. However, in these times of narrow margins it is increasingly important that producers be able to compare their performance not only with themselves, but with that of their competition as well. Following standardized procedures is the key to reliability, consistency and accuracy. Present Value Table: An abbreviated present value table for interest rates between 5% and 15% and lease terms between 2 years and 15 years is provided on the following page. More extensive tables can be found in accounting texts, or other sources. 29
36 Present Value Table N 5% 6% 7% 8% 9% 10% 11% 12% 13% 14% 15% N = number of annual payments 30
37 IV. Finan Instructions 31
38 32

39 CREATING A NEW FINAN INPUT INSTRUCTIONS FOR FINAN In all areas where you wish to detail, use the Details button or double click in the entry box to do so. Many times it is helpful. Black numbers indicate no detail, blue indicates detail. Data File Name: Use a unique file name. Remember, when a member of the database review team calls with a data problem you need to be able to identify the farm by this name. The analysis name must be entered on this screen. It can be changed on the File Navigator screen if need be later. Recommendation: 2xxx Analysis If possible, copy a previous year s analysis and check Clear out general data and prepare for another year. All data will be deleted except: General Information and Summary Information pages remain unchanged. The Balance Sheets from last year remain selected; you need to select the appropriate Balance Sheets for this year. All detail values are deleted but the descriptions remain. Value of Labor and Management remains (Other Information page). Labor hours remain. Related Operating Expense Allocations to Crops, Livestock, and Other Enterprises remain. Crop names, descriptions, and acres stay in the Crop Enterprise Analysis. The Default Allocations stay in the Allocated Crop Expenses. Changes for interest allocation for sugar beet stock also remain and need to be changed. Livestock names and descriptions remain. Individual feed items remain, but quantities and dollars are cleared. The Default Allocations stay in the Allocated Livestock Expenses. Other Livestock Information such as; average number of head, normal total gain per head, barn capacity, or number of litters remain. 33
 Enter analysis year.")
40 If Special Sorts (whole farm, crop, or livestock) were included, a dialog box will appear with the option to keep them or clear all special sorts. If special sorts are retained, be sure to review them as data is entered and make changes where appropriate. GENERAL INFORMATION 1) Enter analysis year. 2) Select Whole Farm with Enterprise Analysis 3) Check Show group summary information 4) When you have completed the analysis, check Analysis complete, include in RankEm. SUMMARY INFORMATION 1) Select proper type of business organization 2) Enter the producer s unique Farm ID. Once established, the ID for a specific farm should never be changed. When a son or daughter takes over an existing farm and the parents exit or mostly exit management of the farm, a new farm ID should be assigned. If you do not know the correct ID, contact your regional or Center administration. This is necessary to keep unique ID# s for the State Data Base. 3) State and County - Enter State and County name from pick lists 4) An operator is generally defined as one family that relies on the farm for family income and receives that income in the form of farm earnings (or owner wages in the case of a corporation). A husband and wife unit is generally considered one operator. Additional family members or partners are operators if they are not paid labor. It is possible to enter decimals for part-time operators but unless the producer spends less than 50 percent of his/her time on the farm, the farm should have at least one operator. 34
 Special Sorts: Identify organic farms, farms in organic transition, and specialty crop farms as well as farms that expanded or contracted during the year.")
41 5) All data is required by RankEm. Be sure to enter Acres Owned, Number of Operators to the tenth, Primary All Operators Year of Birth and Years Farming. 6) Special Sorts: Identify organic farms, farms in organic transition, and specialty crop farms as well as farms that expanded or contracted during the year. A general guideline for use of the expansion or contraction is when there has been a 25% change in physical units of production or investment. 7) Analyst Name: Enter your name as the FINPACK user who prepared this analysis. Analyst Name will be displayed in RankEm to identify the analyst if there are questions or outliers which need correction. Analyst name will be deleted before data is uploaded to FINBIN. 8) Summary Group: Select the regional report group for this farm, MN State College & University North, South, Red River Valley or Southwest Minnesota Farm Business Management Association. All others choose MN Other. 35


42 CAPITAL PURCHASES AND SALES: 1) Beginning Values and Ending Values are displayed from the Balance Sheets. Enter capital purchase and sales. 2) Enter Capital Purchases and Capital Sales. For capital sales, always use Detail to enter the Balance Sheet Value of the asset sold. With this, FINAN will calculate the gain or loss on the sale. Selecting the Select from Balance Sheet Items icon from the toolbar in Sales and Purchase detail will allow you to bring purchases and sales entered on the Balance Sheet into the FINAN. (This applies to Machinery and Equipment; Titled Vehicles; Land; and Buildings and Improvements.) To select items from the Balance Sheet to include in the FINAN, the user must be in the correct capital asset cell in the table to bring in purchases or sales of that asset type. By checking the Include box, the assets will automatically be brought into detailed entry. By checking Include and pressing the Close button, the assets will be brought into detailed entry. 3) Enter any assets repossessed under Capital Sales detail. 4) Breeding Livestock ~ Be careful that you do not double count capital sales. Enter sales here or in Cull Breeding under Other Income. Recommendation: Enter whole herd liquidations and major herd reductions here and enter normal cull sales under Other Income. 36
43 5) Other Intermediate Assets ~ Include sugar beet and corn processing stock purchases and sales. Be sure to include changes in PCA or FCS Stock as a purchase or sale as appropriate. Include sugarbeet unit retains (both sold and purchased). Enter any change in positive livestock ledger accounts from the beginning to the end of the year as a purchase or sale. Ledger purchases should also be added to livestock sales. Ledger sales should also be subtracted from livestock sales. 6) Other Long Term Assets ~ Be sure to include Patronage, stock redemption or retirement as a sale. 7) Personal Capital Purchases and Sales~ All purchases and sales of nonfarm capital assets should be listed in the proper category. Premiums on whole life insurance policies should be included in nonfarm capital purchases. 8) Recommended procedure for trade-ins a) The capital purchase will equal the cost value of the traded-in asset plus and to boot money for the newly acquired asset. b) The sale price entered on the Balance Sheet and in FINAN will equal the current cost value of the asset. c) Cost value of the new asset equals the to boot paid plus the remaining cost value of the trade-in asset. d) Market value of the new asset equals the estimated current market value. e) Leave the trade-in asset on the machinery list. This item will not be included in the printed machinery list. The value of the traded asset is not included in the total cost and market value of machinery. LIABILITIES: 1) Beginning and Ending Principal Balances are displayed from Balance sheets. 2) Enter Money Borrowed and Principal Paid for each loan. 3) Enter Principal Forgiven under Principal Paid Detail. 4) Enter Accounts Payable Forgiven under Accounts Payable Principal Paid Detail. This is the only entry allowed for Accounts Payable. 5) Ledger Contracts. Beginning and ending balances should be listed from the balance sheet if the balance is negative. Enter increases as money borrowed and decrease livestock income by the same amount. Enter decreases as principal paid and increase livestock income by the same amount. 37
44 6) New Loans. Enter loans taken this year as money borrowed. 7) Under each loan type or by individual loan, check liability balances as follows: Beginning Balance + Amount Borrowed - Principal Paid = Ending Balance FARM INCOME: Crop Sales ~ Enter per crop; gross quantity of crop sold and gross income received. Enter gross proceeds here and enter expenses deducted from the sale as farm expenses. Include gross sales of crops that were under CCC loan. Do not include money borrowed on CCC loans and treated as income for tax purposes. Include the funds received for yearend grain advances as a grain sale in the year received. Sale quantities equate to the number of units the balance sheet inventory was reduced by. All year-end grain advances should be treated as a crop sale and not as other income. Price used in the calculation for determining bushels should be the underlying contract price. Livestock Sales ~ Enter number sold, total live weight pounds sold, and gross income received of market livestock. Enter gross proceeds here and enter expenses deducted from the sale as farm expenses. Record Cull Livestock in Cull Livestock section, not here. (Weights should be entered on a live weight basis. If sold on carcass weight and the yield is unknown, convert live weight based on a 75% yield for pigs and 63% yield for cattle.) For livestock sold on ledger contracts, increase or decrease cash sales by the change in the ledger balance. Show offsetting capital purchases, capital sales, borrowings or principal paid to balance cash flow. Livestock Products ~ Enter gross quantity and gross income received. OTHER INCOME: Cull Breeding Stock ~ Enter income received from Cull Breeding Stock sales. Breeding stock sales should be entered as capital sales only when liquidating a herd or doing a major downsizing. Use Detail to allow Selecting the data into the Enterprise Analysis. Miscellaneous Livestock Income ~ Enter any miscellaneous livestock income. LDP Payments ~ Include all LDP Payments received during the Analysis Year. Crop government payments ~ ARC and PLC payments present a special problem because the amount of the payment is not known until the end of the marketing year. This uncertainty makes it difficult or sometimes impossible to accurately match income to the production year. Therefore, it is recommended that ARC/PLC payments be recognized as income in the year received rather than trying to estimate the amount that should accrue to each production year. CRP Payments ~ Enter all cash CRP Payments received in the analysis period. 38
45 Livestock Govt Payments ~ Include dairy MPP payments as well as any other livestock related payments. Other Government Payments ~ Enter any other government payments, such as disaster payments, EQIP Reimbursements, CSP payments, etc. Custom Work ~ Enter all cash farm related custom work income. Patronage Dividends ~ Enter all cash patronage dividends and cash unit retains received. Additional stock accumulation should be recorded on the Balance Sheet. Insurance Income ~ Enter the gross cash for all insurance income payments. Cash Withdrawn from Hedging Accounts ~ Enter all cash withdrawn from hedging accounts. See the special note on hedging transactions below. Other Farm Income ~ Enter all cash farm income not previously entered. Special Note for EQIP and Other Cost Share Payments: It is recommended that cost-share for feedlots and other large capital purchases be entered in the following manner to minimize distortion of net farm income and enterprise profitability. Enter the total cost as a capital purchase and the cost-share portion as a capital sale. On the ending balance sheet, the cost value of the asset should reflect the total purchase amount less the government costshare payment, less the appropriate amount of depreciation for the year. The market value should reflect the full asset value. This will balance the cash flow but will exclude the cost share payment from net farm income without distorting depreciation. Example: If the total cost of a feedlot is $100,000 and government cost-share is $48,000, then $100,000 should be entered as capital purchase (buildings and improvements) and $48,000 as capital sale. The ending cost value of the feedlot on the balance sheet is $49,400 ($100,000 minus $48,000= $52,000 *95% to depreciate over 20 years). The market value should be the estimated amount by which the addition of the feedlot increased the market value of the property on which it was built. 39
46 FARM EXPENSES: Crop Expenses/Livestock Expenses/Related Operating Expenses ~ Enter all actual cash farm expenses paid during the calendar year. If an expense item is negative due to refunds, etc., submit a Unique Situation report to your database review with justification. Farms with unexplained negative whole farm expenses will be deleted from the database. If major unpaid resources are provided to the operation by a family member, it is recommended that a charge be included for the estimated value of those resources (hired labor, custom hire or machine lease for example) with an offsetting personal income entry to balance cash. If expenses were deducted from sales of grain, livestock, or livestock products, include the gross sales as income and include all expenses for trucking, commission association dues, and marketing fees here. Specific expense categories: Seed treatments: include in Seed expense; Free seed, chemicals, etc: enter as Other Farm Income and Seed/Chemical/etc. expense; Fertilizer and chemical application: Custom Hire; Employee benefits: Hired Labor; Silage bags: Packaging and Supplies; Precision farming expenses: if they do not fit elsewhere, include in Misc. Crop Expense. Cover crop expenses for agronomic-soil enhancement: Cover Crop Expense; CSP related expenses: enter is the appropriate expense category. Soil testing and grid sampling should be included in fertilizer, cover crop related expenses in Cover Crop Expenses. DHIA and BST: These expenses will be listed if you have downloaded the FINPACK setup files; Cash salaries, wages, and benefits to operators: Enter in Owner Wages and Benefits and reduce Value of Operator Labor and Management; Feed additives: Purchased Feed; Livestock implants: Veterinary; Manure handling: Custom Hire if hired; Hoof trimming Custom Hire; Milk hauling Trucking and Hauling. Use Detail for Purchased Feed to specify the feed commodities purchased which will then contribute to the Amount Available for feed in the Livestock Enterprise Analysis. 40


47 Use Detail to list interest paid on individual loans. This will automatically transfer to the interest breakdown on the enterprise analysis. Special Note for ethanol plant and other entity investments: Income from and/or expenses related to ethanol plants and other entity investments may have a significant impact in certain years. It is left to the producer/student and instructor to decide whether these 41
48 transactions result in farm (or non-farm) income. Treatment should be consistent from year to year and should be consistent with treatment of the business investment on the balance sheet. Payments received that are related to pledged bushels will usually be entered as farm income. If entered as farm income, include income tied to pledged bushels as Other Income on the Crop Enterprise Analysis. Exclude payments that reflect dividends on investment unrelated to specific bushels from the Crop Enterprise Analysis. These payments may be included in a Value Added/Non-Farm Enterprise Analysis to evaluate the profitability of these investments. Special note on hedging transactions: If you do not have accurate record of cash deposits and withdrawals, the net cash transactions for the year can be calculated from Forms 1099: The net deposits/withdrawals = Form1099, enter Box 12 + beginning balance sheet value (Box 10) ending balance sheet value (Box 11). If the result is positive, enter as cash withdrawn from hedging accounts and if negative, enter as hedging account deposits. PERSONAL INCOME Enter all cash non-farm income received during the analysis period. Warning: Do not double count dividends, tax refunds that may have been farm income such as gas tax refunds, property tax refunds, etc. OTHER INFORMATION Gifts and Inheritances ~ Enter cash gifts and cash inheritances received. For non-cash items, enter the value as a capital purchase and offset the purchase by also entering the value here. Family Living Expense ~ Enter cash family living expenses including personal share of utilities, insurance, property taxes, and any other such expense. The total expenditure should be tracked for each operation, whether or not detailed family living expenditures are recorded. If Detailed family living expenses are entered, be sure to enter the number of family members. Enter owner wages as farm expenses, not owner withdrawals. For partnerships, use detailed family expenses or enter total under partnership withdrawals detail item, not both. Income and Social Security Tax Paid ~ Enter all cash income and personal self employment taxes paid during the calendar year. Cash Gifts Given ~ Enter all cash gifts given. Estimated Value of Labor and Management ~ This is the opportunity cost charged for unpaid operator labor and management when calculating the Rate of Return on Assets and Rate of Return on Equity. It is also combined with any Owner Wages and Benefits expense and deducted from the enterprise analysis reports. In the RankEm Summary reports it is always combined with Owner Wages and Benefits to make farms of different ownership 42

49 structure comparable. For sole proprietors and partnerships, the recommended rate for 2017 is: $25,000/full time operator plus 5% of value of farm production. This is a guideline only; adjust for very small or very large farms. Other adjustments: For entities, if owner compensation is included in Owner Wages and Benefits expense, enter zero OR, if the amount included is abnormally low or high, make an adjusting entry here to bring the total value of Owner Labor and Management in line with other farms. For sole proprietors and partnerships, if any compensation is included in Owner Wages and Benefits, reduce Value of Labor and Management by the same amount. Wages paid to children and other family members (other than operators and their spouses) who have no at risk capital investment and do not share in profits should be included as hired labor expense and have no effect on this entry. CASH FLOW CHECK At any time during data entry, click the check-mark icon check. on the toolbar to view the cash flow LABOR HOURS Use labor records or estimate the total hours of labor employed by the farm for the year. Hours of labor guideline for unpaid operator and family labor: Operator: Crop Farm Only = 1,500 Hours Diversified Crop/Livestock = 2,500 Hours Intensive Livestock = 3,000 Hours (These are guidelines, adjust to fit the operation.) Make adjustments for part time situations and as needed. Remember to include the spouse and other family members. For entities, if Owner Wages and Benefits expense is included, include 43
50 owner/operator hours in Full Time Hired Labor. (This input is critical to the hours of work listed on the analysis in each individual enterprise.) ACCRUAL ADJUSTMENTS TO RELATED OPERATING EXPENSES This section makes adjustments to the cash expenses to arrive at the amount actually incurred for the analysis year. Recommendation: Enter the detailed expense categories for prepaid expenses, growing crops, accounts payable and accrued interest on the balance sheets to automatically complete this page. FARM INTEREST BREAKDOWN - Enter interest accrued during the calendar year. When detail is used for farm interest expense input, the amounts automatically move to this location, therefore, you do not have to input them here. For sugar beet stock loans, see sugar beet section. Cash Interest Paid + Ending Accrued Interest - Beginning Accrued Interest = Interest on Debt. Interest on Debt needs to be allocated to operating, intermediate and long term. RELATED OPERATING EXPENSE ALLOCATIONS Enter the proportion of the total for each allocated expense to crop, livestock, and other (value added/non-farm) enterprises. Toggle to enter dollars instead of percentages. Note: To maintain meaningful trends, attempt to be consistent from year to year unless there are major changes to the farming operation. The average for power and machinery is 75% - 80% to crops, for building and fences is 30% - 35% crops. CROP SHARE RENTAL ARRANGEMENTS Select whether the operation being analyzed is the Renter or Landlord. Then enter their share of the production and expenses. Note for Zero Cash Rental Arrangements If a producer rents land for zero cash rent, enter as a 100% share arrangement with the renter also paying 100% of all expenses. 44
51 CROP ENTERPRISE ANALYSIS Crop Name ~ Use the crop list ( Down arrow Pick List). If you want to use a crop that is not listed, contact a member of the database review team from your area. User added crops, those that are not in the FINPACK master list, will not be included in summary reports. For hay crops, recommended enterprises are: Alfalfa hay Clover hay Mixed hay Grass hay Small grain hay For haylage and other wet forages other than corn silage, it is recommended but not required that the dry hay crop name be used and the forage production be converted using the formula under Total Production. Organic transition crops should be listed using the conventional crop name until they reach organic certification. Cover crops harvested or to be harvest for feed should be entered as a normal crop enterprise, using the double crop type if applicable. Description ~ You may use this to further describe the crop or field. Be consistent. This description can be used to select specific fields in historical database reports. For small grain hay use the description to identify barley, oats, and mixed. Crop Type ~ Use only if applicable. The default is normal crop. Hay establishment should be entered separately from full production hay and coded establishment. If seeded with a cover crop such as oats, enter the alfalfa in a separate column from the cover crop and code it establishment/double crop. (The cover crop should be left as Normal). Use your judgment in allocating seed, fertilizer and other direct expenses between the enterprises. Overhead allocations should reflect the total effort or use of equipment for the two enterprises. A suggested approach is to enter a minimum of 2/3 of the normal allocation to the cover crop and ½ of the normal allocation for the hay crop. For example, if the normal allocation factors are 30 for oats and 60 for alfalfa, enter 20 for the oats enterprise and 30 for alfalfa establishment. Fixed per acre allocation items, such as real estate taxes, should be reduced to total 1 across the enterprises. Be sure to code irrigated crops they should not be summarized with dryland acres. Acres Owned ~ Either total crop or each field owned. Custom hire enterprise acres should be entered as Acres Owned. Custom hire enterprise acres are excluded from Total Crop Acres. Acres Cash Rented ~ Either total crop or each field cash rented. 45
52 Acres Share Rented ~ Either total crop or each field share rented. Your Share ~ Must choose a % production from the above crop share rental arrangements. (100% if owned or cash rent.) Total Production ~ Bu, Cwt, Tons and total volume produced for this field or crop (your share). Use the FINPACK unit whenever possible. Convert haylage to dry hay equivalents using the following formula (% dry matter of wet crop % dry matter of hay equivalent) * wet production Example for converting 100 tons of haylage: (.50 dry matter haylage.85 dry matter hay) * 100 = 58.8 tons Convert high moisture corn to dry corn equivalent. For CRP, Custom Work, Prevented Planting, and Rented Out, enter the dollars received as the production and $1.00 for the Value Per Unit. Enter the income received for Prevented Planting as Production, not as Crop Insurance Income. If forage or another product was harvested from Prevented Planting acres, include it as a secondary product or Other Income in the Prevented Planting enterprise. For pasture, estimate production in AUMs based on these animal units: 1000 lb. Cow/calf lb. Cow/calf lb. Cow/calf 1.13 Mature bull 1.30 Calves by themselves 0.30 Weaned calves to yearling 0.60 Yearling cattle ( lbs) year old cattle 0.85 Dairy cow 1.30 Ewe/lamb pair 0.20 Mature horse 1.50 For example, if a pasture enterprise fed one hundred 1100 pound beef cows for six months, enter 642 aums (100 cows x 1.07 animal units x six months). This same amount should be entered as a feed expense to the beef enterprise analysis. Value Per Unit ~ For crops already sold or contracted for sale, enter the actual sale/contract price. For crops in inventory, use the ending inventory value with a minimum of the loan rate for program crops. For crops already fed, use a conservative sales value and use this same value for valuing the feed in the Livestock Enterprise Analysis. Forage values should reflect relative feed value (RFV) and be based on estimated sales value, not purchase prices. Stearns DHIA Laboratories provides actual auction prices based on RFV at: 46
53 Other Income ~ Allocate hedging gains or losses, crop insurance income, LDP payments for this year s production, crop government payments (ARC and PLC), and any other crop related income. Examples are straw sales, crop specific disaster payments, and hauling allowance. Enter Detail to document what was included. Use the X method to allocate across like enterprises (see Direct Expenses below). Cash patronage dividends received in a year should be allocated to the appropriate enterprise. (Any equity redemption received in a year is a capital sale and would not be treated as income in the whole farm or any applicable enterprise.) Special notes: Because of the uncertainty of ARC and PLC payments, Crop Government Payments should be allocated to the year received rather than the production year. Allocation of Government Payments: ARC and PLC payments are entered here but are included in the output report as a below the line adjustment, meaning they are added to the net return at the bottom of the output report. It is recommended that payments be allocated over all tillable acres, except crops that did not contribute to base such as edible beans, carrots, potatoes, or other vegetable crops. Allocate by farm unit if possible. CSP payments and related expenses: Income and expenses related to the CSP government program are allowed to be included in the enterprise analysis for crop acres and applicable livestock operations. Income received should be included as Other Crop Income. This will then be allocated to the applicable crop acres. Expenses related to the CSP program (typically soil testing, grid sampling, or cover crop related expenses) should be included as a fertilizer or cover crop expense. These costs should be allocated to applicable acres. If CSP government program funds are received for practices related to pasture management of the specific livestock enterprises, the funds should be included as Government Payment income for the applicable livestock enterprise. CSP related expenses should be included as Government program expense under Direct Livestock Expenses. Direct Crop Expenses ~ Enter the amount for each crop in dollars. For like enterprises, enter the total cost in one column. You can then assign it equally to the other fields using a -X in the other enterprise(s), where X refers to the column in which the total was entered. For example, enter the first corn enterprise in column number 2. Enter the total seed cost for all corn in this column. For each succeeding corn enterprise, enter -2 for the seed expenses to distribute the total equally (per acre) to all corn enterprises. (Crops do not have to be listed side-by-side for this to function properly.) Seed ~ Seed expense (may include seed treatment). Assign a realistic expense for home-grown seed used. (Usually market price, plus cleaning treating and hauling). For canning crop enterprises, include the actual seed cost paid by the farmer. If there is no seed cost (as the seed is provided by the canning company), enter a zero seed cost. If the farmer had to pay for seed, include the expense paid. For hays, seed expenses should appear only on establishment enterprises and not on the full production enterprises unless there were re-establishment costs. If re-establishment occurred, make a note in the FINAN for reviewers. 47
54 Fertilizer ~ Fertilizer or purchased manure. If custom applied, include product cost only and include application expense in custom hire. Custom manure application costs should be split equally (50/50) between the livestock and cropping enterprises. For cropping enterprises, this expense should be allocated as fertilizer expense. (Livestock enterprises should allocate this cost as custom hire.) Lime fertilizer expenses should be accumulated on the balance sheet as a prepaid expense. The expense should then be allocated to the respective field/crop for a subsequent number of crop years, per the operator s discretion. If lime is spread in the spring, for the current crop, then a portion of the initial cost would be treated as a prepaid expense on the next Jan. 1 balance sheet (again, per the operator s recommendation). If lime is prepaid in the fall, the entire cost is treated as a prepaid expense and allocation begins the following crop year. Corn fertilizer allocation to soybeans: If no fertilizer was applied to soybeans, but fertilizer was applied to corn to supply nutrients for next year s soybean, a portion of the corn fertilizer should be allocated to soybeans. The recommended allocation is 50% of the corn P & K expense OR 25% of total corn fertilizer expense if P&K cannot be broken out. Prevented planting: Acceptable approaches for fertilizer applied to Prevented Planting acres: 1) If the producer plans to reduce phosphorus and potash applications in the following year to use up these nutrients, accumulate these amounts in prepaid expense on the ending balance sheet to be allocated in the following year s analysis; 2) if not, charge all fertilizer applied to prevent plant acres to the Prevented Planting crop. Crop Chemicals ~ Chemical expenses. If custom applied, include product cost only and include application expense in custom hire. Crop Insurance ~ Hail and other crop insurance. Include gross premium, with any income listed as Crop insurance income. Drying Fuel ~ Amount of drying fuel for the crop. Custom Hire ~ Fertilizer, chemicals, aerial application, and freight charges for sugar beets. Hired Labor ~ All hired labor expense for non-salaried workers who do not have management responsibility should be allocated as a direct expenses between the applicable enterprises. Land Rent ~ Cash rent amount total for this crop or field. Machinery Leases ~ True leases specific to this crop or field. 48
55 Marketing ~ Commodity marketing consultants, hedge or option expense. Cover Crop ~ New this year is a Cover Crop Direct Expense. This expense item is to be used for cover crop expenses that are agronomic-soil enhancements in nature. This expense should be accumulated (in prepaid expense or growing crops) on the balance sheet and charged to the following year(s) production crops. (Cover crops harvested or to be harvested for feed should be entered as a normal crop enterprise using the double crop type if applicable.) Allocated Crop Expenses ~ Enter allocation factors that weight the expense portion allocated to each crop on a per acre basis. Toggle factors. to view in Dollars but entries must be made as allocation Default Allocation ~ This allocation will be used for any expense that has no entry below. The Standard Allocations will automatically appear when the crop is selected. Adjustments can be made to any individual line, however. Other Crop Information ~ This information will be used to provide additional detail in the state database. Previous Crop ~ If the entire field was planted to the same crop in the previous year, enter the crop from the drop-down list. Field County ~ The county will default to the county entered on the Summary Information page. Change if this field is in a different county. Production Practices ~ Tillage method, row spacing, other production practices if consistent practices were employed across the entire field. If inconsistent practices were used, leave that practice blank. Note: It is just as important to specify that a specific practice was not used. For example, if no Genetic Chemical Resistant seed was used, be sure to select No. Special Sorts ~ Use the special sorts where appropriate. Joint venture is a must for rented Beet Stock acres. New Special Sort Side Dressed Fertilizer. Delete from Summary ~ Use to delete an individual enterprise only. The rest of the Whole Farm and Enterprise Information will be included in the summary. Do not delete because of a disaster or loss. If you have any concern about the accuracy of the data, delete it from the averages. If the whole field or a major portion was replanted, delete from the averages. 49
56 LIVESTOCK ENTERPRISE ANALYSIS Livestock Enterprise ~ Use the drop-down livestock list. The livestock list to use is also listed at the end of this section. If you want to use a livestock enterprise that is not listed, please call a member of the database review team for your area. Be sure to use the proper enterprise. If beef calves are carried beyond weaning they should be transferred to a backgrounding enterprise to keep the state data accurate. If backgrounders are included in the cow-calf enterprise, use the Cow-calf with backgrounding special sort. The dairy enterprise must be split between dairy and dairy replacements. The table below displays how dairy replacements should be included depending on whether the farm being analyzed is the dairy producer or the heifer raiser. Calves should be born in the dairy enterprise and transferred out to the dairy replacement and/or dairy steer enterprises. Activity Dairy Producer Heifer Raiser Raised replacements Dairy replacements With raised repl sp sort Buy / sell Dairy replacements With buy/sell sp sort Avg head includes farmed out Per head per day Dairy replacement With perhead/perday sort Contract raising cost goes here Dairy repl for sale With buy sell special sort Dairy repl for sale With special sort Description ~ Be consistent with input in this cell. This description can be used in the Historic Database to generate trend reports for specific herds or lots of animals. Gender ~ This is only active for grow/finish enterprises. Use to specify male or female only enterprises. Leave this entry blank for mixed gender enterprises. Contract ~ Use to specify that this enterprise is produced under a production contract. Contractor is the owner of the livestock. Contract Grower is the producer who is housing livestock for the owner. Leave this entry blank for enterprises that are not produced under a production contract. Enter contract grower income as Transferred Out livestock value (and not Other Income). This will avoid the income from being treated as a Revenue Adjustment in calculating the cost of production.. Shared ~ Select Yes if this enterprise is produced on a share rental basis. Combine with Enterprise Number ~ Use to combine the lesser enterprise with the primary enterprise. (Ex: If the Dairy Cow Enterprise is in Column 1 and the Dairy Replacements 50

57 are in Column 2, enter the number 1 in this cell in the Dairy Replacement Enterprise Column.) Special Sorts ~ Use appropriate Sorts as identified in Section V. of this Closeout Manual. Be sure to use for Organic enterprises and Dairy Initiatives farms. Delete from Summary ~ Use to delete an individual enterprise only. The rest of the Whole Farm & Enterprise Information will be included in the summary. Do not delete simply because of a disaster, disease, etc. Inventory ~ If detail is listed on the Balance Sheet, you can bring the information into the Livestock Inventory Section. To do so, first click the Detail button. Then click the Select icon from the detail toolbar and check the animals that belong to this enterprise (see below). Note: You can also Select from previous entries for feeder livestock purchases (from whole farm detail), sales and cull sales (from whole farm detail on the Other Farm Income page). Born ~ For pig production enterprises, enter the number born alive. All dairy calves are born into the dairy enterprise. Those sold as calves should be sold from the dairy enterprise. All others are transferred out and into the Dairy Replacement or Dairy Steer enterprise at market value (suggested price $100.00/head). Sold ~ Enter number sold, total live weight pounds sold, and gross income received of market livestock. Weights should be entered on a live weight basis. If sold on carcass weight and the yield is unknown, convert live weight based on a 75% yield for pigs and 63% yield for cattle. Cull sales ~ Downers should be included with culls, not died. Transferred Out ~ Beef; Calves to Feeders; Dairy heifer calves from Cows to Dairy Replacements; Dairy bull calves to Dairy Steers if not sold directly from dairy enterprise; Hogs - transferred to Breeding when farrowed - transferred out at weaning from Farrowing to Finishing if Finishing is separate. Note: When transferring calves from a Cow-Calf Enterprise to a Beef Background or Beef Feeder Enterprise, charge 3% shrink value to the Cow-Calf Enterprise. This is done by reducing the transfer out value by 3%. This shrink cost will help the retained ownership enterprises reflect a more current analysis. Dairy Beef Enterprise Definitions: Feeders: animals sold or to be sold at less than 500 lbs. 51
58 Backgrounding: animals sold or to be sold between 500 and 1,000 lbs. Finishing: animals sold or to be sold at greater than 1,000 lbs. TRANSFER TABLE Enterprise Description Number Pounds Value Beginning and Ending Inventory - Breeding Livestock Beginning and Ending Inventory - Held for Sale Born Cows on hand Bulls Bred Heifers Open Heifers kept for Breeding All except breeding stock Exclude for Dairy, Beef, and Sheep breeding stock. Total weight (exclude for dairy) Born to dairy Transferred out to Replacement Dairy Purchased Number of Head Exclude for Dairy, Beef, Transferred in (Once a cow, always a cow; Calves get born into dairy cow & transferred out) Sales (except Culls) Head Amount Number of Head including sales for breeding stock Cull cows, dairy, beef, hogs, etc. and Sheep breeding stock. Exclude for Dairy, Beef, and Sheep breeding stock. Weight (except dairy) Cost value for breeding; Market Value on market livestock Market Value What you paid Breeding stock at cost; otherwise Market Value Cash Receipts Culls Exclude for Dairy, Beef, Cash Receipts and Sheep breeding stock. Butchered X X X Died Breeding Stock (Same as Beginning Inventory Breeding Livestock) Died Held for Sale (Same as Beginning Inventory - Held for Sale) LIVESTOCK PRODUCTS AND OTHER INCOME Milk ~ The quantity and value should be the milk produced during the analysis year. Use Detail and then the Select icon to select from whole farm entries. Fed ~ Milk fed to calves Other Income Include dairy MPP or other government payments (see previous CSP recommendations in What s New? ) and hedging gain or loss (enter negative). Cash patronage dividends received in a year should be allocated to the appropriate enterprise. 52
59 (Any equity redemption received in a year is a capital sale and should not be treated as income in the whole farm or to any applicable enterprise.) For Breeding Bulls (leased out) - split out as a separate enterprise and show lease income. Use Detail to document entries. Livestock Product Sales Quantity Value Milk Pounds $ Wool Pounds $ Honey Pounds $ Eggs Dozen $ OTHER INFORMATION Dairy ~ Required fields are Average Number of Cows and Barn Capacity. All other entries are optional for but will be included in the Historical Database and RankEm. Hogs ~ Live to carcass weight conversion factor will default to 75% if left blank. Grow/Finish Enterprises ~ Average daily Number of Head and Normal Gain per Head are required if listed. Other information should be taken from livestock inventory matrix. Normal Gain per Head is divided into the total enterprise gain to arrive at the number of head equivalents produced for the year. This becomes the divisor for the Per Head output column. FEED FED Enter the quantity and value of each feed fed. Toggle to enter price per unit instead of total value. Enter haylage and other wet forages in as fed form or enter the dry forage name and convert to dry equivalent at your discretion. If haylage is converted to dry hay, use the following formula: (% dry matter of wet crop % dry matter of hay equivalent) * wet production Example for converting 100 tons of haylage: (.50 dry matter haylage.85 dry matter hay) * 100 = 58.8 tons Convert high moisture corn to dry corn equivalent. See the discussion of AUMs under Crop Enterprise Analysis for pasture. Use the same value per unit for production of AUMs and feeding of AUMs. Milk replacer should be included in the Dairy Replacement enterprise and not in Dairy. 53
60 Feed Beet pulp Complete ration Corn gluten Cottonseed Creep/starter DDGS, dry DDGS, wet Midds Milk Milk replacer Pasture Protein, vitamins and minerals Stover Straw Whey Unit Ton Ton Ton Ton Ton Ton Ton Ton Lbs. Lbs. AUMs Ton Ton Ton Ton DIRECT LIVESTOCK EXPENSES Enter total dollar amount of each expense listed. DHIA - DHIA costs of a Dairy Cow enterprise should be entered separately. Silage Bags - should be included in livestock supplies unless the intent is sale, in which case they should be included in miscellaneous crop expense. Silage bags should be considered a Direct Crop Expense and included as Packaging and Supplies. Marketing Expenses - these include only costs incurred in marketing and marketing decisions such as brokerage fees, advertising, state and national deductions, and use of marketing tools. Include selling expenses, check-offs, insurance, shrink, etc., but not hauling. Do not include gains and losses from hedging/options; these should be added to or subtracted from Other Income (enter a negative if necessary). Hauling and Trucking charges related to hauling and pickup of livestock and livestock products. Manure Application Custom application costs should be split equally (50/50) between the livestock and cropping enterprises. The livestock portion of these expenses should be allocated as a custom hire expense. (The cropping portion of the expense is fertilizer.) Dairy Genomics expenses associated with dairy genomics should be accumulated under Vet Expenses. The exception is embryo transfer related expenses, these are Breeding Expenses. 54
61 Hired Labor All non-salaried labor should be allocated as a direct expense. Salaried workers, especially those with management responsibility, should be entered as overhead expense and allocated between crops and livestock. ALLOCATED LIVESTOCK EXPENSES The top of the page will indicate whether you are entering Percentages or per head Allocation Factors. Allocation factors can be turned on and off under Tools. For Percentages, enter the % of the total of each expense listed. For Allocation Factors, the entries will be weighted by the number of head in the enterprise. Default Allocations ~ This allocation will be used for any expense that has no entry below. They will appear automatically when the Standard Allocations are used. SPECIAL NOTES FOR DAIRY List all heifers as breeding stock. Cull cows will remain in the breeding herd category. Calves are born in the primary dairy enterprise. Those sold are sold directly from the dairy herd. All others are transferred, females to dairy replacements, males to dairy steers at market value (suggested value $100.00/head). If the amount spent to breed replacements is known, allocate the specific dollar amount of breeding expense to the replacement enterprise. Otherwise, use a split of 2/3 breeding expense to dairy (or main livestock enterprise) and 1/3 to replacements. 55
62 Calculations of Livestock Cost of Production with Revenue Adjustments Livestock Cost of Production Revenue Adjustments Breeding Lvst Breeding Lvst Breeding Lvst Product Sale Sale by Wgt Sale by Carcass (Dairy) (Beef Cow-Calf) (Farrow to Finish) Cost of Prod Per Cost of Prod Cost of Prod Per Cwt. Per Cwt Carc Cwt. of Milk Prod Produced Sold Total cost Beg inv br lvstk Plus Plus Plus Beg inv lvst hld sale Plus Purchases Plus Plus Plus Trans in Plus Plus Plus Sales Minus Cull sales Minus Minus Minus Butchered Minus Trans out Minus End inv br lvstk Minus Minus Minus End inv hld sale Minus Divide by Prod + Used + Fed Cwt Produced Cwt Carcass Sold Breeding Lvst Finishing Lvst Finishing Lvst Sale per Head Sale by Wgt Sale Per Head (Farrow to Wean) (Beef Finishing) (Dairy Replace.) Cost of Prod Cost of Prod Cost of Prod Per Hd Per Cwt. Per Hd Sold/Trans Produced Sold/Trans Total cost Beg inv br lvstk Plus Plus Plus Beg inv lvst hld sale Plus Plus Purchases Plus Plus Plus Trans in Plus Plus Plus Sales Cull sales Minus Minus Minus Butchered Minus Minus Trans out End inv br lvstk Minus Minus Minus End inv hld sale Minus Minus Divide by Head Sold/Trans Cwt Sold/Trans Head Sold/Trans 56

63 VALUE ADDED/NONFARM ENTERPRISES Use the Value Added/Nonfarm Enterprise Analysis to analyze value added co-op investments, custom work, and nonfarm enterprises such as trucking and seed sales. Enterprise ~ Select the enterprise type from the drop down list. This will only be used to sort enterprises for group summaries. Divisor quantity and description ~ If it is useful, use this as a custom divisor for the output report. Do not use for crop or livestock units used in the enterprise this will be included under the crop and livestock entries. The divisor description will be used in the column heading. Examples, miles for trucking, shares for co-op investments. Crop Related Enterprises ~ If you want to analyze this enterprise based on the number of units of a crop used, enter the crop name and the number of units used/marketed. Also, if the easiest way to measure the income from this enterprise is to calculate the premium price received for the crop, enter the Total Premium income received over the price used to value the crop in the crop enterprise analysis. Livestock Related Enterprises ~ If you want to analyze this enterprise based on the number of units of a livestock enterprise used, enter the enterprise name and the number of units used/marketed. Also, if the easiest way to measure the income from this enterprise is to calculate the premium price received for the livestock, enter the Total Premium income received over the price entered for sales of from this enterprise in the livestock enterprise analysis. 57
64 Dividends and Direct Income ~ Enter any other income for the enterprise. All income for the enterprise must be entered in Crop Premium, Livestock Premium, Dividends, and Direct Income. Cost of Goods Sold ~ Optional, use this only if the enterprise has an identifiable cost of goods sold as would be entered on Schedule C for this enterprise. Total Investment ~ This will be used to calculate the Rate of Return on Assets for this enterprise. Direct Expense ~ This is the IRS Schedule C expense list. Enter all expenses except the cost of goods sold and those allocated from the farm expenses. Allocated Expenses ~ Enter the percentage of the Value Added/Nonfarm allocated expenses to each enterprise. 58
65 V. Organic & Specialty Crop Farm Analysis 59
66 60
67 Whole Farm Special Sorts Analysis If all enterprises produced on the farm are certified organic, identify the producer as Organic Farm (total) in the Whole Farm Special Sorts. If some but not all enterprises are certified organic, identify the farm as Organic Farm (partial). If the farm produces fruits or vegetables for fresh markets, identify the producer as a Specialty Crop Farm. Special emphasis should be placed on producers of fresh market apples, berries, grapes, mixed vegetables, pumpkins, and sweet corn. Balance Sheet For producers who are establishing new orchards or perennial crops, accumulate the costs of establishment in Other Intermediate Assets and depreciate over a conservative economic life of the plants. Crop Enterprise Analysis Enterprise Identification (Organic): Specific organic identifiers exist for the following crops: Barley Hay, alfalfa Peas Buckwheat Hay, grass Rye Corn Hay, mixed Sorghum silage Corn, blue Oatlage Soybeans Corn silage Oats Sunflowers Flax Pasture Wheat, spring Enterprise Identification (Specialty Crops) Vegetables (assorted): Use this crop for multiple products produced on a small acreage, making it impractical to analyze each enterprise individually. Enter the value of the total production of these crops as the Production. Vegetables (high tunnel): Use this crop for vegetables produced in high tunnel facilities, again entering the total value of production as the Production. Production: If multiple products are produced from the same acreage, follow these guidelines: If the multiple products result from harvesting the same product in different forms, use detail for Total Production to identify the production of each product. This would be common for taking hay and pasture from the same acreage. If different products are produced under two separate production activities, enter the activities as separate enterprises and identify the second, third enterprises as double crops. If some crop was left in the field because of lack of markets, report the quantity sold. Direct Expenses: Organic weed, insect, or other pest control Non-Chemical Crop Protection; Certification expenses Organic Certification 61
68 Fallow Direct expenses incurred on fallow land should be included in whole farm expenses but should be captured and included as Growing Crop expenses on the ending balance sheet. These Growing Crop expenses should then be assigned to the production crops in the following year. Fallow enterprises should be entered to account for the acres but direct expenses should be handled as stated and overhead expenses should be allocated to production crops. Overhead Expense Allocations: If organic and conventional production occurred on the same farm, use your and your student s knowledge of the production system to allocate overhead expenses to the various enterprises. Livestock Enterprise Analysis Enterprise Identification: Identify enterprises as Organic using the Special Sorts. Feed Fed: Home produced organic feed should be valued at estimated market value for organic feed of the same quality. Direct Expenses: Certification Organic Certification 62
69 VI. Downloading FINPACK Setup Files 63
70 64
71 DOWNLOADING FINPACK SETUP Download the FINPACK setup for your region by: 1. Go to: 2. Select Publications + Educator FINPACK Setups 3. Click Start Download 4. Save FPUniformSetup.exe to your computer and run it 5. Select your group from the State/Region drop-down list 6. Follow the steps to finish the setup installation 65
72 66
73 VII. Importing FINAN Data 67
74 68

75 IMPORTING FINAN DATA EXPORTING FROM ACCOUNTING SOFTWARE FINPACK interfaces exist for several accounting software packages including QuickBooks, Quicken, EasyFarm, PCMars, UltraFarm, and MicroTel. Each system will export the cash transactions for the period in a file format that can be imported into FINAN. At this time, only cash transactions are included. Most systems export totals for each chart of accounts category. The exported file will have a file extension of.fif (FINPACK Interface File). If the export file does not include this extension, rename the file to add the.fif extension. Refer to the individual accounting system documentation for instructions on exporting data for FINPACK. SELECTIN THE FINPACK INTERFACE FILE Begin by creating your FINAN for the accounting period, either by creating a blank FINAN or copying last year s analysis. On the FINAN General Information page, select the beginning and ending balance sheets (balance sheet data is not imported). Then select Edit + Import Data from the main menu. You will be prompted for the file location. If the correct file name for this farm is not displayed, click Browse to find the correct file. The default setting is to delete all existing cash transaction data from the FINAN input. If you uncheck this option, imported transactions will be added to existing transactions. This may be useful for farms that keep more than one set of accounts. CHECKING AND CORRECTING CHART OF ACCOUNTS MAPPING When the FINPACK Interface File is selected, the data will be displayed by category and chart of accounts location as shown below. At this point you have the ability to check and edit the destination of the imported data in FINAN. Scroll through the FINAN data entry page titles on the left to review and edit the data mapping. 69
.")
76 Column 1: Category This is the FINAN Whole Farm data entry category destination for the transaction data. The category can be changed to move data to a different location in FINAN. If the new category moves the data to a different page, the record will disappear from the current category listing once you move to a different record (as it is moved to the new page). Column 2: This is the chart of accounts destination for each transaction. The major purpose of this page is to allow you to change the destination to accurately import the transaction data into FINAN. Column 3: Description This is the description of the account from the accounting software. Column 4: Value This is the dollar amount that will be imported. Values can be changed here in the unusual situation that a correction is needed. Value changes are temporary until the data is imported or the import is Cancelled; changes are not saved in the.fif file. When you have verified the data mapping for each page of FINAN data entry, click OK. When the data has been successfully imported, the FINAN will close and you will need to re-open it to view and edit the FINAN data. IMPORTING ERRORS If errors are found in the import file, and error message will be displayed and specific amounts will not be imported. Errors usually indicate that the chart of account being mapped to in FINAN is not active in your copy of FINPACK. You will have to manually enter these amounts in FINAN to correct the problem. 70
Farm Record Analysis. Closeout. Procedures
 2016 Farm Record Analysis Closeout Procedures January 4, 2017 ii Introduction This manual was developed to assist in the standardization of data collection and entry for Farm Business Management Annual
2015 Michigan Dairy Farm Business Analysis Summary. Eric Wittenberg And Christopher Wolf. Staff Paper November, 2016
 2015 Michigan Dairy Farm Business Analysis Summary Eric Wittenberg And Christopher Wolf Staff Paper 2016-01 November, 2016 Department of Agricultural, Food, and Resource Economics MICHIGAN STATE UNIVERSITY
2014 Michigan Dairy Farm Business Analysis Summary. Eric Wittenberg And Christopher Wolf. Staff Paper December, 2015
 2014 Michigan Dairy Farm Business Analysis Summary Eric Wittenberg And Christopher Wolf Staff Paper 2015-08 December, 2015 Department of Agricultural, Food, and Resource Economics MICHIGAN STATE UNIVERSITY
2009 Michigan Dairy Farm Business Analysis Summary. Eric Wittenberg And Christopher Wolf. Staff Paper December, 2010
 2009 Michigan Dairy Farm Business Analysis Summary Eric Wittenberg And Christopher Wolf Staff Paper 2010-04 December, 2010 Department of Agricultural, Food, and Resource Economics MICHIGAN STATE UNIVERSITY
Appendix I Whole Farm Analysis Procedures and Measures
 Appendix I Whole Farm Analysis Procedures and Measures The whole-farm reports (except for the balance sheets) include the same number of farms, which were all of the farms whose records were judged to
FARM BUSINESS MANAGEMENT
 FARM BUSINESS MANAGEMENT 2009 Annual Report Central and West Central Minnesota April, 2010 A Management Education Program Minnesota State Colleges and Universities Ridgewater College VISIT OUR WEBSITE
2015 Missouri FBMA Farm Record Analysis Closeout Procedures
 2015 Missouri FBMA Farm Record Analysis Closeout Procedures Bruce Fowler Farm Business Management Specialist University of Missouri 116 Gentry Hall Columbia, MO 65211-7040 573-882-7379 1 INTRODUCTION This
2004 Michigan Dairy Farm Business Analysis Summary. Eric Wittenberg Christopher Wolf. Staff Paper September 2005
 Staff Paper 2004 Michigan Dairy Farm Business Analysis Summary Eric Wittenberg Christopher Wolf Staff Paper 2005-10 September 2005 Department of Agricultural Economics MICHIGAN STATE UNIVERSITY East Lansing,
2007 Michigan Dairy Farm Business Analysis Summary. Eric Wittenberg And Christopher Wolf. Staff Paper December, 2008
 2007 Michigan Dairy Farm Business Analysis Summary Eric Wittenberg And Christopher Wolf Staff Paper 2008-04 December, 2008 Department of Agricultural, Food, and Resource Economics MICHIGAN STATE UNIVERSITY
2011 Missouri FBMA Farm Record Analysis Closeout Procedures
 2011 Missouri FBMA Farm Record Analysis Closeout Procedures Dr. Norman Rohrbach Farm Business Management Specialist University of Missouri 116 Gentry Hall Columbia, MO 65211-7040 573-882-7379 INTRODUCTION
2015 Michigan Cash Grain Farm Business Analysis Summary. Eric Wittenberg And Christopher A. Wolf. Staff Paper November, 2016
 2015 Michigan Cash Grain Farm Business Analysis Summary Eric Wittenberg And Christopher A. Wolf Staff Paper 2016-02 November, 2016 Department of Agricultural, Food, and Resource Economics MICHIGAN STATE
2011 Michigan Cash Grain Farm Business Analysis Summary. Eric Wittenberg And Christopher A. Wolf. Staff Paper October, 2012
 2011 Michigan Cash Grain Farm Business Analysis Summary Eric Wittenberg And Christopher A. Wolf Staff Paper 2012-09 October, 2012 Department of Agricultural, Food, and Resource Economics MICHIGAN STATE
2014 Michigan Cash Grain Farm Business Analysis Summary. Eric Wittenberg And Christopher A. Wolf. Staff Paper December, 2015
 2014 Michigan Cash Grain Farm Business Analysis Summary Eric Wittenberg And Christopher A. Wolf Staff Paper 2015-07 December, 2015 Department of Agricultural, Food, and Resource Economics MICHIGAN STATE
2008 Michigan Cash Grain Farm Business Analysis Summary. Eric Wittenberg And Stephen Harsh. Staff Paper November, 2009
 2008 Michigan Cash Grain Farm Business Analysis Summary Eric Wittenberg And Stephen Harsh Staff Paper 2009-11 November, 2009 Department of Agricultural, Food, and Resource Economics MICHIGAN STATE UNIVERSITY
2007 Michigan Cash Grain Farm Business Analysis Summary. Eric Wittenberg And Stephen Harsh. Staff Paper December, 2008
 2007 Michigan Cash Grain Farm Business Analysis Summary Eric Wittenberg And Stephen Harsh Staff Paper 2008-07 December, 2008 Department of Agricultural, Food, and Resource Economics MICHIGAN STATE UNIVERSITY
2007 Michigan Dairy Grazing Farm Business Analysis Summary. Eric Wittenberg And Christopher Wolf. Staff Paper December, 2008
 2007 Michigan Dairy Grazing Farm Business Analysis Summary Eric Wittenberg And Christopher Wolf Staff Paper 2008-5 December, 2008 Department of Agricultural, Food, and Resource Economics MICHIGAN STATE
2006 Michigan Dairy Grazing Farm Business Analysis Summary. Eric Wittenberg And Christopher Wolf. Staff Paper November, 2007
 2006 Michigan Dairy Grazing Farm Business Analysis Summary Eric Wittenberg And Christopher Wolf Staff Paper 2007-09 November, 2007 Department of Agricultural Economics MICHIGAN STATE UNIVERSITY East Lansing,
Cash Flow and Enterprise Information - step two for your 2016 farm analysis
 1 of 24 Name Address County Phone Email Year Born Year Started Farming Cash Flow and Enterprise Information - step two for your 2016 farm analysis Now that you have a beginning and an ending balance sheet,
MILK PRODUCTION COSTS in 1998 on Selected WISCONSIN DAIRY FARMS
 MILK PRODUCTION COSTS in 1998 on Selected WISCONSIN DAIRY FARMS by Gary Frank and Jenny Vanderlin 1 July 23, 1999 Introduction Total cost of production per hundredweight equivalent of milk ($14.90) was
MILK PRODUCTION COSTS and SELECTED FINANCIAL BENCHMARKS FROM 978 WISCONSIN DAIRY FARMS
 1996 1 MILK PRODUCTION COSTS and SELECTED FINANCIAL BENCHMARKS FROM 978 WISCONSIN DAIRY FARMS by Gary Frank and Jenny Vanderlin 2 August 27, 1997 Introduction In this study of 1996 records, 978 dairy farms
The entire report is available at:
 2005 Annual Report Staff Paper P06-5 Department of Applied Economics University of Minnesota St. Paul, MN 55108 March 2006 The University of Minnesota is committed to the policy that all persons shall
2006 Iowa Farm Costs. and Returns File C1-10. Ag Decision Maker. Definition of Terms Used
 2006 Iowa Farm Costs Ag Decision Maker and Returns File C1-10 The farm record data utilized in this report were obtained from the Iowa Farm Business Associations. The average of all farms in each table
Agriculture & Business Management Notes...
 Agriculture & Business Management Notes... SPA Standardized Performance Analysis For Cow/Calf Producers -- A Worksheet Approach -- Cow/calf producers have been challenged to be lower cost producers, to
Report on Minnesota Farm Finances. April, 2010
 2009 Report on Minnesota Farm Finances April, 2010 Acknowledgements: Contributing Minnesota producers Minnesota State Colleges and Universities Farm Business Management Education Program Southwestern Minnesota
MILK PRODUCTION COSTS in 2001 on Selected WISCONSIN DAIRY FARMS
 MILK PRODUCTION COSTS in 2001 on Selected WISCONSIN DAIRY FARMS By Gary Frank and Jenny Vanderlin 1 July 22, 2002 Introduction The good news is that higher milk prices in 2001 caused an increased of almost
Managing For Today s Cattle Market And Beyond: A Comparative Analysis Of ND - Demo Cow Herd To North Dakota Database
 Managing For Today s Cattle Market And Beyond: A Comparative Analysis Of ND - Demo - 160 Cow Herd To North Dakota Database By Harlan Hughes Extension Livestock Economist Dept of Agricultural Economics
The entire report is available at:
 The University of Minnesota is committed to the policy that all persons shall have equal access to its programs, facilities, and employment without regard to race, color, creed, religion, national origin,
2011 STATE FFA FARM BUSINESS MANAGEMENT TEST PART 2. Financial Statements (FINPACK Balance Sheets found in the resource information)
") 2011 STATE FFA FARM BUSINESS MANAGEMENT TEST PART 2 Financial Statements (FINPACK Balance Sheets found in the resource information) Please use the Market Value when making the calculations for the Zimmerman
2011 STATE FFA FARM BUSINESS MANAGEMENT TEST PART 2 Financial Statements (FINPACK Balance Sheets found in the resource information) Please use the Market Value when making the calculations for the Zimmerman
Managing For Today s Cattle Market And Beyond A Comparative Analysis Of Demo Herd 1997 Herd To McKenzie County Database
 Managing For Today s Cattle Market And Beyond A Comparative Analysis Of Demo Herd 1997 Herd To McKenzie County Database By Harlan Hughes Extension Livestock Economist Dept of Agricultural Economics North
MILK PRODUCTION COSTS in 2000 on Selected WISCONSIN DAIRY FARMS
 MILK PRODUCTION COSTS in 2000 on Selected WISCONSIN DAIRY FARMS By Gary Frank 1 July 27, 2001 Introduction In 2000, the U.S. Average Milk Price ($12.33) was less than the study farms' total economic cost
NEBRASKA FFA FARM MANAGEMENT CAREER DEVELOPMENT CONTEST 2016 Farm Business Management Practice Contest Examination
 NEBRASKA FFA FARM MANAGEMENT CAREER DEVELOPMENT CONTEST 2016 Farm Business Management Practice Contest Examination 1. A farm business operation which is highly financially leveraged is best described as
North Dakota Farm Bureau North Dakota Farmers Union Monsanto 1 Star in Star Partner Program
 North Dakota Department of Career and Technical Education Mr. Wayne Kutzer, State Director Board Members Mr. Darrel Remington, Chairperson Mr. Jeffrey Lind, Vice Chairperson Ms. Maren Daley Mr. Brian Duchscherer
2012 STATE FFA FARM BUSINESS MANAGEMENT TEST PART 2. Financial Statements (FINPACK Balance Sheets found in the resource information)
") 2012 STATE FFA FARM BUSINESS MANAGEMENT TEST PART 2 Financial Statements (FINPACK Balance Sheets found in the resource information) Please use the Market Value when making the calculations for the Zimmerman
2012 STATE FFA FARM BUSINESS MANAGEMENT TEST PART 2 Financial Statements (FINPACK Balance Sheets found in the resource information) Please use the Market Value when making the calculations for the Zimmerman
Annual Summary Data Kentucky Beef Farms
 Cooperative Extension Service, University of Kentucky College of Agriculture, Food and Environment. Agricultural Economics - Extension No. 2013-13 Kentucky Farm Business Management Program Annual Summary
THE BENEFITS OF FINANCIAL BENCHMARKING TO FARMERS IN THE UNITED STATES
 THE BENEFITS OF FINANCIAL BENCHMARKING TO FARMERS IN THE UNITED STATES Robert Craven, Dale Nordquist and Kevin Klair Center for Farm Financial Management, University of Minnesota Abstract Benchmarking
Report on Minnesota Farm Finances. August, 2009
 2008 Report on Minnesota Farm Finances August, 2009 Acknowledgements: Contributing Minnesota producers Minnesota State Colleges and Universities Farm Business Management Education Program Southwestern
The entire report is available at:
 The University of Minnesota is committed to the policy that all persons shall have equal access to its programs, facilities, and employment without regard to race, color, creed, religion, national origin,
The sales price for Pasture equivalents is zero. Check the feed prices on the last section of the Budgets.
 File: M&m FINFLO 2006 Warning The sales price for Pasture equivalents is zero. Check the feed prices on the last section of the Budgets. Max and Marlene Profit FINLRB: Succession example Anyplace, Eastern
Annual Summary Data Kentucky Beef Farms 2013
 Cooperative Extension Service, University of Kentucky College of Agriculture, Food and Environment. Agricultural Economics - Extension No. 2014-04 Kentucky Farm Business Management Program Annual Summary
2016 ANNUAL REPORT Western North Dakota
 2016 ANNUAL REPORT Western North Dakota North Dakota Farm and Ranch Business Management Education www.ndfarmmanagement.com Cover photo courtesy of Lynsey Aberle, Norwich, ND North Dakota Department of
The entire report is available at:
 The University of Minnesota is committed to the policy that all persons shall have equal access to its programs, facilities, and employment without regard to race, color, creed, religion, national origin,
2017 ANNUAL REPORT South Central North Dakota
 2017 ANNUAL REPORT South Central North Dakota North Dakota Farm and Ranch Business Management Education www.ndfarmmanagement.com North Dakota Department of Career and Technical Education Mr. Wayde Sick,
BUSINESS SUMMARY DAIRY FARM NEW YORK SMALL HERD FARMS, 140 COWS OR FEWER, 2014 JUNE 2015 E.B
 DAIRY FARM BUSINESS SUMMARY JUNE 2015 E.B. 2015-09 NEW YORK SMALL HERD FARMS, 140 COWS OR FEWER, 2014 Wayne A. Knoblauch Cathryn Dymond Jason Karszes Richard Kimmich Charles H. Dyson School of Applied
2014 ANNUAL REPORT North Central North Dakota
 2014 ANNUAL REPORT North Central North Dakota North Dakota Farm and Ranch Business Management Education www.ndfarmmanagement.com North Dakota Department of Career and Technical Education Mr. Wayne Kutzer,
Basin Electric Power Cooperative CHS Foundation North Dakota Farm Bureau North Dakota Farmers Union
 North Dakota Department of Career and Technical Education Mr. Wayne Kutzer, State Director Board Members Mr. Darrel Remington, Chairperson Mr. Jeffrey Lind, Vice Chairperson Ms. Maren Daley Mr. Brian Duchscherer
An Economic Comparison of Organic and Conventional Dairy Production, and Estimations on the Cost of Transitioning to Organic Production
 An Economic Comparison of Organic and Conventional Dairy Production, and Estimations on the Cost of Transitioning to Organic Production Produced by: the Northeast Organic Farming Association of Vermont
BUSINESS SUMMARY DAIRY FARM NEW YORK SMALL HERD FARMS, 120 COWS OR FEWER, 2011 JULY 2012 E.B
 DAIRY FARM BUSINESS SUMMARY JULY 2012 E.B. 2012-04 NEW YORK SMALL HERD FARMS, 120 COWS OR FEWER, 2011 Wayne A. Knoblauch Linda D. Putnam Jason Karszes Mariane Kiraly Cathryn Dymond Charles H. Dyson School
MILK PRODUCTION COSTS in 2008 On Selected WISONSIN DAIRY FARMS
 MILK PRODUCTION COSTS in 2008 On Selected WISONSIN DAIRY FARMS By Ken Bolton and Jenny Vanderlin 1 October 2009 Introduction The Basic Cost of Production increased in 2008 by $0.35/cwt equivalent (CWT
BUSINESS SUMMARY DAIRY FARM NEW YORK SMALL HERD FARMS, 140 COWS OR FEWER, 2013 JULY 2014 E.B
 DAIRY FARM BUSINESS SUMMARY JULY 2014 E.B. 2014-07 NEW YORK SMALL HERD FARMS, 140 COWS OR FEWER, 2013 Wayne A. Knoblauch Cathryn Dymond Jason Karszes Mariane Kiraly Charles H. Dyson School of Applied Economics
North Dakota Farm Bureau North Dakota Farmers Union
 North Dakota Department of Career and Technical Education Mr. Wayne Kutzer, State Director Board Members Mr. Darrel Remington, Chairperson Mr. Jeffrey Lind, Vice Chairperson Ms. Maren Daley Mr. Brian Duchscherer
MILK PRODUCTION COSTS in 2009 on Selected WISONSIN DAIRY FARMS
 MILK PRODUCTION COSTS in 2009 on Selected WISONSIN DAIRY FARMS By Ken Bolton and Jenny Vanderlin 1 Introduction January 2011 The good news is that Wisconsin dairy farmers lowered their basic cost of production
2017 Ohio Farm Business Summary
 OHIO STATE UNIVERSITY EXTENSION 2017 Ohio Farm Business Summary Crop Enterprise Analysis with Benchmark Reports farmprofitability.osu.edu Our Thanks To: The professionals who worked with farms and completed
Martin and Peg Smith Case
 Martin and Peg Smith Case Introduction The end of another year was quickly approaching. As was typical at this time of the year, Martin and Peg were gathering financial information for their mid-november
~il~~:~~ii~!. ~...~: {(.~i. !!.~I~ji!': i~i( l:;i;!i:i;i;i:::-: :: C: ..::::)~::m~:l::::t:m:;::;;%::;:!;:;:;:j;.:;:;::::;::j::j:j\:;..
~::m~:l::::t:m:;::;;%::;:!;:;:;:j;.:;:;::::;::j::j:j\:;..") May 1983 A.E. Ext. 83-10 ~il~~:~~ii~!. ~...~:..::::)~::m~:l::::t:m:;::;;::;:!;:;:;:j;.:;:;::::;::j::j:j\:;.. ;/::@H::;j'::;{:: ::::;:;:;:;:::;:::::::::::::;: ::::::;:::::;:;:::;:::::;::::: ~ ~::: ~: ~:
May 1983 A.E. Ext. 83-10 ~il~~:~~ii~!. ~...~:..::::)~::m~:l::::t:m:;::;;::;:!;:;:;:j;.:;:;::::;::j::j:j\:;.. ;/::@H::;j'::;{:: ::::;:;:;:;:::;:::::::::::::;: ::::::;:::::;:;:::;:::::;::::: ~ ~::: ~: ~:
Wheat Enterprises: 1999 Costs and Returns
 Wheat Enterprises: 1999 Costs and Returns KENTUCKY FARM BUSINESS MANAGEMENT PROGRAM Agricultural Economics Extension No. 2001-07 July 2001 By: DAVID L. HEISTERBERG AND RICHARD L. TRIMBLE University of
PROJECTING CASH FLOWS ON DAIRY FARMS
 January 2002 E.B. 2002-04 PROJECTING CASH FLOWS ON DAIRY FARMS By Eddy L. LaDue Agricultural Finance and Management at Cornell Cornell Program on Agricultural and Small Business Finance Department of Applied
The data for this report were collected by Iowa Farm Business Association consultants and compiled by Iowa State University Extension and Outreach.
 2016 Cash Iowa Rental Farm Rates Costs for Iowa Ag Decision Maker Returns 2015 Survey File C1-10 The farm record data utilized in this report were obtained from the Iowa Farm Business Association. The
2014 ANNUAL REPORT South Central North Dakota
 2014 ANNUAL REPORT South Central North Dakota North Dakota Farm and Ranch Business Management Education www.ndfarmmanagement.com North Dakota Department of Career and Technical Education Mr. Wayne Kutzer,
BUSINESS SUMMARY DAIRY FARM NEW YORK SMALL HERD FARMS, 80 COWS OR FEWER 2002 PARTICIPANT COPY OCTOBER 2003 E.B
 OCTOBER 2003 E.B. 2003-18 DAIRY FARM BUSINESS SUMMARY NEW YORK SMALL HERD FARMS, 80 COWS OR FEWER 2002 Wayne A. Knoblauch Linda D. Putnam Mariane Kiraly Jason Karszes PARTICIPANT COPY Department of Applied
A. Circle the best answer. Put a square around your second choice, if you want. If your second choice is correct you get half credit.
 Economics 330 Exam 1 Fall 2007 Farm Budgeting and Planning K E Y A. Circle the best answer. Put a square around your second choice, if you want. If your second choice is correct you get half credit. (4
Economics 330 Fall 2005 Exam 1. Strategic Planning and Budgeting
 Economics 330 Fall 2005 Exam 1 K E Y Strategic Planning and Budgeting Circle the letter of the best answer. You may put a square around the letter of your second choice. If your second choice is right,
2013 ANNUAL REPORT Region 2
 2013 ANNUAL REPORT Region 2 North Dakota Farm and Ranch Business Management Education Regional Reporting Areas www.ndfarmmanagement.com North Dakota Department of Career and Technical Education Mr. Wayne
DAIRY FARM BUSINESS SUMMARY CENTRAL VALLEYS REGION 2007 SEPTEMBER 2008 E.B
 DAIRY FARM BUSINESS SUMMARY SEPTEMBER 2008 E.B. 2008-17 CENTRAL VALLEYS REGION 2007 Wayne A. Knoblauch Linda D. Putnam Jason Karszes Daniel Murray Charles Z. Radick Cathy S. Wickswat James P. Manning Bonnie
Ranch Calculator (RanchCalc)
") Oklahoma Cooperative Extension Service Current Report CR-3252 0609 Oklahoma Cooperative Extension Fact Sheets are also available on our website at: facts.okstate.edu Ranch Calculator (RanchCalc) Damona
Oklahoma Cooperative Extension Service Current Report CR-3252 0609 Oklahoma Cooperative Extension Fact Sheets are also available on our website at: facts.okstate.edu Ranch Calculator (RanchCalc) Damona
BUSINESS SUMMARY DAIRY FARM NEW YORK SMALL HERD FARMS, 70 COWS OR FEWER 2000 AUGUST 2001 E.B
 AUGUST 2001 E.B. 2001-10 DAIRY FARM BUSINESS SUMMARY NEW YORK SMALL HERD FARMS, 70 COWS OR FEWER 2000 Wayne A. Knoblauch Linda D. Putnam Mariane Kiraly Jason Karszes Department of Applied Economics and
Costs to Produce Milk in Illinois 2003
 Costs to Produce Milk in Illinois 2003 University of Illinois Farm Business Management Resources FBM-0160 Costs to Produce Milk in Illinois 2003 Dale H. Lattz Extension Specialist, Farm Management Department
2016 ANNUAL REPORT South Central North Dakota
 2016 ANNUAL REPORT South Central North Dakota North Dakota Farm and Ranch Business Management Education www.ndfarmmanagement.com North Dakota Department of Career and Technical Education Mr. Wayne Kutzer,
2009 Organic Farm Performance
 This document is made available electronically by the Minnesota Legislative Reference Library as part of an ongoing digital archiving project. http://www.leg.state.mn.us/lrl/lrl.asp 2009 Organic Farm Performance
MEASURING SCOPE EFFICIENCY FOR CROP AND BEEF FARMS. M. R. Langemeier 1 and R. D. Jones 1
 Beef Cattle Research 2006 MEASURING SCOPE EFFICIENCY FOR CROP AND BEEF FARMS M. R. Langemeier 1 and R. D. Jones 1 Summary This study evaluated scope efficiency (the degree of efficiency gained from producing
2017 FINBIN Report on Minnesota Farm Finances
 Acknowledgements: Contributing Minnesota producers Minnesota Farm Business Management Education, Minnesota State Southwestern Minnesota Farm Business Management Association Thank you to Brittni Lamoreux
GUIDE TO ASSEMBLING DATA FOR COW-CALF
 GUIDE TO ASSEMBLING DATA FOR COW-CALF SPA-38 STANDARDIZED PERFORMANCE ANALYSIS* Revised 1-25-06 DATA NEEDED Assembling necessary data for the Cow-Calf Standardized Performance Analysis (SPA) is the most
This guide examines the financial feasibility of
 AGRICULTURE Starting a 150-Cow Intensive Rotational Grazing Dairy This guide examines the financial feasibility of starting a 150-cow intensive rotational grazing dairy in Missouri. The model dairy described
BUSINESS SUMMARY DAIRY FARM NEW YORK SMALL HERD FARMS, 80 COWS OR FEWER 2007 JULY 2008 E.B
 DAIRY FARM BUSINESS SUMMARY JULY 2008 E.B. 2008-12 NEW YORK SMALL HERD FARMS, 80 COWS OR FEWER 2007 Wayne A. Knoblauch Linda D. Putnam Mariane Kiraly Jason Karszes Department of Applied Economics and Management
Major Cost Items on Wisconsin Organic, Grazing, and Confinement (Average of All Sizes) Dairy Farms
 Dairy Farms") Major Cost Items on Wisconsin Organic, Grazing, and Confinement (Average of All Sizes) Dairy Farms By Tom Kriegl 1 February 19, 2008 Cost management should receive regular attention on any farm. Focusing
Major Cost Items on Wisconsin Organic, Grazing, and Confinement (Average of All Sizes) Dairy Farms By Tom Kriegl 1 February 19, 2008 Cost management should receive regular attention on any farm. Focusing
April 1983 A.E. Ext
 April 1983 A.E. Ext. 83-16 - Deportment of Agricultural Economics New York State Co ll ege of Agriculture and life Sciences A Sial uto r r C o1i ~ge 01 the Sial. University Corne ll University, Ith aca,
2012 ANNUAL REPORT State Averages
 2012 ANNUAL REPORT State Averages North Dakota Farm and Ranch Business Management Education Regional Reporting Areas www.ndfarmmanagement.com North Dakota Department of Career and Technical Education Mr.
BUSINESS SUMMARY DAIRY FARM WESTERN NEW YORK REGION 2011 JUNE 2012 E.B
 DAIRY FARM BUSINESS SUMMARY JUNE 2012 E.B. 2012-03 WESTERN NEW YORK REGION 2011 You can t manage what you can t measure. But if you measure it, you can improve it! Wayne A. Knoblauch Linda D. Putnam Jason
3. Dairy Production Data: 3.1. Year-end milk check showing total pounds of milk sold for the year DHIA Herdcode
 Dairy Cash Flow Plan extension.psu.edu Annual Cash Flow Checklist: 1. Historical Financial Data: 1.1. 2015 Income & Expenses Bring print out from computer or paper record book if possible 1.2. 2015 Schedule
Highlights from the 2007 North Dakota Region 4 Averages
 Highlights from the 2007 North Dakota Region 4 Averages Overview for Region 4 The western part of North Dakota had a good year for crop production with an overall increase in yields and increases in prices.
Multi-Year Economic, Productive & Financial Performance Of Alberta Cow/Calf Operations
 Benchmarks for Alberta Cattlemen Economics & Competitiveness Multi-Year Economic, Productive & Financial Performance Of Alberta Cow/Calf Operations (2012-2016) 24-Oct-17 Overview This AgriProfit$ Cost
Revenue Components. Yield Government Programs Crop Insurance
 Farm Financial Conditions 25th Annual Crop Insurance Conference January 22, 2018 Fargo, ND Andrew Swenson Extension Farm Management Specialist Department of Agribusiness and Applied Economics North Dakota
A Study into Dairy Profitability MSC Business Services during
 A Study into Dairy Profitability MSC Business Services during 2006-2009 July 2010 Authors: Michael Evanish, Manager Wayne Brubaker, Consultant Lee Wenger, Consultant Page 1 of 43 Page 2 of 43 Index Part
FARMLAND OWNER ACCOUNT NO INVESTED CASH 7, CASH 0.00 ============ TOTAL CASH EQUIVALENTS 7, FARMLAND OWNER TRUST # ,887.
 CASH STATEMENT FARMLAND OWNER ACCOUNT NO. 999999 BEGINNING BALANCES INVESTED CASH 7,406.11 CASH 0.00 TOTAL CASH EQUIVALENTS 7,406.11 NET FARM CONTRIBUTIONS FARMLAND OWNER TRUST #9999 23,887.34 NON-FARM
Grass-fed and Organic Beef: Production Costs and Breakeven Market Prices, 2008 and 2009
 AS 658 ASL R2684 2012 Grass-fed and Organic Beef: Production Costs and Breakeven Market Prices, 2008 and 2009 Denise Schwab Iowa State University Margaret Smith Iowa State University H. Joe Sellers Iowa
Missouri 700-Cow Dairy Model. A Value Added Enterprise for Missouri Crop Producers
 Missouri 700-Cow Dairy Model A Value Added Enterprise for Missouri Crop Producers Prepared by: Dairy Focus Team Commercial Agriculture Program September 2005 1. INTRODUCTION... 3 2. ECONOMIC FACTORS FOR
Report on Minnesota Farm Finances. May, 2017
 2016 Report on Minnesota Farm Finances May, 2017 Acknowledgements: Contributing Minnesota producers Minnesota Farm Business Management Education, Minnesota State Southwestern Minnesota Farm Business Management
TIMELY INFORMATION. DAERS 08-4 August Making Adjustments To The Cattle Herd Due To Higher Production Costs
 AG ECONOMIC SERIES TIMELY INFORMATION Agriculture & Natural Resources DAERS 08-4 August 2008 Making Adjustments To The Cattle Herd Due To Higher Production Costs J. Walter Prevatt, Ph.D. Auburn University
JUNE 2005 E.B NEW YORK LARGE HERD FARMS, 300 COWS OR LARGER 2004 SUMMARY DAIRY FARM
 JUNE 2005 E.B. 2005-05 DAIRY FARM BUSINESS SUMMARY BUSINESS SUMMARY NEW YORK LARGE HERD FARMS, 300 COWS OR LARGER 2004 Jason Karszes Wayne A. Knoblauch Linda D. Putnam Department of Applied Economics and
This guide examines the financial feasibility of
 AGRICULTURE Starting a 600-Cow Intensive Rotational Grazing Dairy This guide examines the financial feasibility of starting a 600-cow intensive rotational grazing dairy in Missouri. The model dairy described
2016 ANNUAL REPORT State Averages North Dakota Farm and Ranch Business Management Education
 2016 ANNUAL REPORT State Averages North Dakota Farm and Ranch Business Management Education www.ndfarmmanagement.com North Dakota Department of Career and Technical Education Mr. Wayne Kutzer, State Director
Economic, Productive & Financial Performance Of Alberta Cow/Calf Operations
 Benchmarks for Cattlemen Economics & Competitiveness Economic, Productive & Financial Performance Of Cow/Calf Operations Southern Fescue land, Mixed land & Moist Mixed land Production Year - 2002 Jan.
L Kansas State University (I. Department of Agricultural Economi<ii} FARM MANAGEMENT DATA BANK DOCUMENTATION LARRY N. LANGEMEIER--
 FARM MANAGEMENT DATA BANK DOCUMENTATION LARRY N. LANGEMEIER-- April 1990 No. 90-10 Department of Agricultural Economi
Kentucky Farm Business Management Program. Annual Summary Data
 Kentucky Farm Business Management Program Annual Summary Data 2010 Agricultural Economics - Extension No. 2011-14 June 2011 By: KFBM Specialists See page 7 University of Kentucky Department of Agricultural
Benchmarking Your Herd s Economic Facts
 Managing for Today s Cattle Market and Beyond March 2002 Benchmarking s Economic Facts By Harlan Hughes, North Dakota State University Dwight Aakre, North Dakota State University Introduction Benchmarking
~_~~. oradillla) ~SdeIaee.. New York sw..coiejeefapicuiture aad ljfesdeaees.. :A$tatlitoryColiepof the State Uaivenity CoraeD Ullivenity, Ithaca, New
 ~SdeIaee.. New York sw..coiejeefapicuiture aad ljfesdeaees.. :A$tatlitoryColiepof the State Uaivenity CoraeD Ullivenity, Ithaca, New") I i ~_~~. oradillla) ~SdeIaee.. New York sw..coiejeefapicuiture aad ljfesdeaees.. :A$tatlitoryColiepof the State Uaivenity CoraeD Ullivenity, Ithaca, New York 14153 OVERVIEW NORTHEAST BEEF FARM BUSINESS
I i ~_~~. oradillla) ~SdeIaee.. New York sw..coiejeefapicuiture aad ljfesdeaees.. :A$tatlitoryColiepof the State Uaivenity CoraeD Ullivenity, Ithaca, New York 14153 OVERVIEW NORTHEAST BEEF FARM BUSINESS
Breaking Barriers for Beginning Farmers and Ranchers (NIFA-USDA # )
") Breaking Barriers for Beginning Farmers and Ranchers (NIFA-USDA #2010-49400-21729) Introduction to Basic Farm Activities and Terminology Jose A., Ph.D. Assistant Professor of Agribusiness Department of
Breaking Barriers for Beginning Farmers and Ranchers (NIFA-USDA #2010-49400-21729) Introduction to Basic Farm Activities and Terminology Jose A., Ph.D. Assistant Professor of Agribusiness Department of
BUSINESS SUMMARY DAIRY FARM NEW YORK SMALL HERD FARMS, 80 COWS OR FEWER 2003 DECEMBER 2004 E.B
 DECEMBER 2004 E.B. 2004-21 DAIRY FARM BUSINESS SUMMARY NEW YORK SMALL HERD FARMS, 80 COWS OR FEWER 2003 Wayne A. Knoblauch Linda D. Putnam Mariane Kiraly Jason Karszes Department of Applied Economics and
 Grain Farm Income and Cash Rent Outlook: 2016 and 2017 Sep 7, 2016 Grain Farm Income and Cash Rent Outlook: 2016 and 2017 Budgets in management section of farmdoc Gary Schnitkey University of Illinois
Costs to Produce Milk in Illinois 2016
 Costs to Produce Milk in Illinois 2016 Costs to Produce Milk in Illinois 2016 University of Illinois Farm Business Management Resources FBM-0160 Brandy M. Krapf, Dwight D. Raab, and Bradley L. Zwilling