What are Farm Operations and how are they selected? T O T A L / A R M S I I I S C R E E N I N G A N D F A R M D E F I N I T I O N
|
|
|
- Sharleen Benson
- 5 years ago
- Views:
Transcription
1 What are Farm Operations and how are they selected? T O T A L / A R M S I I I S C R E E N I N G A N D F A R M D E F I N I T I O N
2 Farms Definition from the Oxford World Dictionary. Noun: An area of land and its buildings used for growing crops and rearing animals, typically the control of one owner or manager. Not terribly useful, especially for the United States Department of Agriculture.
3 Farms and Farm Operations The USDA and NASS define a farm operation very differently. Farm Operation: Any operation that makes or has the potential to make $1,000 in direct sales of agricultural products. Statistically, this is our population. It is a very inclusive definition. As long as the potential exists, you are a farm operation even if the respondent has never operated a farm or ranch.
4 Problems with an inclusive definitions. Sampling people that own a couple of farm animals as pets. Sampling people that have not been farming for years but still have the land. Sampling people that only have personal gardens for home use. Sampling people that have 4 horses and 20 acres of pasture.
5 Pros of having an inclusive definition. Capture smaller operations that do provide direct sales of agricultural products grains of sand is still a small pile of sand. Smaller farm operations and hobby farms are competing for the same resources (fertilizer, water, etc.) but are buying them at retail value, not wholesale.
6 Has NASS tried to change the definition? Short answer, yes. In the late 90s, as told by our previous NASS administrator, Joe Reilly. Obviously not successful. Why?
7 SCREENING The baseline for operations sampled for ARMS Phase III were as follow: Had or has the potential of generating $1,000 dollars in direct sales of agricultural products. Was in business in This was accomplished by two other surveys. ARMS Phase 1 Survey. June Area Survey
8 SCREENING What determines the potential for $1,000 dollars in direct sales of agriculture? Multiple factors. Land Use: Abandoned Crops, Cover Crops, Idle Cropland, Summer Fallow. Government Payments. Pasture and Rangeland. Field Crops such as Barley, Corn, Wheat. Hay Woodland Crops Many others.
9 SCREENING Each crop, land use, etc. has a number of points assigned to it per acre. 1 point = $1.00 of Gross Sales. This is why 4 Horses (200 points per horse) and 20 acres of Permanent Pasture (10 points an acre) constitutes a farm operation. (4 * 200) + (10 * 20) = = 1000 points. Potential to make $1,000 dollars in direct sales of agriculture.
10 Questions, Comments, Observations, Rants, or Diatribes?
11 SECTION A Roberto Sanchez 2016 ARMS Phase III Workshop Visalia, CA January 31 February 2, 2017
12 Section A Acres Operated Just acres, no money or other production units Item 1 to item 5 (page 2) Check none box if this item does not apply to this operation
 is less than item 0026 (total")
13 Section A Acres Operated Total acres = own land + land rented from others land rented to others Item 0063 (cropland) is less than item 0026 (total acres)
14 Section A rented from others You need to distribute the land rented from others in four categories: Fixed cash rent payment Flexible rent payment Share of the crop/livestock Free
15 Section A land rented from others Just money in dollars, no cents, acres or other production units Item 6 to item 12 (page 2) Check none box if this item does not apply to this operation

16 Section A land rented from others

17 Section A land rented to others
18 References to Section A in the 2016 Manual Item Page (manual) Item Page (manual) Item Page (manual) 1 38, (a to d) 38, 39, 40 7 (a to b) 43, , 40, 41 8 (a to b) , , , 42
19 Questions Roberto Sanchez
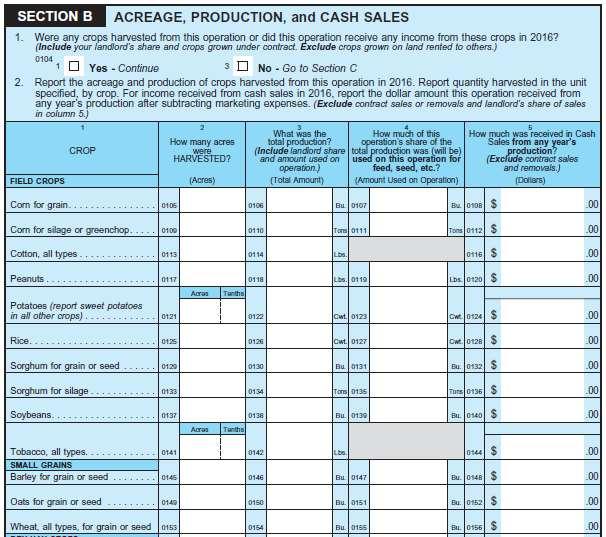
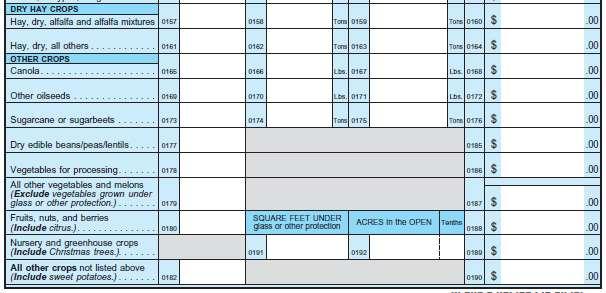
20 ARMS III Section B Jennifer Johnson 2016 ARMS Phase III Workshop Visalia, CA January 31 February 2, 2017
21
22
23
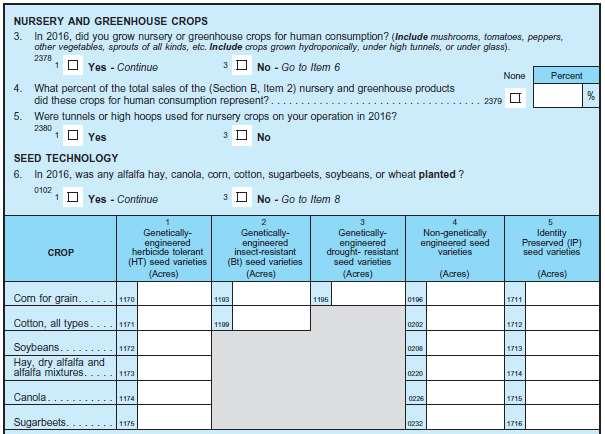
24 Seed Technology NASS reports on genetically engineered (GE) corn, cotton, and soybeans in Acreage. But herbicide-tolerant GE varieties are also used in alfalfa, canola, and sugarbeets. What s more, drought-tolerant GE varieties have been introduced for corn. We aim to track adoption with ARMS. Planted acres, not harvested acres as in item 2. Total planted acres of a crop may not be the sum of columns Why corn seed may be HT and Bt and drought-resistant, while cotton may be HT and Bt. For alfalfa, canola, and sugarbeets, columns 1 and 4 should add to all planted acres. IP seed varieties (col. 5) may be non-ge varieties kept separate and sold as such. That can also be GE versions of specialized varieties, such as high-oil corn, sold as IP. 24
25 An exercise Sally planted 500 acres of corn and 300 acres of soybeans last year. All of the soybeans were HT varieties, while 400 acres of the corn were HT, and half of those were also drought-tolerant. For the first time this year, Sally also planted 100 acres of non-ge corn, which would be marketed specifically as such, with identity preserved throughout the marketing chain. How should item 6 be filled out? 25
26 An exercise Sally planted 500 acres of corn and 300 acres of soybeans last year. All of the soybeans were HT varieties, while 400 acres of the corn were HT, and half of those were also drought-tolerant For the first time this year, Sally also planted 100 acres of non-ge corn, which would be marketed specifically as such, with identity preserved throughout the marketing chain. 300 How should item 6 be filled out?

27 Crop Insurance Has Shifted Away from Yield Coverage
28
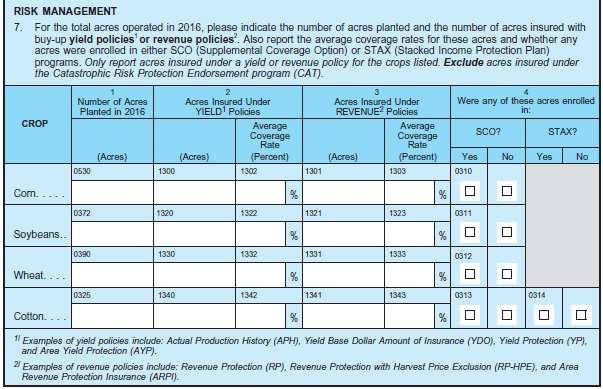
29 Crop Insurance Exercise 1 Pamela farms 400 acres of corn. She purchases a Revenue Protection with Harvest Price Exclusion (RP-HPE) policy with 70% coverage on 300 acres. She also enrolls half of her acreage in SCO. How should Pamela fill out question B.7?
30 Crop Insurance Exercise X Pamela farms 400 acres of corn. She purchases a Revenue Protection with Harvest Price Exclusion (RP-HPE) policy with 70% coverage on 300 acres. She also enrolls half of her acreage in SCO. How should Pamela fill out question B.7?
31 Crop Insurance Exercise 2 Andy plants 100 acres of soybeans and 100 acres of corn. He insures all 100 soybean acres with a CAT yield policy in 2016 and all 100 acres of corn with a 75% Revenue Protection policy. Further, he had enrolled all his corn and soybean acres in the ARC program, so could not enroll any of them in the SCO program. How should Andy fill out question B.7?
32 Crop Insurance Exercise X 100 X Andy plants 100 acres of soybeans and 100 acres of corn. He insures all 100 soybean acres with a CAT yield policy in 2016 and all 100 acres of corn with a 75% Revenue Protection policy. Further, he had enrolled all his corn and soybean acres in the ARC program, so could not enroll any of them in the SCO program. How should Andy fill out question B.7?
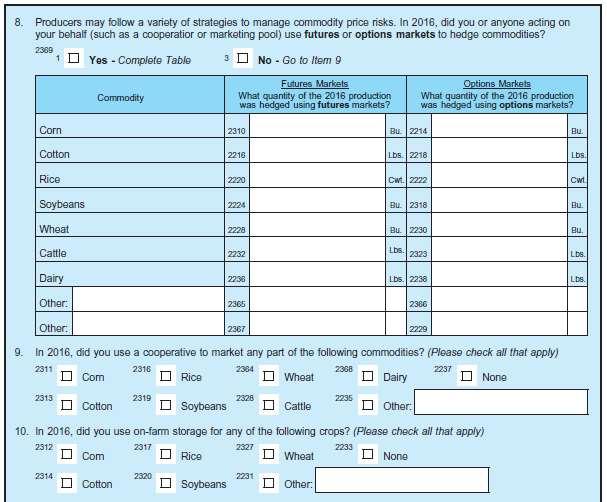
33 Risk Management: Items 8-10 Risk management strategies followed by farmers Hedging through exchange-traded derivatives--futures contracts and options (on futures). Use of cooperatives (who might in turn hedge through futures). Use of on-farm storage (to provide flexibility in sales). Use of marketing contracts (section E) Items 9 and 10 are straightforward If yes for any commodity, check box. If producer uses his/her own storage, located in town, and still owns the commodity, check as on-farm. Note: if not used for any commodity, check none.
34
35 Hedging Definitions Futures: Short positions in futures contracts mean that the farmer has entered into a contract to sell a specified quantity of the commodity (e.g., corn, whey, cattle, butter, etc.) at a specified price on a specified date. Long positions are contracts to buy that quantity. Short positions are usually (but not always) used for hedging, because they lock in a price Farmers usually close out a short position without actually delivering the physical commodity by taking the opposite (long) position close to the settlement date. Options: Put options give the holder the option of selling a futures contract at a given price. Call options give the holder the option of buying a futures contract at a given price.
36 Example of hedging with futures contracts: John intends to sell 20,000 bushels of corn in March, 2017, and he wants to lock in a price now, in November, He purchased 4 forward contracts (5,000 bushels each) for corn with a settlement date of March, 2017, on the Chicago Mercantile Exchange (CME) at a price of $3.55 a bushel. These contracts would be for the short position, contracting him to sell that quantity at the given price on the given settlement date. If John wants the price protection without the hassle of physical delivery, it is possible to close out the position by purchasing the offsetting position (long, contracting to buy corn) before the settlement date.
37 Two key points: Items 8-10 refer to production, not to input acquisition, such as a dairy farm or feedlot hedging on corn purchases. Most futures transactions are closed out without delivery, by taking a long position later. Avoid double-counting quantities, by adding quantities in the short and long positions: focus on the quantity of production that s hedged
38 Hedging Exercise 1 During 2016, Bob hedged some of his production through futures contracts (short position, agreeing to sell) on the CME. He took positions in 5 corn futures contracts (5,000 bushels each) and 4 mini-corn futures contracts (1,000 bushels each). How should 8 be answered?
39 Hedging Exercise 1 29,000 During 2016, Bob hedged some of his production through futures contracts (short position, agreeing to sell) on the CME. He took positions in 5 corn futures contracts (5,000 bushels each) and 4 mini-corn futures contracts (1,000 bushels each). How should 8 be answered? Answer: 29,000 bushels ((5 x 5,000) + (4 x 1,000))
40 Hedging Exercise 1a 29,000 Bob later exited his position by taking the opposite (long) position before the settlement date. How should 8 be answered? Answer: 29,000 bushels If Bob exited his position before the settlement date by taking the opposite position (long) before the settlement date, do not count long position in the total. (Not used for hedging)
41 Hedging Exercise 2 Joe has also hedged his milk production through trading futures contracts on the CME with: 10 dry whey futures contracts (44,000 lbs each) 10 Class III milk futures contracts (200,000 lbs each) 20 cash-settled butter futures contracts (20,000 lbs each). How should 8 be answered?
42 Hedging Exercise 2 2,840,000 Joe has also hedged his milk production through trading futures contracts on the CME with: 10 dry whey futures contracts (44,000 lbs each) 10 Class III milk futures contracts (200,000 lbs each) 20 cash-settled butter futures contracts (20,000 lbs each). How should 8 be answered? Answer: 2,840,000 lbs ((10 x 44,000) + (10 x 200,000) + (20 x 20,000))
43 Hedging Exercise 3 Agricultural options are based on futures contracts the option to buy or sell futures contracts at a specified price on or before a specified date. Follow the previous examples and record the quantity of production underlying the contracts. If Ned hedged his production by buying a put option (option to sell a futures contract at a specified price) on 10 futures contracts for live cattle at 40,000 lbs per contract, how should question 8 be answered?
44 Agricultural options are based on futures contracts the option to buy or sell futures contracts at a specified price on or before a specified date. Follow the previous examples and record the quantity of production underlying the contracts. If Ned hedged his production by buying a put option (option to sell a futures contract at a specified price) on 10 futures contracts for live cattle at 40,000 lbs per contract, how should question 8 be answered? Answer: 400,000 lbs of cattle Hedging Exercise 3 400,000
45 If respondent has used futures or options markets for commodities not included in this group Write in the commodity name in the blank space next to Other Enter the quantity hedged as shown in the previous examples
46 Hedging Exercise 4 Bill hedged some of his production through futures contracts on the CME. He took positions in 10 lean hogs futures contracts, at 40,000 lbs per contract (400,000 lbs total). How should question 8 be answered?
47 Hedging Exercise 4 Lean Hogs 400,000 lbs Bill hedged some of his production through futures contracts on the CME. He took positions in 10 lean hogs futures contracts, at 40,000 lbs per contract (400,000 lbs total). How should question 8 be answered? Answer: See table. Remember to enter the units.
48 Hedging Maybe 10 % of respondents Less than 10 % of respondents
49 Land Use Practices Items Cover crops, double cropping, and conservation tillage affect farm finances and USDA conservation goals. Cover crops are growing due to Federal & state incentive programs, improving seed availability, & growing interest in soil health. We aim to track where and why cover crops are expanding. Double cropping (eg, soybeans and winter wheat) varies with weather and commodity prices. Tracking helps USDA understand links between acreage and cropland.

50 Land Use Practices Items 11-13

51 Land Use Practices Item 13 Conservation tillage helps build soil health and reduce nutrient losses. It s an important target of conservation policy, but adoption varies over time and across regions. No-till: seeds planted directly through residue. Strip-till: discs open a narrow planting strip; little soil disturbance. Others include ridge and mulch till. Conservation tillage leaves at least 30% of crop residue at planting. Note continued focus on planted acres (except 11b).
52 Land Use Practices Exercise Stan and Bobbi farm 1800 acres of corn, soybeans, and wheat. In 2016, they planted 300 acres of corn and 200 acres of soybeans using no-till techniques, while also planting another 300 acres of corn using ridge-till. They have been trying cover crops, and last year planted 750 acres to a mix of clover, ryegrass, and radishes.
53 Land Use Practices Exercise X Stan and Bobbi farm 1800 acres of corn, soybeans, and wheat. In 2016, they planted 300 acres of corn and 200 acres of soybeans using no-till techniques, while also planting another 300 acres of corn using ridge-till. They have been trying cover crops, and last year planted 750 acres to a mix of clover, ryegrass, and radishes.
54 QUESTIONS??
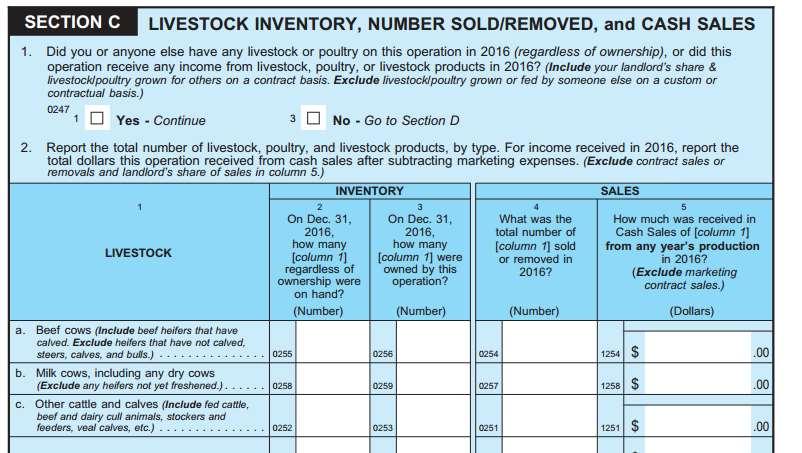
55 SECTION C Livestock Inventory, Number Sold/Removed, and Cash Sales Roberto Sanchez
56 Section C

57 Section C item 2, column 2 Report the animals in the operation on December 31 (physically present) total number on hand Animals owned by this operation under feed or grow contracts with other operations will be reported in Section D Reference in the manual: page 59

58 Section C item 2, column 3 Report animals owned by the operation on December 31, 2016 total number on hand column 3 should be equal to or less than column 2 Reference in the manual: page 59 (at the bottom of the page)

59 Section C item 2, column 4 Report animals sold or removed by this operation in 2016, that includes the next categories from January 1 st to December 31 st : Sold on the open market Delivered under a marketing contract Removed under production contract
60 Section C item 2, column 4 Exclude these animals from column 4 (this list is in page 60 in the manual): Deaths Animals that were moved from this operation for: For short term grazing on corn or small grain stubble and then returned For the summer to public grazing land and then returned to this operation For the summer to private or grazing association land and then returned to this operation References in the manual: Page 60
61 Section C item 2, column 5 First, you need to abstract the marketing expense, such as: Check-off, Drying, Commission, Inspection, Storage, Transportation, Yardage, etc. Section I contains more information about the marketing expense (page 91 in the manual)
62 Section C item 2, column 5 Second, report all sales received from beef cows, milk cows, etc (just dollar, no cents). Exclude marketing and production contract, landlord share, trading/speculation, land rented to others, and amount received for livestock sold in prior years. References in the manual: page 60 Special instructions by commodity: Pages 61 to 65
63 Questions Roberto Sanchez
64 SECTION D Other Operations Growing, Feeding or Raising Livestock for this Operation

65 Section D item 1 For column 2 use the livestock code from the Respondent Booklet For column 1 write the name of the livestock or poultry
66 Section D Report all kind of commodity for growing, feeding or raising in other operations (farms), include: Commodities that were placed on contracted operations prior to January 1 were still under contract on January 1, Avoid double accounting for the livestock production quantities, sales, or expenditures/fees Review the example of the page 66 at the manual
 Use dollars, no cents make sure this value is not recorded in Section J (farm assets)")
67 Section D column 3 Report the estimated market value of commodities on hand on January 1 st (one commodity per line) Use dollars, no cents make sure this value is not recorded in Section J (farm assets) Reference in the manual: page 67
 Use the value at the time the commodity was placed Use dollars, no cents Reference in the")
68 Section D column 4 Report the estimated market value of commodities was placed for the entire year 2016 (one commodity per line) Use the value at the time the commodity was placed Use dollars, no cents Reference in the manual: page 67
69 Section D column 5 Report the sum of the fees/expenses paid to the contractees related to (one commodity per line): Labor Management Reimbursements Use dollars, no cents make sure this value is not recorded in Section I (expenses) Reference in the manual: page 67
or E (marketing contracts) item will be zero for all replacement animals Reference in the manual: page")
70 Section D column 6 Report the income produced as a result from growing, feeding, or raising in other operation (gross income), don t extract any quantity of money Use dollars, no cents make sure this value is not recorded in Sections C (livestock)or E (marketing contracts) item will be zero for all replacement animals Reference in the manual: page 67
 Reference in the manual:")
71 Section D column 7 Report the estimated market value of the remaining (unsold) livestock/poultry Use dollars, no cents make sure this value is not recorded in Section J (farm assets) Reference in the manual: page 67
72 Questions Roberto Sanchez
73 SECTION E Marketing Contracts
74 Section E Review the information and examples about contracts in pages 68 to 74 in the 2016 manual
75 Section E What is a marketing contract? The marketing contract is an agreement between two parts (contractor and contractee) before completion of the production cycle, that include: price determination and transfer condition of the commodities produced. The operator is the owner of the commodity until the delivery.
76 Section E item 2 For column 2 use the livestock code from the Respondent Booklet For column 1 write the name of the commodity
 Exclude: landlord share References in the manual:")
77 Section E item 2, column 3 Report all quantity of production delivered in each contract (one contract per line) Exclude: landlord share References in the manual: page 75
 Pounds Bushels Tons References in the manual: page")
78 Section E item 2, column 4 Report the correct unit that is used in the contract (this unit is in the bottom of the page 7 of the questionnaire) Pounds Bushels Tons References in the manual: page 75

79 Section E item 2, column 5 Report the price per unit related to each marketing contract (one line per contract) Example: $2000 per head Use dollars and cents be sure the unit for the price reported agrees with the unit for the quantity reported Reference in the manual: page 75

80 Section E item 2, column 6 Report the total sum of the income for 2016 Avoid the double accounting for the previous year income be sure any marketing charges related to sales under the contract are subtracted out and recorded in Section I, item 33. Reference in the manual: page 75
81 Section E - item 2, math op Column 3 x Column 5 = Column 6 (Quantity produced) x (price per unit) = amount received Important notes: You need to verify the result in column 6 (make sense) Example (hypothetical): If you have a farm with 1,000 beef cows Column 3 = 1,000 Column 5 = $1,000/ head Column 6 = $20,000,000, is this correct?

82 Section E item 2, math op Is the number in column 6 correct?
83 Questions Roberto Sanchez
84 SECTION F PRODUCTION CONTRACTS AND CUSTOM FED LIVESTOCK
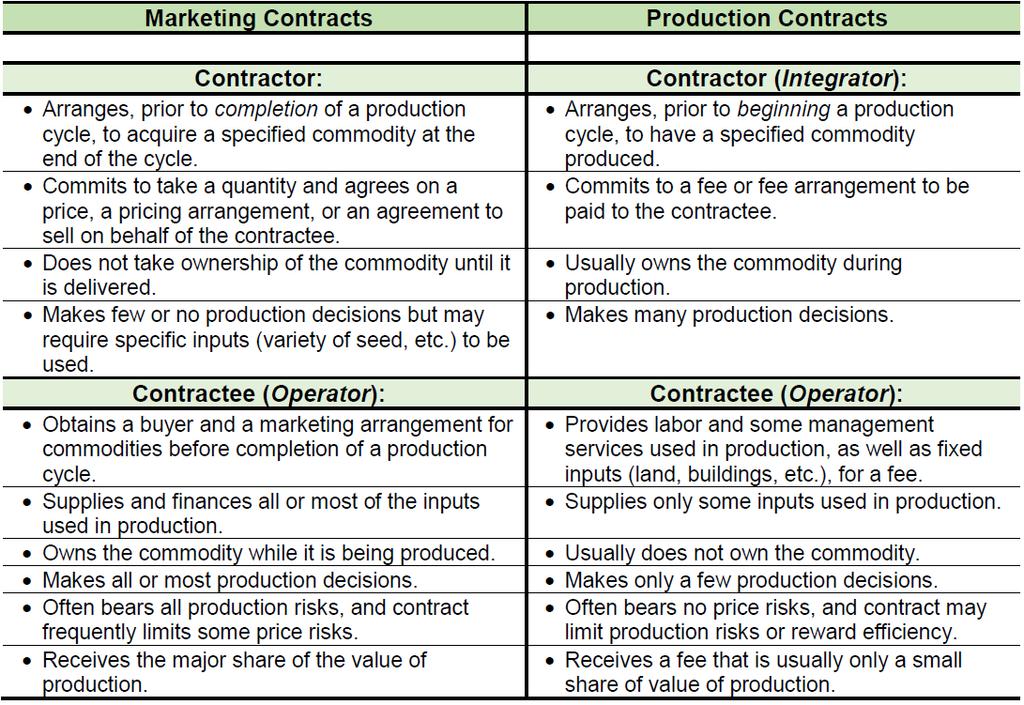
85 SECTION F DEFINING CONTRACTS A Brief Review The ARMS survey has two different contracts by definition. 1. MARKETING CONTRACTS. 2. PRODUCTION CONTRACTS.
86 MARKETING CONTRACTS FROM SECTION E Marketing Contracts Identify an outlet for a commodity and set pricing and delivery. Operator (Contractee) assumes most of the financial risk. Common for crops but also used for livestock or livestock production. Operator owns the commodity at the start and is selling or will sell a finished product. Interviewers Manual Page 69
87 MARKETING CONTRACTS FROM SECTION E Marketing Contracts Operator (Contractee) owns the commodity from the starts. Is trying to sell the commodity. Example: Cattle Operator owns 100 Beef Cows. Negotiates to sell 50 Beef Cows to a slaughter house.
88 SECTION F PRODUCTION CONTRACTS Production Contracts Covers the entire production cycle. Usually, this means the CONTRACTOR (operation purchasing the goods) own the goods at the beginning. Contracts specify responsibilities for the provision and payment of expenses by different parties. Set terms for compensation, production practices, and removal from the operation. Contractor assumes most of the risk. Interviewers Manual Page 69
89 SECTION F PRODUCTION CONTRACTS Production Contracts Replacement Heifers being grown and fattened at on operation but not owned by the operator. Some kind of timely fee is paid during the duration the heifer are being grown and fattened. Input as to what kind of feed is being fed. And agreed upon date when the heifers physical custody is taken by the contractor.
90 SECTION F PRODUCTION CONTRACTS A General Rule of Thumb: If you re confused as to what kind of contract the operator has, ask this question: Who owned the commodity at the beginning of the commodity s life cycle?
91 IM Pg. 70

92 REMEMBER! SECTION F PRODUCTION CONTRACTS QUESTIONNAIRE PAGE 8
93 QUESTIONNAIRE PAGE 8 SECTION F PRODUCTION CONTRACTS

94 QUESTIONS, COMMENTS, OBSERVATIONS, RANTS, OR DIATRIBES
95 SECTION G ACCOUNTS RECEIVABLE AND DEFFERED PAYMENTS
96 INTERVIEWERS MANUAL PAGE 80 SECTION G Deferred payments: Payment received for commodities technically sold in a prior year. Farm operations usually do not receive cash payment for services provided/commodities sold in the same calendar year. Why? Income Tax Management Strategy. Price is not final until next calendar year. For this survey before January 1, 2016.

97 SECTION G QUESTIONNAIRE PAGE 8 DO NOT CONFUSE CASH SALES OF COMMODITIES HELD IN STORAGE. DO NOT INCLUDE MARKETING EXPENSES AND REIMBURSEMENT FOR EXPENSES.

98 QUESTIONS, COMMENTS, OBSERVATIONS, RANTS, OR DIATRIBES
99 SECTION H GOVERNMENT PAYMENTS & OTHER FARM RELATED INCOME

100 SECTION H GOVERNMENT PAYMENTS & OTHER FARM RELATED INCOME Be mindful of the skips. QUESTIONNAIRE PAGE 9

101 SECTION H LOANS & PROGRAMS QUESTIONNAIRE PAGE 9

102 SECTION H PROGRAMS QUESTIONNAIRE PAGE 9

103 SECTION H OTHER FARM RELATED INCOME QUESTIONNAIRE PAGE 10

104 SECTION H OTHER FARM RELATED INCOME QUESTIONNAIRE PAGE 10
105 SECTION H OTHER FARM RELATED INCOME QUESTIONNAIRE PAGE 10

106 QUESTIONS, COMMENTS, OBSERVATIONS, RANTS, OR DIATRIBES
107 ARMS III Section I: OPERATING AND CAPITAL EXPENDITURES Jennifer Johnson 2016 ARMS Phase III Workshop Visalia, CA January 31 February 2, 2017
108 OPERATING EXPENSES Expenses paid for by the operation during Calendar Year Expenditures for inputs that are normally used up during the year purchased. MAJOR EXPENSES: Feed Livestock purchases Farm Services Labor Rent Fertilizer Chemicals Seeds Fuels Taxes 108
109 OPERATING EXPENSES Expense data is collected in great detail. Ensures that no data will be omitted, particularly items not typically found in record books. More detailed questions elicit greater detailed answers. ERS publishes more detailed expenses in value-added and farm production expense reports, e.g., Farm Services contains 10 expenses used individually by ERS. Interviewer's Manual has a detailed list of what to include and exclude for each item. 109
110 EXPENSES NOT LOCATED IN SECTION I Gross rent components Cash rent: Section A Share rent: Section A Landlord s share of crops, livestock, and government payments Grazing fees: Section A Livestock contract production fees TOTAL FEES RECEIVED in 2016, Section F, Item 2, final column 110
111 QUESTIONS MOVED, RE-PHRASED OR NEW Marketing and storage expenses, Section I, Item 33 Used to be in the commodity section Almost all operations that sell commodities have marketing expenses. Get total quantity and unit sold if operator doesn't know the total marketing charges. If missing, editor should add up the commodity specific charges from income Item 5 Leasing of livestock (include bees, bulls and dairy cattle) Item 11 Purchased water for irrigation from off-farm suppliers.(including irrigation assessments and fees) Item 17(b) Include $100 participation fee for Margin Protection Program for Dairy 111
112 Landlord & Contractor Questions Collect expenses paid by: Operator(s), Landlord(s), and Contractor(s). Most operating expenses have three cells. Landlord Expenses emphasized because ERS calculates Net rent to nonoperator landlords. Net rent equals Landlord income less Landlord expenses Contractor Expenses Ask whether operator knows contractor expenses. May know if given a settlement sheet by contractor. If unknown, leave blank and the Regional Office will impute 112
113 Wage Treatment for Individuals and Partnerships Operators organized as individuals or as partnerships do not receive income in the form of wages Instead of wages, they receive the net income generated by the operation 113
114 Wage Treatment for Corporations and Other Operators organized as a corporation or as Other (Trust, Estate) Operator can receive wages since they are an employee of the corporation or trust 114
115 CAPITAL EXPENDITURES 115
116 CAPITAL EXPENDITURES 116
117 CAPITAL EXPENDITURES 117
118 CAPITAL EXPENDITURES 118
119 CAPITAL EXPENDITURES 119
120 CAPITAL EXPENDITURES 120
121 CAPITAL EXPENDITURES Purchases with multiple year life Placed on operator s depreciation schedule Listed on the operator s Assets page 121
122 Why Do We Collect Capital Expenses? Early indicator of financial stress in operation Weights for NASS Prices Paid Indexes ERS publishes capital expenditures in more detail than in the Farm Production Expenditures publication 122
123 QUESTIONS?? 123
124 ARMS III Sections J & K: Assets & Debt 124
125 Overview Section J: Farm Assets Overview of questionnaire No changes from 2015 Section K: Farm Debt Overview of questions 1-5 New column added to debt table: question 3, column 3. No research questions in
126 Overview Why so much detail on a sensitive subject? A complete and accurate financial picture of the agricultural sector requires wealth measurement via the balance sheet. Getting component detail ensures accuracy Provides more detailed picture of the sector balance sheet s strengths and weaknesses Many of the current financial concerns about agriculture involve asset (land values) and debt repayment. 126

127 Section J 127

128 Section J 128
129 Section K Question 3 known as the farm debt table is used to gather information on the loans outstanding as of the end of the year. Like last year, we are interested in gathering as much information as possible in this section in the event farmer s aren t willing to provide all the information. We added a note to column 5 to make sure that the year the loan was obtained refers to the refinanced year if it was refinanced. This note applies to question 6 as well. As a reminder column 7 is used to exclude any debt that was for non-farm use. We use the lender codes in the farm sector accounts to make sure debt is associated with the correct lender group. 129

130 Section K 130
131 QUESTIONS?? 131
132 ARMS III Section L: Farm Labor and Management 132

133 Section L 133
134 Family Farm Question Considerations ASSETS are the key object that can be split up, not equity, debt, income, profits or measures Potential owners include friends, associates, partners, corporate shareholders, members of an LLC They do not include landlords, contractors, or banks Consider a crop farm. If the family rents in 60% of farm acres and equipment and owns a two-thirds share of the remaining 40% of assets used by the operation, is the operation a family farm? 134
135 Operation Organization Legal Status for tax purposes Family operation no partners and no shareholders Could be an LLC Legal partnership two or more people Not landlord-tenant C-Corporation Limited liability (could be single-owner LLC) Pay income tax separately from owners S-Corporation (small business corp.) Taxed as a partnership or sole-proprietor Other (estate, trust, co-op, etc.) Q4: Any category may be organized as an LLC under state law 135

136 Section L 136
137 Number of Operators Q7: Number of operators. Who are operators? People involved in the day to day decisions excluding hired workers unless they are a hired manager or a family member A nonrefusable question; key aspect of operation; used to edit other items. Q8 is there a spouse; Q9 are they making day-to-day decisions? If a spouse is an operator (Q9), data for that individual are reported in the second column in Q10 Operator Characteristics Year in which operator began to operate ANY farm 137
138 Hired Workers Revised questions (asked first in 2015 ARMS) Q12 - Report the average number of full-time paid hired workers in paid/unpaid categories NOT operators Not making day-to-day decisions on the farm or ranch Exclude custom hire and contract labor Could be full-time or part-time workers IMPORTANT: Full-time means 30 hours/week 138
139 Hired Workers Brian employs 4 workers year round on his vineyard. They work 40 hours a week, every week, except September when they work 50 hours a week. How would Brian complete question 12? 139
140 Hired Workers Brian employs 4 workers year round on his vineyard. They work 40 hours a week, every week, except September when they work 50 hours a week. How would Brian complete question 12? 140
141 Part-time Workers Report the TOTAL NUMBER OF HOUR worked EACH WEEK by ALL PART-TIME workers during each three month period? Part time = less than 30 hours/week Still exclude custom hire, contract labor, and unpaid workers Reason? Part of who is required to provide health insurance under the Affordable Care Act (ACA) 141
142 Part-time Workers Brian employs 10 extra workers on his vineyard in September and October. They work 50 hours a week. How would Brian complete question 13? 142
143 Part-time Workers Brian employs 10 extra workers on his vineyard in September and October. They work 50 hours a week. How would Brian complete question 13? ANSWER: For September: [((4 x 50)/ 13) = 15] x 10 = 150 For October: [((4 x 50)/ 13) = 15] x 10 =
144 Direct Marketing (Local Foods) Direct marketing/local foods defined by the marketing channel Q15: For human consumption AND sold directly to (a) individuals, (b) retail outlets, or (c) institutions Exclude non-edible products or processed products Exclude sales to local businesses who resell across the country Q16: Sales of crops, livestock to 5 different outlets (exclude sales via production contracts) 144
")
145 Direct Marketing (Local Foods) 145

146 QUESTIONS?? 146
147 SECTION M Farm Operator & Household Characteristics Roberto Sanchez

148 Section M References in the manual: page 147

149 Section M References in the manual: page 147 to 148
150 Reminders Use pencil #2 in the entire questionnaire Check yes or no in the screening question at the beginning of each table (example: Section D, item 1) in the fence rule is applied to the criteria of Section D and Section E
151 Questions Roberto Sanchez
152 SECTION N FARM OPERATOR HOUSEHOLD INCOME, ASSETS,& DEBT
153 SECTION N The Reality when Enumerating By this point, the respondent is fatigued. We are on page 22 and it takes us to the end. Though, with another unnamed survey, we d only be at the halfway point. And we are asking household financial information. At this point, the urge for the respondent to end the survey is strong.
154 SECTION N Why It Is Important We need a complete picture on the economic well-being of farmer operators. We cannot get this without knowing what other assets operators have. ARMS Phase III is the ONLY survey that measures poverty for the farm operator population. The vast majority of farms are run by households (98.7%). This information is used to inform policy design and implement better laws regarding farmers and farm households. To meet Congressional and Executive Mandates.
155 SECTION N The Historical Trend Atlantic South Midwest Plains West Graphs by NASS production region Year
156 SECTION N What to Include and Exclude Include The Principal Operator All other members of the operator s household (i.e. physically living on the operator s property). Any income earned by the aforementioned. Exclude Landlord s share. Other partners in a partnership that DO NOT live in the same house as the operator. If no spouse was reported, leave that blank. INTERVIEWERS MANUAL PAGES
157 SECTION N The Value Codes Specific details of every question are in your Interviewers Manual, pages QUESTIONNAIRE PAGE 22
158 SECTION N FARM OPERATOR HOUSEHOLD INCOME, ASSETS, & DEBT QUESTIONNAIRE PAGE 22 Report only if there is a spouse that earned income.
159 SECTION N FARM OPERATOR HOUSEHOLD INCOME, ASSETS, & DEBT A VERY IMPORTANT DO NOT DO QUESTIONNAIRE PAGE 22
160 SECTION N Why? Even if you added the maximum values of each category, it would not fall in the range of the calculated value code. Value Codes: = 05 For example: = 1498 QUESTIONNAIRE PAGE 22

161 SECTION N FARM OPERATOR HOUSEHOLD INCOME, ASSETS, & DEBT QUESTIONNAIRE PAGE 22

162 SECTION N FARM OPERATOR HOUSEHOLD INCOME, ASSETS, & DEBT QUESTIONNAIRE PAGE 23

163 SECTION N FARM OPERATOR HOUSEHOLD INCOME, ASSETS, & DEBT

164 SECTION N FARM OPERATOR HOUSEHOLD INCOME, ASSETS, & DEBT QUESTIONNAIRE PAGE 23

165 SECTION N FARM OPERATOR HOUSEHOLD INCOME, ASSETS, & DEBT QUESTIONNAIRE PAGE 24

166 QUESTIONS, COMMENTS, OBSERVATIONS, RANTS, OR DIATRIBES
Welcome to the Eastern Mountain Region ARMS III Workshop
 Welcome to the Eastern Mountain Region ARMS III Workshop 1 Cell Phone Reminder Please turn off OR place your cell phone on vibrate. 2 Welcome & Introductions Mike Meek 3 NASDA REMARKS Martha Van Dale NASDA
2012 STATE FFA FARM BUSINESS MANAGEMENT TEST PART 2. Financial Statements (FINPACK Balance Sheets found in the resource information)
") 2012 STATE FFA FARM BUSINESS MANAGEMENT TEST PART 2 Financial Statements (FINPACK Balance Sheets found in the resource information) Please use the Market Value when making the calculations for the Zimmerman
2012 STATE FFA FARM BUSINESS MANAGEMENT TEST PART 2 Financial Statements (FINPACK Balance Sheets found in the resource information) Please use the Market Value when making the calculations for the Zimmerman
2011 STATE FFA FARM BUSINESS MANAGEMENT TEST PART 2. Financial Statements (FINPACK Balance Sheets found in the resource information)
") 2011 STATE FFA FARM BUSINESS MANAGEMENT TEST PART 2 Financial Statements (FINPACK Balance Sheets found in the resource information) Please use the Market Value when making the calculations for the Zimmerman
2011 STATE FFA FARM BUSINESS MANAGEMENT TEST PART 2 Financial Statements (FINPACK Balance Sheets found in the resource information) Please use the Market Value when making the calculations for the Zimmerman
Appendix I Whole Farm Analysis Procedures and Measures
 Appendix I Whole Farm Analysis Procedures and Measures The whole-farm reports (except for the balance sheets) include the same number of farms, which were all of the farms whose records were judged to
Martin and Peg Smith Case
 Martin and Peg Smith Case Introduction The end of another year was quickly approaching. As was typical at this time of the year, Martin and Peg were gathering financial information for their mid-november
2014 Michigan Dairy Farm Business Analysis Summary. Eric Wittenberg And Christopher Wolf. Staff Paper December, 2015
 2014 Michigan Dairy Farm Business Analysis Summary Eric Wittenberg And Christopher Wolf Staff Paper 2015-08 December, 2015 Department of Agricultural, Food, and Resource Economics MICHIGAN STATE UNIVERSITY
2011 Michigan Cash Grain Farm Business Analysis Summary. Eric Wittenberg And Christopher A. Wolf. Staff Paper October, 2012
 2011 Michigan Cash Grain Farm Business Analysis Summary Eric Wittenberg And Christopher A. Wolf Staff Paper 2012-09 October, 2012 Department of Agricultural, Food, and Resource Economics MICHIGAN STATE
Economics 330 Fall 2005 Exam 1. Strategic Planning and Budgeting
 Economics 330 Fall 2005 Exam 1 K E Y Strategic Planning and Budgeting Circle the letter of the best answer. You may put a square around the letter of your second choice. If your second choice is right,
Managing For Today s Cattle Market And Beyond: A Comparative Analysis Of ND - Demo Cow Herd To North Dakota Database
 Managing For Today s Cattle Market And Beyond: A Comparative Analysis Of ND - Demo - 160 Cow Herd To North Dakota Database By Harlan Hughes Extension Livestock Economist Dept of Agricultural Economics
2015 Michigan Dairy Farm Business Analysis Summary. Eric Wittenberg And Christopher Wolf. Staff Paper November, 2016
 2015 Michigan Dairy Farm Business Analysis Summary Eric Wittenberg And Christopher Wolf Staff Paper 2016-01 November, 2016 Department of Agricultural, Food, and Resource Economics MICHIGAN STATE UNIVERSITY
2009 Michigan Dairy Farm Business Analysis Summary. Eric Wittenberg And Christopher Wolf. Staff Paper December, 2010
 2009 Michigan Dairy Farm Business Analysis Summary Eric Wittenberg And Christopher Wolf Staff Paper 2010-04 December, 2010 Department of Agricultural, Food, and Resource Economics MICHIGAN STATE UNIVERSITY
2014 Michigan Cash Grain Farm Business Analysis Summary. Eric Wittenberg And Christopher A. Wolf. Staff Paper December, 2015
 2014 Michigan Cash Grain Farm Business Analysis Summary Eric Wittenberg And Christopher A. Wolf Staff Paper 2015-07 December, 2015 Department of Agricultural, Food, and Resource Economics MICHIGAN STATE
2007 Michigan Dairy Farm Business Analysis Summary. Eric Wittenberg And Christopher Wolf. Staff Paper December, 2008
 2007 Michigan Dairy Farm Business Analysis Summary Eric Wittenberg And Christopher Wolf Staff Paper 2008-04 December, 2008 Department of Agricultural, Food, and Resource Economics MICHIGAN STATE UNIVERSITY
2008 Michigan Cash Grain Farm Business Analysis Summary. Eric Wittenberg And Stephen Harsh. Staff Paper November, 2009
 2008 Michigan Cash Grain Farm Business Analysis Summary Eric Wittenberg And Stephen Harsh Staff Paper 2009-11 November, 2009 Department of Agricultural, Food, and Resource Economics MICHIGAN STATE UNIVERSITY
2004 Michigan Dairy Farm Business Analysis Summary. Eric Wittenberg Christopher Wolf. Staff Paper September 2005
 Staff Paper 2004 Michigan Dairy Farm Business Analysis Summary Eric Wittenberg Christopher Wolf Staff Paper 2005-10 September 2005 Department of Agricultural Economics MICHIGAN STATE UNIVERSITY East Lansing,
NEBRASKA FFA FARM MANAGEMENT CAREER DEVELOPMENT CONTEST 2016 Farm Business Management Practice Contest Examination
 NEBRASKA FFA FARM MANAGEMENT CAREER DEVELOPMENT CONTEST 2016 Farm Business Management Practice Contest Examination 1. A farm business operation which is highly financially leveraged is best described as
Managing For Today s Cattle Market And Beyond A Comparative Analysis Of Demo Herd 1997 Herd To McKenzie County Database
 Managing For Today s Cattle Market And Beyond A Comparative Analysis Of Demo Herd 1997 Herd To McKenzie County Database By Harlan Hughes Extension Livestock Economist Dept of Agricultural Economics North
2015 Michigan Cash Grain Farm Business Analysis Summary. Eric Wittenberg And Christopher A. Wolf. Staff Paper November, 2016
 2015 Michigan Cash Grain Farm Business Analysis Summary Eric Wittenberg And Christopher A. Wolf Staff Paper 2016-02 November, 2016 Department of Agricultural, Food, and Resource Economics MICHIGAN STATE
2007 Michigan Dairy Grazing Farm Business Analysis Summary. Eric Wittenberg And Christopher Wolf. Staff Paper December, 2008
 2007 Michigan Dairy Grazing Farm Business Analysis Summary Eric Wittenberg And Christopher Wolf Staff Paper 2008-5 December, 2008 Department of Agricultural, Food, and Resource Economics MICHIGAN STATE
U.S. DEPARTMENT OF AGRICULTURE ECONOMIC RESEARCH SERVICE August 1972 FCR-83 cooperating with New Mexico State University COSTS NOV
 U.S. DEPARTMENT OF AGRICULTURE ECONOMIC RESEARCH SERVICE August 1972 FCR-83 cooperating with New Mexico State University COSTS NOV 2 1872 and RETURNS FARM COSTS AND RETURNS STUDIES This report is part
Economic Research Service The USDA Commodity Costs and Returns (CAR) Estimation Project
 Estimation Project") Economic Research Service The USDA Commodity Costs and Returns (CAR) Estimation Project William D. McBride USDA, ERS Presented at FAO Expert Group Meeting November 28, 2011; Addis Ababa, Ethiopia Outline
Economic Research Service The USDA Commodity Costs and Returns (CAR) Estimation Project William D. McBride USDA, ERS Presented at FAO Expert Group Meeting November 28, 2011; Addis Ababa, Ethiopia Outline
2007 Michigan Cash Grain Farm Business Analysis Summary. Eric Wittenberg And Stephen Harsh. Staff Paper December, 2008
 2007 Michigan Cash Grain Farm Business Analysis Summary Eric Wittenberg And Stephen Harsh Staff Paper 2008-07 December, 2008 Department of Agricultural, Food, and Resource Economics MICHIGAN STATE UNIVERSITY
2006 Iowa Farm Costs. and Returns File C1-10. Ag Decision Maker. Definition of Terms Used
 2006 Iowa Farm Costs Ag Decision Maker and Returns File C1-10 The farm record data utilized in this report were obtained from the Iowa Farm Business Associations. The average of all farms in each table
A. Circle the best answer. Put a square around your second choice, if you want. If your second choice is correct you get half credit.
 Economics 330 Exam 1 Fall 2007 Farm Budgeting and Planning K E Y A. Circle the best answer. Put a square around your second choice, if you want. If your second choice is correct you get half credit. (4
2006 Michigan Dairy Grazing Farm Business Analysis Summary. Eric Wittenberg And Christopher Wolf. Staff Paper November, 2007
 2006 Michigan Dairy Grazing Farm Business Analysis Summary Eric Wittenberg And Christopher Wolf Staff Paper 2007-09 November, 2007 Department of Agricultural Economics MICHIGAN STATE UNIVERSITY East Lansing,
ARMS 3 Heartland Workshop. Day 2 Wednesday January 31, 2018
 ARMS 3 Heartland Workshop Day 2 Wednesday January 31, 2018 Sections 23-28 Section 23: Organic Agriculture Census Year Section! This section will be used for follow on organic surveys. Please make sure
Contribution of Federal Lands to Wyoming Range Livestock Production, 1992
 B-993 February 1994 0 Contribution of Federal Lands to Wyoming Range Livestock Production, 1992 Brett R. Moline Robert R. Fletcher David T. Taylor Gerald Fink Frank Henderson University of Wyoming, Cooperative
FARM BUSINESS MANAGEMENT
 FARM BUSINESS MANAGEMENT 2009 Annual Report Central and West Central Minnesota April, 2010 A Management Education Program Minnesota State Colleges and Universities Ridgewater College VISIT OUR WEBSITE
A Decade of Change in Texas Agriculture Highlights and Trends from the Census of Agriculture
 E-590 10/09 A Decade of Change in Texas Agriculture Highlights and Trends from the Census of Agriculture A Decade of Change in Texas Agriculture Highlights and Trends from the Census of Agriculture Authors
User Manual - Custom Finish Cattle Profit Projection
 User Manual - Custom Finish Cattle Profit Projection The purpose of this decision aid is to help facilitate the organization of custom finish cattle, feeder cattle price, costs and production data to project
Accounting for Agriculture
 International Journal of Recent Research and Review, Vol. II, June 2012 Accounting for Agriculture R. S. Sharma Department of ABST, Assistant Professor, University of Rajasthan, Jaipur, India Email: sharmarss1959@gmail.com
Focus. Panhandle Model Farms 2016 Case Studies of Texas. High Plains Agriculture. DeDe Jones Steven Klose
 FARM Assistance Focus Panhandle Model Farms 2016 Case Studies of Texas High Plains Agriculture DeDe Jones Steven Klose Farm Assistance Focus 2016-3 November 2016 Department of Agricultural Economics, Texas
FAPRI-UMC Report December 8, 2005
 FAPRI-UMC Report 17-05 December 8, 2005 FAPRI 2006 Outlook for Missouri Agriculture Food and Agricultural Policy Research Institute (FAPRI) College of Agriculture, Food and Natural Resources University
Planning Work & Interviewing ARMS Phase 3 Workshop January 2018
 Planning Work & Interviewing 2017 ARMS Phase 3 Workshop January 2018 Review the Survey Planning Work Know the ends / outs of the questionnaire Be prepared for a question know the survey purpose be familiar
Wisconsin Agricultural Economics Outlook Forum
 Wisconsin Agricultural Economics Outlook Forum January 21, 2015 Executive Summary Status of the Wisconsin Farm Economy This document was prepared by the Renk Agribusiness Institute in January, 2015. Wisconsin
Report on Minnesota Farm Finances. August, 2009
 2008 Report on Minnesota Farm Finances August, 2009 Acknowledgements: Contributing Minnesota producers Minnesota State Colleges and Universities Farm Business Management Education Program Southwestern
2016 Agricultural Resource Management Phase III. Great Lakes Region Indiana Michigan Ohio
 2016 Agricultural Resource Management Phase III Great Lakes Region Indiana Michigan Ohio What We Have Collected So Far A. Land in Farm B. Crop Acreage, Production & Cash Sales C. Livestock Inventory, Removed
MEASURING SCOPE EFFICIENCY FOR CROP AND BEEF FARMS. M. R. Langemeier 1 and R. D. Jones 1
 Beef Cattle Research 2006 MEASURING SCOPE EFFICIENCY FOR CROP AND BEEF FARMS M. R. Langemeier 1 and R. D. Jones 1 Summary This study evaluated scope efficiency (the degree of efficiency gained from producing
2018 ARMS Phase 2 Home Study Quiz
 2018 ARMS Phase 2 Home Study Quiz Enumerator Name: The following quiz relates directly to information needed to complete the 2018 ARMS Phase 2 PPCR/PPR questionnaire (s). Mark the box next to all correct
Cash Flow and Enterprise Information - step two for your 2016 farm analysis
 1 of 24 Name Address County Phone Email Year Born Year Started Farming Cash Flow and Enterprise Information - step two for your 2016 farm analysis Now that you have a beginning and an ending balance sheet,
2003 High Yielding Dairy Farms Compared By Profitability
 A UW-RIVER FALLS AGSTAR SCHOLARS REPORT 2003 High Yielding Dairy Farms Compared By Profitability By: Amber Horn-Leiterman 1 and Gregg Hadley 2 1 Amber Horn was a 2004 2005 UW-River Falls AgStar Scholar.
An Economic Comparison of Organic and Conventional Dairy Production, and Estimations on the Cost of Transitioning to Organic Production
 An Economic Comparison of Organic and Conventional Dairy Production, and Estimations on the Cost of Transitioning to Organic Production Produced by: the Northeast Organic Farming Association of Vermont
John Deere s Outlook on Cattle Economics
 John Deere s Outlook on Cattle Economics U.S. Drought having serious impact on livestock Drought impacting large cattle/dairy states Pushing feed prices higher Forced to feed hay earlier, haul water to
Annual Summary Data Kentucky Beef Farms
 Cooperative Extension Service, University of Kentucky College of Agriculture, Food and Environment. Agricultural Economics - Extension No. 2013-13 Kentucky Farm Business Management Program Annual Summary
Focus. Panhandle Model Farms 2018 Case Studies of Texas. High Plains Agriculture
 FARM Assistance Focus Panhandle Model Farms 2018 Case Studies of Texas High Plains Agriculture DeDe Jones Steven Klose Will Keeling Farm Assistance Focus 2019-1 January 2019 Department of Agricultural
Economics 230 Lab 4 Section 1 2 Due September 24 Fall 2010 WHOLE FARM BUDGET
 Economics 230 Name Lab 4 Section 1 2 Due September 24 Fall 2010 WHOLE FARM BUDGET The purpose of this lab is to (a) learn how to prepare a whole farm budget for a hypothetical farming situation, and use
The sales price for Pasture equivalents is zero. Check the feed prices on the last section of the Budgets.
 File: M&m FINFLO 2006 Warning The sales price for Pasture equivalents is zero. Check the feed prices on the last section of the Budgets. Max and Marlene Profit FINLRB: Succession example Anyplace, Eastern
Enterprise Diversification to Improve Efficiency and Profitability
 Enterprise Diversification to Improve Efficiency and Profitability Objectives Provide an overview of production diversification Explore the opportunities and challenges in improving diversification Outline
Considerations When Marketing Commodities. Far Ahead of Harvest. By Matthew A. Diersen, Scott W. Fausti, and Emmanuel Opoku 1
 Considerations When Marketing Commodities Far Ahead of Harvest By Matthew A. Diersen, Scott W. Fausti, and Emmanuel Opoku 1 Economics Pamphlet 2012-1 February 2012 Department of Economics South Dakota
ABSTRACT FARM COSTS AND RETURNS STUDIES
 COSTS and RETURNS ABSTRACT Net returns in 1970 were record-high on viable commercial cattle ranches in the Northern Plains and Northern Rocky Mountain areas, 2 of the most important cow-calf producing
2017 Agricultural Land Valuation Study
 Introduction The Agricultural Land Valuation Study determines the taxable value on agricultural lands and describes the methodology used Authority, methodology and assessment techniques are prescribed
Devin Murnin. Director of Industry Programs Colorado Cattlemen s Association
 Devin Murnin Director of Industry Programs Colorado Cattlemen s Association Colorado Agriculture Statistics Agriculture Second Largest Contributor to Colorado Economy Approximate Land Area: 66.3 Million
Report on Minnesota Farm Finances. April, 2010
 2009 Report on Minnesota Farm Finances April, 2010 Acknowledgements: Contributing Minnesota producers Minnesota State Colleges and Universities Farm Business Management Education Program Southwestern Minnesota
Annual Summary Data Kentucky Beef Farms 2013
 Cooperative Extension Service, University of Kentucky College of Agriculture, Food and Environment. Agricultural Economics - Extension No. 2014-04 Kentucky Farm Business Management Program Annual Summary
Ohio Farm Financial Conditions and Outlook: Farm Income and Assets, Land Values and Rent, and Farm Financial Stress
 Ohio Farm Financial Conditions and Outlook: Farm Income and Assets, Land Values and Rent, and Farm Financial Stress Ani Katchova Associate Professor Farm Income Enhancement Chair Department of Agricultural,
Agriculture & Business Management Notes...
 Agriculture & Business Management Notes... SPA Standardized Performance Analysis For Cow/Calf Producers -- A Worksheet Approach -- Cow/calf producers have been challenged to be lower cost producers, to
c) What optimality condition defines the profit maximizing amount of the input to use? (Be brief and to the point.)
 What optimality condition defines the profit maximizing amount of the input to use? (Be brief and to the point.)") AAE 320 Spring 2008 Exam #1 Name: 1) (15 pts.) You hire laborers to weed crops on your vegetable farm. The table below reports the boxes of tomatoes yielded in a week with different numbers of laborers
AAE 320 Spring 2008 Exam #1 Name: 1) (15 pts.) You hire laborers to weed crops on your vegetable farm. The table below reports the boxes of tomatoes yielded in a week with different numbers of laborers
Determining Your Unit Costs of Producing A Hundred Weight of Calf
 Managing for Today s Cattle Market and Beyond Determining Your Unit Costs of Producing A Hundred Weight of Calf By Harlan Hughes North Dakota State University Unit Costs of Production Astute beef cow producers
c) What optimality condition defines the profit maximizing amount of the input to use? (Be brief and to the point.)
 What optimality condition defines the profit maximizing amount of the input to use? (Be brief and to the point.)") AAE 320 Fall 2015 Exam #1 Name: 1) (10 pts.) Based on material covered in class, are these True or False? Mark your answer. a) T F Wisconsin farmers produce more cranberries than any other state b) T F
AAE 320 Fall 2015 Exam #1 Name: 1) (10 pts.) Based on material covered in class, are these True or False? Mark your answer. a) T F Wisconsin farmers produce more cranberries than any other state b) T F
KANSAS MASTER FARM FAMILY WORKBOOK
 KANSAS MASTER FARM FAMILY WORKBOOK 2018 County I. GENERAL INFORMATION 1. Husband's name: (first, middle, last) 2. Wife's name: (first, middle, last) 3. Address: Zip: 4. Location of your farm from nearest
Replacement Heifers Costs and Return Calculation Decision Aids
 Replacement Heifers Costs and Return Calculation Decision Aids The purpose of these replacement heifer cost decision aids is to calculate total production costs and return on investment (ROI) to evaluate
Agricultural Land Valuation
 Agricultural Land Valuation Dwight Aakre Farm Management Specialist NDSU Extension Service 5/06/10 Valuation and Assessment of Agricultural Land Agricultural value is defined as the capitalized average
The Contributions Approach to Establishing Equitable Pasture Lease Agreements Stocking Rates
 PB 1816-D The Contributions Approach to Establishing Equitable Pasture Lease Agreements This publication provides management information and guidelines for landlords and tenants to follow when negotiating
EC Estimating the Most Profitable Use of Center-Pivot Irrigation for a Ranch
 University of Nebraska - Lincoln DigitalCommons@University of Nebraska - Lincoln Historical Materials from University of Nebraska- Lincoln Extension Extension 1974 EC74-861 Estimating the Most Profitable
Highlights from the 2007 North Dakota Region 4 Averages
 Highlights from the 2007 North Dakota Region 4 Averages Overview for Region 4 The western part of North Dakota had a good year for crop production with an overall increase in yields and increases in prices.
Crop Variety Selection
 September/October 2016 Steve Okonek, Agricultural Agent Email: steve.okonek@ces.uwex.edu (715) 538-2311, ext. 376 Crop Variety Selection Be sure to spend some time and thought on corn and soybean variety
MILK PRODUCTION COSTS in 1998 on Selected WISCONSIN DAIRY FARMS
 MILK PRODUCTION COSTS in 1998 on Selected WISCONSIN DAIRY FARMS by Gary Frank and Jenny Vanderlin 1 July 23, 1999 Introduction Total cost of production per hundredweight equivalent of milk ($14.90) was
c) What optimality condition defines the profit maximizing amount of the input to use? (Be brief and to the point.)
 What optimality condition defines the profit maximizing amount of the input to use? (Be brief and to the point.)") AAE 320 Fall 2016 Exam #1 Name: 1) (10 pts.) Based on material covered in class, are these True or False? Mark your answer. a) T F Wisconsin farmers produce more milk than farmers in any other state. b)
AAE 320 Fall 2016 Exam #1 Name: 1) (10 pts.) Based on material covered in class, are these True or False? Mark your answer. a) T F Wisconsin farmers produce more milk than farmers in any other state. b)
~il~~:~~ii~!. ~...~: {(.~i. !!.~I~ji!': i~i( l:;i;!i:i;i;i:::-: :: C: ..::::)~::m~:l::::t:m:;::;;%::;:!;:;:;:j;.:;:;::::;::j::j:j\:;..
~::m~:l::::t:m:;::;;%::;:!;:;:;:j;.:;:;::::;::j::j:j\:;..") May 1983 A.E. Ext. 83-10 ~il~~:~~ii~!. ~...~:..::::)~::m~:l::::t:m:;::;;::;:!;:;:;:j;.:;:;::::;::j::j:j\:;.. ;/::@H::;j'::;{:: ::::;:;:;:;:::;:::::::::::::;: ::::::;:::::;:;:::;:::::;::::: ~ ~::: ~: ~:
May 1983 A.E. Ext. 83-10 ~il~~:~~ii~!. ~...~:..::::)~::m~:l::::t:m:;::;;::;:!;:;:;:j;.:;:;::::;::j::j:j\:;.. ;/::@H::;j'::;{:: ::::;:;:;:;:::;:::::::::::::;: ::::::;:::::;:;:::;:::::;::::: ~ ~::: ~: ~:
Kansas Farm Economy Update Land and Leasing
 Kansas Farm Economy Update Land and Leasing Mykel Taylor Kansas State University January 10, 2017 Net Farm and Ranch Income Returns over Total Costs ($/ac) $230,000 $180,000 $130,000 $80,000 $30,000 $(20,000)
Agriculture: expansions highlighted developments
 Agriculture: expansions highlighted developments A broad-based expansion in livestock production and another bumper grain harvest highlighted agricultural developments in 1976. Meat production rose 9 percent
THE STRUCTURE OF SOUTH DAKOTA AGRICULTURE:
 THE STRUCTURE OF SOUTH DAKOTA AGRICULTURE: 1935-2012 by Henry Brown, Larry Janssen, Matthew A. Diersen, and Evert Van der Sluis Economics Research Report 2015-1 September 14, 2015 Henry Brown is a Graduate
Determining Pasture Rents
 Extension Extra ExEx 5019 Updated March 2002 F&F: 5.2-3 COLLEGE OF AGRICULTURE & BIOLOGICAL SCIENCES / SOUTH DAKOTA STATE UNIVERSITY / USDA Determining Pasture Rents Martin Beutler, Extension ranch economist
RETUR COSTS A 8 R R. and 96 LI6R R
 U.S. DEPARTMENT OF AGRICULTURE ECONOMIC RESEARCH SERVICE SEPTEMBER 1968 FCR -62 koope roting with KENTUCKY AND TENNESSEE AGRICULTURAL EXPERIMENT STATIONS COSTS A 8 R R. LI6R R and 96 RETUR FARM COSTS AND
October 20, 1998 Ames, Iowa Econ. Info U.S., WORLD CROP ESTIMATES TIGHTEN SOYBEAN SUPPLY- DEMAND:
 October 20, 1998 Ames, Iowa Econ. Info. 1752 U.S., WORLD CROP ESTIMATES TIGHTEN SOYBEAN SUPPLY- DEMAND: USDA's domestic and world crop estimates show a less burdensome world supply-demand balance for soybeans
THE BENEFITS OF FINANCIAL BENCHMARKING TO FARMERS IN THE UNITED STATES
 THE BENEFITS OF FINANCIAL BENCHMARKING TO FARMERS IN THE UNITED STATES Robert Craven, Dale Nordquist and Kevin Klair Center for Farm Financial Management, University of Minnesota Abstract Benchmarking
PROJECTED COSTS AND RETURNS FOR BEEF CATTLE, DAIRY PRODUCTION, SWINE PRODUCTION AND FORAGE CROPS IN LOUISIANA, 1997
 January 1997 A.E.A. Information Series No. 150 PROJECTED COSTS AND RETURNS FOR BEEF CATTLE, DAIRY PRODUCTION, SWINE PRODUCTION AND FORAGE CROPS IN LOUISIANA, 1997 by Robert W. Boucher Jeffrey M. Gillespie
MILK PRODUCTION COSTS and SELECTED FINANCIAL BENCHMARKS FROM 978 WISCONSIN DAIRY FARMS
 1996 1 MILK PRODUCTION COSTS and SELECTED FINANCIAL BENCHMARKS FROM 978 WISCONSIN DAIRY FARMS by Gary Frank and Jenny Vanderlin 2 August 27, 1997 Introduction In this study of 1996 records, 978 dairy farms
Benchmarking Your Herd s Economic Facts
 Managing for Today s Cattle Market and Beyond March 2002 Benchmarking s Economic Facts By Harlan Hughes, North Dakota State University Dwight Aakre, North Dakota State University Introduction Benchmarking
Farm Financial Outlook
 Farm Financial Outlook Alejandro Plastina, PhD Assistant Professor, Economics NACM Heartland - National Agriculture Retail Credit Exchange Group Ankeny, IA March 2, 2017 Main topics Farm Financial Situation
Wheat Enterprises: 1999 Costs and Returns
 Wheat Enterprises: 1999 Costs and Returns KENTUCKY FARM BUSINESS MANAGEMENT PROGRAM Agricultural Economics Extension No. 2001-07 July 2001 By: DAVID L. HEISTERBERG AND RICHARD L. TRIMBLE University of
Ranch Calculator (RanchCalc)
") Oklahoma Cooperative Extension Service Current Report CR-3252 0609 Oklahoma Cooperative Extension Fact Sheets are also available on our website at: facts.okstate.edu Ranch Calculator (RanchCalc) Damona
Oklahoma Cooperative Extension Service Current Report CR-3252 0609 Oklahoma Cooperative Extension Fact Sheets are also available on our website at: facts.okstate.edu Ranch Calculator (RanchCalc) Damona
Diversifying Your Income Streams
 Diversifying Your Income Streams Executive Women in Agriculture Chicago, Illinois December 2015 Innovus Agra Bret Oelke boelke@innovusagra.com LLC. 218.770.2428 Mission Statement To search for and develop
Chapter 7. Dairy -- Farm Management Wayne A. Knoblauch, Professor George J. Conneman, Professor Emeritus Cathryn Dymond, Extension Support Specialist
 Chapter 7. Dairy -- Farm Management Wayne A. Knoblauch, Professor George J. Conneman, Professor Emeritus Cathryn Dymond, Extension Support Specialist Herd Size Comparisons The 171 New York dairy farms
Kentucky Farm Business Management Program. Annual Summary Data
 Kentucky Farm Business Management Program Annual Summary Data 2010 Agricultural Economics - Extension No. 2011-14 June 2011 By: KFBM Specialists See page 7 University of Kentucky Department of Agricultural
TIMELY INFORMATION. Agriculture & Natural Resources AGRICULTURAL ECONOMICS AND RURAL SOCIOLOGY, AUBURN UNIVERSITY, AL
 AG ECONOMIC SERIES TIMELY INFORMATION Agriculture & Natural Resources AGRICULTURAL ECONOMICS AND RURAL SOCIOLOGY, AUBURN UNIVERSITY, AL 36849-5639 DAERS 08-5 September 2008 U. S. Beef Cattle Situation
Characteristics and Production Costs of U.S. Cow-Calf Operations
 United States Department of Agriculture Electronic Report from the Economic Research Service www.ers.usda.gov Statistical Bulletin Number 974-3 November 2001 Characteristics and Production Costs of U.S.
GUIDE TO ASSEMBLING DATA FOR COW-CALF
 GUIDE TO ASSEMBLING DATA FOR COW-CALF SPA-38 STANDARDIZED PERFORMANCE ANALYSIS* Revised 1-25-06 DATA NEEDED Assembling necessary data for the Cow-Calf Standardized Performance Analysis (SPA) is the most
1. Under 60k SO Farm Business Income ( per farm)
") 1. Under 60k SO Farm Business Income ( per farm) Number of farms in sample 21 21 Average business size (SO) 32,754 33,481 OUTPUTS 2016/17 2015/16 Other cattle 15,275 16,588 Sheep 10,263 10,669 Main crops
1. Under 60k SO Farm Business Income ( per farm) Number of farms in sample 21 21 Average business size (SO) 32,754 33,481 OUTPUTS 2016/17 2015/16 Other cattle 15,275 16,588 Sheep 10,263 10,669 Main crops
Methods and Procedures of Estimating Rent for Crop Share, and Flexable Cash Leases.
 Methods and Procedures of Estimating Rent for Crop Share, and Flexable Cash Leases. You are allowed/required to enter information shown in blue text in this spreadsheet. Print All Input and Results Click
MILK PRODUCTION COSTS in 2001 on Selected WISCONSIN DAIRY FARMS
 MILK PRODUCTION COSTS in 2001 on Selected WISCONSIN DAIRY FARMS By Gary Frank and Jenny Vanderlin 1 July 22, 2002 Introduction The good news is that higher milk prices in 2001 caused an increased of almost
Trends in Agricultural Contracts
 The magazine of food, farm, and resource issues 3rd Quarter 2015 30(3) A publication of the Agricultural & Applied Economics Association Trends in Agricultural Contracts James M. MacDonald JEL Classifications:
Business of Indian Agriculture: Best Financial Practices for Small Agribusiness, Part 1
 Business of Indian Agriculture: Best Financial Practices for Small Agribusiness, Part 1 Recordkeeping for a successful agribusiness February 21, 2013 John Phillips First Americans Land-grant Consortium
Contracting Corn Silage Acres
 Contracting Corn Silage Acres Mike Rankin Crops and Soils Agent UW Extension - Fond du Lac County Situation As dairy farms expand in terms of cow numbers, a concurrent expansion of crop acres must also
SHARECROPPING MATH PROJECT 5 th Grade 5 to 7 day unit
 SHARECROPPING MATH PROJECT 5 th Grade 5 to 7 day unit Georgia Content Standards M5N3. Students will further develop their understanding of the meaning of multiplication and division with decimal fractions
Redtail Ridge Dairy, LLC Joe & Diane Thome Malone, Wisconsin, USA
 Redtail Ridge Dairy, LLC Joe & Diane Thome Malone, Wisconsin, USA 1963 Mother & Father bought the farm 1 ½ years old 2 nd oldest of 9 kids 26 cows 98 acres (40 hectares) 1982 Joe & Diane married Purchased
2011 Southern Peanut Farmers Conference. Marshall Lamb USDA/ARS National Peanut Research Laboratory Dawson, GA
 2011 Southern Peanut Farmers Conference Farm Planning and Financing Marshall Lamb USDA/ARS National Peanut Research Laboratory Dawson, GA The vast majority of men die poor, not because their intentions
Current Report. Oklahoma Cropland Rental Rates: CR
 Oklahoma Cooperative Extension Service Current Report CR-23 39 Oklahoma Cropland Rental Rates: 28-9 Damona Doye Regents Professor and Extension Economist Oklahoma Cooperative Extension Fact Sheets are
APPENDIX A. General Explanation
 APPENDIX A. General Explanation DATA COLLECTION Method of Enumeration As in the previous censuses of the U.S. Virgin Islands, a direct enumeration procedure was used in the 2007 Census of Agriculture.
ARC / PLC Program Overview
 ARC / PLC Program Overview 1 The 2014 Farm Bill provides the following: Eliminates DCP and ACRE program Allows for a one-time decision REALLOCATE base acres and/or UPDATE Counter-Cyclical Yields on a farm