Agricultural Trade and the Implications for the U.S. Farm Sector May 16, 2018 Ames, IA
|
|
|
- Alban Evans
- 5 years ago
- Views:
Transcription
1 Agricultural Trade and the Implications for the U.S. Farm Sector May 16, 2018 Ames, IA David Oppedahl Senior Business Economist Federal Reserve Bank of Chicago

2 Global Trade in Action 8.5% of U.S. Exports in 2015 were Food and Agricultural Products, and 13% of District Exports

3 IMF real GDP growth forecast for 2018
4 The dollar s exchange value has dipped since the start of 2017, boosting exports 120 (Real Broad Trade-Weighted Exchange Value of the US$) {March 1973=100} Source: Board of Governors of the Federal Reserve System
5 Real U.S. exports rising again, but more slowly than imports 300 (billions of 2015 dollars, SA) Exports Imports Sources: Bureau of Economic Analysis and Census Bureau

6 Global Marketplace U.S. trade surplus for agriculture Filling empty containers with soybeans headed for China
7 Value of agricultural exports rose in 2017, but expected to be about the same in 2018 billion $ Exports Imports Surplus FY * *USDA projection Source: USDA, Economic Research Service
8 Agricultural Exports billion dollars Jan. Mar. May July Sep. Nov. Source: USDA, Economic Research Service
9 High-value agricultural exports outpaced more variable bulk exports, but both slowed billion 2016$ High-value Bulk Source: USDA, Economic Research Service
10 Trade agreements won t repeal the variability of bulk exports 3000 million bu Wheat Corn 500 Soybeans (USDA data for end of marketing year)
11 Growth in agricultural exports to NAFTA partners (billion $) Canada Mexico 5 0 CY1990 ' '05 '10 '15
12 But agricultural exports to China caught up (billion $) Canada China Mexico 0 CY1990 ' '05 '10 '15
13 U.S. agricultural exports by top destinations (billion $) Country FY1990 Country CY2017 Japan 8.19 Canada 20.5 European Union 7.44 China 19.6 Canada 3.73 Mexico 18.6 Former USSR 2.99 Japan 11.9 South Korea 2.71 European Union 11.5 Mexico 2.67 Taiwan 1.82 China 0.91 Egypt 0.76 Hong Kong 0.69 Saudi Arabia 0.50 Iraq 0.50 Algeria 0.49 Pakistan 0.39 Philippines 0.35 Source: USDA, Economic Research Service South Korea 6.9 Hong Kong 4.2 Taiwan 3.3 Indonesia 2.9 Philippines 2.6 Vietnam 2.5 Columbia 2.5 Thailand 1.8 Turkey 1.7 India 1.6
14 Iowa s agricultural exports hit a plateau (billion $) Source: USDA, Economic Research Service
15 Agricultural exports by regional states (2016 in million $) U.S. Iowa Illinois Indiana Michigan Wisc. Total (rank) 134,242 10,608 (#2) 8,345 (#3) 4,604 (#7) 2,044 (#20) 2,898 (#18) Soybeans 22,819 3,113 (#2) 3,205 (#1) 1,706 (#4) 564 (#13) 532 (#14) Corn 9,890 1,747 (#1) 1,558 (#2) 678 (#5) 229 (#13) 282 (#10) Pork 5,936 1,999 (#1) 382 (#4) 319 (#5) 97 (#12) 31 (#18) Dairy 4, (#12) 43 (#23) 91 (#14) 223 (#7) 683 (#2) Source: USDA, Economic Research Service
16 Export Shares of U.S. Agricultural Production, Plant products Corn 15% Processed vegs 25% Fresh fruit 30% Soybeans 40% Wheat 51% Rice 55% Tree nuts 72% Cotton 77% Animal products Beef 10% Pork 22%
17 7th District Crop Yield Indexes (1964=100) Corn Soybeans Source: USDA, National Agricultural Statistics Service
18 Real Cash Crop Prices 40 ($/bushel for Central IL, adjusted by CPI-U for January 2010) Corn Soybeans Sources: The Wall Street Journal and U.S. Bureau of Labor Statistics
19 Corn production down from record in 2016/ billion bushels /92 96/97 01/02 06/07 11/12 16/17 Source: USDA, National Agricultural Statistics Service
20 Growth in industrial demand (especially for ethanol production) surpassed feed demand for corn 8 Food, Seed & Industrial billion bushels Residual & Feed Exports /92 96/97 01/02 06/07 11/12 16/17 Source: USDA, World Agricultural Outlook Board
21 Corn prices expected to be higher in 2018/19 as stocks tighten $9 30% 25% Price per bushel $6 $3 14% 11% 17% 10% 15% 19% 20% 18% 16% 12% 9% 20% 18% 13%14% 13% 12% 9% 8% 7% 9% 13%13% 16% 15% 12% 20% 10% Stocks/use ratio 5% $0 1991/92 96/97 01/02 06/07 11/12 16/17 0% stks/use ratio price Source: USDA, World Agricultural Outlook Board
22 Soybean production expected to be down from records of two previous years billion bushels /92 96/97 01/02 06/07 11/12 16/17 Source: USDA, National Agricultural Statistics Service
23 Soybean exports expected to be up, while crushing projections are flat 2.5 Exports billion bushels Crush /92 96/97 01/02 06/07 11/12 16/17 Source: USDA, World Agricultural Outlook Board
24 Soybean prices expected to rise as stocks dip in 2018/19 $16 19% 20% Price per bushel $12 $8 $4 16% 14% 14% 13% 13% 11% 11% 9% 9% 8% 8% 7% 6% 5% 4% 7% 7% 5% 5% 5% 5% 13% 9% 7% 5% 5% 15% 10% 5% Stocks/use ratio 3% $0 1991/92 96/97 01/02 06/07 11/12 16/17 stks/use ratio price 0% Source: USDA, World Agricultural Outlook Board

25 Primary global soybean flows

26 Seasonal soybean trade with China
27
28 Real USDA Livestock Prices 250 ($/hundredweight, adjusted by CPI-U for January 2010) Hogs Cattle Sources: USDA, National Agricultural Statistics Service and U.S. Bureau of Labor Statistics
29 Pork exports overtook beef exports by weight 6 Pork billion pounds 4 2 Beef Source: USDA, Economic Research Service
30 But pork exports lag beef exports by value 8 billion $ 6 4 Pork Beef Source: USDA, Economic Research Service
31 Dairy exports and milk prices $26 8 Price per cwt. $22 $18 $14 $ Exports Price Billion dollars * 2018 USDA forecast Source: USDA, World Agricultural Outlook Board

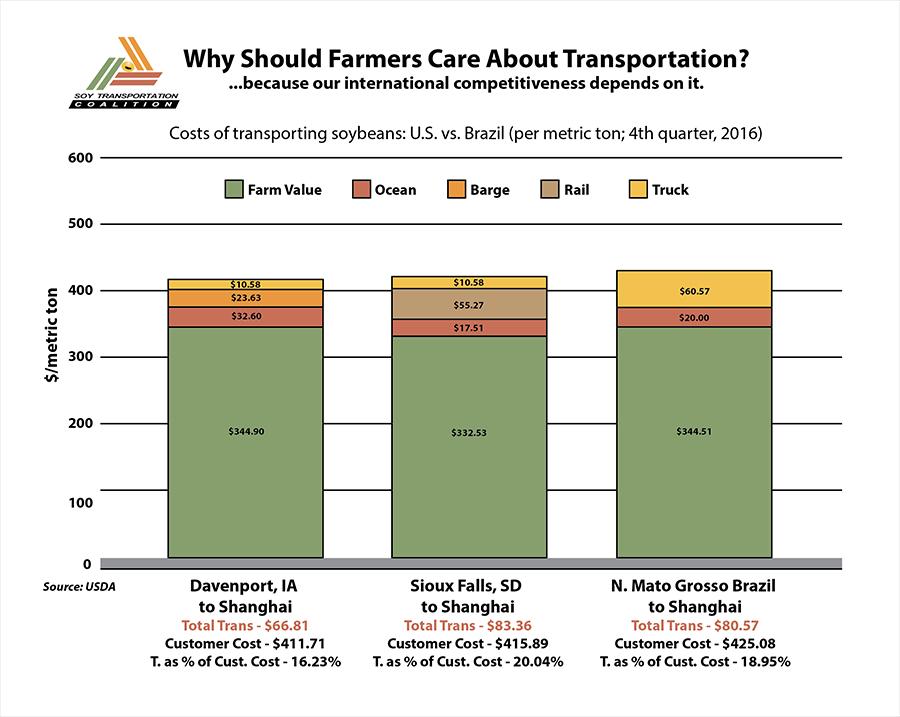
32 Midwest agriculture faces choke points with aging waterway infrastructure
33 Growth in Food Demand Projected population growth: 45% increase in low income countries, 7% in high income countries 1.4 billion live on less than $1.25/day (most hungry or under-nourished) 3.1 billion live on less than $2.50/day (calorie problems solved for most) As income increases from $2 to $10 per day, demand rises for meat, dairy, oils, and fruits After $10 per day, demand for processed food greater than demand for raw commodities World food demand may double by 2050 as people escape from poverty
34 Population trends changing world trade

35 Income growth boosts ag trade

36 Midwest agriculture faces choke points with aging waterway infrastructure

37 Urbanization drives food trade as well


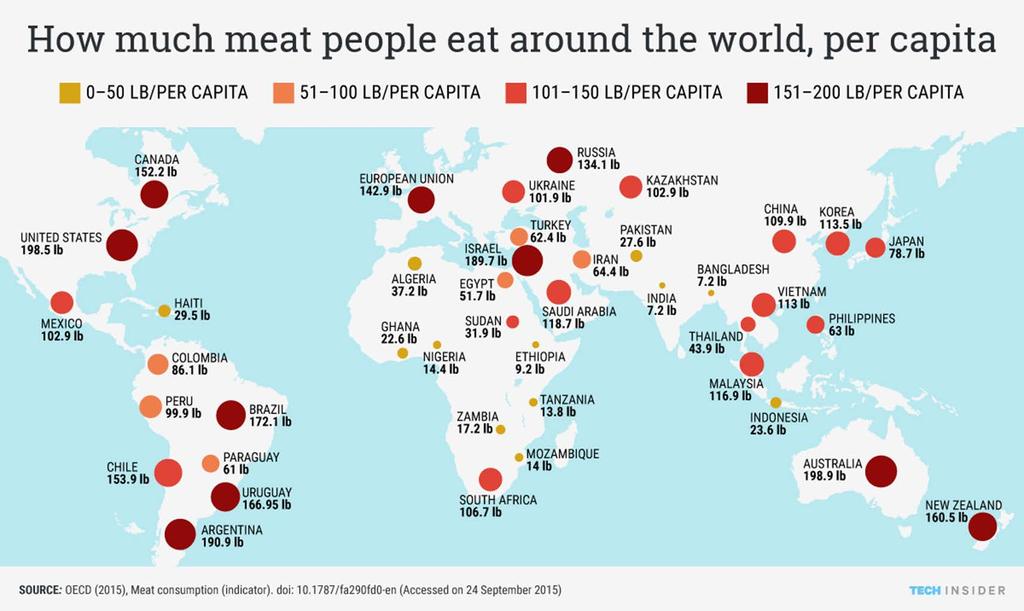
38 Increasing consumption of meat and protein as income rises Decreasing consumption of staple foods as income rises
39
40 Ratio of % calories by source in low to high income countries

41 Midwest agriculture faces choke points with aging waterway infrastructure
42 Resource Constraints Drive Trade At most 12% more arable land available worldwide for agriculture (without destruction) Inferior quality or degraded land in many areas Agriculture uses 70% of world s fresh water Water is a scarce resource in much of the world, but it s not priced that way To meet world food demand sustainably there will need to be huge increases in food system productivity around the world Larger fraction of food to move via trade due to distribution of arable land

43 Agriculture faces challenges where water is scarce
44 Future of Agricultural Trade? How to attract the next generation of buyers? Consumer-driven agriculture Innovations in technology and marketing Current trends forecast into the future, but for how long? Disruptive forces lurk Climate change and environmental crises Geopolitical risks Trade negotiations

45 Midwest agriculture faces choke points with aging waterway infrastructure
46
47 U.S. agricultural trade value forecast to 2027 Source: USDA, Interagency Agricultural Projections Committee
48 Source: USDA, Interagency Agricultural Projections Committee

49 Source: USDA, Interagency Agricultural Projections Committee

50 Source: USDA, Interagency Agricultural Projections Committee
51 Source: USDA, Interagency Agricultural Projections Committee
52 Growth Potential for Ag Exports Exports are key to profitability of Midwest ag Only large potential growth markets are in low income countries Midwestern comparative advantage in producing products desired by people as they move up the income ladder (animal products and feed, edible oils)
53 Real net farm income edged up in 2017, but is expected to be down in 2018 billion 2018$ gov't payments 2018* *USDA forecast Source: USDA, Economic Research Service

54 Annual change in farmland values in 7th Federal Reserve District Percent Source: Federal Reserve Bank of Chicago
World Agricultural Supply and Demand Estimates
 World Agricultural Supply and Demand Estimates Report of Interagency Commodity Estimates Committee Forecasts World Agricultural Outlook Board, Chairing Agency Economic Research Service Foreign Agricultural
2012 Farm Outlook. Highlights
 2012 Farm Outlook Office of the Chief Economist USDA Highlights A promising spring planting was followed by historic drought. Record high commodity prices followed. Farm incomes are expected to be near
Minnesota Agricultural Exports
 Minnesota Agricultural Exports Minnesota ranked No. 4 in agricultural exports among all states 2018 Update 10 pages Prepared by Su Ye, Chief Economist Minnesota Department of Agriculture, Agricultural
Factors Affecting Global Agricultural Markets. Fred Giles Director, Agricultural Trade Office USDA / SP
 Factors Affecting Global Agricultural Markets Fred Giles Director, Agricultural Trade Office USDA / SP Factors Impacting Global Agricultural Markets Commodity Prices Energy Prices Value of the U.S. Dollar
FACTORS CREATING RISK IN U.S. GRAIN MARKETS
 FACTORS CREATING RISK IN U.S. GRAIN MARKETS WAY TOO EARLY GRAIN MARKET OUTLOOK TO 2050 22 ND NATIONAL WORKSHOP FOR DAIRY ECONOMISTS & POLICY ANALYSTS APRIL 30, 2015 JOHN NEWTON UNIV. OF ILLINOIS JCNEWT@ILLINOIS.EDU
World Agricultural Outlook Board Interagency Commodity Estimates Committee Forecasts. Lockup Briefing April 9, 2014
 World Agricultural Outlook Board Interagency Commodity Estimates Committee Forecasts Lockup Briefing World Wheat Production Country or Region Million Tons World 656.5 712.5 8.5 United States 61.7 58.0-6.0
OUTLOOK FOR US AGRICULTURE
 Agricultural Outlook Forum 216 OUTLOOK FOR US AGRICULTURE Robert Johansson Chief Economist 25 February 216 Fig 2 Main themes for 216 1. The macroeconomy is weighing on trade, but there are reasons for
World Agricultural Outlook Board Interagency Commodity Estimates Committee Forecasts. Lockup Briefing June 11, 2014
 World Agricultural Outlook Board Interagency Commodity Estimates Committee Forecasts Lockup Briefing World Wheat Production Country or Region 2014/15 Million Tons World 714.0 701.6 0.7-1.7 United States
U.S. Agricultural Trade: Trends, Composition, Direction, and Policy
 U.S. Agricultural Trade: Trends, Composition, Direction, and Policy Charles E. Hanrahan Senior Specialist in Agricultural Policy Carol Canada Information Research Specialist Beverly A. Banks Acquisitions
Jason Henderson Vice President and Branch Executive Federal Reserve Bank of Kansas City Omaha Branch April 25, 2012
 Jason Henderson Vice President and Branch Executive April 25, 2012 The views expressed are those of the author and do not necessarily reflect the opinions of the Federal Reserve Bank of Kansas City or
U.S. Economy in High Gear, but Ag Stuck in Neutral
 FEDERAL RESERVE BANK OF KANSAS CITY OMAHA BRANCH U.S. Economy in High Gear, but Ag Stuck in Neutral Nate Kauffman, Federal Reserve Bank of Kansas City August 23, 18 Outlook Themes Bullet 1 Bullet Momentum
World Agricultural Outlook Board Interagency Commodity Estimates Committee Forecasts. Lockup Briefing March 10, 2014
 World Agricultural Outlook Board Interagency Commodity Estimates Committee Forecasts Lockup Briefing World Wheat Production Country or Region 2013/14 Million Tons World 656.4 712.7 0.1 8.6 United States
WORLD AGRICULTURAL SUPPLY AND DEMAND ESTIMATES
 WORLD AGRICULTURAL SUPPLY AND DEMAND ESTIMATES United States Department of Agriculture Washington, D.C. Approved by the World Agricultural Outlook Board WASDE-339 - June 12, 1998 NOTE Because planting
World Agricultural Outlook Board Interagency Commodity Estimates Committee Forecasts. May 9, 2014
 World Agricultural Outlook Board Interagency Commodity Estimates Committee Forecasts World Wheat Production Country or Region Million Tons 2014/15 World 714.0 697.0-2.4 United States 58.0 53.4-7.8 Foreign
Emerging Global Trade Patterns: USDA s Long-term Agricultural Projections
 Emerging Global Trade Patterns: USDA s Long-term Agricultural Projections Midwest Agriculture s Ties to the Global Economy Federal Reserve Bank of Chicago November 28, 217 Chicago Jim Hansen, Ph.D. USDA,
World Agricultural Supply And Demand Estimates
 World Agricultural Supply And Demand Estimates United States Department of Agriculture Office of the Chief Economist Agricultural Marketing Service Economic Research Service Farm Service Agency Foreign
World Agricultural Outlook Board Interagency Commodity Estimates Committee Forecasts. Lockup Briefing July 11, 2014
 World Agricultural Outlook Board Interagency Commodity Estimates Committee Forecasts Lockup Briefing World Wheat Production Country or Region estimate 2014/15 forecast June 11 Million Tons Percent Percent
World Agricultural Supply And Demand Estimates
 World Agricultural Supply And Demand Estimates United States Department of Agriculture Office of the Chief Economist Agricultural Marketing Service Economic Research Service Farm Service Agency Foreign
Global Agricultural Supply and Demand: Factors contributing to recent increases in food commodity prices
 Global Agricultural Supply and Demand: Factors contributing to recent increases in food commodity prices Ron Trostle Economic Research Service U.S. Department of Agriculture Agricultural Markets and Food
World Agricultural Supply And Demand Estimates
 World Agricultural Supply And Demand Estimates United States Department of Agriculture Office of the Chief Economist Agricultural Marketing Service Economic Research Service Farm Service Agency Foreign
Latest developments in Asia & Oceania. Peter Weeks Chief Economist Meat & Livestock Australia
 Latest developments in Asia & Oceania Peter Weeks Chief Economist Meat & Livestock Australia Outline Beef production trends Drivers of beef production Beef trade issues Long term beef projections Beef
Implications for commodity prices and farm income
 Implications for commodity prices and farm income Mike Dwyer Director, Global Policy Analysis Office of Global Analysis Foreign Agricultural Service US Department of Agriculture Mike.Dwyer@fas.usda.gov
World Agricultural Supply And Demand Estimates
 United States Department of Agriculture Office of the Chief Economist World Agricultural Supply And Demand Estimates Agricultural Marketing Service Economic Research Service Farm Service Agency Foreign
January 12, USDA World Supply and Demand Estimates
 January 12, 2018 - USDA World Supply and Demand Estimates Corn Market Reaction: March 2018 corn futures closed down 2 ½ cents at $3.46 ¼ with a trading range for the day of $3.45 ½ to $3.50. December 2018
World Agricultural Supply and Demand Estimates
 World Agricultural Supply and Demand Estimates Report of Interagency Commodity Estimates Committee Forecasts World Agricultural Outlook Board, Chairing Agency Economic Research Service Foreign Agricultural
September 12, USDA World Supply and Demand Estimates
 September 12, 2018 - USDA World Supply and Demand Estimates Corn Market Reaction: December 2018 corn futures closed down 14 ¼ cents at $3.52 ½ with a trading range for the day of $3.50 ¾ to $3.66 ¼. December
SOYBEANS: LOW PRICES TO PERSIST
 SOYBEANS: LOW PRICES TO PERSIST JANUARY 2002 Darrel Good 2002 - NO. 2 Summary Soybean prices received some support from the USDA s January 11 final U.S. production estimate for the 2001 crop. At 2.891
World Agricultural Supply And Demand Estimates
 United States Department of Agriculture Office of the Chief Economist World Agricultural Supply And Demand Estimates Agricultural Marketing Service Economic Research Service Farm Service Agency Foreign
August 10, USDA World Supply and Demand Estimates
 August 10, 2017 - USDA World Supply and Demand Estimates Corn Market Reaction: September 2017 corn futures closed down 15 cents at $3.57 ¼ with a trading range for the day of $3.56 ½ to $3.75 ½. December
World Agricultural Supply And Demand Estimates
 United States Department of Agriculture Office of the Chief Economist World Agricultural Supply And Demand Estimates Agricultural Marketing Service Economic Research Service Farm Service Agency Foreign
CORN: WILL ACREAGE REBOUND IN 2002
 CORN: WILL ACREAGE REBOUND IN 2002 JANUARY 2002 Darrel Good 2002 - NO.1 Summary The USDA s Crop Production and Grain Stocks reports released on January 11 reflected a smaller domestic supply of corn and
Nathan Kauffman Economist Federal Reserve Bank of Kansas City Omaha Branch August 21, 2013
 Nathan Kauffman Economist August 21, 213 The views expressed are those of the author and do not necessarily reflect the opinions of the Federal Reserve Bank of Kansas City or the Federal Reserve System.
UPDATED HOG PRODUCTION ESTIMATED RETURNS
 February 15, 21 Ames, Iowa Econ. Info. 187 UPDATED HOG PRODUCTION ESTIMATED RETURNS The Iowa State University Extension Estimated Livestock Returns have provided a barometer of profitability for the Iowa
U.S. Ag Trade: Existing vs Emerging Markets. Ohio Grain Symposium Ben Brown December 18, 2018
 U.S. Ag Trade: Existing vs Emerging Markets Ohio Grain Symposium Ben Brown December 18, 2018 Today s Outline- Trade Policy Understanding the U.S. Trade Deficit Ohio Ag Trade World Soybean Impacts from
Hog and Pork Situation and Outlook
 Hog and Pork Situation and Outlook September 3, 2013 Washington, Iowa Lee Schulz Department of Economics Iowa State University lschulz@iastate.edu (515) 294-3356 Feed Supply U.S. Corn Supply and Use 2009/10
May 10, USDA World Supply and Demand Estimates
 May 10, 2018 - USDA World Supply and Demand Estimates Corn Market Reaction: July 2018 corn futures closed down ¾ cent at $4.02 with a trading range for the day of $4.00 to $4.07. December 2018 corn futures
World Agricultural Supply And Demand Estimates
 United States Department of Agriculture Office of the Chief Economist World Agricultural Supply And Demand Estimates Agricultural Marketing Service Economic Research Service Farm Service Agency Foreign
Market Outlook. David Reinbott.
 Market Outlook David Reinbott Agriculture Business Specialist P.O. Box 187 Benton, MO 63736 (573) 545-3516 http://extension.missouri.edu/scott/agriculture.aspx reinbottd@missouri.edu Trending Issues China,
Iowa Farm Outlook. February 2017 Ames, Iowa Econ. Info Livestock Market Adjustments and Opportunities
 Iowa Farm Outlook 0BDepartment of Economics February 2017 Ames, Iowa Econ. Info. 2082 Livestock Market Adjustments and Opportunities Fed cattle prices are off to a good start in 2017. USDA AMS report LM_CT167
World Agricultural Supply And Demand Estimates
 United States Department of Agriculture Office of the Chief Economist World Agricultural Supply And Demand Estimates Agricultural Marketing Service Economic Research Service Farm Service Agency Foreign
2019 IBA ANNUAL AGRICULTURAL CONFERENCE
 2019 IBA ANNUAL AGRICULTURAL CONFERENCE Livestock Update 2019 livestock production, prices and forecasts Lee Schulz, Dept. of Economics, Iowa State University +12% +3% +11% +15% +11% Data Source: USDA-NASS,
Oral Statement before the United States Senate Committee on Agriculture, Nutrition, and Forestry. Hearing on the trade section of the farm bill
 Oral Statement before the United States Senate Committee on Agriculture, Nutrition, and Forestry Hearing on the trade section of the farm bill April 25, 2001 Bruce A. Babcock Center for Agricultural and
Grain Market Outlook for
 Grain Market Outlook for 2018-2019 2018 KSU Risk & Profit Conference Manhattan, Kansas DANIEL O BRIEN EXTENSION AGRICULTURAL ECONOMIST Topics to be discussed.. 1) U.S.-China Trade & Other Key Grain Market
World Agricultural Supply and Demand Estimates
 World Agricultural Supply and Demand Estimates Report of Interagency Commodity Estimates Committee Forecasts World Agricultural Outlook Board, Chairing Agency Economic Research Service Foreign Agricultural
USDA Agricultural Baseline Projections to 2012
 United States Department of Agriculture Office of the Chief Economist Staff Report WAOB-23-1 USDA Agricultural Baseline Projections to 212 Interagency Agricultural Projections Committee World Agricultural
Weekly Comments
 Weekly Newsletters start in October and continue during harvest at least through October and likely into November. Position Management: The table shows how the Model Farm is positioned at this time. Individual
Iowa Farm Outlook. March 2014 Ames, Iowa Econ. Info Long-Term Projections for Beef Production and Trade
 Iowa Farm Outlook 0BDepartment of Economics March 2014 Ames, Iowa Econ. Info. 2047 Long-Term Projections for Beef Production and Trade We often spend a lot of time focusing on the short-term market situation
Prospects for Corn Trade in 2018/19 and Beyond
 Prospects for Corn Trade in 2018/19 and Beyond Ben Brown Department of Agricultural, Environmental, and Development Economics The Ohio State University February 15, 2019 The agricultural industry is a
Cattle Market Situation and Outlook
 Cattle Market Situation and Outlook Rebuilding the Cow Herd Series March 28, 2007 Falls City, TX Coordinated by: Dennis Hale-Karnes CEA Ag & Charlie Pfluger-Wilson CEA Ag Prepared and presented by: Larry
Situation and Outlook for U.S. Livestock, Dairy, and Poultry
 Situation and Outlook for U.S. Livestock, Dairy, and Poultry Presented by Rachel J. Johnson Economic Research Service, USDA AAEA Pittsburgh, PA July 26, 2011 Meat Complex Snapshot High livestock prices
Saskatchewan Feeder Steer and Feeder Heifer Prices ($/cwt)
") This information is provided as a resource by Saskatchewan Agriculture staff. All stated cattle prices are based on the weekly Canfax Market Outlook and Summary. Please use this information at your own
This information is provided as a resource by Saskatchewan Agriculture staff. All stated cattle prices are based on the weekly Canfax Market Outlook and Summary. Please use this information at your own
Fundamental Shifts Impacting U.S. Agriculture
 Fundamental Shifts Impacting U.S. Agriculture Richard Brock California Grain & Feed Association San Diego, CA April 28, Game Changers 3 fundamental shifts Long term Impact $2 cotton in 2011 industry will
2019 Grain Market Outlook
 2019 Grain Market Outlook 2018 Ag Lenders Conferences Garden City & Manhattan, Kansas October 9-10, 2018 DANIEL O BRIEN EXTENSION AGRICULTURAL ECONOMIST Topics to be discussed.. 1) U.S. Foreign Trade Uncertainty
SWINE MARKET OUTLOOK
 2017 IOWA PORK REGIONAL CONFERENCES February 20-24, 2017 SWINE MARKET OUTLOOK Lee Schulz, Department of Economics, Iowa State University (515) 294-3356; lschulz@iastate.edu U.S. Corn Supply and Use 2013
June 9, USDA World Supply and Demand Estimates
 June 9, 2017 - USDA World Supply and Demand Estimates Corn Market Reaction: July 2017 corn futures closed up 2 cents at $3.87 ¾ with a trading range for the day of $3.80 ¾ to $3.89 ½. December 2017 corn
WikiLeaks Document Release
 WikiLeaks Document Release February 2, 2009 Congressional Research Service Report 98-253 U.S. Agricultural Trade: Trends, Composition, Direction, and Policy Charles E. Hanrahan, Resources, Science; Beverly
2016 Risk and Profit Conference General Session Speakers. GENERAL SESSION IV Grain Market Situation and Outlook
 2016 Risk and Profit Conference General Session Speakers GENERAL SESSION IV Grain Market Situation and Outlook Dan O Brien, Kansas State University Daniel O Brien was raised on a grain and livestock farm
May 12, Dear Subscriber: We will be adding material to this shell letter after todays reports are released at 11:00 a.m.
 May 12, 2015 Dear Subscriber: We will be adding material to this shell letter after todays reports are released at 11:00 a.m. Be sure to click back on the link often for the latest information. Whle today
Wheat Market Outlook for
 Wheat Market Outlook for 2018-2019 2018 KSU Wheat Schools Ness City & Lenora, Kansas DANIEL O BRIEN EXTENSION AGRICULTURAL ECONOMIST Topics to be discussed.. 1) U.S.-China Trade & Other Key Grain Market
Iowa Farm Outlook. Higher Production Trims Livestock Prices, Cash Receipts. May 2017 Ames, Iowa Econ. Info. 2085
 Iowa Farm Outlook 0BDepartment of Economics May 2017 Ames, Iowa Econ. Info. 2085 Higher Production Trims Livestock Prices, Cash Receipts In Iowa, the livestock industry is a significant part of the state
Emerging Issues: Uncertainty in U.S. Ag Policy and Trade. Ohio Soybean Association- August 29, 2018 Ben Brown
 Emerging Issues: Uncertainty in U.S. Ag Policy and Trade Ohio Soybean Association- August 29, 2018 Ben Brown Most Common Questions The U.S. can sell more soybeans to other buyers, right? Example: would
Commodity Market Outlook
 Commodity Market Outlook Jim Hilker Professor and MSU Extension Economist Department of Agricultural, Food, and Resource Economics Michigan State University Market Outlook Reports for January 6, 2017 (Written
Soybean Supply and Demand Forecast
 Soybean Supply and Demand Forecast U.S. soybean planted acreage is expected to increase 5.7 million acres over the forecast period. U.S. soybean yields are expected to increase 2.2 bushels per acre or
Pork Packer Capacity
 September 1, 27 Ames, Iowa Econ. Info. 1965 Pork Packer Capacity Growing hog inventories, improved hog health, and increased imports from Canada will increase the supply of hogs this fall. At the same
Agricultural Outlook Forum Presented: February 17, 2006 TRENDS IN CHINESE FOOD DEMAND AND TRADE PATTERNS
 Agricultural Outlook Forum Presented: February 17, 2006 TRENDS IN CHINESE FOOD DEMAND AND TRADE PATTERNS Fred Gale Senior Economist Economic Research Service, USDA TRENDS IN CHINESE FOOD DEMAND AND TRADE
Game Changers. Fundamental shifts Long term Impact
 Game Changers Fundamental shifts Long term Impact Over The Past Three Years The U.S. co-op system has been cut by more than 50%. The world s largest seed genetics and chemical firms have merged, cutting
International Ag issues Trends in the Local Food Market Presentation For The NSAC Far West Chapter Annual Meeting May 23, 2013
 International Ag issues Trends in the Local Food Market Presentation For The NSAC Far West Chapter Annual Meeting May 23, 2013 William Matthews University of California Agricultural Issues Center UC Agricultural
Situation and Outlook of the Canadian Livestock Industry
 Situation and Outlook of the Canadian Livestock Industry 2011 USDA Agricultural Outlook Forum Tyler Fulton February 25, 2011 tyler@hamsmarketing.ca Lost in Translation Canadian Livestock Industry - Outline
January 12, USDA World Supply and Demand Estimates
 January 12, 2017 - USDA World Supply and Demand Estimates Corn This month s U.S. corn outlook is for lower production, reduced feed and residual use, increased corn used to produce ethanol, and smaller
LAGGING EXPORTS SLIGHTLY NEGATIVE TO CORN PRICES
 November 5, 2001 Ames, Iowa Econ. Info. 1825 LAGGING EXPORTS SLIGHTLY NEGATIVE TO CORN PRICES While current utilization projections show record corn use for the year ahead, the slow start for corn export
December 12, USDA World Supply and Demand Estimates
 December 12, 2017 - USDA World Supply and Demand Estimates Corn Market Reaction: March 2018 corn futures closed down 1 ¼ cents at $3.47 ¾ with a trading range for the day of $3.47 ½ to $3.53. December
2017/18 Crop Market Outlook & Strategies
 2017/18 Crop Market Outlook & Strategies Frayne Olson, PhD Crop Economist/Marketing Specialist Director Burdick Center for Cooperatives frayne.olson@ndsu.edu 701-231-7377 (o) 701-715-3673 (c) NDSU Extension
Crop Market Outlook: Where do we go from here?
 2012-13 Crop Market Outlook: Where do we go from here? Frayne Olson, PhD Crop Economist/Marketing Specialist NDSU Extension Service ND Agricultural Experiment Station Dept. of Agribusiness & Applied Economics
Crop Outlook: Now What?!
 Crop Outlook: Now What?! Frayne Olson, PhD Crop Economist/Marketing Specialist frayne.olson@ndsu.edu 701-231-7377 NDSU Extension Service ND Agricultural Experiment Station Dept. of Agribusiness & Applied
North Carolina Agriculture: Situation and Outlook
 North Carolina Agriculture: Situation and Outlook Blake Brown, PhD Extension Economist & Hugh C. Kiger Professor Department of Agricultural and Resource Economics North Carolina State University NC Agriculture
Agriculture Commodity Markets & Trends
 Agriculture Commodity Markets & Trends Agenda Short History of Agriculture Commodities US & World Supply and Demand Commodity Prices Continuous Charts What is Contango and Backwardation Barge, Truck and
Agriculture: expansions highlighted developments
 Agriculture: expansions highlighted developments A broad-based expansion in livestock production and another bumper grain harvest highlighted agricultural developments in 1976. Meat production rose 9 percent
2019 Grain Market Outlook
 2019 Grain Market Outlook Ness City, Kansas January 7, 2019 DANIEL O BRIEN EXTENSION AGRICULTURAL ECONOMIST Topics to be discussed.. 1) Macroconomic forces at work in the U.S. & where they are taking U.S.
Nathan Kauffman Economist Federal Reserve Bank of Kansas City Omaha Branch June 6, 2013
 Nathan Kauffman Economist June 6, 213 The views expressed are those of the author and do not necessarily reflect the opinions of the Federal Reserve Bank of Kansas City or the Federal Reserve System. 6
CORN: USDA REPORTS FAIL TO CONFIRM SMALLER SUPPLIES
 CORN: USDA REPORTS FAIL TO CONFIRM SMALLER SUPPLIES JANUARY 2001 Darrel Good No. 1 Summary Corn prices managed a significant rally from late September to late December 2000, partially on anticipation of
The Outlook for Grain Markets and Texas Agriculture in Emily Kerr and Michael Plante
 The Outlook for Grain Markets and Texas Agriculture in 2013 Emily Kerr and Michael Plante Share of world production, 2000-2010 average 45% U.S. dominates world production of corn, soy 40% 40% 38% 35% 30%
How Trade Liberalization Can Benefit the Environment (or The Fallacy of Food Miles )
") How Trade Liberalization Can Benefit the Environment (or The Fallacy of Food Miles ) Robert L. Thompson Gardner Endowed Chair in Agricultural Policy University of Illinois at Urbana-Champaign 12 May 2008
How Trade Liberalization Can Benefit the Environment (or The Fallacy of Food Miles ) Robert L. Thompson Gardner Endowed Chair in Agricultural Policy University of Illinois at Urbana-Champaign 12 May 2008
Cattle Situation and Outlook
 Cattle Situation and Outlook Tim Petry, Livestock Economist www.ndsu.edu/livestockeconomics SEP 2018 Outlook-9-15-2018.pptx Livestock Fundamental Highlights Record meat production in 2018 (beef, pork,
Grains & Oilseeds Outlook. USDA's Interagency Commodity Estimates Grains and Oilseeds Committees
 Agricultural Outlook Forum Presented: February 23-24, 2012 U.S. Department of Agriculture Grains & Oilseeds Outlook USDA's Interagency Commodity Estimates Grains and Oilseeds Committees United States Department
Fall Crop Outlook Webinar
 Fall Crop Outlook Webinar Chris Hurt, Professor, Department of Agricultural Economics Michael Langemeier, Associate Director, Center for Commercial Agriculture James Mintert, Director, Center for Commercial
World Agricultural Supply And Demand Estimates
 World Agricultural Supply And Demand Estimates United States Department of Agriculture Office of the Chief Economist Agricultural Marketing Service Economic Research Service Farm Service Agency Foreign
World Agricultural Supply And Demand Estimates
 World Agricultural Supply And Demand Estimates United States Department of Agriculture Office of the Chief Economist Agricultural Marketing Service Economic Research Service Farm Service Agency Foreign
CORN: BETTER DEMAND, PRODUCTION CONCERNS
 CORN: BETTER DEMAND, PRODUCTION CONCERNS April 2000 Darrel Good Summary The USDA s March Grain Stocks report, released on March 31, confirmed a high rate of domestic corn use during the second quarter
Iowa Pork Congress Meat Sector Outlook. Steve R. Meyer, Ph.D. Paragon Economics, Inc. Paragon Economics, Inc. From information, knowledge
 Iowa Pork Congress 2012 Meat Sector Outlook Steve R. Meyer, Ph.D. Key issues for 12 pork producer profits Exports Exchange rates, trade policy, disease status U.S. demand U.S. economy, prices of competitor
Steven D. Johnson. Presentation Objectives
 April 2014 Steven D. Johnson Farm & Ag Business Management Specialist (515) 957-5790 sdjohns@iastate.edu www.extension.iastate.edu/polk/farm-management Presentation Objectives Review the latest Corn &
The Outlook for the Swine Industry and Its Relationship with the Global Economy
 The Outlook for the Swine Industry and Its Relationship with the Global Economy Allen D. Leman Swine Conference September 19, 2011 Brian C. Briggeman Associate Professor and Director of the Arthur Capper
THIS REPORT CONTAINS ASSESSMENTS OF COMMODITY AND TRADE ISSUES MADE BY USDA STAFF AND NOT NECESSARILY STATEMENTS OF OFFICIAL U.S.
 THIS REPORT CONTAINS ASSESSMENTS OF COMMODITY AND TRADE ISSUES MADE BY USDA STAFF AND NOT NECESSARILY STATEMENTS OF OFFICIAL U.S. GOVERNMENT POLICY Required Report - public distribution Date: 2/27/2019
June 12, USDA World Supply and Demand Estimates
 June 12, 2018 - USDA World Supply and Demand Estimates Corn Market Reaction: July 2018 corn futures closed up 10 ¼ cents at $3.77 ½ with a trading range for the day of $3.67 ¼ to $3.79 ½. December 2018
CORN: DECLINING WORLD GRAIN STOCKS OFFERS POTENTIAL FOR HIGHER PRICES
 CORN: DECLINING WORLD GRAIN STOCKS OFFERS POTENTIAL FOR HIGHER PRICES OCTOBER 2000 Darrel Good Summary The 2000 U.S. corn crop is now estimated at 10.192 billion bushels, 755 million (8 percent) larger
Market Fundamentals. August October 2017
 Market Fundamentals August October 2017 1 Safe Harbor Statement & Disclosures This presentation includes forward-looking comments subject to important risks and uncertainties. It may also contain financial
Protectionist View Impacts on American Agriculture VERONICA NIGH AMERICAN FARM BUREAU FEDERATION 11/13/2018
 Protectionist View Impacts on American Agriculture VERONICA NIGH AMERICAN FARM BUREAU FEDERATION 11/13/2018 What s Changed and What Hasn t Trade is Still Important FTA Renegotiation Finally Concluding
Ag Outlook Webinar. Chris Hurt, Professor, Department of Agricultural Economics
 Ag Outlook Webinar Chris Hurt, Professor, Department of Agricultural Economics Michael Langemeier, Associate Director, Center for Commercial Agriculture James Mintert, Director, Center for Commercial Agriculture
Low prices last year induced a decline in global wheat area, and as a result production increased less than 1%, helping to support an expected price i
 Wheat Low prices last year induced a decline in global wheat area, and as a result production increased less than 1%, helping to support an expected price increase in 2017/18. It is expected that prices
2016 Outlook and Crop Comparisons March 2016
 2016 Outlook and Crop Comparisons March 2016 Amanda R. Smith, University of Georgia Nathan B. Smith, Clemson University Row Crops Market Situation 2015 U.S. yields overall were strong and thus production
2/19/2014. Bunge North America. Highlights of the Past 12 Months. US Weather
 Bunge North America Flat Price Risk Virginia State Feed Association Conference And Nutritional Management Cow College February 2014 Foreign Currency Commercials/Funds (Boards of Trade) Freight Weather