USDA lowered the 2010/11 wheat carry out by 49 million and decreased 2010/11 Yield by.2 bushels/acre.
|
|
|
- Antony Wilkerson
- 5 years ago
- Views:
Transcription


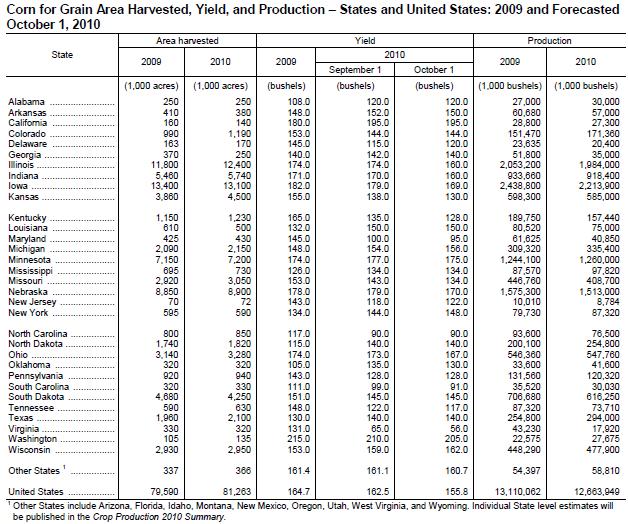
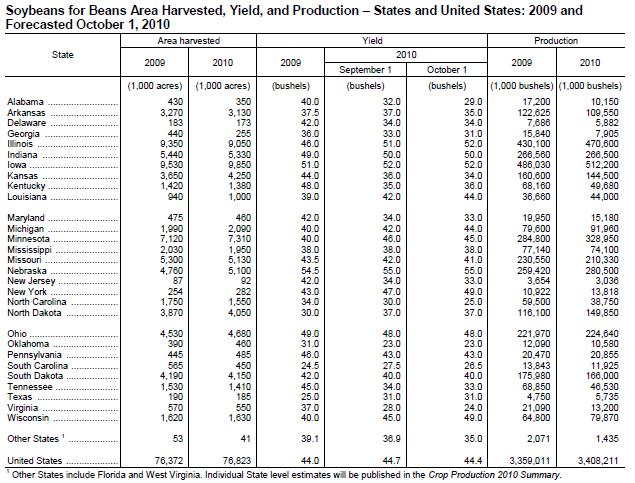
1 Friday October 8 th 2010 World Ag Supply & Demand Estimates Very Bullish for Corn Bullish for Soybeans Friendly U.S. Wheat USDA lowered the 2010/11 corn carry out by 214 million and decreased 2010/11 Yield by 6.7 bushels/acre. The corn yield is 4.3 bushel below the average trade estimate. USDA lowered the 2010/11 soybean carry out by 85 million and decreased 2010/11 Yield by.3 bushels/acre. The soybean yield is.47 bushel below the average trade estimate. USDA lowered the 2010/11 wheat carry out by 49 million and decreased 2010/11 Yield by.2 bushels/acre.
2 U.S. corn production for 2010/11 is forecast 496 million bushels lower as a 258,000-acre increase in harvested area is more than offset by a 6.7-bushel-per-acre reduction in yield to bushels per acre and endings stock of 902 million. As forecast, this year s yield and production still would be the third highest on record. Higher 2010/11 corn beginning stocks raise prospects for 2010/11 feed and residual disappearance, especially during the September-December quarter. Ending stocks for 2009/10 are raised 322 million bushels based on the September 1 stocks estimate. U.S. feed grain projected supplies: A number of changes are made this month to 2009/10 corn usage with the biggest a 358- million bushel reduction in feed and residual use as indicated by the September 1 stocks and small upward revisions to exports and food, seed, and industrial (FSI) use based on the latest available data. Sorghum FSI use and exports for 2009/10 are also lowered slightly this month. Changes to 2009/10 feed and residual use for barley and oats reflect small revisions to June 1 stocks from the September 30 Grain Stocks report. Global coarse grain supplies for 2010/11 are nearly unchanged with lower U.S. supplies offset by increased foreign coarse grain production. World corn production is lowered 6.4 million tons with the lower U.S. production and a 0.5-million-ton reduction for Russia only partly offset by increases for Argentina, Serbia, EU-27, and several Sub-Saharan Africa countries. Production for Argentina is raised 4.0 million tons on higher expected area as rising corn prices and favorable early season soil moisture support a rapid pace of early corn planting. Global barley production is lowered 1.4 million tons with reductions of 0.7 million tons for EU-27, 0.5 million tons for Russia, and 0.3 million tons for Canada. U.S. soybean exports are increased 35 million bushels to billion reflecting strong export sales and reduced export prospects for Argentina resulting from lower beginning stocks. Soybean crush is raised 15 million bushels to billion due to improved prospects for domestic soybean meal disappearance and to a small reduction in the projected soybean meal extraction rate. The September 1 soybean stocks estimate confirmed a third consecutive marketing year of relatively low residual use. For 2010/11 residual use is reduced to 32 million bushels, down 38 million from the previous estimate. U.S. Oilseed & Soybean Production for 2010/11 is projected at million tons, down 2 million from last month. Soybean production is forecast at billion bushels, down 75 million based on both lower harvested area and yield. Harvested area is reduced 1.2 million acres to 76.8 million. The soybean yield is projected at 44.4 bushels per acre, down 0.3 bushels. Soybean ending stocks are projected at 265 million bushels, down 85 million from last month. Sunflowerseed and peanut production are also projected lower this month while canola and cottonseed production are projected higher. Global oilseed 2010/11 production is projected at million tons, unchanged from last month. Global soybean production is projected at million tons, up 0.4 million. Brazil soybean production is raised to 67 million tons, up 2 million due to increased area. India soybean production is raised 0.4 million tons to 9.2 million, also due to increased harvested area. Global sunflowerseed production is reduced this month as lower production for Russia is only partly offset by an increase for Ukraine. Other changes include increased cottonseed production for Australia and India. Global oilseed stocks for 2010/11 are reduced 1.7 million tons to 71.4 million. Soybeans account for most of the change, with a reduction for the United States partly offset by projected increases for Brazil and China. U.S. wheat supplies for 2010/11 are projected 49 million bushels lower this month with lower estimated production and higher expected feed and residual use. Production is lowered 41 million bushels based on the Small Grains 2010 Summary report. Feed and residual use is raised 10 million bushels on higher-than-expected disappearance during the June-August quarter as indicated by the September 1 stocks. Global wheat stocks for 2010/11 are 1.0 million tons lower mostly reflecting lower production in the United States. World production for 2010/11 is projected at million tons, down 1.6 million tons from last month; however, beginning stocks are raised 0.6 million tons with upwardly revised 2009/10 production estimates for South America & Canada.
3 Corn 2009/10 corn balance sheet included an increase of ending stocks for 2009/10 by 322 million bushels based on the September 1 stocks estimate. U.S. Corn 2010/11 ending stocks forecast are estimated at 902 million bushels, 805 million bushels lower than the 2009/10 carry out for corn. USDA increased carry in, decreased expected production by 496 million and increased demand by 40 million for reduction in the 2010/11 carry out by 213 million. The season-average 2010/11 farm price is projected at a range of $4.60 to $5.40 per bushel compared with the 2009/10 forecast of $3.55 per bushel. USDA and raised the 2010/11 price by $0.60 on both the lower and upper end of the range. 2010/11 ending stocks of 902 million bushel estimates provides for a 6.7% carry out as compared to a 8.3% Carry Out / Use ratio last month and represents 24 days of usage as compared to 30 estimated last month. The early look is used to provide an idea that nearly 6 million more acres of corn may be needed next year to keep adequate corn stocks available using projected demand forecasts. Expected higher prices should throttle back demand from the forecast levels shown above.
4 Soybeans U.S. Soybean 2009/10 ending stocks essentially unchanged at million bushels this month. USDA WASDE Report U.S. Soybean 2010/11 ending stocks projected at 265 million a decrease of 85 million from last month but up 114 million as compared to 2009/10 ending stocks. USDA decreased harvested area by 1.2 million acres, decreased expected production 76 million and increased demand by 10 million. The U.S. season-average farm soybean price for 2010/11 is projected at $10.00 to $11.50 per bushel compared with $9.59 per bushel in 2009/10. USDA increased expected 2010/11 price range by $0.85 per bushel on both ends of the price range. Soybean meal prices are forecast at $290 to $330 per ton compared with $311 per ton for 2009/10. Soybean oil prices are projected at 39.5 to 43.5 cents per pound compared with cents for 2009/10. The 2010/11 ending stocks estimated of 265 million bushel provides for a 8.0% Carry Out / Use ratio for the 2010 crop year as compared to 10.6% last month and represents 29 days of usage as compared to 39 days last month. The early look is used to provide an idea that we could give up 700 thousand acres of soybeans next year and keep adequate but snug soybeans stocks available using projected demand forecasts. Expected higher prices should throttle back demand from the forecast levels shown above.

5 Wheat U.S. wheat ending stocks for 2009/10 are projected at 973 million bushels, up 43 million. 2010/11 U.S. wheat ending stocks projected at billion up 102 million even with higher expected domestic use. The U.S. season-average farm wheat price for 2010/11 is projected at $5.20 to $5.80 per bushel compared with $4.87 per bushel in 2009/10. USDA increased the 2010/11 expected price by $0.25 on the upper end and by $0.15 lower end of the range. The U.S wheat carry out of 853 million is considered burdensome, however world supply is also decreasing compared to last year at mmt is nearing the 2008/09 carry out of mmt. U.S. 2010/11 ending stocks estimated of 853 million bushel provides for a 34.9% Carry Out / Use ratio for the 2010 crop year as compared to 37.0% forecast last month and represents 127 days of usage as compared to 135 days forecast last month. The early look is used to provide an idea that we could have an increase of only 1.4 million more acres of wheat next year and keep adequate but snug wheat stocks available using projected demand forecasts. Expected higher prices should throttle back demand from the forecast levels shown above and expected higher corn prices will likely cut into planed spring wheat acres.
, up 2.0% from a year ago (Figure 1). The 1.708 bb September 1st corn stocks figure was 301 mb or 21.")
6 Year to Year Change Corn Stocks on September 1st 2010 Corn Stocks In its September 30th report, the USDA National Agricultural Statistical Service (NASS) estimated U.S. corn stocks in all positions on September 1, 2010 to be billion bushels (bb), up 2.0% from a year ago (Figure 1). The bb September 1st corn stocks figure was 301 mb or 21.4% larger than average pre-report expectations of private analysts, and greater than the upper end of the pre-report estimate range (i.e., from to bb). Of this total, bb were stored on farms, with bb stored off farms. Figure1. shows generally increasing trends for U.S. total supplies and quarterly corn stocks on December 1st, March 1 st since the mid-1990s, a slower rate of increase or leveling off of June 1st corn stocks, and steady to slightly lower September 1st corn stocks since MY September 1st U.S. corn stocks of bb was the largest amount of U.S. September 1st corn stocks since 2006, but still only moderately larger than the average (1.612 bb) and median (1.673 bb) U.S. September 1 st stocks estimates for MY through MY which have ranged from bb to bb.
. This equaled pre-report estimates, and is smaller than the 11 year average Se")

7 Soybean Stocks on September 1st 2010 Soybean Stocks: The USDA NASS estimate of U.S. soybean stocks in all positions on September 1st 2010 totaled mb, up 9% from mb the previous year (Figure 3). This equaled pre-report estimates, and is smaller than the 11 year average September 1st U.S. soybean stocks estimate of 273 mb since MY , being the 3rd smallest for that period (i.e., larger than mb in MY and mb in MY ). Of the mb total, 35.4 mb were stored on farms, with mb stored off farms. Figure 3 shows generally increasing total supplies of U.S. soybeans since the late 1980s, but a recent trend toward decreasing quarterly September 1st stocks since Wheat Stocks on September 1st 2010 Wheat Stocks: It was estimated by USDA NASS that U.S. wheat stocks in all positions on September 1st 2010 totaled bb, up 11% from bb a year ago, and the largest amount of September 1st wheat stocks since MY (Figure 5). This September 1st U.S. wheat stocks figure was only 19 mb or 0.7% more than average pre-report expectations of private analysts, and within the range of pre-report estimates (i.e., to bb). Of this U.S. total, bb were stored on farms, with bb stored off farms on September 1st. Figure 5 shows increasing total supplies and increasing September 1st stocks of U.S. wheat since MY


8 Carry out Matrix The 2010/11 Corn Balance sheet matrix shows potential yield and acres scenarios. The 2010/11 Soybean Balance sheet matrix shows potential yield and acres scenarios. The 2010/11 Wheat Balance sheet matrix shows potential yield and acres scenarios. The RED highlighted matrix cells indicate stocks to use carry out ratio that typically has been considered tight.
9
10
USDA lowered the 2010/11 wheat carry out by 5 million and decreased 2010/11 Yield by.3 bushels/acre.
 Tuesday November 9 th 2010 World Ag Supply & Demand Estimates Slightly Bullish for Corn More Bullish for Soybeans Friendly U.S. Wheat USDA lowered the 2010/11 corn carry out by 75 million and decreased
USDA WASDE Report. Friday April 9 th 2010 World AG Supply & Demand Estimates. Office Friday April 09, 2010
 Friday April 9 th 2010 World AG Supply & Demand Estimates The trade was expecting the new carry out to incorporate additional stocks resulting from the March 31 grain stocks report which was not reflected
Friday Aug 10, 2012 World Ag Supply & Demand Report
 Friday Aug 10, 2012 World Ag Supply & Demand Report U.S. 2011/12 Old Crop Corn is Supportive Global Old Crop Corn is Slightly Bearish USDA estimates the 2011/12 U.S. corn carryout at 1,021 million bushels,
April 9, Dear Subscriber:
 April 9, 2014 Dear Subscriber: We will be adding material to this shell letter after the report is released on April 9, 2014 at 11:00 a.m CST. Be sure to click back on the link often for the latest information.
Summary of WASDE and Production USDA
 Summary of WASDE and Production USDA The following information are summary and extracts from the latest, AUG 2016, WASDE and World Agricultural Production reports provided by the United States Department
January 9, 2014 WE WILL BE UPDATING AND ADDING MATERIAL THROUGHOUT THE DAY ON JANUARY 10 TO THIS LETTER BEGINNING AT 11:00 AM CST.
 January 9, 2014 WE WILL BE UPDATING AND ADDING MATERIAL THROUGHOUT THE DAY ON JANUARY 10 TO THIS LETTER BEGINNING AT 11:00 AM CST. PLEASE CHECK BACK OFTEN THROUGHOUT THE DAY FOR THE LATEST INFORMATION!
Wednesday July 11, 2012 World Ag Supply & Demand Report
 World Ag Supply & Demand Report U.S. 2011/12 Old Crop Corn is neutral Global Old Crop Corn is neutral USDA estimates the 2011/12 U.S. corn carryout at 903 million bushels, up from 851 million bushels from
December 2 nd in Lafayette Indiana and Monticello Illinois December 3 rd in Jacksonville, Illinois
 November 8, 2013 WE WILL BE UPDATING AND ADDING MATERIAL THROUGHOUT THE DAY ON NOVEMBER 8 TO THIS LETTER BEGINNING AT 11:00 AM CST. PLEASE CHECK BACK OFTEN FOR THE LATEST INFORMATION! This morning (Friday,
April 9, Dear Subscriber: We will be adding material to this shell letter after todays reports are released at 11:00 a.m.
 April 9, 2015 Dear Subscriber: We will be adding material to this shell letter after todays reports are released at 11:00 a.m. Be sure to click back on the link often for the latest information. While
June 12, USDA June 2013 Wheat Production for 2013 in billions of bushels - released June 12, USDA June 2013 Estimate.
 June 12, 2013 WE WILL BE UPDATING AND ADDING MATERIAL THROUGHOUT THE DAY ON JUNE 12 TO THIS LETTER BEGINNING AT 11:00 AM CST. PLEASE CHECK BACK OFTEN FOR THE LATEST INFORMATION! This morning (Wednesday,
Analysis of the October 2010 USDA Crop Production & WASDE Reports
 Analysis of the October 2010 USDA Crop Production & WASDE Reports Daniel O Brien Extension Agricultural Economist, K State Research and Extension October 11, 2010 Summary of October 8 th 2010 Crop Production
March 10, Dear Subscriber:
 March 10, 2014 Dear Subscriber: We will be adding material to this shell letter after the report is released on March 10 at 11:00 a.m CST. Be sure to click back on the link often for the latest information.
May 12, Dear Subscriber: We will be adding material to this shell letter after todays reports are released at 11:00 a.m.
 May 12, 2015 Dear Subscriber: We will be adding material to this shell letter after todays reports are released at 11:00 a.m. Be sure to click back on the link often for the latest information. Whle today
January 12, USDA World Supply and Demand Estimates
 January 12, 2017 - USDA World Supply and Demand Estimates Corn This month s U.S. corn outlook is for lower production, reduced feed and residual use, increased corn used to produce ethanol, and smaller
February 10, Dear Subscriber: We will be adding material to this shell letter after todays reports are released at 11:00 a.m.
 February 10, 2015 Dear Subscriber: We will be adding material to this shell letter after todays reports are released at 11:00 a.m. Be sure to click back on the link often for the latest information. Before
January 12, USDA World Supply and Demand Estimates
 January 12, 2018 - USDA World Supply and Demand Estimates Corn Market Reaction: March 2018 corn futures closed down 2 ½ cents at $3.46 ¼ with a trading range for the day of $3.45 ½ to $3.50. December 2018
December 12, USDA World Supply and Demand Estimates
 December 12, 2017 - USDA World Supply and Demand Estimates Corn Market Reaction: March 2018 corn futures closed down 1 ¼ cents at $3.47 ¾ with a trading range for the day of $3.47 ½ to $3.53. December
June 9, USDA World Supply and Demand Estimates
 June 9, 2017 - USDA World Supply and Demand Estimates Corn Market Reaction: July 2017 corn futures closed up 2 cents at $3.87 ¾ with a trading range for the day of $3.80 ¾ to $3.89 ½. December 2017 corn
August 10, USDA World Supply and Demand Estimates
 August 10, 2017 - USDA World Supply and Demand Estimates Corn Market Reaction: September 2017 corn futures closed down 15 cents at $3.57 ¼ with a trading range for the day of $3.56 ½ to $3.75 ½. December
June 12, USDA World Supply and Demand Estimates
 June 12, 2018 - USDA World Supply and Demand Estimates Corn Market Reaction: July 2018 corn futures closed up 10 ¼ cents at $3.77 ½ with a trading range for the day of $3.67 ¼ to $3.79 ½. December 2018
May 10, USDA World Supply and Demand Estimates
 May 10, 2018 - USDA World Supply and Demand Estimates Corn Market Reaction: July 2018 corn futures closed down ¾ cent at $4.02 with a trading range for the day of $4.00 to $4.07. December 2018 corn futures
September 12, USDA World Supply and Demand Estimates
 September 12, 2018 - USDA World Supply and Demand Estimates Corn Market Reaction: December 2018 corn futures closed down 14 ¼ cents at $3.52 ½ with a trading range for the day of $3.50 ¾ to $3.66 ¼. December
World Agricultural Supply and Demand Estimates United States Department of Agriculture
 ISSN1554-9089 Office of the Chief Economist World Agricultural Supply and Demand Estimates United States Department of Agriculture Agricultural Marketing Service Farm Service Agency Economic Research Service
World Agricultural Supply And Demand Estimates
 United States Department of Agriculture Office of the Chief Economist World Agricultural Supply And Demand Estimates Agricultural Marketing Service Economic Research Service Farm Service Agency Foreign
NOVEMBER 2017 USDA SUPPLY/DEMAND ESTIMATES. Overview
 NOVEMBER 2017 USDA SUPPLY/DEMAND ESTIMATES Overview Corn: This month s 2017/18 U.S. corn outlook included larger production, increased feed use and exports, and higher ending stocks. Corn production is
Corn & Soybeans. Corn (source WASDE) Soybean (source WASDE)
 Soybean (source WASDE)") Corn & Soybeans Corn (source WASDE) Estimate for the 2016-17 Season Global and US outlook Soybean (source WASDE) Estimate for the 2016-17 Season Global and US outlook Corn and Soybeans prices (Source CME)
Corn & Soybeans Corn (source WASDE) Estimate for the 2016-17 Season Global and US outlook Soybean (source WASDE) Estimate for the 2016-17 Season Global and US outlook Corn and Soybeans prices (Source CME)
CORN: DECLINING WORLD GRAIN STOCKS OFFERS POTENTIAL FOR HIGHER PRICES
 CORN: DECLINING WORLD GRAIN STOCKS OFFERS POTENTIAL FOR HIGHER PRICES OCTOBER 2000 Darrel Good Summary The 2000 U.S. corn crop is now estimated at 10.192 billion bushels, 755 million (8 percent) larger
WORLD AGRICULTURAL SUPPLY AND DEMAND ESTIMATES
 WORLD AGRICULTURAL SUPPLY AND DEMAND ESTIMATES United States Department of Agriculture Washington, D.C. Approved by the World Agricultural Outlook Board WASDE-339 - June 12, 1998 NOTE Because planting
Grain Market Outlook for
 Grain Market Outlook for 2017-2018 KSU Ag Econ 520 Fall 2017 Manhattan, Kansas DANIEL O BRIEN EXTENSION AGRICULTURAL ECONOMIST Topics to be discussed.. 1) Grain Market Analysis & Outlook Corn & Grain Sorghum
SOYBEANS: AN EARLY WEATHER MARKET
 SOYBEANS: AN EARLY WEATHER MARKET January 2000 Darrel Good Summary 1999 U.S. Crop Estimate Revised Lower Soybean prices have made a modest rally from the mid-december lows, fueled by areas of dry weather
Corn & Soybeans. Corn (source WASDE) Soybean (source WASDE)
 Soybean (source WASDE)") Corn & Soybeans Corn (source WASDE) Estimate for the 2015-16 Season Global and US outlook Soybean (source WASDE) Estimate for the 2015-16 Season Global and US outlook Global ending stocks Corn and Soybeans
Corn & Soybeans Corn (source WASDE) Estimate for the 2015-16 Season Global and US outlook Soybean (source WASDE) Estimate for the 2015-16 Season Global and US outlook Global ending stocks Corn and Soybeans
Grains & Oilseeds Outlook. USDA's Interagency Commodity Estimates Grains and Oilseeds Committees
 Agricultural Outlook Forum Presented: February 23-24, 2012 U.S. Department of Agriculture Grains & Oilseeds Outlook USDA's Interagency Commodity Estimates Grains and Oilseeds Committees United States Department
March 2018 USDA SUPPLY/DEMAND ESTIMATES. Overview
 March 2018 USDA SUPPLY/DEMAND ESTIMATES Overview Corn: This month s 2017/18 U.S. corn outlook is for larger exports and increased corn used to produce ethanol. Corn used to produce ethanol was raised 50
World Agricultural Supply And Demand Estimates
 United States Department of Agriculture Office of the Chief Economist World Agricultural Supply And Demand Estimates Agricultural Marketing Service Economic Research Service Farm Service Agency Foreign
SOYBEANS: LARGE U.S. CROP, WHAT ABOUT SOUTH AMERICA?
 SOYBEANS: LARGE U.S. CROP, WHAT ABOUT SOUTH AMERICA? OCTOBER 2004 Darrel Good 2004 B NO. 8 Summary The USDA now forecasts the 2004 U.S. soybean crop at 3.107 billion bushels, 271 million larger than the
Soybean Supply and Demand Forecast
 Soybean Supply and Demand Forecast U.S. soybean planted acreage is expected to increase 5.7 million acres over the forecast period. U.S. soybean yields are expected to increase 2.2 bushels per acre or
World Agricultural Supply And Demand Estimates
 World Agricultural Supply And Demand Estimates United States Department of Agriculture Office of the Chief Economist Agricultural Marketing Service Economic Research Service Farm Service Agency Foreign
SOYBEANS: LARGE U.S. CROP, WHAT ABOUT SOUTH AMERICA? October 2005 Darrel Good 2005 No. 8
 SOYBEANS: LARGE U.S. CROP, WHAT ABOUT SOUTH AMERICA? October 2005 Darrel Good 2005 No. 8 Summary USDA reports provided two fundamental surprises for the market over the past three weeks. First, the September
Corn & Soybeans. Corn (source WASDE) Soybeans (source WASDE)
 Soybeans (source WASDE)") Corn & Soybeans Corn (source WASDE) Estimate for the 2014-15 Season Global and US outlook Production, utilization and stocks Soybeans (source WASDE) Estimate for the 2014-15 Season Global and US outlook
Corn & Soybeans Corn (source WASDE) Estimate for the 2014-15 Season Global and US outlook Production, utilization and stocks Soybeans (source WASDE) Estimate for the 2014-15 Season Global and US outlook
Reaction to USDA Reports
 August 10, 2012 Reaction to USDA Reports CROP PRODUCTION CORN: 10.779 billion bu.; trade expected 10.971 billion bu. -- compares to 12.358 billion bu. in 2011 BEANS: 2.692 billion bu., trade expected 2.786
CORN: HIGHER PRICES COMES EARLY
 CORN: HIGHER PRICES COMES EARLY OCTOBER 2006 Darrel Good 2006 NO. 7 Summary The 2006 U.S. corn crop is expected to be the third largest ever, but it is small in relation to expected consumption during
SOYBEANS: LOW PRICES TO PERSIST
 SOYBEANS: LOW PRICES TO PERSIST JANUARY 2002 Darrel Good 2002 - NO. 2 Summary Soybean prices received some support from the USDA s January 11 final U.S. production estimate for the 2001 crop. At 2.891
Grain Price SOYBEANS: SMALLER U.S. CROP, WILL SOUTH AMERICA FILL THE GAP? OCTOBER 2002 Darrel Good 2002 NO. 8. Summary
 UNIVERSITY OF ILLINOIS EXTENSION Grain Price OUTLOOK A joint publication of the Department of Agricultural Economics, College of Agriculture, Purdue University, West Lafayette, Indiana, and the Department
World Agricultural Supply And Demand Estimates
 United States Department of Agriculture Office of the Chief Economist World Agricultural Supply And Demand Estimates Agricultural Marketing Service Economic Research Service Farm Service Agency Foreign
2019 Grain Market Outlook
 2019 Grain Market Outlook Sumner County Ag Day Wellington, Kansas January 17, 2019 DANIEL O BRIEN EXTENSION AGRICULTURAL ECONOMIST 1) U.S. Economy 2019 Grain Market Drivers A relatively strong U.S. GDP,
Global Agricultural Supply and Demand: Factors contributing to recent increases in food commodity prices
 Global Agricultural Supply and Demand: Factors contributing to recent increases in food commodity prices Ron Trostle Economic Research Service U.S. Department of Agriculture Agricultural Markets and Food
World Agricultural Supply And Demand Estimates
 United States Department of Agriculture Office of the Chief Economist World Agricultural Supply And Demand Estimates Agricultural Marketing Service Economic Research Service Farm Service Agency Foreign
U.S. Agriculture: Commodity Situation and Outlook
 U.S. Agriculture: Commodity Situation and Outlook H. Scott Stiles Instructor - Economics University of Arkansas Division of Agriculture Farm Policy Education 2013 U.S. Crop Outlook Overview: Preliminary
World Agricultural Supply And Demand Estimates
 United States Department of Agriculture Office of the Chief Economist World Agricultural Supply And Demand Estimates Agricultural Marketing Service Economic Research Service Farm Service Agency Foreign
World Corn Market Supply Demand Trends
 World Corn Market Supply Demand Trends Daniel O Brien Extension Agricultural Economist K State Research and Extension May 27, 21 The world corn market has many participants, but a small number of larger
CORN: USDA REPORTS FAIL TO CONFIRM SMALLER SUPPLIES
 CORN: USDA REPORTS FAIL TO CONFIRM SMALLER SUPPLIES JANUARY 2001 Darrel Good No. 1 Summary Corn prices managed a significant rally from late September to late December 2000, partially on anticipation of
Wheat Market Outlook in Mid June 2016
 Wheat Market Outlook in Mid June 2016 Daniel O Brien Extension Agricultural Economist, K State Research and Extension June 22, 2016 Summary Since the USDA s June 10 th Crop Production and World Agricultural
SOYBEANS: FOCUS ON SOUTH AMERICAN AND U.S. SUPPLY AND CHINESE DEMAND
 SOYBEANS: FOCUS ON SOUTH AMERICAN AND U.S. SUPPLY AND CHINESE DEMAND APRIL 2002 Darrel Good 2002-NO.4 Summary Soybean prices during the first half of the 2001-02 marketing year were well below the prices
SOYBEANS: LARGE SUPPLIES CONFIRMED, BUT WHAT ABOUT 2005 PRODUCTION?
 SOYBEANS: LARGE SUPPLIES CONFIRMED, BUT WHAT ABOUT 2005 PRODUCTION? JANUARY 2005 Darrel Good 2005 NO. 2 Summary USDA s January reports confirmed a record large 2004 U.S. crop, prospects for large year-ending
CORN: WILL ACREAGE REBOUND IN 2002
 CORN: WILL ACREAGE REBOUND IN 2002 JANUARY 2002 Darrel Good 2002 - NO.1 Summary The USDA s Crop Production and Grain Stocks reports released on January 11 reflected a smaller domestic supply of corn and
2018 Corn & Soybean Market Outlook & Strategies Home, Kansas
 2018 Corn & Soybean Market Outlook & Strategies Home, Kansas DANIEL O BRIEN EXTENSION AGRICULTURAL ECONOMIST Topics to be discussed.. 1) Grain Market Analysis & Outlook for 2018 Corn & Grain Sorghum Soybeans
World Agricultural Supply And Demand Estimates
 World Agricultural Supply And Demand Estimates United States Department of Agriculture Office of the Chief Economist Agricultural Marketing Service Economic Research Service Farm Service Agency Foreign
World Agricultural Supply And Demand Estimates
 World Agricultural Supply And Demand Estimates United States Department of Agriculture Office of the Chief Economist Agricultural Marketing Service Economic Research Service Farm Service Agency Foreign
SOYBEANS: SURPLUS GROWS, ACREAGE TO DECLINE
 SOYBEANS: SURPLUS GROWS, ACREAGE TO DECLINE JANUARY 2007 Darrel Good 2007 NO. 2 Summary The 2006 U.S. soybean crop was a record 3.188 billion bushels, but was 16 million smaller than the November 2006
Hancock Farmland Investor
 Hancock Farmland Investor First Quarter 2016 2016 USDA Prospective Plantings Report: Potential Impact on the U.S. Farm Economy Higher expected corn plantings in 2016/17 are projected to boost corn production
November 18, 1996 Ames, Iowa Econ. Info. 1706
 November 18, 1996 Ames, Iowa Econ. Info. 1706 LEAN HOG CARCASS BASIS The new Lean Hog futures contract differs from its predecessor in several ways. It is traded on carcass weight and price rather than
CORN: CROP PROSPECTS TO DOMINATE PRICES
 CORN: CROP PROSPECTS TO DOMINATE PRICES JULY 2002 Darrel Good 2002 NO. 5 Summary The USDA s June Grain Stocks report confirmed a rapid rate of domestic corn consumption during the third quarter of the
SOYBEANS: SMALLER STOCKS, MORE ACRES, AND EARLY WEATHER WORRIES
 SOYBEANS: SMALLER STOCKS, MORE ACRES, AND EARLY WEATHER WORRIES APRIL 2000 Darrel Good Summary March 1, 2000 stocks of soybeans were estimated at 1.397 billion bushels, 60 million less than on the same
Projected U.S. Corn Exports, Acreage and Production Under E-10, E-12 and E-15 Ethanol Policies
 Projected U.S. Corn Exports, Acreage and Production Under E-10, E-12 and E-15 Ethanol Policies Daniel O Brien, Extension Agricultural Economist, K-State Research and Extension July 19, 2010 This article
May 17, 1996 Ames, Iowa Econ. Info PLANTINGS LAG IN EASTERN CORN BELT & SPRING WHEAT AREAS
 May 17, 1996 Ames, Iowa Econ. Info. 1694 PLANTINGS LAG IN EASTERN CORN BELT & SPRING WHEAT AREAS Planting progress will be one of several factors influencing prices in the next several weeks. In contrast
2019 Grain Market Outlook
 2019 Grain Market Outlook Ness City, Kansas January 7, 2019 DANIEL O BRIEN EXTENSION AGRICULTURAL ECONOMIST Topics to be discussed.. 1) Macroconomic forces at work in the U.S. & where they are taking U.S.
Grains Outlook for 2014 SAEA Crops Outlook Organized Symposium Dallas, TX February 4, 2014
 Grains Outlook for 2014 SAEA Crops Outlook Organized Symposium Dallas, TX February 4, 2014 Dr. Nathan B. Smith (UGA) and Dr. Mark Welch (TAMU) Corn Corn Situation Record production. Leveling off of corn-starch
CORN: PRODUCTION EXCEEDS EXPECTATIONS
 CORN: PRODUCTION EXCEEDS EXPECTATIONS OCTOBER 2001 Darrel Good 2001 NO. 7 Summary The USDA's October Crop Production report forecast the 2001 U.S. corn crop at 9.43 billion bushels. The crop is about 540
SOYBEANS: HIGHEST PRICES IN OVER SEVEN YEARS. January 2004 Darrel Good 2004 NO. 2
 SOYBEANS: HIGHEST PRICES IN OVER SEVEN YEARS January 2004 Darrel Good 2004 NO. 2 Summary At 2.418 billion bushels, the 2003 U.S. soybean crop was 34 million bushels smaller than the USDA s November forecast
World Agricultural Supply and Demand Estimates
 World Agricultural Supply and Demand Estimates Report of Interagency Commodity Estimates Committee Forecasts World Agricultural Outlook Board, Chairing Agency Economic Research Service Foreign Agricultural
Economic Research Service Situation and Outlook Report. Lagging U.S. Exports To Exacerbate Soybean Surplus
 Economic Research Service Situation and Outlook Report OCS-18k November 13, 2018 Next release is December 13, 2018 Oil Crops Outlook Mark Ash Mariana Matias Lagging U.S. Exports To Exacerbate Soybean Surplus
2016 Risk and Profit Conference General Session Speakers. GENERAL SESSION IV Grain Market Situation and Outlook
 2016 Risk and Profit Conference General Session Speakers GENERAL SESSION IV Grain Market Situation and Outlook Dan O Brien, Kansas State University Daniel O Brien was raised on a grain and livestock farm
The Role of Agricultural Technology in the Future of Midwest Farms: A Seed Sector View
 The Role of Agricultural Technology in the Future of Midwest Farms: A Seed Sector View Jerry Flint Vice President, Global Initiatives and Sustainability November 27, 218 Insert Agriculture Risk Classification
World Agricultural Supply And Demand Estimates
 World Agricultural Supply And Demand Estimates United States Department of Agriculture Office of the Chief Economist Agricultural Marketing Service Economic Research Service Farm Service Agency Foreign
SOYBEANS: WORLD PRODUCTION CONTINUES TO EXPAND
 SOYBEANS: WORLD PRODUCTION CONTINUES TO EXPAND OCTOBER 2001 Darrel Good 2001-No. 7 Summary The USDA s October Crop Production report forecast the 2001 U.S. soybean crop at 2.907 billion bushels. That forecast
Economic Research Service Situation and Outlook Report. Lagging U.S. Exports To Exacerbate Soybean Surplus
 Economic Research Service Situation and Outlook Report OCS-18k November 13, 2018 Next release is December 13, 2018 Oil Crops Outlook Mark Ash Mariana Matias Lagging U.S. Exports To Exacerbate Soybean Surplus
Feed Outlook. Record Yield Raises Projected Supply. Tom Capehart Olga Liefert
 Economic Research Service Situation and Outlook FDS-18a January 17, 2018 Feed Outlook Tom Capehart tcapehart@ers.usda.gov Olga Liefert oliefert@ers.usda.gov Record Yield Raises Projected Supply The next
KSU Agriculture Today Radio Notes
 KSU Agriculture Today Radio Notes Daniel O Brien, Extension Agricultural Economist, Kansas State University For Radio Program to be aired 10:00-10:15 a.m., Friday, September 8, 2017 I. Grain Futures Closes,
2012 Farm Outlook. Highlights
 2012 Farm Outlook Office of the Chief Economist USDA Highlights A promising spring planting was followed by historic drought. Record high commodity prices followed. Farm incomes are expected to be near
February 10, Tickets are 30 dollars and include a continential breakfast, Beef House lunch, and 25th anniversery hat.
 February 10, 2014 WE WILL BE UPDATING AND ADDING MATERIAL THROUGHOUT THE DAY ON FEBRUARY 10 TO THIS LETTER BEGINNING AT 11:00 AM CST. PLEASE CHECK BACK OFTEN FOR THE LATEST INFORMATION! Tickets for the
MARKET OUTLOOK REPORT Volume 1 Number 1
 MARKET OUTLOOK REPORT Volume 1 Number 1 WHEAT: SITUATION AND OUTLOOK April 17, 2009 Prepared by: Market Analysis Group Grains and Oilseeds Division Food Value Chain Bureau Market and Industry Services
CORN: MARKET TO REFLECT U.S. AND CHINESE CROP PROSPECTS
 CORN: MARKET TO REFLECT U.S. AND CHINESE CROP PROSPECTS JULY 2001 Darrel Good 2001 - No. 6 Summary The USDA s June Acreage and Grain Stocks reports provided some modest fundamental support for the corn
Grain Market Outlook for
 Grain Market Outlook for 2018-2019 2018 KSU Risk & Profit Conference Manhattan, Kansas DANIEL O BRIEN EXTENSION AGRICULTURAL ECONOMIST Topics to be discussed.. 1) U.S.-China Trade & Other Key Grain Market
SOYBEANS: DECLINING EXPORTS, LARGE STOCKS
 SOYBEANS: DECLINING EXPORTS, LARGE STOCKS JANUARY 2006 Darrel Good 2006 NO. 2 Summary At 3.086 billion bushels, the 2005 U.S. soybean crop was 43 million larger than the November forecast and only 38 million
CANADA: OUTLOOK FOR PRINCIPAL FIELD CROPS October 19, 2018
 CANADA: OUTLOOK FOR PRINCIPAL FIELD CROPS October 19, 2018 Market Analysis Group/Crops and Horticulture Division Sector Development and Analysis Directorate/Market and Industry Services Branch Executive
Economic Research Service Situation and Outlook Report
 Economic Research Service Situation and Outlook Report Feed Outlook Tom Capehart tcapehart@ers.usda.gov Olga Liefert oliefert@ers.usda.gov David Olson david.w.olson@ers.usda.gov FDS-18g July 16, 2018 Next
CORN: ATTENTION NOW TURNS TO THE NEW CROP
 CORN: ATTENTION NOW TURNS TO THE NEW CROP APRIL 2002 Darrel Good 2002-No. 3 Summary The USDA s March Grain Stocks report revealed larger corn inventories than the market expected, but recent export activity
Economic Research Service Situation and Outlook Report. WHS-18i September 14, 2018
 Economic Research Service Situation and Outlook Report WHS-18i September 14, 2018 Next release is October 15, 2018 Wheat Outlook Jennifer K. Bond Olga Liefert In this report: - Domestic Outlook - Domestic
Cereals market situation. Committee for the Common Organisation of Agricultural Markets. 30 th August 2018
 Cereals market situation Committee for the Common Organisation of Agricultural Markets 30 th August 2018 Exchange Rates 2 Euro US Dollar exchange rate 3 Euro Argentine Peso and Brazilian Real exchange
Economic Research Service Situation and Outlook Report. First-Quarter Soybean Stocks Are Up Sharply
 Economic Research Service Situation and Outlook Report OCS-19b February 12, 2019 Next release is March 12, 2019 Oil Crops Outlook Mark Ash Mariana Matias First-Quarter Soybean Stocks Are Up Sharply In
Feed Grains Outlook: Shifting Trade Patterns and Implications for the US Acreage Mix. May 23, 2018
 Feed Grains Outlook: Shifting Trade Patterns and Implications for the US Acreage Mix May 23, 2018 The Growth of Chinese Imports May Reshape World Trade in Corn Brazil s Safrinha Crop Could Play a Key Role
Outline of Presentation
 2017 Crop Outlook David Widmar, Sr. Research Associate, Center for Commercial Agriculture Chris Hurt, Professor, Department of Agricultural Economics 2017 Crop Outlook Webinar July 3, 2017 Outline of Presentation
World Agricultural Outlook Board Interagency Commodity Estimates Committee Forecasts. Lockup Briefing April 9, 2014
 World Agricultural Outlook Board Interagency Commodity Estimates Committee Forecasts Lockup Briefing World Wheat Production Country or Region Million Tons World 656.5 712.5 8.5 United States 61.7 58.0-6.0
Commodity Outlook: September 2017 West Central Illinois: July 2017
 Commodity Outlook: September 2017 West Central Illinois: July 2017 William George Senior Agriculture Economist U.S. Department of Agriculture Foreign Agriculture Service Office of Global Analysis Commodity
World Agricultural Supply And Demand Estimates
 World Agricultural Supply And Demand Estimates United States Department of Agriculture Office of the Chief Economist Agricultural Marketing Service Economic Research Service Farm Service Agency Foreign
CORN: FIVE CONSECUTIVE LARGE CROPS?
 CORN: FIVE CONSECUTIVE LARGE CROPS? JULY 2000 Darrel Good Summary The USDA s June Acreage Report revealed that U.S. producers had planted nearly 79.6 million acres of corn in 2000, up from 77.4 million
Feed Outlook. First Forecast for 2017/18 Lowers Corn Supply and Use. Tom Capehart Olga Liefert
 Economic Research Service Situation and Outlook FDS-17e May 12, 2017 Feed Outlook Tom Capehart tcapehart@ers.usda.gov Olga Liefert oliefert@ers.usda.gov First Forecast for 2017/18 Lowers Corn Supply and
UPDATED HOG PRODUCTION ESTIMATED RETURNS
 February 15, 21 Ames, Iowa Econ. Info. 187 UPDATED HOG PRODUCTION ESTIMATED RETURNS The Iowa State University Extension Estimated Livestock Returns have provided a barometer of profitability for the Iowa
Iowa Farm Outlook. December 15, 2004 Ames, Iowa Econ. Info. 1900
 Iowa Farm Outlook December 15, 24 Ames, Iowa Econ. Info. 19 Beef and Pork Price Relationships Historically, beef and pork prices have moved somewhat together. They are substitutes in the consumer s shopping
INTERNATIONAL GRAINS COUNCIL
 INTERNATIONAL GRAINS COUNCIL GRAIN MARKET REPORT www.igc.int GMR No. 420 2 April 2012 WORLD ESTIMATES million tons 08/09 09/10 10/11 11/12 12/13 est forecast proj 23.02 02.04 02.04 WHEAT Production 685