Implications for commodity prices and farm income
|
|
|
- Richard Cummings
- 5 years ago
- Views:
Transcription

1 Implications for commodity prices and farm income Mike Dwyer Director, Global Policy Analysis Office of Global Analysis Foreign Agricultural Service US Department of Agriculture Global Policy Analysis Division Office of Global Analysis


2 Despite drought and cost challenges, U.S. farmers doing very well 2
3 18 $ per bushel (per CWT for rice) Wheat Soybeans Corn Rice ($/cwt) Source: USDA Baseline

4 Cattle Hogs Broilers US $/hundredweight for cattle and hogs & U.S. cents/lb for broilers Source: USDA Baseline
5 Growing global demand projected to keep U.S. net farm income strong Net Farm Income (Billions US$) Source: USDA Baseline & ERS Farm Income Statistics
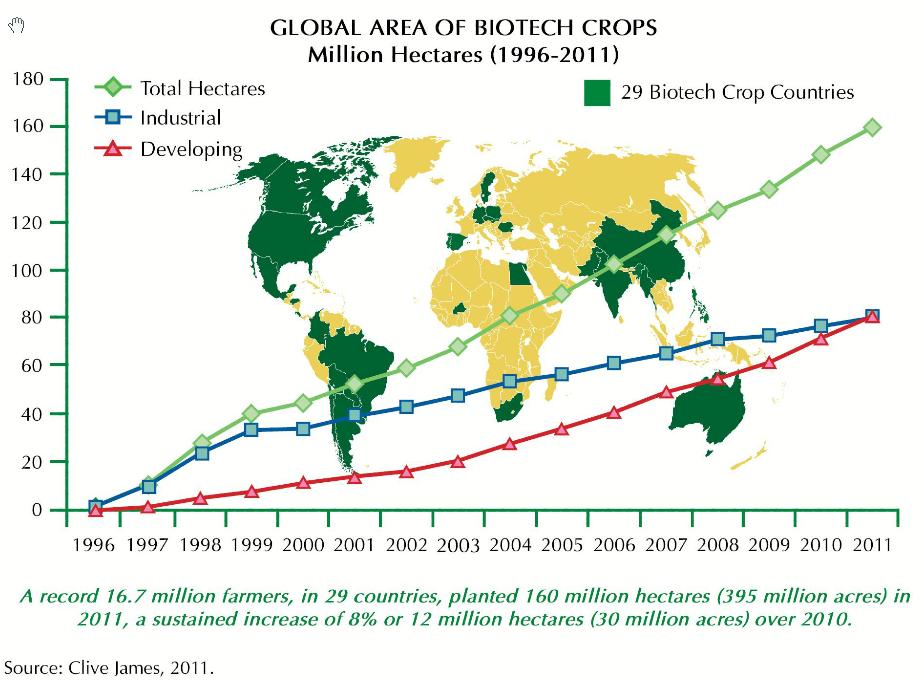
6 1. Global economic growth and the rise of the middle class in developing countries 2. Value of the U.S. dollar 3. Worldwide biofuels production 4. Role of trade and trade liberalization 5. Energy and agricultural input prices 6. Additional crop land 7. Biotech developments
7 Global economy emerged from worst recession in decades in Developing countries performed better and growing faster than developed countries. Same is happening now and is likely to continue for the next decade. Consumer incomes are rising and middle class households are expanding rapidly, especially in large emerging markets. Impact on global food demand will be significant due to higher income elasticities for food in developing countries.


8 Most of the increase will be in developing countries and the impact on worldwide food consumption will be significant 1000 Households w/real PPP incomes greater than $20,000 a year Millions of Households Middle class in developing countries projected to increase 110% by 2022 vs. just 12% in developed countries Developing countries Developed countries 0 Source: Global Insight s Global Consumer Markets data as analyzed by OGA

9 24% of households in these countries are middle class. By 2022, this could increase to 51% and the impact on food consumption will be significant China India Russia Brazil Mexico Indonesia Turkey Thailand Egypt South Korea Philippines Vietnam Malyasia Colombia Taiwan Households w/ Real PPP incomes greater than $20,000 (millions) Proj gains by Source: Global Insight s Global Consumer Markets data as analyzed by OGA
10 Lower income countries spend much of that additional income on food 100% 90% 80% Other Education 70% Recreation 60% 50% 40% Transport & communication Health 30% 20% 10% Furnishings Housing 0% Clothing Food Congo, Dem. Rep. Niger Gambia, The Zambia Ghana Nigeria India China Morocco Namibia Paraguay Jordan Peru Brazil Bosnia Kazakhstan Mexico Macao Israel Malta Italy Australia Canada United States Source: USDA, Economic Research Service using International Comparison Program 2005 data.
11 3,5 3 2,5 2 1,5 1 0,5 0 Ukraine Germany Russia Japan South Korea China UK US Chile Brazil Indonesia Vietnam Mexico Turkey India South Africa Philippines Percent 0,5 1 Data source: World Bank Urban and overall population growth, 2010 Total Urban
12 Changes in Beef, Pork, and Poultry Consumption 2002 vs 2012 (P) 80% 74% 60% 40% 38% 39% 39% 27% 20% 16% 0% 1% 2% EU North East Asia America ( China) China South America FSU SE Asia South Asia Source: USDA Production, Supply & Distribution Database
 EU FSU Mexico 21% 20% 9% 0% 13% 16% MENA 31% SE Asia China South Asia S.")
13 Changes in Grains and Oilseed Meals in Feed Consumption 2002 vs 2012 (P) USA Canada E. Asia ( China) EU FSU Mexico 21% 20% 9% 0% 13% 16% MENA 31% SE Asia China South Asia S. America 63% 67% 69% 70% -25% 0% 25% 50% 75% Source: USDA Production, Supply & Distribution Database


14 115 US Agricultural Trade Weighted Exchange Rate Indexed Value of U.S. Dollar, 2005 = Source: USDA, Economic Research Service; Foreign Agricultural Service
15 Boosts feedstock demand, but recent rate of growth is expected to slow EU Billion Liters Brazil USA 0 Products covered: ethanol & biodiesel for all countries, but omits biodiesel for the US. No cellulosic biofuels included. Source: FAS Annual Biofuel Reports and Washington staff analysis.
16 Global agricultural trade has grown sharply over the past decade should reach $1.1 trillion over next decade. Most countries agricultural imports have increased substantially, esp. China and East/Southeast Asia. U.S. and EU imports growing, too. Almost all major agricultural exporters have seen sharp gains in recent years not just the U.S. FTAs have proliferated worldwide, boosting trade. This will continue with or without the U.S.
17 1.200 Global Agricultural Trade Billions US$ Source: Global Trade Atlas; USDA/FAS/OGA Projections

18 Billions US$ Global Agricultural Imports Developing Developed % +135% Source: GTIS data analyzed by OGA


19 South America, led by Brazil, dominates regional exports Billion Dollars Total Agricultural Export By Latin America Mexico Central America South America Source: USDA FAS


20 EU USA China Russia Japan S. Korea Saudi Arabia Iran Egypt Indonesia Total Agricultural Exports in 2012 (Billion $)
 4 31% 2007 2012 Billion $ 3 2 147% 118% 1 70% 38% 0 Guatemala Costa Rica Honduras Nicaragua El Salvador Panama Data sources:")
21 5 76% Five Year Growth in Exports (2007 vs. 2012) 4 31% Billion $ % 118% 1 70% 38% 0 Guatemala Costa Rica Honduras Nicaragua El Salvador Panama Data sources: Global Trade Atlas Note: For Panama and Costa Rica 2012 exports are projections by FAS/USDA


22 However, Asia is only a minor market for the region s exports. In 2012, U.S. and the EU accounted for only 65% of regional exports, down from 83% in Billion Dollars % 42% Asia EU ROW 33% 28% 2 41% USA % Source: USDA FAS
23 Commercial scale agriculture is energy and input intensive planting, growing, harvesting, transporting, processing, and packaging. In recent years, input prices have risen in response to strong growth in global demand for energy and ag products. Prices of diesel, fertilizer, seed, and agricultural chemicals have risen. Rising production costs pressure farmers operating margins, mitigates supply response, and lead to higher long run agricultural commodity and food prices.
24 300 IMF Price Indices Index 2005 = Crude oil All Commodities Food 50 0 Source: International Monetary Fund: International Financial Statistics
25 While commodity prices will remain fairly strong over next 10 years, they will lag rising production costs land rental rates also affected by rising land prices Billions US$ Gross Farm Income Total Production Expenses % Operating Margin* * Net farm income/total cash receipts Source: USDA/ERS
26 How aggressively will producers around the world respond to strong commodity prices? Where will the gains occur? Transportation/storage infrastructure and marketing costs will play a big role. Land tenure issues, laws governing foreign investment, and the degree of price transmission will also be major issues. South America will likely lead in land expansion (largely new frontier lands in Brazil) as will the Former Soviet Union (esp. Russia and Ukraine). Africa has more uncultivated land but high marketing costs, poor infrastructure, and long distances from markets will be a constraint.
27 Globally 446 million hectares of uncultivated land (1.1 billion acres) 52 million ha Share of Land With Travel Time to Market < 6 Hours 123 million ha 3 million ha 14 million ha Latin America & Car. 76% 202 million ha Sub Saharan Africa 47% M. East & N. Africa 87% E. Europe & C. Asia 83% East & South Asia 23% Source: World Bank

28 120% 100% 80% Area Yield Production % Change 60% 40% 20% 0% 20% Grains Oilseeds* Cotton Total *Includes soybean, sunflower, rapeseed, and peanut Source: USDA PSD Database
29

30 Big drop in U.S. yields in 2012/13 is due to worst drought in decades 12 Corn Yield and Trend Tons/hectare United States EU East Asia South America Central America Source: USDA PS&D Database
31 Prolonged economic stagnation or new recession, crisis in Euro Zone, or a hard landing in China pose risks to agriculture s outlook USDA does not publish alternative baseline projections and only publishes once a year. The projections in this presentation were based on assumptions developed in fall of 2012 and published February Fiscal and monetary actions in the coming months should pre empt another global crisis but may not revive pre crisis (2008/09) growth rates However, if macroeconomic outlook worsens, it could: Reduce the growth of the middle class in emerging markets Increase the value of the U.S. dollar (safe haven response) Reduce global trade (including agricultural trade) Reduce almost all dollar based commodity prices Reduce farm income
32 Have we entered a golden era for agriculture? That depends on your definition The price and profit outlook looks more promising than it has in decades. New price/income floors for ag producers who receive world prices for their products. Strong growth in global food, feed, (bio)fuel, and fiber demand and a relatively weak U.S. dollar will keep food and agricultural prices high over the next decade. Much of this new demand will be centered in Asia agricultural trade will continue to grow with most of the new import demand coming from developing country markets, such as China, Southeast Asia, Middle East/North Africa, and Latin America. High commodity prices and production gains should help the total profitability of agriculture (despite operating margins coming under pressure) at least in those countries with high degrees of price transmission. If so, this should continue attracting new investment into the sector, i.e. land and new technologies. However, beware of rising input costs and short term exogenous shocks they are a major element of risk in the profit outlook.
33 Strong growth in global food, feed, (bio)fuel, and fiber demand and a weaker U.S. dollar will keep agricultural commodity prices high over the next 10 years which should keep U.S. farm economy strong. Much of this new demand will be centered in Asia agricultural trade will continue to grow with most of the new import demand coming from advanced developing markets, such as China, Southeast Asia, and Latin America. High commodity prices should help the total profitability of agriculture, despite operating margins coming under pressure. If so, this should continue attracting new investment into the sector, i.e. land and new technologies.
34
Factors Affecting Global Agricultural Markets Over Next 10 Years
 Factors Affecting Global Agricultural Markets Over Next 10 Years Implications for global commodity prices Michael J. Dwyer Director of Global l Policy Analysis Office of Global Analysis Foreign Agricultural
Factors Affecting Global Agricultural Markets. Fred Giles Director, Agricultural Trade Office USDA / SP
 Factors Affecting Global Agricultural Markets Fred Giles Director, Agricultural Trade Office USDA / SP Factors Impacting Global Agricultural Markets Commodity Prices Energy Prices Value of the U.S. Dollar
Global Agricultural Supply and Demand: Factors contributing to recent increases in food commodity prices
 Global Agricultural Supply and Demand: Factors contributing to recent increases in food commodity prices Ron Trostle Economic Research Service U.S. Department of Agriculture Agricultural Markets and Food
FACTORS CREATING RISK IN U.S. GRAIN MARKETS
 FACTORS CREATING RISK IN U.S. GRAIN MARKETS WAY TOO EARLY GRAIN MARKET OUTLOOK TO 2050 22 ND NATIONAL WORKSHOP FOR DAIRY ECONOMISTS & POLICY ANALYSTS APRIL 30, 2015 JOHN NEWTON UNIV. OF ILLINOIS JCNEWT@ILLINOIS.EDU
Major Points of Discussion
 Situation and Outlook for Agricultural Commodity Prices Presented to Global Insight s World Economic Outlook Conference April 16, 2008 Michael J. Dwyer Chief Economist and Director of Global Trade and
U.S. Rice Market Faces Larger Supplies and Lower Prices in 2018/19; Global Trade Projected Another Record High
 U.S. Rice Market Faces Larger Supplies and Lower Prices in 218/19; Global Trade Projected Another Record High 218 Rice Outlook Conference December 5-7, 218 Nathan Childs Economic Research Service USDA
The Agricultural Trade Agenda: The TPP and Why it Matters. 9 January
 The Agricultural Trade Agenda: The TPP and Why it Matters 9 January 2016 1 jason.hafemeister@fas.usda.gov Agenda U.S. Agriculture and Trade Where are the Markets? What are the Barriers? Trans Pacific Partnership
Emerging Global Trade Patterns: USDA s Long-term Agricultural Projections
 Emerging Global Trade Patterns: USDA s Long-term Agricultural Projections Midwest Agriculture s Ties to the Global Economy Federal Reserve Bank of Chicago November 28, 217 Chicago Jim Hansen, Ph.D. USDA,
World Agricultural Outlook Board Interagency Commodity Estimates Committee Forecasts. Lockup Briefing June 11, 2014
 World Agricultural Outlook Board Interagency Commodity Estimates Committee Forecasts Lockup Briefing World Wheat Production Country or Region 2014/15 Million Tons World 714.0 701.6 0.7-1.7 United States
Sugar: World Markets and Trade
 United States Department of Agriculture Foreign Agricultural Service November 2018 Sugar: World Markets and Trade Record Stocks and Consumption Despite Lower Production 205 185 Production Consumption Stocks
Sugar: World Markets and Trade
 United States Department of Agriculture Foreign Agricultural Service Sugar: World Markets and Trade May 218 Elevated in 218/19 Keeps Stocks High, Pressuring Prices Ending Stocks 2 18 16 14 12 1 8 6 4 Other
World Agricultural Supply And Demand Estimates
 United States Department of Agriculture Office of the Chief Economist World Agricultural Supply And Demand Estimates Agricultural Marketing Service Economic Research Service Farm Service Agency Foreign
World Agricultural Supply And Demand Estimates
 World Agricultural Supply And Demand Estimates United States Department of Agriculture Office of the Chief Economist Agricultural Marketing Service Economic Research Service Farm Service Agency Foreign
WORLD AGRICULTURAL SUPPLY AND DEMAND ESTIMATES
 WORLD AGRICULTURAL SUPPLY AND DEMAND ESTIMATES United States Department of Agriculture Washington, D.C. Approved by the World Agricultural Outlook Board WASDE-339 - June 12, 1998 NOTE Because planting
Low prices last year induced a decline in global wheat area, and as a result production increased less than 1%, helping to support an expected price i
 Wheat Low prices last year induced a decline in global wheat area, and as a result production increased less than 1%, helping to support an expected price increase in 2017/18. It is expected that prices
2012 Farm Outlook. Highlights
 2012 Farm Outlook Office of the Chief Economist USDA Highlights A promising spring planting was followed by historic drought. Record high commodity prices followed. Farm incomes are expected to be near
Rice Outlook and Baseline Projections. University of Arkansas Webinar Series February 13, 2015 Nathan Childs, Economic Research Service, USDA
 Rice Outlook and Baseline Projections University of Arkansas Webinar Series February 13, 2015 Nathan Childs, Economic Research Service, USDA THE GLOBAL RICE MARKET PART 1 The 2014/15 Global Rice Market:
World Agricultural Supply And Demand Estimates
 United States Department of Agriculture Office of the Chief Economist World Agricultural Supply And Demand Estimates Agricultural Marketing Service Economic Research Service Farm Service Agency Foreign
World Agricultural Supply And Demand Estimates
 World Agricultural Supply And Demand Estimates United States Department of Agriculture Office of the Chief Economist Agricultural Marketing Service Economic Research Service Farm Service Agency Foreign
World Agricultural Supply And Demand Estimates
 United States Department of Agriculture Office of the Chief Economist World Agricultural Supply And Demand Estimates Agricultural Marketing Service Economic Research Service Farm Service Agency Foreign
World Agricultural Outlook Board Interagency Commodity Estimates Committee Forecasts. Lockup Briefing April 9, 2014
 World Agricultural Outlook Board Interagency Commodity Estimates Committee Forecasts Lockup Briefing World Wheat Production Country or Region Million Tons World 656.5 712.5 8.5 United States 61.7 58.0-6.0
World Agricultural Supply And Demand Estimates
 United States Department of Agriculture Office of the Chief Economist World Agricultural Supply And Demand Estimates Agricultural Marketing Service Economic Research Service Farm Service Agency Foreign
June 9, USDA World Supply and Demand Estimates
 June 9, 2017 - USDA World Supply and Demand Estimates Corn Market Reaction: July 2017 corn futures closed up 2 cents at $3.87 ¾ with a trading range for the day of $3.80 ¾ to $3.89 ½. December 2017 corn
January 12, USDA World Supply and Demand Estimates
 January 12, 2018 - USDA World Supply and Demand Estimates Corn Market Reaction: March 2018 corn futures closed down 2 ½ cents at $3.46 ¼ with a trading range for the day of $3.45 ½ to $3.50. December 2018
World Agricultural Supply And Demand Estimates
 World Agricultural Supply And Demand Estimates United States Department of Agriculture Office of the Chief Economist Agricultural Marketing Service Economic Research Service Farm Service Agency Foreign
August 10, USDA World Supply and Demand Estimates
 August 10, 2017 - USDA World Supply and Demand Estimates Corn Market Reaction: September 2017 corn futures closed down 15 cents at $3.57 ¼ with a trading range for the day of $3.56 ½ to $3.75 ½. December
World Agricultural Supply And Demand Estimates
 United States Department of Agriculture Office of the Chief Economist World Agricultural Supply And Demand Estimates Agricultural Marketing Service Economic Research Service Farm Service Agency Foreign
September 12, USDA World Supply and Demand Estimates
 September 12, 2018 - USDA World Supply and Demand Estimates Corn Market Reaction: December 2018 corn futures closed down 14 ¼ cents at $3.52 ½ with a trading range for the day of $3.50 ¾ to $3.66 ¼. December
May 10, USDA World Supply and Demand Estimates
 May 10, 2018 - USDA World Supply and Demand Estimates Corn Market Reaction: July 2018 corn futures closed down ¾ cent at $4.02 with a trading range for the day of $4.00 to $4.07. December 2018 corn futures
January 12, USDA World Supply and Demand Estimates
 January 12, 2017 - USDA World Supply and Demand Estimates Corn This month s U.S. corn outlook is for lower production, reduced feed and residual use, increased corn used to produce ethanol, and smaller
Rice: Global Competitiveness of the U.S. Rice Industry
 Rice: Global Competitiveness of the U.S. Rice Industry October 7, 2015 Disclaimer: The views expressed here are those of the presenters, and do not necessarily represent those of any individual Commissioner
U.S. Rice Growers Face Higher Prices and Tighter Supplies in 2017/18
 U.S. Rice Growers Face Higher Prices and Tighter Supplies in 217/18 217 Rice Outlook Conference December 12, 217 Nathan Childs Economic Research Service USDA Approved by the World Agricultural Outlook
Friday Aug 10, 2012 World Ag Supply & Demand Report
 Friday Aug 10, 2012 World Ag Supply & Demand Report U.S. 2011/12 Old Crop Corn is Supportive Global Old Crop Corn is Slightly Bearish USDA estimates the 2011/12 U.S. corn carryout at 1,021 million bushels,
Improvement in global production and a gradual recovery in ending stocks over the past three years have allowed the global wheat market to balance at
 Wheat Improvement in global production and a gradual recovery in ending stocks over the past three years have allowed the global wheat market to balance at much lower prices than in the 2007/08 to 2012/13
December 12, USDA World Supply and Demand Estimates
 December 12, 2017 - USDA World Supply and Demand Estimates Corn Market Reaction: March 2018 corn futures closed down 1 ¼ cents at $3.47 ¾ with a trading range for the day of $3.47 ½ to $3.53. December
May 12, Dear Subscriber: We will be adding material to this shell letter after todays reports are released at 11:00 a.m.
 May 12, 2015 Dear Subscriber: We will be adding material to this shell letter after todays reports are released at 11:00 a.m. Be sure to click back on the link often for the latest information. Whle today
June 12, USDA World Supply and Demand Estimates
 June 12, 2018 - USDA World Supply and Demand Estimates Corn Market Reaction: July 2018 corn futures closed up 10 ¼ cents at $3.77 ½ with a trading range for the day of $3.67 ¼ to $3.79 ½. December 2018
March 10, Dear Subscriber:
 March 10, 2014 Dear Subscriber: We will be adding material to this shell letter after the report is released on March 10 at 11:00 a.m CST. Be sure to click back on the link often for the latest information.
U.S. Rice Market Faces Tighter Supplies and Higher Prices in 2017/18
 U.S. Rice Market Faces Tighter Supplies and Higher Prices in 217/18 University of Arkansas Webinar Series October 26, 217 Nathan Childs Economic Research Service USDA Approved by the World Agricultural
Cotton: World Markets and Trade
 United States Department of Agriculture Foreign Agricultural Service Cotton: World Markets and Trade May Global Consumption Rises Above Production, Fall USDA s initial forecast for / shows world consumption
U.S. Agricultural Trade: Trends, Composition, Direction, and Policy
 U.S. Agricultural Trade: Trends, Composition, Direction, and Policy Charles E. Hanrahan Senior Specialist in Agricultural Policy Carol Canada Information Research Specialist Beverly A. Banks Acquisitions
USDA Agricultural Baseline Projections to 2012
 United States Department of Agriculture Office of the Chief Economist Staff Report WAOB-23-1 USDA Agricultural Baseline Projections to 212 Interagency Agricultural Projections Committee World Agricultural
UPDATED HOG PRODUCTION ESTIMATED RETURNS
 February 15, 21 Ames, Iowa Econ. Info. 187 UPDATED HOG PRODUCTION ESTIMATED RETURNS The Iowa State University Extension Estimated Livestock Returns have provided a barometer of profitability for the Iowa
World Agricultural Supply and Demand Estimates
 World Agricultural Supply and Demand Estimates Report of Interagency Commodity Estimates Committee Forecasts World Agricultural Outlook Board, Chairing Agency Economic Research Service Foreign Agricultural
Agricultural Trade and the Implications for the U.S. Farm Sector May 16, 2018 Ames, IA
 Agricultural Trade and the Implications for the U.S. Farm Sector May 16, 2018 Ames, IA David Oppedahl Senior Business Economist Federal Reserve Bank of Chicago 312-322-6122 david.oppedahl@chi.frb.org www.chicagofed.org
KC FED Agriculture Infrastructure Investor Perspective. Chris Erickson Managing Director HighQuest Partners, LLC July 2013
 KC FED Agriculture Infrastructure Investor Perspective Chris Erickson Managing Director HighQuest Partners, LLC July 2013 Global Supply and Demand 1 Global Soybean Supply and Demand 1,000 MT 350,000 300,000
VA AGRICULTURE & FORESTRY: BUILDING DOMESTIC CAPACITY, EXPORTING TO THE WORLD
 VA AGRICULTURE & FORESTRY: BUILDING DOMESTIC CAPACITY, EXPORTING TO THE WORLD VIRGINIA ECONOMIC DEVELOPERS ASSOCIATION 2014 GOVERNOR S CONFERENCE ON ECONOMIC DEVELOPMENT VIRGINIA SECRETARY OF AGRICULTURE
Population Distribution by Income Tiers, 2001 and 2011
 1 Updated August 13, 2015: This new edition includes corrected estimates for Iceland, Luxembourg, Netherlands and Taiwan, and some related aggregated data. TABLE A1 Distribution by Income Tiers, 2001 and
Agriculture Commodity Markets & Trends
 Agriculture Commodity Markets & Trends Agenda Short History of Agriculture Commodities US & World Supply and Demand Commodity Prices Continuous Charts What is Contango and Backwardation Barge, Truck and
December 2 nd in Lafayette Indiana and Monticello Illinois December 3 rd in Jacksonville, Illinois
 November 8, 2013 WE WILL BE UPDATING AND ADDING MATERIAL THROUGHOUT THE DAY ON NOVEMBER 8 TO THIS LETTER BEGINNING AT 11:00 AM CST. PLEASE CHECK BACK OFTEN FOR THE LATEST INFORMATION! This morning (Friday,
Global Carbon Finance (GLOCAF) model
 model") OFFICIAL-SENSITIVE Global Carbon Finance (GLOCAF) model PMR Technical Workshop on Post-2020 Mitigation Scenarios and Carbon Pricing Modelling Brasilia, 03 February 2016 Contents Introduction GLOCAF model
OFFICIAL-SENSITIVE Global Carbon Finance (GLOCAF) model PMR Technical Workshop on Post-2020 Mitigation Scenarios and Carbon Pricing Modelling Brasilia, 03 February 2016 Contents Introduction GLOCAF model
Grain: World Markets and Trade
 MMT 1, 975 95 925 9 875 85 825 8 Department of Agriculture Foreign Agricultural Service Grain: World Markets and Trade Near-Record Grain Supplies Support Growing Global Consumption Global Corn Production
OUTLOOK FOR US AGRICULTURE
 Agricultural Outlook Forum 216 OUTLOOK FOR US AGRICULTURE Robert Johansson Chief Economist 25 February 216 Fig 2 Main themes for 216 1. The macroeconomy is weighing on trade, but there are reasons for
April 9, Dear Subscriber:
 April 9, 2014 Dear Subscriber: We will be adding material to this shell letter after the report is released on April 9, 2014 at 11:00 a.m CST. Be sure to click back on the link often for the latest information.
Global Sugar Consumption Expands While Production Stagnates
 United States Department of Agriculture Foreign Agricultural Service Sugar: World Markets and Trade Global Sugar Consumption Expands While Production Stagnates 180 Million Metric Tons, Raw Value 170 160
Oral Statement before the United States Senate Committee on Agriculture, Nutrition, and Forestry. Hearing on the trade section of the farm bill
 Oral Statement before the United States Senate Committee on Agriculture, Nutrition, and Forestry Hearing on the trade section of the farm bill April 25, 2001 Bruce A. Babcock Center for Agricultural and
World Agricultural Outlook Board Interagency Commodity Estimates Committee Forecasts. Lockup Briefing July 11, 2014
 World Agricultural Outlook Board Interagency Commodity Estimates Committee Forecasts Lockup Briefing World Wheat Production Country or Region estimate 2014/15 forecast June 11 Million Tons Percent Percent
World Agricultural Outlook Board Interagency Commodity Estimates Committee Forecasts. May 9, 2014
 World Agricultural Outlook Board Interagency Commodity Estimates Committee Forecasts World Wheat Production Country or Region Million Tons 2014/15 World 714.0 697.0-2.4 United States 58.0 53.4-7.8 Foreign
Cotton and Wool Outlook
 Economic Research Service Situation and Outlook Report CWS-18g July 16, 2018 Next release is August 14, 2018 Cotton and Wool Outlook Leslie A. Meyer Record Global Cotton Mill Use in 2018/19; Growth Varies
Cotton: World Markets and Trade
 United States Department of Agriculture Foreign Agricultural Service Circular Series FOP - December Cotton: World Markets and Trade Unprecedented Daily Price Volatility Rules the Market Now Daily NY Nearby
The Role of Agricultural Technology in the Future of Midwest Farms: A Seed Sector View
 The Role of Agricultural Technology in the Future of Midwest Farms: A Seed Sector View Jerry Flint Vice President, Global Initiatives and Sustainability November 27, 218 Insert Agriculture Risk Classification
World trade in Grains and Oilseeds: Milestones for 2010
 World trade in Grains and Oilseeds: Milestones for 2010 By Dr. Robert Wisner Biofuels Economist & University Professor AgMarketing Resource Center Iowa State University Ames, Iowa U.S.A. Topics to Be Discussed
INTERNATIONAL GRAINS COUNCIL
 INTERNATIONAL GRAINS COUNCIL GRAIN MARKET REPORT www.igc.int GMR No. 420 2 April 2012 WORLD ESTIMATES million tons 08/09 09/10 10/11 11/12 12/13 est forecast proj 23.02 02.04 02.04 WHEAT Production 685
Competitiveness of American Agriculture in the Global Economy. Ian Sheldon. AED Economics
 Competitiveness of American Agriculture in the Global Economy Ian Sheldon AED Economics What is globalization? Increasing world economic integration Trade, direct investment, financial flows, and migration
World Agricultural Supply And Demand Estimates
 World Agricultural Supply And Demand Estimates United States Department of Agriculture Office of the Chief Economist Agricultural Marketing Service Economic Research Service Farm Service Agency Foreign
World Agricultural Supply And Demand Estimates
 World Agricultural Supply And Demand Estimates United States Department of Agriculture Office of the Chief Economist Agricultural Marketing Service Economic Research Service Farm Service Agency Foreign
FSC Facts & Figures. December 3, 2018
 FSC Facts & Figures December 3, 2018 Global FSC-certified forest area North America 34.5% of total FSC-certified area ( 69,285,190 ha ) 253 certificates Europe 50% of total FSC-certified area ( 100,482,414
FSC Facts & Figures. November 2, 2018
 FSC Facts & Figures November 2, 2018 Global FSC-certified forest area North America 34.6% of total FSC-certified area ( 69,322,145 ha ) 256 certificates Europe 49.9% of total FSC-certified area ( 100,198,871
FSC Facts & Figures. June 1, 2018
 FSC Facts & Figures June 1, 2018 Global FSC-certified forest area North America 34.6% of total FSC-certified area ( 69,460,004 ha ) 242 certificates Europe 49.4% of total FSC-certified area ( 99,068,686
GROWING AGRICULTURAL EXPORTS: VIRGINIA S AGGRESSIVE TRADE AGENDA
 GROWING AGRICULTURAL EXPORTS: VIRGINIA S AGGRESSIVE TRADE AGENDA SOUTHERN LEGISLATIVE CONFERENCE CHARLES GREEN VIRGINIA DEPARTMENT OF AGRICULTURE & CONSUMER SERVICES JULY 30, 2012 Who, What, When, Where
FSC Facts & Figures. September 6, 2018
 FSC Facts & Figures September 6, 2018 Global FSC-certified forest area North America 34.5% of total FSC-certified area ( 69,584,479 ha ) 253 certificates Europe 49.4% of total FSC-certified area ( 99,747,108
FSC Facts & Figures. August 1, 2018
 FSC Facts & Figures August 1, 2018 Global FSC-certified forest area North America 34.6% of total FSC-certified area ( 69,481,877 ha ) 253 certificates Europe 49.4% of total FSC-certified area ( 99,104,573
Forest Stewardship Council
 Global FSC certified area*: by region Africa CAMEROON CONGO, THE REPUBLIC OF GABON GHANA MOZAMBIQUE NAMIBIA SOUTH AFRICA SWAZILAND TANZANIA, UNITED UGANDA Asia CAMBODIA CHINA INDIA INDONESIA JAPAN KOREA,
FSC Facts & Figures. January 3, FSC F FSC A.C. All rights reserved
 FSC Facts & Figures January 3, 2018 FSC F0001000 FSC A.C. All rights reserved Global FSC-certified forest area North America 34.7% of total FSC-certified area ( 69,082,443 ha ) 245 certificates Europe
FSC Facts & Figures. February 9, FSC F FSC A.C. All rights reserved
 FSC Facts & Figures February 9, 2018 FSC F0001000 FSC A.C. All rights reserved Global FSC-certified forest area North America 34.5% of total FSC-certified area ( 68,976,317 ha ) 243 certificates Europe
FSC Facts & Figures. April 3, FSC F FSC A.C. All rights reserved
 FSC Facts & Figures April 3, 2018 FSC F0001000 FSC A.C. All rights reserved Global FSC-certified forest area North America 34.7% of total FSC-certified area ( 69,167,742 ha ) 242 certificates Europe 49.3%
USDA Agricultural Outlook
 USDA Agricultural Outlook December 216 World Agricultural Outlook Board Office of the Chief Economist U.S. Department of Agriculture Washington, D.C. The Office of the Chief Economist is Non Political
INTERNATIONAL CENTER FOR AGRICULTURAL COMPETITIVENESS Policy Modeling Group
 INTERNATIONAL CENTER FOR AGRICULTURAL COMPETITIVENESS Policy Modeling Group Darren Hudson, Director Jaime Malaga, Associate Director Bing Liu, Research Scientist GLOBAL COTTON OUTLOOK 216/17 226/27 International
Wednesday July 11, 2012 World Ag Supply & Demand Report
 World Ag Supply & Demand Report U.S. 2011/12 Old Crop Corn is neutral Global Old Crop Corn is neutral USDA estimates the 2011/12 U.S. corn carryout at 903 million bushels, up from 851 million bushels from
2/19/2014. Bunge North America. Highlights of the Past 12 Months. US Weather
 Bunge North America Flat Price Risk Virginia State Feed Association Conference And Nutritional Management Cow College February 2014 Foreign Currency Commercials/Funds (Boards of Trade) Freight Weather
Forest Stewardship Council
 Global FSC Certified Businesses: by country PUERTO RICO 4 FINLAND 83 BAHRAIN GUATEMALA 29 MACEDONIA 3 VIETNAM 004 CONGO, THE REPUBLIC OF 5 NEW ZEALAND 287 KOREA, REPUBLIC OF 243 UGANDA 3 MONACO 4 EGYPT
WikiLeaks Document Release
 WikiLeaks Document Release February 2, 2009 Congressional Research Service Report 98-253 U.S. Agricultural Trade: Trends, Composition, Direction, and Policy Charles E. Hanrahan, Resources, Science; Beverly
World Agricultural Outlook Board Interagency Commodity Estimates Committee Forecasts. Lockup Briefing March 10, 2014
 World Agricultural Outlook Board Interagency Commodity Estimates Committee Forecasts Lockup Briefing World Wheat Production Country or Region 2013/14 Million Tons World 656.4 712.7 0.1 8.6 United States
Iowa Farm Outlook. March 2014 Ames, Iowa Econ. Info Long-Term Projections for Beef Production and Trade
 Iowa Farm Outlook 0BDepartment of Economics March 2014 Ames, Iowa Econ. Info. 2047 Long-Term Projections for Beef Production and Trade We often spend a lot of time focusing on the short-term market situation
Outlook for U.S. Agricultural Trade
 United States Department of Agriculture Electronic Outlook Report from USDA s Economic Research Service and Foreign Agricultural Service AES-101 August 29, 2017 Outlook for U.S. Agricultural Trade FY 2018
FSC Facts & Figures. September 1, FSC F FSC A.C. All rights reserved
 FSC Facts & Figures September 1, 2017 FSC F0001000 FSC A.C. All rights reserved Global FSC-certified forest area North America 34.9% of total FSC-certified area ( 69,014,953 ha ) 246 certificates Europe
FSC Facts & Figures. October 4, FSC F FSC A.C. All rights reserved
 FSC Facts & Figures October 4, 2017 FSC F0001000 FSC A.C. All rights reserved Global FSC-certified forest area North America 35.2% of total FSC-certified area ( 68,947,375 ha ) 246 certificates Europe
FSC Facts & Figures. December 1, FSC F FSC A.C. All rights reserved
 FSC Facts & Figures December 1, 2017 FSC F0001000 FSC A.C. All rights reserved Global FSC-certified forest area North America 35.7% of total FSC-certified area ( 69,695,913 ha ) 248 certificates Europe
Keywords: Asparagus officinalis L., green asparagus, white asparagus, consumption, export, domestic, hemispheres, canned, fresh, frozen
 2005 UPDATE OF THE WORLD S ASPARAGUS PRODUCTION AREAS, SPEAR UTILIZATION, YIELDS AND PRODUCTION PERIODS (To be published in the Proceedings of the XI International Asparagus Symposium in Acta Horticulturae)
FSC Facts & Figures. August 4, FSC F FSC A.C. All rights reserved
 FSC Facts & Figures August 4, 2016 FSC F0001000 FSC A.C. All rights reserved Global FSC-certified forest area North America 35.9% of total FSC-certified area ( 68,725,419 ha ) 249 certificates Europe 47.7%
FSC Facts & Figures. September 12, FSC F FSC A.C. All rights reserved
 FSC Facts & Figures September 12, 2016 FSC F0001000 FSC A.C. All rights reserved Global FSC-certified forest area North America 35.8% of total FSC-certified area ( 68,217,276 ha ) 243 certificates Europe
FSC Facts & Figures. November 15. FSC F FSC A.C. All rights reserved
 FSC Facts & Figures November FSC F00000 FSC A.C. All rights reserved Global FSC certified forest area North America.u of total FSC certified area / 6.8.89 ha D 6 certificates Europe 8u of total FSC certified
Agricultural Outlook Forum 2005 For Release: Thursday, February 24, OUTLOOK FOR THE U.S. FARM ECONOMY Keith Collins Chief Economist, USDA
 Agricultural Outlook Forum 25 For Release: Thursday, February 24, 25 OUTLOOK FOR THE U.S. FARM ECONOMY Keith Collins Chief Economist, USDA Good morning and welcome to Agricultural Outlook Forum 25. I am
FSC Facts & Figures. January 6, FSC F FSC A.C. All rights reserved
 FSC Facts & Figures January 6, 2017 FSC F000100 0 FSC A.C. All rights reserved Global FSC-certified forest area North America 35.3% of total FSC-certified area ( 69,212,841 ha ) 248 certificates Europe
FSC Facts & Figures. February 1, FSC F FSC A.C. All rights reserved
 FSC Facts & Figures February 1, 2017 FSC F000100 0 FSC A.C. All rights reserved Global FSC-certified forest area North America 35.8% of total FSC-certified area ( 69,590,919 ha ) 249 certificates Europe
FSC Facts & Figures. March 13, FSC F FSC A.C. All rights reserved
 FSC Facts & Figures March 13, 2017 FSC F000100 0 FSC A.C. All rights reserved Global FSC-certified forest area North America 35.6% of total FSC-certified area ( 69,049,912 ha ) 248 certificates Europe
Global Food Security Index
 Global Food Security Index Sponsored by 26 September 2012 Agenda Overview Methodology Overall results Results for India Website 2 Overview The Economist Intelligence Unit was commissioned by DuPont to
Market Fundamentals. August October 2017
 Market Fundamentals August October 2017 1 Safe Harbor Statement & Disclosures This presentation includes forward-looking comments subject to important risks and uncertainties. It may also contain financial
Argus Ethylene Annual 2017
 Argus Ethylene Annual 2017 Market Reporting Petrochemicals illuminating the markets Consulting Events Argus Ethylene Annual 2017 Summary Progress to the next peak of the economic cycle, now expected by
FSC Facts & Figures. December 1, FSC F FSC A.C. All rights reserved
 FSC Facts & Figures December, 0 FSC F00000 FSC A.C. All rights reserved Global FSC certified forest area North America.9v of total FSC certified area m 67::08 ha I 47 certificates Europe 47.v of total