Thefuture agricultureinineurope. Based on the book 'Nourrir l'humanité' by Bruno Parmentier
|
|
|
- Osborn Powell
- 5 years ago
- Views:
Transcription


1 The Thefuture futureof of agriculture agricultureinineurope Europe David DavidRees ReesPh.D. Ph.D. Based on the book 'Nourrir l'humanité' by Bruno Parmentier

2 Origin and purpose of the CAP?


3 Contents 1. Farming capacity and food needs 2. Land and water requirements 3. Biofuels 4. Aid 5. Conclusion

4 8m farmers 1 farmer fed 5 people Agronomy: pesticides fertilisers mechanisation 0.8m farmers 1 farmer feeds 100 people France: 23% of EU15 production Top producer: beef, poultry BUT has to import 75% animal feed from USA, Brazil & Argentina
5 2007 Population: 6.4b Hungry: 850m West controls rules of International Commerce 2050 Population: 9.5b Europe Asia 3rd world: dependence or famine Africa Will feed themselves Need to increase production by Need to increase production by World needs to increase production by 125% Can it be done? 125%
6 Agricultural production to feed the world in 2005 Pop. Growth Needs change Diet change Cum. effect Africa Asia S. America N. America Oceania Europe World Ref: Philippe Collomb 'Une voie étroite pour la sécurité alimentaire d'ici à 2050' +125% 2006: an Indian consumes 4kg of meat per year : an American consumes 80kg of meat per year 2050: If Indians and Chinese consumed 40kg of meat per year? (1kg of meat requires about 4-10kg of cereal)

7 44% cereals meat production b tons b tons b tons b tons +1b tons 3x USA production

8 Food Production Maize, Rice and Corn Pesticides & Fertilisers 3 times more productive Fertiliser Corn: France 240kg/h, Russia 25kg/h Maize: USA 257kg/h, Tanzania 12kg/h Rice: 320kg/h, Cambodia 4kg/h Cotton: Tadjikstan 461kg/h, Benin 45kg/h


9 Food Production Third-world farmer 1h of land, no machines, no animal traction, no selected seed, no insecticide, no fertiliser At 1$ per day, production cost is 36$ per 100kg Canadian farmer 12$ per 100kg Australians and Argentinians: 8$ per 100kg Cannot allow market forces to determine the market
 US Maize subsidies US maize production 4 times more productive (10b$) more than US maize twice the amount of subsidy the entire Mexican Agricultural")
10 Opening the market: Mexico and the USA US investment quadruples in Mexico (cheaper labour) Mexican exports 31 to 165b$ 0.75m to 1.6m cars per year Maize (Mexican staple diet) US Maize subsidies US maize production 4 times more productive (10b$) more than US maize twice the amount of subsidy the entire Mexican Agricultural budget Mexico loses 3m farmers US investment in the Maquiladoras now moving to Asia. How will Mexico earn the $ to import the food it used to grow?
 to Africa Cameroon Local chicken: 2 28 EU imported")

11 EU CAP subsidies and dumping EU chicken producers Cheaper cereal due to Best bits for the EU market subsidies Worst bits (wings) to Africa Cameroon Local chicken: 2 28 EU imported frozen chicken: : Imports 980 tonnes to 22,000 tonnes National production 26,000 tonnes to 10,000 tonnes 110,000 jobs lost per year 83% of samples improper for consumption
 China reduced insecticide by 80% 28%")
12 GMOs 90m h (eq. all EU agricultural land) China reduced insecticide by 80% 28% cheaper farmer intoxication from 22% to 5% with GM Cotton


13 What should we eat? l vegetable oil - 7,200kcal kg sugar 4,000kcal kg bread 1,200kcal kg meat 200kcal kg vegetables 250kcal


14 Agricultural land 38% of land is farmed, pasture or forest 1960: 0.43h per person 2000: 0.25h per person : agricultural land +9% : population +50% Australia: 2.5h / person China: 0.12h / person
15 Farming needs water 97.5 water is sea water, 2.5% fresh water but 65% of fresh water is held as ice, so only 1% is available More than half of humanity will be living with water shortages, depleted fisheries and polluted coastlines within 50 years because of a worldwide water crisis, warns a United Nations report

16 World water needs

17 Arizona: wells from 150m to 450m deep West: drought Underground reserves 50% gone Kansas pipeline from the Missouri Request to Canada for water supplies (refused)


")
18 1950: Reserve of 16,800m3 per person 2006: Reserve of 6,800m3 per person 2025: Reserve of 4,800m3 per person 12 countries have 60% reserves (Brazil, Russia, USA, Canada, China, Indonesia, India, Colombia, Peru) 80 countries (40% world population) have serious water problems
19 Erosion, desertification, industrialisation etc. China loses 1m h of agricultural land per year!
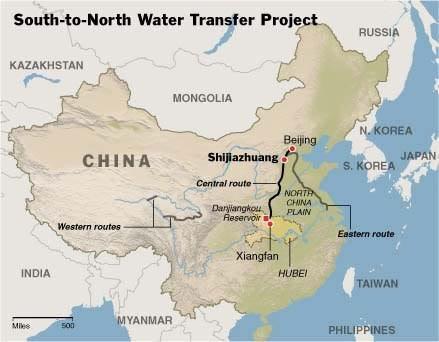
20 China: 1.26 billion people. Over-pumping: Northern China water table dropping 1m per year. 300 cities short of water. Diverting water from agriculture to industry; farmers bankrupt Rivers: heavy metal pollution; too bad for irrigation. Farm production reducing, imports increase (prices rise).

21 China an unavoidable water crisis China India China and India use snow-melt waters for summer water supplies.

22 Himalayas: 33,000km². Depth reducing by 0.2 to 1m per year Feeds the Amou-Daria, Ganges, Indus, Salouen, Mekong, Yangzi, & Huang He. Initial flooding will be replaced by lack of water
23 70% Chinese no permanent clean water Since 1950, lake reserves down by 15% 65% rivers polluted North: deserts progressing by 2,500km² per year Future lack of melt-water serious summer reduction

24
25
26 Virtual Water: how much water required to produce different foods Corn Rain rice Flood rice Soya Cotton Beef Pork Poultry Milk Cheese Eggs l/h²0/kg 1,100 1,400 5,000 2,700 5,200 13,500 4,600 4,100 3,000 5,000 2,700 'Dry' countries should therefore import high virtual water products rather than producing them themselves. N. Africa buys 40m tons of cereal per year. = 40b tons of virtual H²0


27 Biofuels a solution or a menace? $ Corn for food Quantity Price Biofuel production


28 Biocarburants 2005: 0.5% 2010: 5.75% 2020: 20% Ethanol and Biodeisel more profitable than agriculture when oil 80+$ per barrel More grain for Biofuels Less grain for Food Higher Food Prices


29 Food Aid 50% of cost is for shipping (increasing with rising fuel costs) Sustainable development Poverty Farmer Food imports Dependency
30 Food Aid Food aid depends on overproduction Corn prices: 175$ to 120$ Aid 6-12m tonnes By 1996 Corn prices: 120$ to 205$ Aid 12-3m tonnes
31 Conclusion North America Europe Increase in production Asia Switch of food crops to biofuels Increase in exports Reduction in production (water) Reduction of exports GMO-based biofuels Increase in imports Immigration control (big price increases) South America Desalination Africa Australasia Restriction of exports Reduction of production (drought) Reduction of production (drought) Market protection Disease and poverty GMO-based biofuels Fuel development Massive emmigration (to?) Immigration from Pacific islands Environmental destruction Global warming (Sea levels) Fuel prices Declining production Biocarburant production Environmental migration Food production Economic migration


32 Falling prices of third-world agricultural products Palm Oil -45% Cocao beans -70% Cotton - 48% Coffee beans -65%

33 Cocao 3 companies control 40% of the market The producer receives 2-4% of the final price Coffee 4 companies control 40% of the market. 4 companies control 45% of torrefaction. Bananas 88% for the international commercial companies, 12% for the (often foreign) producers, 2% for the labourers
.")
 # 1= Chicken # 3 cattle (behind Brazil and India) # 1 pisciculture #1 fruits and vegetables (8 x EU) Chronic flooding")
34 Who will feed whom in the future? China has to feed 22% of the world's population with 7% of agricultural land (and diminishing). Produces 19% world cereals (twice EU) 30% world rice 15% world corn 19% maize # 1 cotton producer (25%) # 1 Pork (4 x more than the EU) # 1= Chicken # 3 cattle (behind Brazil and India) # 1 pisciculture #1 fruits and vegetables (8 x EU) Chronic flooding Ice-melt in the Himalayas Lowering of water reserve levels Water and air pollution Cereals for animal feed (1970 9%, %)

35 Future world food reserve Brazil #1 sugar, coffee, soya, orange juice, chicken, beef, tobacco, ethanol. 30% GDP, 35% employment, 45% exports With Argentina, will become the two biggest food exporters in the world and will supply Asia, Africa and the Middle East EU self-sufficient. The CAP regulations (protection) will be removed and the EU will face real food competition for the first time but increasing food prices and EU agronomy in developing EU countries (Central Eastern) will develop and sustain EU's position)

36 North Africa and the Middle East Potential: land, water, labour OK. But, political and economic instability, the lack of technology and capital and its inability to defend itself against EU and US competition. Future serious water shortages, serious food shortages, low income and higher food prices will lead to massive emmigration (attempts) Middle East. Oil revenues (while they last) will allow the purchase of food and the desalination of water (high-energy costs). When the oil runs out no other sufficient infrastructure.
 Depends on: Use of oil money for investment in")
37 Russia and ex Soviet Union Can increase production considerably. Good land and water, global warming benefit. Could become future world cereal producer (like before - Odessa used to be the centre for world cereal prices) Depends on: Use of oil money for investment in technology and infrastructure (before the oil and gas runs out)

38 The responsibility of the CAP Agricultural subsidies: Switzerland 68% Japan 56% EU 32% USA 16% Australia 5% Tax barrier aginst importing non-eu food 60% (as opposed to 5% for industrialised goods) If the EU reduced its import taxes by 60%, it would increase by 20% developing country exports What EU do we want? The EU could stop all agricultural exports and transform competitive production (sugar...) to internal production.
39 The Thefuture futureof of agriculture agricultureinineurope Europe David DavidRees ReesPh.D. Ph.D. Based on the book 'Nourrir l'humanité' by Bruno Parmentier