Post Gu 09 Assessment Analysis FSEDC Meeting
|
|
|
- Brian Anderson
- 5 years ago
- Views:
Transcription


1 Food Security and Nutrition Analysis Unit -Somalia Post Gu 09 Assessment Analysis FSEDC Meeting August 21, 2009 Nairobi, Kenya EUROPEAN COMMISSION
2 FSNAU Post Gu 09 Assessment Overall Timeline
3 FSNAU Gu 09 Assessment Partner Participation Number of People Participating by Agency Food Security Field Assessment - Total 88 NGO Government UN & Int l TOTAL REGION Local Local Int l Ministries Authorities Gedo Bakol Central Region Hiran Middle Shabelle Lower Shabelle Northeast Northwest Juba Valley Total Total Number of Participating Partner Agencies (FS + Nut) 102 Local NGOs 47 Int l NGO s 20 Local Authority 12 Ministries 15 UN 5 Int l 3 Analysis Workshop - Total 23 FEWSNET 3 JRC-MARS 2 WFP 14 OCHA 2 CEFA 1 DEG GARAS 1 Total Number of People Field (FS) & Workshop Total 111 Local Authority 10 Ministries 13 Local NGOs 42 International NGOs 12 UN Agencies 35

4 Gu 08/09 Assessment Access and Field Monitoring Locations
5 A.Sector Analysis Summary Results
6 Climate Performance of the Gu 09 Rains Gu 09 Seasonal Rains Start on time (late March/ early April) Ended early - in mid May in many parts of the country Overall Performance - mixed, but largely below normal, especially in key pastoral regions of the north and central Areas of Poor Rainfall: Hiran, Galgadud, Mudug, Sool, Nugal, Togdheer, Sanaag and parts of Galbeed Parts of Lower Juba, North Gedo, and northern parts of Bakool Areas of Near Normal Rainfall Bay, Middle Juba, Lower and Middle Shabelle Parts of Bakool, and south Gedo Hagaa Seasonal Rains Good hagaa rains in Juba, and Shabelle and parts of Bay regions Juba and Shabelle planted off season crop (maize and sesame). Shabelle & Juba River Levels - below normal rainfall in Ethiopian highlands Rain failure in northern Kenya leading to abnormal livestock in-migration into Juba


7 Climate Crop/vegetation condition has been good in Bay, Juba and Shabelle NVDI AVHRR Anomaly June, 2009 Source: FSAU /FEWSNET
 July 1981- June 2009 Three consecutive seasons of below-normal")

8 Climate Emerging Drought in Northern Pastoral Areas Nugaal Valley, Vegetation conditions (NDVI) July June 2009 Three consecutive seasons of below-normal rainfall emerging drought Pasture and grazing conditions deteriorated to an alarming degree, NDVI 36-month average deviation normal; lower than 1990/92 & 2001/03 droughts


9 Climate Deepening Drought in Central Pastoral Areas
 Slight improvement in some areas, but further deterioration in other areas Deterioration Since May 09 1.")
10 Civil Insecurity Civil Insecurity Trends (Jan. July 09) Precarious and mixed situation (Jan. April) Slight improvement in some areas, but further deterioration in other areas Deterioration Since May 09 1.Worsened in several areas of southern and central Somalia including Mogadishu, Belet Weyne, Elbur and Hara-dhere 2.With significant impact on both urban and rural 3.Fresh fighting exploded in Mogadishu between insurgents and the Transitional Federal Government (TFG), 4.Worst fighting seen in months, causing both civilian deaths and massive displacement within the country and towards refugee camps of Kenya 5.Main impact is in the main towns and on humanitarian operations Source: FSNAU & Protection Cluster
11 Civil Insecurity Deterioration Since May Resource-based conflict between clans and sub-clans, especially in drought areas (e.g. Central) 5. Improved Access and security situation of the ordinary people improved in some areas (e.g. L. Shabelle) 6. Continued Incidents of sea piracy have since January, despite multinational naval forces and efforts of the local people Ongoing & Likely to Increase: Direct Impacts Deaths, Injuries, human rights abuses Destruction of Assets (Public & Private) Increased Population Displacement 1.4 million IDPs (40% increase since Jan. 09) Direct targeting of humanitarian and reduction of aid workers and responses Indirect Impact: Disruptions of trade within the country and across regional borders (for example Ethiopia-Somalia) and likely price increase Restrictions of livestock migration between clans boundaries in Central/ Hiran/parts of M. Shabelle and difficult of the natural resource sharing (water, pasture and grazing) Further restrictions of humanitarian space Declining social support among livelihoods and wealth groups
 Increased Likelihood of further Confrontation between different religious forces and TFG and different clans Increased localized civil insecurity and clan tensions Increased resource based")
12 Civil Insecurity Most Likely Scenario (July- Dec. 09) Increased Likelihood of further Confrontation between different religious forces and TFG and different clans Increased localized civil insecurity and clan tensions Increased resource based conflicts, banditry and marine piracy Kenyan border closure affecting IDP population movement and cross border trade mainly cattle and other commodities Main Areas of Risk: Mogadishu, Bay, Bakool, Middle and Lower Shabelle, Hiran, Galgadud, Mudug including Galkacyo, Gedo and Juba regions Main Impact: Mainly urban areas and trade movements in conflict areas, more limited direct impact on rural populations.

13 Livestock Somalia: Rangeland Conditions and Livestock Migration July 09
14 Livestock Sector Trends in Livestock Holdings and Milk Production Region Conception (Gu 09) Calving/kidding (Gu 09) Milk production (Gu 09) Expected calving/ kidding July- Dec 09 Livelihoods Trends in Herd Size (Dec 09) Livestock species Gedo Juba Camel & Cattle: Low Sheep/Goats: Medium Camel: Low Cattle: Low to None Sheep/Goats: Medium Camel: Low Cattle: None Sheep/Goats: Low Camel: Low Cattle: medium Sheep/Goats: Medium Below Average for All species Camel: low Cattle: None Sheep/Goat: None Camel: low Cattle: None Sh/goats: Medium Camel: Medium Cattle: Low to None Sh/goats: Medium Southern Inland Pastoral Southern Agro-pastoral Dawa Pastoral Southeast Pastoral Southern Inland Pastoral Camel: Same (Above Baseline) Sheep/goats: Slight decreased (Below Baseline) Camel: Same (Above Baseline) Cattle: Decrease (Below Baseline) Sheep/goats: Slight Decrease (Below Baseline) Camel: Same (Near Baseline) Cattle: Decrease (Below Baseline) Sheep/goats: Slight decrease (Below Baseline) Cattle: decrease (Below Baseline) Sheep/goats: Increase (Below Baseline) Camel: Increase (Above Baseline) Sheep/goats: Increase (Below Baseline) Juba Agro-pastoral Cattle: decrease (Below Baseline) Sheep/goats: Increase (Below Baseline) Bakool Camel: Low Cattle: None Sh/Goats: Medium Camel: None Cattle: None Sh/Goats: Low to Medium Camel: Low Cattle: None Sh/Goats: Low Low for All species Southern Inland Pastoral B/Bakool Agro-pastoral Camel: Decrease (Below Baseline) Sheep/goats: Decrease (Below Baseline) Cattle: Decreased (Below Baseline) Sheep/goats: Decreased (Below Baseline) Bay M/L Shabelle Camel: Low Cattle: Low Sh/Goats: Medium L/Sh: Average for all species M.Sh: Low for all species Camel: Low Cattle: Medium Sh/Goats: Medium to High L/Sh: Average for all species M.Sh: Cattle, camel: Low Sh/goats: Medium to Low Camel: Average Cattle: Low Sh/Goats: Average M/Sh: Cattle, Goats: Below average Camel: Average Medium for all species M/Sh: Camel : Medium Sh/goats: low Cattle: Low L/Sh: Average Southern Agro-pastoral Shabelle Agro-pastoral Cattle: Increase (Same as Baseline) Sheep/goats: Increased (Same as Baseline) L/Shabelle: Increased all species M/Shabelle: Camel: increase Cattle &Sheep: Decreased (high deaths resulted from poor pasture & endemic disease)
15 Livestock Sector Trends in Livestock Holdings and Milk Production Region Conception (Gu 09) Calving/kidding (Gu 09) Milk production (Gu 09) Expected calving/ kidding July Dec 09 Livelihoods Heard Size Recovery Projected at (Dec 09) Livestock species Hiiran Camel: Low Cattle: None Sh/Goats: Medium to high Camel: None to low Cattle: None Sh/Goats: Medium to High poor all species Camel: Low Cattle: None Goat/sheep: Medium to High Hawd Pastoral Southern Inland Pastoral Camel: Same (Below Baseline) Sh/Goats: Increase (Below Baseline) Camel: Same (Below Baseline) Cattle: Decrease (Below Baseline) Goats: Increase (Below Baseline) Galgaduu d & south Mudug None for All species Camel: None Cattle: None Sheep/goats: None to low Very poor for all species Camel: None Cattle: None Sheep/goats: None Addun Pastoral Hawd Pastoral Camel: Decrease (Below Baseline) Cattle: Decrease (Below Baseline) Goats: Decrease (Below Baseline) Camel: Decreased (Below Baseline) Goats: Increased (Below Baseline) Northeast Camel: None to Low Sh/Goats: Medium to Low Camel: none to Low Sheep/Goats: Medium to Low Camel: Poor (Bari), Very poor in Mudug & Nugal regions Sh/Goats: Avearge (Bari), Poor (Mudg & Nugal) Camel: Medium(Bari), None ( Mudug & Nugal) Sh/Goats: Medium to Low Hawd Pastoral Nugal Pastoral Sool Pastoral Camel: decrease ( Below Baseline) Goats: Increase (Below Baseline) Camel: Decrease (Same as Baseline) Sh/goats: Increased (Above Baseline) Camel: increase (below baseline) Sh/goats: Increase (Above Baseline) Addun Pastoral Camel: Decrease ( Below Baseline) Sh/goats: Slight increase ( below Baseline) Northwest Camel: None Sh/Goats: Nugal Valley/Sool Plateau: Low Hawd/Golis Guban: Medium Camel: None Sh/goats: High to Medium Extremely Below Average for all species Camel: High to Medium except Nugal and Sool Plateau: Low Sh/Goats: Medium (Hawd, Golis/Guban) Low (Sool Plateau/Nugal valley Hawd Pastoral Guban/Golis Pastoral Sool Pastoral Camel: Increase (Above Baseline) Sh/goats: Decreased (Near Baseline) Camel: Increase(Above Baseline) Sh/goats: Slight Increase (Below Baseline) Camel: same (below baseline) Sh/goats: Decrease (Near baseline)


16 Livestock Water Availability Water trucked in Hawd Hargeisa Empty Communal Dam in Hawd AbudwaK Early depletion of water SIP Afmadow Dasa empty water catchment Elwaq - Gedo Empty Berkads Sool Plateau - Qardho Empty Teed communal water catchment- North Huddur


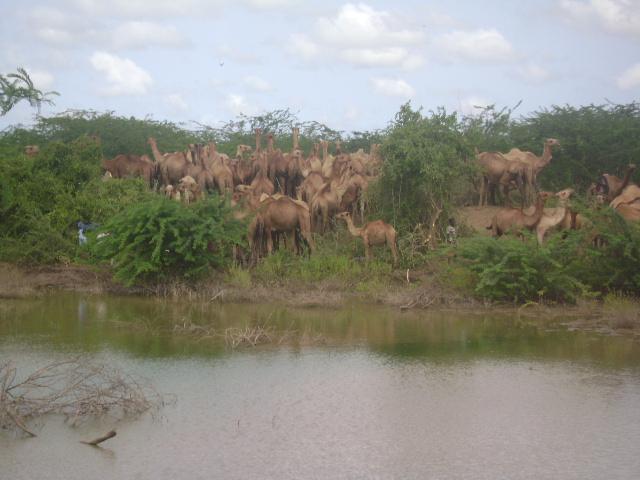
17 Livestock Pastoral Migration Using Different Means of Transport Motorized out migration from Nugal Valley In migration from Gedo Using Pack camels Afmadow Southeast Pastoral using Gedo Middle Shebelle migrating from to L/Shebelle Afmadow Southeast Pastoral using Ox


18 Livestock Livestock Body Conditions & Pasture: Camel & Cattle Emaciated camel body condition in Dh/mareeb Average cattle body condition in Juba Poor pasture & camel body condition in Nugal Valley Dead sheep Agropastoral W/Galbeed Good camel calving at Qorioley/L. Shebelle Poor camel body condition B/Jajdid/Tayeglow
19 Livestock

20 Livestock Trends in Local Cattle Prices Regional Average Monthly Prices Local Quality Goat (SoSh/SLSh)


21 Livestock Regional Trend in Local Goat Prices and Terms of Trade


 and Export")
22 Livestock Trends in Livestock Exports Berbera & Bossaso Total Annual Livestock Exports Compared to 5 year Average Berbera & Bossaso: Trend in Livestock Exports (Heads) and Export Quality Goat Prices (US$)
23 Livestock Carcass Meat Exported: Jan Jul Month Burao Beletweyne Mogadishu Galkayo January 7030 Data not available Data not available 5,086 February 7100 Data not available Data not available 4,143 March 7000 Data not available Data not available 5,511 April 5700 Data not available Data not available 4,200 May 6,300 Data not available Data not available 4,387 June 6,410 Data not available Data not available 5,060 July Data not available Data not available 3,110 Total Data not available Data not available 31,497
24 Agriculture Gu 09 Cereal Production in Southern Somalia Regions Gu 2009 Production in MT Maize Sorghum Total Cereal Gu 2009 as % of Gu 2008 Gu 2009 as % of Gu PWA ( ) Gu 2009 as % of 5 year average ( ) Bakol % 23% 76% Bay 3,800 34,500 38, % 106% 167% Gedo 1, , % 26% 67% Hiran % 20% 38% Juba Dhexe (Middle) Juba Hoose (Lower) Shabelle Dhexe (Middle) Shabelle Hoose (Lower) 10,300 10,100 20, % 242% 727% % 10% 29% 5,200 1,800 7, % 44% 50% 64,100 8,300 72, % 118% 170% Gu 2009 Total 85,700 55, , % 102% 158%
25 Agriculture Rice and Off-Season Cereal Estimates in Southern Somalia Gu 07 Cereal Prodction Estimates in Southern Somalia Off Season : Sept Oct Regions Maize (MT) Total Cereal Juba Dhexe (Middle) 1,625 1,625 Juba Hoose (Lower) 12,509 12,509 Total 14,134 14,134 Region Gu 09 Rice Production Estimates (MT) Gu 09 Rice production as % of Gu 08 Rice Production Shabelle Dhexe (Middle) Jawhar Only 2, % Total 2, %
26 Agriculture Cereal Production Plus Off-Season in Southern Somalia Regions Gu 2009 Production in MT Maize Sorghum Total Cereal Gu 2009 as % of Gu 2008 Gu 2009 as % of Gu PWA ( ) Gu 2009 as % of 5 year average ( ) Bakol Bay Gedo Hiran Juba Dhexe (Middle) Juba Hoose (Lower) Shabelle Dhexe (Middle) Shabelle Hoose (Lower) Gu 2009 Total % 23% 76% 3,800 34,500 38, % 106% 167% 1, , % 26% 67% % 20% 38% 11,900 10,100 22, % 256% 665% 13, , % 227% 554% 5,200 1,800 7, % 44% 50% 64,100 8,300 72, % 115% 156% 99,800 55, , % 111% 166%
, Southern Somalia Gu")

27 Agriculture Trends in Cereal Production (no off season), Southern Somalia Gu Cereal Production Trends ( ) Annual Cereal Production Trends ( )


28 Agriculture Regional Cereal Contributions Regional Contribution Gu 09 Cereal Production Maize Production Gu 09 Regional Contribution Sorghum Production Gu 09 Regional Contribution
29 Agriculture Gu Karan Crop Establishment Estimates Regions Gu 2009 Production in MT Maize Sorghum Total Cereal Gu-Karan 2009 as % of Gu-Karan 2008 Gu-Karan 2009 as % of Gu-Karan PWA ( ) Gu-Karan 2009 as % of 5 year average ( ) Awdal % 23% 19% Togdheer % 36% 21% Woqooyi Galbeed Gu-Karan 2009 Total 25 5,640 5,665 38% 38% 33% 43 6,562 6,605 38% 36% 30%

30 Agriculture Trends in Gu-Karan Cereal Production, Somaliland


31 Agriculture Gu 09 Poor Crops 1 1. Poor Sorghum Establishment. Garabis, Hargeysa, W. Galbeed, July Sorghum Crop Failure with limited fodder harvested by the Owner. Bulo Burte, Hiran, July Poor Riverine Maize Crop due to water stress. Moyka village, Jowhar, M. Shabelle, July 09 3


32 Agriculture Gu 09 Off-Season Good Crops 1 1. Good Sorghum Crop. Finka Weer, Sakow,M. Juba, July, Good Rainfed Maize Crop. K50, Marka, L. Shabelle, July Good Sorghum Crop. Boodaale, Burhakaba, Bay, July
33 Agriculture Cash Crop Production Estimates in Southern Somalia Regions Gu 2009 Production in MT Ground Off-Season Off-Season Cowpea Sesame Total Nut Cowpea Sesame Bakol Bay 2,060 1,073 1, ,858 Gedo Hiran Juba Dhexe (Middle) Juba Hoose (Lower) Shabelle Dhexe (Middle) Shabelle Hoose (Lower) Gu 2009 Total 312 3, , ,240 1, , ,090 6,009 5,304 1, ,900 15,740


34 Agriculture Gu 09 Cash Crops and Other income Activities Vegetable production_middle shabelle Fodder Collection, Jowhar, M. Shabelle, July 09. Good Banana and Cucumber Crops. Jilib, Middle Juba, July 09. Good Lettuce and Rice Crop behind. Jowhar, Middle Shabelle, July 09. Fodder Market. Jowhar. Miiddle Shabelle, July 09 Good Rain-fed Sesame Crop. Sakow, Middle Juba, July 09

35 Agriculture Cereal Flow Map
 417,534 MT 118% of year 2008 (352,385MT) 99% of 3-year average")
36 Agriculture Commercial Cereal Import Trends ( ) MT 2009 (Jan. July) 417,534 MT 118% of year 2008 (352,385MT) 99% of 3-year average (423,085MT)
37 Agriculture Annual Cereal Balance Sheet June 2009 to May 2010 Local Cereal Production and Food Aid Availability in Southern Regions Annual Cereal Balance Sheet for Somalia (June 2009 to May 2010) CEREAL BALANCE SHEET AT JULY % Net Commercial Imports ( 000MT) 75% Net Commercial Imports ( 000MT) DOMESTIC AVAILABILITY 276 Opening Stocks 16 Domestic Cereal Supply 09/ Gu Gu Karan 2009 Northwest 7 Off-season Gu Estimated Deyr 09/10 95 DOMESTIC UTILISATION Cereal Utilization Requirements 636 IMPORT REQUIREMENTS Anticipated Commercial Imports ESTIMATED SURPLUS/DEFICIT CEREAL Stocks, Transit and Pipeline WFP ICRC ESTIMATED SURPLUS/DEFICIT CEREAL


38 Agriculture Regional Trends in Cereal Prices & Terms of Trade Regional Trend in Cereal Prices (SoSh/SLSH) Regional Trend in Terms of Trade: Cereal to Labor (kg of cereal/daily wage)

39 Markets Trends in Exchange Rates Monthly Exchange Rates - SoSh and SlSh to USD Factors Affecting: Depreciation Since Jan. 07 to Sept 08 Excessive printing of SoSh High demand of USD Low remittance Lack of confidence in Somali Shilling Speculation and expectations Appreciation Since Oct. 08 Significant increase in USD o Piracy o Proceeds from livestock sales Cessation SOSH printing Slowdown of business activities and exports


40 Markets Imported Commodity Prices Compared to Exchange Rates Shabelle Region: Trend in Imported Commodity Prices compared to Exchange Rate Central: Imported Commodity Prices compared to Exchange Rate Factors affecting Commercial Import Prices Devaluation of SoSh (Imports expensive) Increased Global Prices High Importation Costs (Piracy/Fuel/Taxes) High Transportation Costs Low Supply Disrupted Market Activities Reduced Trade Flows Low Substitute Commodity Trade Collusion Tariffs and Taxations

41 Markets Consumer Price Index (Min. Expenditure Basket)
42 Markets Trends in Cereal Prices, Wage Rates and TOT (SoSh) Northeast South


43 Markets Comparison of Rice Price in Mogadishu and International Asia Markets; January 2007 July 2009

 are done by women, while these are managed by men during dry seasons Huge")

44 Impact of Gu 09 Performance on Gender During normal seasons most pastoral activities (e.g. looking after animals, fetching water and firewood, sale of livestock products and food purchase) are done by women, while these are managed by men during dry seasons Huge livestock migration (including lactating animals) in search of pasture and water resulted in family splitting with women and children remaining behind Jidbaale, July 09 Qandhicilay, July 09 Jidbaale, July 09 Abandoned women and children in the drought affected settlements, Hawd of Sool, July 09
 Loss of control on the income from productive activities, such as livestock product & crop sales Lack of access to the social support for women left behind")
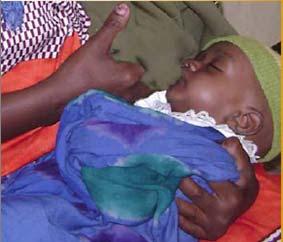
45 Main effects on women: Continued Lack of milk production/consumption, affecting the nutritional status of women and children as evidenced by nutritional surveys ( critical to very critical situation in Gedo, Central/Hiran, northern Bakool) Loss of control on the income from productive activities, such as livestock product & crop sales Lack of access to the social support for women left behind Increased burden due to fetching water, fuel and wood from long distances %


46 Nutrition Overview Gu 09
47 Nutrition Nutrition Information Sources Gu 09 (April July) Nutrition Surveys 33 detailed nutrition surveys conducted (All FSNAU includes, 23 SMART, 4 LQAS, 5 exhaustive) 17 focused on repeating livelihood level surveys from 6 and 12 months ago for South Central 3 focused on concerning areas in northwest / northeast from Deyr analysis 4 focused on district / regional (Belet Weyne, Adale, Galgadud & Mudug) 8 focused on IDP populations (Hargeisa, Berbera, Burao, Garowe, Gardo, Galkahyo, Bossasso, Afgooye & Merka) 1 focused on vulnerable urban populations (Bossasso) Rapid Assessments using MUAC: (137 sites & 11,904 children 6-59months) Predominantly, NW. NE, Mogadishu & Belet Weyne Conducted in 46 urban centres (n=4740) Conducted in 91 rural settlements (n=7164) Health Centre Monitoring Collected from 100 health centres from all regions (irregular in places e.g. Bakool) Related Selective Feeding Centre Data Information from partners: Central, Hiran, Bakool, Bay, Juba and Mogadishu patchy and limited due to interrupted programming e.g. IMC, ACF Secondary Related Data (risk factors for deterioration) Disease outbreaks e.g. malaria, AWD outbreaks, Hiran, Central, NE, NW Programme access disruption: Bakool, Bay, Central, Gedo Displacement; in and out of Mogadishu
48 Northwest : Confirmation of improvement in West Golis from Very Critical to Serious. Critical in East Golis and Guban & Karkar. Serious with risk to deterioration in other areas, still concerns IDP. Hot spot in south Toghdeer Shabelles: Sustained Serious in IDPs and riverine slight deterioration (not sig) to Critical in Agropastoral. Rapid MUAC assessment shows Very Critical in Mogadishu. Summary of Key Findings Northeast: Deterioration to Critical in Guban & Karkar and Serious in Nugal. IDP populations remain Very Critical. Bay/ Bakool: Bay agropastoral deterioration to Very Critical, Bakool agropastoral improvement to Serious and Bakool Pastoral sustained Very Critical. Central & Hiran: Sustained Critical in Addun, and Hawd (slight improvement in Hawd but not sig.) Cow pea belt and Coastal Deeh stable at Serious. Hiran sustained Critical in riverine and Very Critical (deterioration) in agro pastoral. Juba Deterioration to Very Critical in agropastoral and pastoral likely linked to disease outbreak stable in riverine at Serious Gedo: Sustained Very Critical in pastoral & riverine. Slight improvement to Critical in agropastoral

49 Gu 2009 Nutrition Survey Results Overview Crude and Under 5 yrs mortality rates generally stable with exception of Shabelle AP, Juba AP & Riverine and Gedo AP which were at alert levels

50 Nutrition Trends in levels of Global Acute Malnutrition (WHO GS) Gu 2009 The national median rate is 19% GAM and 4.6% SAM, which means almost 1 in 5 children acutely malnourished and 1 in 20 severely malnourished.
 and Sth Central (32%)!")
51 Nutrition Trends in levels of Stunting and Wasting (WHO GS) Gu 2009 Consider the difference in NW (11%) and Sth Central (32%)!!!

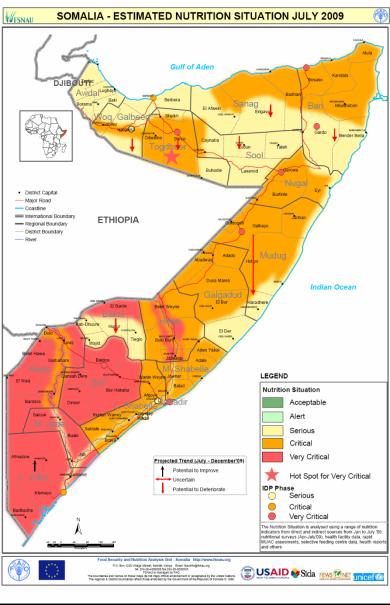
52 Nutrition Situation Estimates - Maps Nutrition Situation Estimates, January 2009 Nutrition Situation Estimates, July 2009
53 South / Central: Summary Northwest/ Northeast populations: Overall mixed picture, still high levels of nutritional vulnerability, Particular concern over areas with Very Critical, Gedo, Juba, Bay, Bakool, parts of Hiran and Mogadishu in many areas more likely linked to disease rather than food access Lack of further deterioration in Central likely linked to humanitarian interventions however populations still vulnerable However significant decreasing humanitarian space for agencies to meet to provide programmes, fewer partners risk factor for further deterioration e.g. Central & Bakool Overall mixed picture West Golis recovery likely linked to returning livestock, increased access to milk and humanitarian interventions East Golis & Guban/ Karkar now of concern due to Critical rates Deterioration in Sool, Nugal and Hawd likely as a result of decreasing food security All IDP populations continue to be very nutritionally vulnerable More opportunities for response improvement in vaccination coverage due to CHD Major contributing cases continue to be disease (esp AWD) due to WASH deficiencies, poor IYCF, and limited health services exacerbated by poor dietary quality Major contributing cases for IDPs continue to be disease, poor IYCF, and limited health services exacerbated by poor dietary quality - for rural areas more linked to food insecurity
54 B. Current Food & Livelihood Security Phase Classifications Summary Results


55 Somalia Integrated Food Security Phase Classification Rural IPC Populations January June 2009 Rural IPC Populations July December 2009


56 Somalia Integrated Food Security Phase Classification Urban and IDP IPC Populations January June 2009 Urban and IDP IPC Populations July December 2009


57 Somalia Integrated Food Security Phase Classification Rural, Urban and IDP Combined IPC Populations January June 2009 Rural, Urban and IDP Combined IPC Populations July December 2009
58 Rural, Urban & IDP Populations in Crisis, July - December 2009 Region UNDP 2005 Total Population UNDP 2005 Urban Population UNDP 2005 Rural Population Urban in Acute Food and Livelihood Crisis (AFLC) Rural in Acute Food and Livelihood Crisis (AFLC) Urban in Humanitarian Emergency (HE) Rural Humanitarian Emergency (HE) Total in AFLC and HE as % of Total population North Awdal 305, , ,513 5,000 25, Woqooyi Galbeed 700, , ,913 55,000 30, Togdheer 402, , ,893 55,000 75,000 20,000 5, Sanaag 270,367 56, ,288 20,000 75,000 5,000 15, Sool 150,277 39, ,143 15,000 35,000 5, Bari 367, , ,737 80, , Nugaal 145,341 54,749 75,860 25,000 15, , Sub-total 2,341,718 1,054,371 1,287, , ,000 55,000 25, Central Mudug 350,099 94, ,694 30,000 40, , Galgaduud 330,057 58, ,080 15,000 35,000 10, , Sub-total 680, , ,774 45,000 75,000 10, , South Hiraan 329,811 69, ,698 25,000 35,000 5, , Shabelle Dhexe (Middle) 514,901 95, ,070 25,000 60, , Shabelle Hoose (Lower) 850, , ,937 35,000 50,000 10,000 5, Bakool 310,627 61, ,189 25,000 65, , Bay 620, , ,749 20,000 5, ,000 5 Gedo 328,378 81, ,076 30,000 80, , Juba Dhexe (Middle) 238,877 54, ,138 10,000 5, Juba Hoose (Lower) 385, , ,108 20,000 10, Sub-total 3,579, ,632 2,792, , ,000 15, , Banadir 901, ,183-30,000-55,000-9 Grand Total 7,502,654 2,895,568 4,607, , , , , Assessed and Contingency Population in AFLC and HE Number affected % of Total population Distribution of populations in crisis Assessed Urban population in AFLC and HE 655, % Assessed Rural population in AFLC and HE 1,415, % Estimated number of new IDPs-updated 2nd Aug 2009 (UNHCR) 1,420, % Estimated number of protracted IDPs 275, % Estimated Rural, Urban and IDP population in crisis 3,765, %
59 Somalia IPC Table Trends in Rural, Urban & IDP Populations in Crisis Jan-Jun '08 Revised Apr-Jun '08 Jul-Dec '08 Jan-Jun '09 Jun Dec 09 % Increase or decrease (A) (B) (C) (D) (E) (D to E) Urban - 576, , , ,000-7% Rural 850, ,000 1,395,000 1,170,000 1,415,000 16% New IDPs 705, , ,000 1,020,000 1,419,000 39% Protracted IDPS 275, , , , ,000 0 Total 1,830,000 2,627,000 3,245,000 3,170,000 3,764,000 17%
60 Somalia IPC Table Distribution of Rural Populations in Crisis Comparison of Deyr 08/09 and Gu 09 HE increased from 680,000 to 775,000 (13% increase) Primarily due to increase in HE in Central, Hiran and Bakool Off-set by reduction of HE in L. Shabelle AFLC increased from 535,000 to 640,000 (19% increase) Primarily due to increase in AFLC in north Zone UNDP 2005 Total Population UNDP 2005 Rural Population Acute Food and Livelihood Crisis (AFLC) Humanitarian Total in AFLC & Emergency (HE) HE % of Total in AFLC & HE Central 680, ,774 75, , , North East 1,213, ,510 15,000 5,000 20,000 1 South 4,480,780 2,792, , , , North West 1,128, , ,000 20, , Grand Total 7,502,654 4,607, , ,000 1,415,
61 Somalia IPC Table Distribution of Urban Populations in Crisis Comparison of Deyr 08/09 and Gu 09 HE slight decreased from 140,000 to 135,000 Due to slight decrease in HE L. Shabelle AFLC decreased from 565,000 to 520,000 Due to decrease in AFLC South (L. Shabelle, Bay, & M Juba) Off-set by increase in AFLC in north Zone UNDP 2005 Total Population UNDP 2005 Urban Population Acute Food and Humanitarian Livelihood Crisis Emergency (HE) (AFLC) Total in AFLC & HE % of Total in AFLC & HE Central 680, ,382 45,000 10,000 55,000 8 North East 512, , ,000 25, , South 4,480,780 1,687, ,000 70, , North West 1,828, , ,000 30, , Grand Total 7,502,654 2,895, , , ,
62 Implications for Actions Humanitarian Access Actions to increase humanitarian space and safety to ensure that growing number of populations in need, receive assistance Emergency Humanitarian Assistance: To Save Lives Targeted to areas & livelihood groups identified in HE Targeted to areas & livelihood groups identified in Critical & Very Critical Nutrition Increased attention to areas where past/current needs exceed response Scale-up in HE areas continuing to deteriorate (Central, Hiran, M. Shabelle, Bakool) IDP and Urban populations identified in HE and with high rates of malnutrition Emerging rural HE areas in the North (Togdheer Agro-pastoral & Sool Plateau Pastoral) Emergency Livelihood Support: To Save Livelihoods and Prevent Deterioration to HE Priority both in areas & livelihood groups in AFLC, but also in HE Scale-up of emergency livelihood support in the south (L & M Shabelle, Gedo, Bakool) Scale-up of emergency in northern drought affected areas Poor and most vulnerable urban populations that are not able to cope with prolonged high food and nonfood prices