RP20 Burdekin Nitrogen Trials
|
|
|
- Milton Carpenter
- 5 years ago
- Views:
Transcription


1 RP20 Burdekin Nitrogen Trials Case Studies and Trial Results
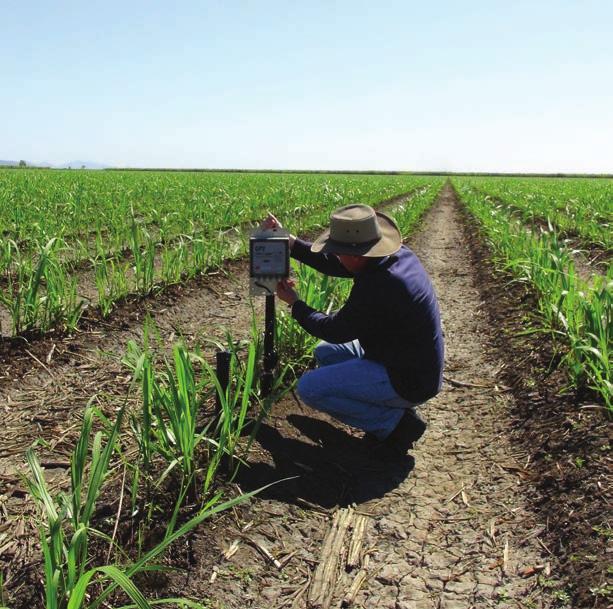
2 02 RP20 Burdekin Nitrogen Trials The nitrogen equation: how less is giving growers more The Burdekin Nitrogen Trials (RP20) were established to determine whether the method provided adequate nitrogen application rates following the introduction of regulations for nitrogen (N) and phosphorous (P) inputs in sugarcane production. This project has shown that the guidelines for applying nitrogen maintain productivity and maximise profitability in all cases where the trial covered more than one year. The variation in yields observed between farms in the Burdekin has been found to be primarily due to soil types and farm management. Good farm management is the key component for achieving high yields. This project continues to demonstrate that high nitrogen application rates do not compensate for poor farm management practices. Funded by the Department of Environment and Heritage Protection, RP20 has been a successful collaboration between cane farmers in the Burdekin, Sugar Research Australia and the Queensland Government. RP20 was established in 2011 to determine the adequacy of the regulated N for sugarcane production A technical management group, involving SRA and DSITI, is responsible for ensuring that the work was scientifically sound The project is funded by the Department of Environment and Heritage Protection (EHP) Sugar Research Australia (SRA) established replicated and randomised large-scale strip trials on the major soil types found in the Burdekin region 23 grower collaborators have participated in this project: * trial sites * trial sites * trial sites * trial sites * trial sites = 57 trial sites in total A number of factors were considered when establishing the trial sites: * Block size * Block shape * Soil uniformity * Irrigation systems employed * Pest control measures * Yield history Trial sites are equally distributed between the Delta and BRIA Data collected from the trial sites include: * General plant growth and pest pressure * Plant nutrient status via leaf analyses * Sugarcane biomass accumulation * Irrigation water quality * Soil mineral nitrogen pre planting and post-harvest * Sugarcane yield, commercial cane sugar () content and calculated sugar yield RP20 has covered 12,000 hectares of Burdekin cane land. The total nitrogen saving from this project is 499 tonnes, without compromising sugar yield and profitability.
3 03 What the grower collaborators have learned from the trials 1) The method for calculating fertiliser requirements provides adequate nitrogen to grow cane to its maximum potential. 2) The trial data shows that where a trial site has run for more than one year, the method is shown to be more profitable to the farmer 100% of the time. 3) The trials have shown that farm management practices play an important role in growing cane. 4) Soil samples are crucial in determining the correct fertiliser to apply for your own soil types. 5) Identifying possible loss pathways, fertiliser placement and timing, irrigation scheduling, compaction and weed control are all important considerations. 6) Different varieties of cane may require different management strategies. 7) Too much nitrogen can have a negative effect on and sugar yield. 8) It is important to get your fertiliser box calibrated to make sure you are putting on the correct amount. I found it really interesting with my experiment, on my block, on my soil, with my crop that it didn t matter what rate of nitrogen we put on, the results were very similar. That showed me that the more nitrogen I put on I wasn t actually getting any benefit from. Ross Gambino In all of the five crops it showed up that with the extra nitrogen my sugar was lower but the tonnes were no different. That was a real eye opener to me. Jim Richardson If you put on more than recommended, it s just wasting money. Allan Richardson As far as losses go, we ve learned a lot about that and have modified our farming operation to control those and get the best benefit from the nitrogen we do put on. It s keeping the farm well managed with the use of that shows us the benefit of financial returns. Steve Pilla We were steadfast in that belief that we needed 290 of nitrogen to grow good crops of cane, which we don t. It s proven now. Eric Barbagallo We re all about being cost effective and this project has highlighted that the most. Warren Caspanello Going forward, I know there s more to be done. This project has inspired me to continue challenging the norms and strive for continuous improvement, which is exciting. I know I can add to what I got out of this. Frank Catalano We are here with lower fertiliser rates and growing more cane than we used to by looking at the whole farm management plan and fertiliser is one part of it. Ryan Matthews The way Julian (SRA Agronomist) conducted all the trials was really professional and exact so you get the true results. Frank Gorizia
4 04 Weather conditions Weather conditions play a large role in crop performance. As many of these variables cannot be controlled, they are noted below to add further context to the trial outcomes. Over the five year period in which the trials were conducted ( ), extremes in weather conditions were encountered No cultivation until April due to effects of 2010 season Ground was compromised which compromised on ground preparation Couldn t laser due to wet Planted in May (late plant) 2012 Harvest results of plant cane were poor due to inadequate ground preparation in 2011 High June/July rainfall compromised harvest and meant a late crush and reduced yield was fairly flat Did not get the negative impact of higher nitrogen on Ideal growing years 2016 Late harvest due to rain Tonnes up but down Taking the variable weather conditions into account, the trial results confirm that the guidelines provide the best method for calculating fertiliser requirements to maximise profitability and sustainability.

5 05 NUE and the nitrogen budget Apart from verifying the effectiveness of the method for calculating nitrogen fertiliser requirements in the Burdekin, the data collected through this project has enabled researchers to gain further insight into when the crop takes up nitrogen and the complex interactions between soil nitrogen, seasonal conditions and crop recovery of applied nitrogen fertiliser. The project found that cane crops in the Burdekin required about 1.2 kilograms of nitrogen in the tops plus roots and stool to produce 1 tonne millable stalk; consequently high yielding crops needed to uptake more nitrogen per hectare to meet their demands than lower yielding crops. As shown in the diagram, the crop obtains most of its nitrogen requirements from applied fertiliser and in-season nitrogen mineralisation from soil organic matter. The challenge for the grower is to get as much of the applied fertiliser nitrogen into the crop as possible. There are many nitrogen loss pathways such as leaching, runoff and denitrification, and the magnitude of these losses in a cropping season will depend on volume applied, soil type, seasonal conditions and its position in the landscape and soil profile. Volatilisation Denitrification Ammonium-N Soil organic matter Nitrate N Runoff Millable stalk Leaching In-season soil N mineralisation Trash/roots Trying to mitigate nitrogen losses with appropriate management practices will increase the crop s ability to take up applied fertiliser, and thereby maximise the grower s return on the fertiliser investment as well as reducing any possible environmental impacts. A useful indicator of nitrogen use efficiency is kilograms of applied nitrogen required per tonne of cane produced. For example, blocks that have a history of requiring large amounts of applied nitrogen to produce a tonne of cane may have an underlying soil or site constraint that, if mitigated, could increase productivity. Growers can monitor nitrogen use efficiency to identify sections of the farm where there are soil or site constraints limiting crop uptake of applied nitrogen, or where there might be large losses of nitrogen occurring.
6 06 RP20 Burdekin Nitrogen Trials - project partners The RP20 project has been an exciting collaboration between cane farmers, industry and the Queensland Government. Each of the partners played a crucial role in the project s success. Burdekin cane farmers worked with the project team to adjust fertiliser rates in line with the industry standard, freely giving their time and putting their farms into the hands of the project team. At the same time their dedication and open-mindedness has shaped the way trials were conducted, allowing them to learn from the scientists involved to fine tune their farming practices. Sugar Research Australia (SRA) provided an agronomist who worked directly with cane farmers to undertake rigorous trials on their farms and data analysis to support industry standards reinforced by science. As a body independent from government, SRA provided reassurance to cane farmers seeking comfort in the validity of science and the trials. In addition, SRA has been a marketing lead on this project promoting project results via industry run forums, to encourage greater uptake of the industry standard,. Department of Science, Information Technology and Innovation (DSITI) team has led trial design to achieve scientifically robust results and provided data analysis that investigated nitrogen uptake by the plant and its efficiency, also undertaking specialised soil and plant analyses which supported agronomic measurements. Department of Agriculture and Fisheries (DAF) team played an important role in the project by undertaking economic evaluations to compare the profitability of the different nitrogen rates, and communicated the findings to farmers involved in the project and industry. Department of Environment and Heritage Protection (EHP) team funded this project with over $2.5 million, pulling together scientists, industry and growers to address a specific and crucial need, negotiating contract terms and issues across project partnerships, project managing and enabling the project to continue despite a variety of challenges it faced over the past six years. RP20 has achieved its main objective with SRA determining the optimum amount of nutrients required on Lower Burdekin representative soils for plant and ratoon cane crops. Furthermore, the project has revealed that nitrogen management is only one element of the cane farming system to consider for optimising productivity and profitability. Once other farming practices are improved, nitrogen is used more efficiently by the crop, maximising sugarcane production and reducing nitrogen loss to local waterways. This case study booklet provides a summary of each trial s yield, CSS and economic outcome along with details about each farming situation. Further detail and a full statistical analysis can be found in the project s final report, available at: Copyright 2017 by Sugar Research Australia Limited. All rights reserved. No part of Burdekin Nitrogen Trials (this publication), may be reproduced, stored in a retrieval system, or transmitted in any form or by any means, electronic, mechanical, photocopying, recording, or otherwise, without the prior permission of Sugar Research Australia Ltd. Disclaimer: In this disclaimer a reference to SRA, we, us or our means Sugar Research Australia Limited and our directors, officers, agents and employees. Although we do our very best to present information that is correct and accurate, we make no warranties, guarantees or representations about the suitability, reliability, currency or accuracy of the information we present in this publication, for any purposes. Subject to any terms implied by law and which cannot be excluded, we accept no responsibility for any loss, damage, cost or expense incurred by you as a result of the use of, or reliance on, any materials and information appearing in this publication. You, the user, accept sole responsibility and risk associated with the use and results of the information appearing in this publication, and you agree that we will not be liable for any loss or damage whatsoever (including through negligence) arising out of, or in connection with the use of this publication. We recommend that you contact our staff before acting on any information provided in this publication. Warning: Our tests, inspections and recommendations should not be relied on without further, independent inquiries. They may not be accurate, complete or applicable for your particular needs for many reasons, including (for example) SRA being unaware of other matters relevant to individual crops, the analysis of unrepresentative samples or the influence of environmental, managerial or other factors on production.
 of 180 tc/ha.")
7 07 Case Studies BRIA The benefits and results that each grower has taken from the trial vary, however there is one factor that is consistent the method is shown to produce the best financial outcome. The following case studies compare the amount of nitrogen that the grower used before being involved in the trial with the, calculated using a district yield potential (DYP) of 180 tc/ha. The following parameters have been used to calculate costs and revenue in the trial case studies: Key parameters Sugar price $424/tonne, (5-year average, ) Relative Actual ccs daily pool ccs + seasonal pool ccs Cane payment formula (cane price) $424 x x (-4) Gross revenue Harvesting cost + levies Fertiliser prices Cane price x tonnes cane per hectare $8.11/tonne, ex GST Sourced from local supplier, ex GST
8 08 Site 2 (BRIA) Changed approach to farming BRIA farm Location Millaroo Variety KQ228 A Non Sodic Duplex Sand QDPI 6Dbg 0.35% Total area of trial block 5.4 ha The motivation to become involved in the Burdekin Nitrogen Trials was clear for John to prove that in the Burdekin growers needed to be putting on the amount of nitrogen that they always had been in order to remain productive. Like many, John felt that more nitrogen would produce higher yielding cane. When the cane was looking less than ideal I would apply more nitrogen as I genuinely thought that this is what the cane needed. After being presented with the first year of data for this trial site, John was very surprised. He did not expect to see little difference in tonnes across the various treatments in his plant cane. The results of the first ratoon showed the same result, at which point he was convinced that higher nitrogen rates did not improve his crop and that the method for calculating fertiliser requirements was the way to go. By the third year of the trials, this grower was so convinced by what he had seen from the first two years that he began changing his farming practices. It wasn t only that he was now using the method to calculate his fertiliser requirements across his whole farm, he now operated in an entirely different way. I changed the way that I farmed altogether. I ve gone from focusing on nitrogen to looking at all areas of farm management, in particular irrigation management and weed control. Having changed my view about nitrogen, RP20 has led me to look at other elements, which is why I have now become involved in a further program looking at my farm s nutrient management plans. I have discovered that my soil is low in other nutrients, which I didn t realise before. I m also gaining a better understanding of irrigation management and using tools to measure soil moisture. I m now basing decisions on the information I get through these monitoring tools rather than just from looking at the cane. Differences in profitability over full crop cycle Fertiliser cost savings over trial block when comparing with high rate (over full crop cycle) Fertiliser cost high rate () $2,331 Fertiliser cost () $2,085 Fertiliser cost saving () $246 Fertiliser cost saving over trial block ($) $1,329 Potential improvement in earnings over trial block when comparing with high rate (over full crop cycle) Revenue less HC&L* high rate () $16,172** Revenue less HC&L* () $16,211 Potential increase in earnings () $39 Potential increase in earnings over trial block ($) $210 Increase in block profitability: $1,540 Potential increase in profitability over 100 hectares: $28,510 * Revenue less HC&L refers to revenue less harvesting costs and levies. Potential savings and increase in return will be dependent on environmental and seasonal factors such as soil variation across the farm, rainfall, management methods, harvest conditions. All prices are excluding GST. This case study compares the amount of nitrogen that the grower used before being involved in the trial with the SIX EASY STEPS rate calculated using. ** Predicted value from statistical analysis

9 09 Site 2 (BRIA) Cane yield Sugar yield Relative Gross revenue Fertiliser costs Harvesting costs + levies Net revenue Date planted: 01/05/2011 Date harvested: 10/09/2012 DYP 150* $5,774 $392 $1,099 $4, $5,956 $447 $1,140 $4,368 Grower rate $6,021 $503 $1,165 $4,353 1 st Ratoon Date harvested: 31/07/2013 DYP 150* $4,696 $507 $871 $3,318** $4,919 $570 $916 $3,433 Grower rate $4,860 $634 $923 $3,303** 2 nd Ratoon Date harvested: 12/08/2014 DYP 150* $4,568 $503 $872 $3, $4,465 $567 $858 $3,040 Grower rate $4,438 $630 $862 $2,946 3 rd Ratoon Date harvested: 09/09/2015 DYP 150* $4,577 $437 $804 $3, $4,608 $500 $823 $3,285 Grower rate $4,456 $563 $822 $3,070 * The N rate is 20 kg below the calculated using DYP 150 DYP 150 District yield potential of 150 tc/ha District yield potential of 180 tc/ha ** Predicted value from statistical anaylsis Comparison of trial site and Productivity Group Productivity Group average () Trial block average ()
10 10 Site 5 (BRIA) Suiting management style to conditions for maximum result BRIA farm Location Giru Variety Q200 A Sodic Duplex Loam QDPI 6Drc 0.87% Total area of trial block Going into the trial believing that nitrogen was making the difference, Steve was worried about the effect that the lower nitrogen rates would have on his crop. He was convinced that he would see a difference between the various treatments. The data from the first year of the trial showed very little difference in tonnage between treatments, at which he was surprised and thought that there must be something wrong. When the data from the second year was presented and again showed no noticeable difference between the trialled nitrogen rates, he realised that things other than nitrogen were driving tonnes. In 2013 weed management was identified as a problem. The crop was gappy in places causing weed issues in the second year, which were then addressed. Steve also began to focus on improving irrigation, having encountered channel supply problems in He ensured that the crop received water when needed and found he got a better yield with his first ratoon than in his plant cane due to better irrigation scheduling and weed management. While I was disappointed that tonnage wasn t there during the first year of the trial, I realised nitrogen was not the reason. Throughout the trial I began to focus on other areas such as weed control and irrigation, from which I had good results. After seeing the results from the first three years of the trial, this grower decided to reduce the rates on his trial blocks, including a low rate of ENTEC. This trial taught me that if the crop is well managed, nitrogen will not make the difference. I now assess what the conditions are that I cannot control and suit the management style to achieve the best possible result. 20 ha Differences in profitability over full crop cycle plant cane to 2 nd ratoon Fertiliser cost savings over trial block when comparing with high rate (plant cane to 2 nd ratoon) Fertiliser cost high rate () $1,548 Fertiliser cost () $1,117 Fertiliser cost saving () $431 Fertiliser cost saving over trial block ($) $8,617 Potential improvement in earnings over trial block when comparing with high rate (plant cane to 2 nd ratoon) Revenue less HC&L* high rate () $11,621 Revenue less HC&L* () $11,685 Potential increase in earnings () $64 Potential increase in earnings over trial block ($) $1,280 Increase in block profitability: $9,897 Potential increase in profitability over 100 hectares: $49,486 * Revenue less HC&L refers to revenue less harvesting costs and levies. Potential savings and increase in return will be dependent on environmental and seasonal factors such as soil variation across the farm, rainfall, management methods, harvest conditions. All prices are excluding GST. This case study compares the amount of nitrogen that the grower used before being involved in the trial with the SIX EASY STEPS rate calculated using.

11 11 Site 5 (BRIA) Cane yield Sugar yield Relative Gross revenue Fertiliser costs Harvesting costs + levies Net revenue Date planted: 10/09/2012 Date harvested: 02/10/ st Ratoon Date harvested: 07/10/ $3,861 $280 $764 $2,817 Grower rate $3,918 $336 $771 $2,811 High rate $3,885 $392 $782 $2, $5,234 $408 $1,071 $3,755 Grower rate $5,275 $486 $1,093 $3,696 High rate $5,356 $563 $1,096 $3,696 2 nd Ratoon Date harvested: 19/10/ $5,421 $429 $997 $3,995 Grower rate $5,464 $511 $1,011 $3,943 High rate $5,241 $593 $983 $3,666 ENTEC, very low $3,725 $422 $769 $2,535 3 rd Ratoon Date harvested: 20/11/2016 DYP $3,678 $399 $770 $2, $3,463 $455 $733 $2,275 DYP 150 District yield potential of 150 tc/ha District yield potential of 180 tc/ha Comparison of trial site and Productivity Group Productivity Group average () Trial block average () 109.9

12 12 Site 17 (BRIA) sufficient to grow a profitable crop BRIA farm With good farm management practices and understanding of the method of calculating nutrient requirements, the trials confirmed for Ryan what he had suspected. Location Giru The trial cemented my thinking that there is no need to apply higher levels of nitrogen to accommodate for environmental conditions. The has enough buffer in it as shown by the results from low nitrogen rate application. Variety Q183 A Sodic Duplex Loam QDPI 6Drc 0.91% Total area of trial block 45 ha Differences in profitability over plant cane and 1 st ratoon crops Fertiliser cost savings over trial block when comparing with grower rate (plant crop and 1 st ratoon) Fertiliser cost grower rate () $732 Fertiliser cost () $620 Fertiliser cost saving () $112 Fertiliser cost saving over trial block ($) $5,029 Potential improvement in earnings (revenue less harvest costs and levies) over trial block when comparing with grower rate (plant crop and 1 st ratoon) Revenue less HC&L* grower rate () $11,314 Revenue less HC&L* () $11,285 Potential increase in earnings () -$29 Potential increase in earnings over trial block ($) -$1,298 Increase in block profitability: $3,732 Potential increase in profitability over 100 hectares: $8,293 * Revenue less HC&L refers to revenue less harvesting costs and levies. Potential savings and increase in return will be dependent on environmental and seasonal factors such as soil variation across the farm, rainfall, management methods, harvest conditions. All prices are excluding GST. This case study compares the amount of nitrogen that the grower used before being involved in the trial with the SIX EASY STEPS rate calculated using.

13 13 Site 17 (BRIA) Cane yield Sugar yield Relative Gross revenue Fertiliser costs Harvesting costs + levies Net revenue Date planted: 20/04/2014 Date harvested: 28/06/2015 (approx.) 150* $7,809 $341 $1,479 $5,989 Grower rate minus 10 kg of N $7,604 $397 $1,471 $5,737 High rate $7,869 $467 $1,481 $5,922 1 st Ratoon Date harvested: 12/06/2016 DYP $6,269 $224 $1,215 $4, $6,232 $279 $1,277 $4,676 Grower rate $6,462 $335 $1,281 $4,845 * This is 10 below the calculated using the DYP180 DYP 150 District yield potential of 150 tc/ha District yield potential of 180 tc/ha Comparison of trial site and Productivity Group Productivity Group average () Trial block average ()


14 14 Trial Results BRIA The following trial results include all trials for the duration of the project. These results cover all major soil types to ensure that findings of this project are applicable to all sugarcane growers in the Burdekin region. 3 TRIAL SITES 7 TRIAL SITES 1 TRIAL SITE The graphs contained in the following trial results use Relative to calculate revenue.
15 15 Trial results Site 2 BRIA farm Non Sodic Duplex Sand QDPI soil type 6Dbg Crop variety KQ228 A 0.35% Mean results for tonnes of cane, sugar and for each nitrogen treatment Cane yield Sugar yield Date planted: 01/05/2011 Date harvested: 10/09/2012 DYP * Grower rate DYP * st Ratoon Date harvested: 31/07/ Grower rate DYP * nd Ratoon Date harvested: 12/08/ Grower rate DYP * rd Ratoon Date harvested: 09/09/ Grower rate * This rate is 20 below Six Easy Steps DYP 150 Revenue less fertiliser, harvesting costs and levies over full crop cycle $16,000 $14,000 $14,253 $14,300 $12,000 $14,126 $13,795 $13,841 $10,000 $8,000 $6,000 $4,000 $2,000 This trial site was generally well managed over the duration of the crop cycle. The crop was established with few gaps. The incidence of weeds was low to moderate. The difficulty for the grower at this site is its very sandy, low organic carbon soil, which is prone to leaching, has poor water holding capacity and a very low cation exchange capacity, which limits the ability of the soil to hold on to essential nutrients such as potassium, calcium and magnesium. Due to the remote location of this site there are limited options for importing organic material such as mill mud to improve organic carbon levels. $0 DYP 150 Grower rate NItrogen rate
16 16 Trial results Site 5 BRIA farm Sodic Duplex Loam QDPI soil type 6Drc Crop variety Q200 A 0.87% Mean results for tonnes of cane, sugar and for each nitrogen treatment Cane yield Sugar yield Date planted: 10/09/2012 Date harvested: 02/10/ st Ratoon Date harvested: 07/10/ nd Ratoon Date harvested: 19/10/ rd Ratoon Date harvested: 20/11/ Grower rate High rate Grower rate High rate Grower rate High rate ENTEC (very low) DYP Revenue less fertiliser, harvesting costs and levies from plant to 2 nd ratoon* $12,000 The crop was established with some gaps throughout the trial site and the gaps were large enough to have negatively impacted yields to some degree. The incidence of gaps was randomly distributed across the block. $10,000 $8,000 $10,567 $10,450 $10,073 Weed management was reasonable however the incidence of weeds did increase in later ratoons. Irrigation management was fair however there were periods where irrigation frequency was less than optimum to achieve maximum cane yield at this site. $6,000 $4,000 Higher rates of N had a negative impact on in the plant crop. $2,000 $0 Grower rate High rate Nitrogen rate * 3 rd ratoon excluded from this graph as different treatments were used
17 17 Trial results Site 6 BRIA farm Sodic Duplex Clay QDPI soil type 2Dyb Crop variety Q183 A 0.77% Mean results for tonnes of cane, sugar and for each nitrogen treatment Cane yield Sugar yield Date planted: 16/05/2011 Date harvested: 20/06/2012 DYP Grower rate High rate DYP st Ratoon Date harvested: 26/06/ Grower rate High rate DYP nd Ratoon Date harvested: 03/11/ Grower rate High rate DYP rd Ratoon Date harvested: 07/07/ Grower rate High rate Revenue less fertiliser, harvesting costs and levies over full crop cycle $16,000 $14,000 $12,000 $13,847 $13,871 $13,073 $12,973 $13,021 $10,000 This trial site was generally well managed. The crop was established with few gaps and weed management was good over the four seasons. Irrigation management appeared to be generally adequate. Higher N rates had a negative impact on in the 1 st and 2 nd ratoon crops. $8,000 $6,000 $4,000 $2,000 $0 DYP 150 Grower rate High rate Nitrogen rate
18 18 Trial results Site 8 BRIA farm Sodic Duplex Clay loam QDPI soil type 2Dyb Crop variety Q208 A 0.6% Mean results for tonnes of cane, sugar and for each nitrogen treatment Cane yield Sugar yield Date planted: 16/05/2011 Date harvested: 08/09/2012 DYP Grower rate High rate DYP st Ratoon Date harvested: 06/09/ Grower rate High rate DYP nd Ratoon Date harvested: 16/10/ Grower rate High rate DYP rd Ratoon Date harvested: 05/10/ Grower rate High rate Revenue less fertiliser, harvesting costs and levies over full crop cycle The plant crop was established with few gaps and weed management was good over the four crop stages. $14,000 $12,000 $10,000 $8,000 $6,000 $4,000 $2,000 $12,398 $12,205 $12,274 $12,043 Prior to planting, gypsum was applied to this block at a rate of 5 tonnes/ha. Soil moisture monitoring data collected during the development of the 3 rd ratoon crop along with general observations over the duration of the trail indicated that irrigation management practices could be adjusted to improve productivity at this site. $0 DYP 150 Grower rate High rate Nitrogen rate

19 19 Trial results Site 9 BRIA farm Vertosol Clay QDPI soil type 2Ugd Crop variety KQ228 A 0.59% Mean results for tonnes of cane, sugar and for each nitrogen treatment Cane yield Sugar yield DYP Date planted: 23/05/2011 Date harvested: 23/10/ Grower rate High rate DYP st Ratoon Date harvested: 10/09/ Grower rate High rate Revenue less fertiliser, harvesting costs and levies for plant and 1 st ratoon $6,000 The crop was established with a considerable number of gaps randomly distributed throughout the block. Weed management was fair over the duration of the trial at this site. $5,000 $4,000 $4,693 $4,955 $4,694 $4,684 Prior to planting gypsum was applied to this block at a rate of 5 tonnes/ha. $3,000 $2,000 $1,000 $0 DYP 150 Grower rate High rate Nitrogen rate
20 20 Trial results Site 11 BRIA farm Sodic Duplex Loam QDPI soil type 6Drc Crop variety KQ228 A 0.9% Mean results for tonnes of cane, sugar and for each nitrogen treatment Cane yield Sugar yield Date planted: 05/05/2011 Date harvested: 19/08/2012 DYP Grower rate DYP st Ratoon Date harvested: 13/07/ Grower rate Revenue less fertiliser, harvesting costs and levies for plant and 1 st ratoon $9,000 $8,000 $7,000 $8,018 $8,017 $7,976 $6,000 $5,000 $4,000 At this trial site row spacing was 1.5m with a controlled traffic system in place as standard farming practice. The crop was established with few gaps and weed management was good over the duration of the trial. The plant crop yielded considerably better than the first ratoon crop. The change in productivity is likely due to a change in irrigation management at this site. $3,000 $2,000 $1,000 $0 DYP 150 Grower rate Nitrogen rate

21 21 Trial results Site 17 BRIA farm Sodic Duplex Loam QDPI soil type 6Drc Crop variety Q183 A 0.91% Mean results for tonnes of cane, sugar and for each nitrogen treatment Cane yield Sugar yield Date planted:20/04/2014 Date harvested: 28/06/ * Grower rate High rate DYP st Ratoon Date harvested: 12/06/ Grower rate * This is 10 below Revenue less fertiliser, harvesting costs and levies for plant and 1 st ratoon $12,000 $10,000 $10,665 $10,582 $8,000 This trial site was managed according to best management principles. The crop was established with few gaps, and weed and irrigation management was good over the two crop stages that were part of the trial. Good farm management practices combined with good soil fertility has allowed this grower to achieve consistent cane and sugar yields at this site. $6,000 $4,000 $2,000 $0 Nitrogen rate Grower rate This graph compares only two rates as the grower requested low rate be examined in the 1 st ratoon crop.

22 22 Trial results Site 18 BRIA farm Vertosol Clay QDPI soil type 2Ugd Crop variety Q240 A 0.8% Mean results for tonnes of cane, sugar and for each nitrogen treatment Cane yield Sugar yield Date planted: 19/05/2014 Date harvested: 07/07/ Grower rate High rate DYP st Ratoon Date harvested: 07/09/ Grower rate Revenue less fertiliser, harvesting costs and levies for plant and 1 st ratoon This trial site was managed according to best management principles. The crop was established with few gaps, weed and irrigation management was good over the two crop stages which were part of the trial. $12,000 $10,000 Good farm management practices combined with fair soil fertility has allowed this grower to achieve good consistent cane and sugar yields over the duration of the trial. $8,000 $9,756 $9,511 $9,331 $9,217 $6,000 $4,000 $2,000 $0 Nitrogen rate Grower rate * This graph compares only two rates as the high rate treatment was not continued in the 1 st ratoon crop.
23 23 Trial results Site 20 BRIA farm Sodic Duplex Clay QDPI soil type 2Dyb Crop variety Q252 A 0.9% Mean results for tonnes of cane, sugar and for each nitrogen treatment Cane yield Sugar yield Date planted: 06/03/2015 Date harvested: 15/09/ Grower rate High rate Revenue less fertiliser, harvesting costs and levies for plant cane $6,000 $5,000 $5,374 $5,352 $5,307 $4,000 At this trial site, row spacing was 1.8m with a dual row of cane as standard farming practice. This trial site was managed according to best management principles. The crop was established with few gaps, and effective weed and irrigation management. Good farm management practices have enabled this grower to achieve good yields. $3,000 $2,000 $1,000 $0 Grower rate High rate Nitrogen rate

24 24 Trial results Site 22 BRIA farm Vertosol Clay QDPI soil type 2Ugd Crop variety Q253 A 0.85% Mean results for tonnes of cane, sugar and for each nitrogen treatment Cane yield Sugar yield Date planted: 20/03/2015 Date harvested: 17/06/ * Grower rate High rate * This is 10 above 6ES Revenue less fertiliser, harvesting costs and levies for plant cane $5,000 $4,500 $4,000 $4,295 $4,241 $3,500 $3,732 $3,000 $2,500 $2,000 $1,500 $1,000 $500 $0 Grower rate High rate Nitrogen rate This trial site was managed according to best management principles. The crop was established with few gaps, and good weed and irrigation management. Good farm management practices have allowed this grower to achieve good yields in a soil which is considered to be difficult to manage in the BRIA. There was a significant decline in with higher N application rates.
25 25 Case Studies DELTA The benefits and results that each grower has taken from the trial vary, however there is one factor that is consistent the method is shown to produce the best financial outcome. The following case studies compare the amount of nitrogen that the grower used before being involved in the trial with the, calculated using a district yield potential (DYP) of 180 tc/ha. These parameters have been used to calculate costs and revenue in the following case studies: Key parameters Sugar price $424/tonne, (5-year average, ) Relative Actual ccs daily pool ccs + seasonal pool ccs Cane payment formula (cane price) $424 x x (-4) Gross revenue Harvesting cost + levies Fertiliser prices Cane price x tonnes cane per hectare $8.11/tonne, ex GST Sourced from local supplier, ex GST
26 26 Site 3 (Delta) Increasing profitability through changed management practices Delta farm Location Airville Variety KQ228 A Soil group BUfc Dermosol Loam 0.9% Total area of trial block Jim had been concerned for some time that his sugar levels had been supressed, which is something that had also concerned his father before him. When he heard about the RP20 project he was keen to become involved to see if these trials could give him some answers. Before the trials, he had been getting regular soil tests carried out but admits that the amount of nitrogen he was applying was based more on history rather than the results of the soil tests, with maximum rates traditionally close to the high rate applied during the trials. There are two distinct zones in this block which have different soil chemical and physical properties. Crop vigour appeared to vary according to these zones. Jim felt that there was a benefit in applying lime as he believed that he got better water penetration. Lime was applied to the 3 rd and 4 th ratoons and the watering regime was increased. He believes that this made a significant difference to the 4 th ratoon results. For this block, the key was to improve water penetration so that the fertiliser that was being applied could work effectively. In the past, this grower had applied lime but decided to cut it out when the financial situation didn t allow it. He now realises that perhaps he should have cut down on the fertiliser rather than the lime. For a long time we only put nitrogen on. We now realise that we should have been focusing on other things as well, like potassium and lime. These trials have proved to me that it s a combination of everything that makes the difference, not just nitrogen. 5.1 hectares Differences in profitability over crop cycle excluding 3 rd ratoon Fertiliser cost savings over trial block when comparing with high rate (over full crop cycle excl. 3 rd ratoon*) Fertiliser cost high rate () $2,232 Fertiliser cost () $1,682 Fertiliser cost saving () $550 Fertiliser cost saving over trial block ($) $2,806 Potential improvement in earnings over trial block when comparing with high rate (over full crop cycle excl. 3 rd ratoon*) Revenue less HC&L* high rate () $19,143 Revenue less HC&L* () $19,096 Potential increase in earnings () -$47 Potential increase in earnings over trial block ($) -$238 * 3 rd ratoon excluded as data from one strip only presented for each treatment due to loss of rake data Increase in block profitability: $2,568 Potential increase in profitability over 100 hectares: $50,356 * Revenue less HC&L refers to revenue less harvesting costs and levies. Potential savings and increase in return will be dependent on environmental and seasonal factors such as soil variation across the farm, rainfall, management methods, harvest conditions. All prices are excluding GST. This case study compares the amount of nitrogen that the grower used before being involved in the trial with the SIX EASY STEPS rate calculated using.

27 27 Site 3 (Delta) Cane yield Sugar yield Relative Gross revenue Fertiliser costs Harvesting costs + levies Net revenue Date planted: 06/05/2011 Date harvested: 24/08/2012 DYP $5,983 $315 $1,241 $4, $5,963 $371 $1,275 $4,318 Grower rate $5,953 $426 $1,325 $4,201 High rate $5,798 $482 $1,325 $3,991 DYP $6,068 $347 $1,221 $4,500 1 st Ratoon Date harvested: 17/07/ $6,119 $429 $1,243 $4,446 Grower rate $6,182 $511 $1,289 $4,382 High rate $6,048 $593 $1,318 $4,137 DYP $6,084 $347 $1,163 $4,573 2 nd Ratoon Date harvested: 04/08/ $6,154 $429 $1,180 $4,545 Grower rate $6,296 $511 $1,221 $4,564 High rate $6,328 $593 $1,250 $4,485 DYP $6,098 $347 $1,262 $4,489 3 rd Ratoon * Date harvested: 02/07/ $5,652 $429 $1,181 $4,042 Grower rate $5,492 $511 $1,159 $3,821 High rate $5,289 $593 $1,156 $3,540 DYP $5,847 $397 $1,357 $4,093 4 th Ratoon Date harvested: 07/07/ $5,915 $453 $1,357 $4,106 Grower rate $6,331 $509 $1,462 $4,360 High rate $6,332 $564 $1,469 $4,298 * Data presented is from one strip only for each treatment due to loss of rake data DYP 150 District yield potential of 150 tc/ha District yield potential of 180 tc/ha Comparison of trial site and Productivity Group Productivity Group average () Trial block average () 153.8
28 28 Site 14 (Delta) Continuous improvement through getting the right balance between tonnes and Delta farm Location Brandon Variety Q183 A Dermosol Loam QDPI BUfb 0.81% Total area of trial block 4.85 ha As someone who had sought agronomic advice in the past to plan for particular farm management practices, Frank went into the trials with an open mind, to see for himself which nitrogen rate would give him the best value for money on his farm. He wasn t sure what to expect but was willing to accept the results. After having conducted the trials on his farm for a full crop cycle (from plant cane to 3 rd ratoon), the outcome was better than Frank expected. Not only did the trials allow this grower to determine which nitrogen rate would provide him with the best outcome, he was encouraged to look at his other farming practices and determine how these were affecting his crop. During the first year of the trial, compaction was identified as a limiting factor on his farm, due to the weather conditions experienced in previous years. He was advised to work the ground after the first ratoon was harvested, which he believes led to an increase of at least 25% in crop yield. This farm had moisture probes in two locations during the trial, which gave the grower valuable data and a good indication of how his irrigation management system was working. Throughout the trial, Julian (SRA Agronomist) discussed all trial data with me and we spoke about matching the fertiliser with crop requirements. This led me to improve some of my management practices, such as the timing of fertiliser application. In 2015, this grower fine tuned his fertiliser application through later application of fertiliser so that the nitrogen was accessible to the crop at the right time. I was willing to take the extra cost I would incur by applying the fertiliser later and I was happy with the result. I feel I now have the balance right between tonnes and and have grown record tonnes that I believe are a result of focusing on my management practices. I have a benchmark now of what I m capable of producing on my farm. I know that I can improve on what I ve gained from being part of these trials and am excited about striving for continuous improvement. Differences in profitability over full crop cycle plant cane to 2 nd ratoon Fertiliser cost savings over trial block when comparing with high rate (plant to 2 nd ratoon) Fertiliser cost high rate () $1,999 Fertiliser cost () $1,495 Fertiliser cost saving () $504 Fertiliser cost saving over trial block ($) $2,446 Potential improvement in earnings over trial block when comparing with high rate (plant to 2 nd ratoon) Revenue less HC&L* high rate () $13,552 Revenue less HC&L* () $13,677 Potential increase in earnings () $126 Potential increase in earnings over trial block ($) $609 Increase in block profitability: $3,055 Potential increase in profitability over 100 hectares: $62,994 * Revenue less HC&L refers to revenue less harvesting costs and levies. Potential savings and increase in return will be dependent on environmental and seasonal factors such as soil variation across the farm, rainfall, management methods, harvest conditions. All prices are excluding GST. This case study compares the amount of nitrogen that the grower used before being involved in the trial with the SIX EASY STEPS rate calculated using.

29 29 Site 14 (Delta) Cane yield Sugar yield Relative Gross revenue Fertiliser costs Harvesting costs + levies Net revenue Date planted: 06/08/2012 Date harvested: 11/07/ st Ratoon Date harvested: 05/09/ nd Ratoon Date harvested: 07/08/ $4,866 $608 $876 $3,381 Grower rate $4,759 $692 $877 $3,190 High rate $4,656 $775 $859 $3, $5,908 $432 $1,178 $4,298 Grower rate $5,925 $515 $1,197 $4,212 High rate $5,995 $597 $1,210 $4, $6,097 $454 $1,140 $4,504 Grower rate $6,024 $541 $1,109 $4,375 High rate $6,082 $627 $1,113 $4,342 3 rd Ratoon Date harvested: 19/09/2016 DYP $5,826 $369 $1,257 $4, $5,730 $424 $1,246 $4,060 Grower rate $5,692 $480 $1,247 $3,964 DYP 150 District yield potential of 150 tc/ha District yield potential of 180 tc/ha Comparison of trial site and Productivity Group Productivity Group average () Trial block average ()
30 30 Site 21 (Delta) Fertiliser management on large crops Delta farm Location Brandon Variety Q208 A Dermosol Loam QDPI BUfc 1.3% Total area of trial block 8 ha Located on some of the most fertile soil in the Burdekin, this farm has historically produced high tonnes with reasonable. A self-proclaimed high nitrogen user before joining the trials, this grower was concerned that he would no longer be as productive if he was to reduce the amount of nitrogen that he applied to his crop. He believed that a large crop required a large amount of nitrogen. With an ideal growing year in 2015, the plant crop was harvested in 2016 with exceptional results. The tonnes across the various treatments showed little difference, with the tonnes of sugar improving from the lower nitrogen rate treatments. The trials showed that past practices may not always have achieved the best result. In some cases, the grower believes the large quantities of nitrogen being applied were likely to suppress sugar as the crop was not given the opportunity to mature towards the end of the growing cycle. Instead, the large amounts of nitrogen were encouraging the crop to grow more biomass at this time. I now believe that I have the right balance to maximise profitability on my farm. Being involved in this trial has shown me that nitrogen is not driving my crop. It s about getting all of the various farm management practices in balance based on the crop and my soil type. After fine tuning other management practices such as timing of fertiliser application, irrigation management and weed control, this grower says his focus has shifted. I m seeing the whole picture now as being crucial to growing the best crop I can. Using the along with good farm management practices will ensure that I have a profitable business into the future. Differences in profitability in the plant crop Fertiliser cost savings over trial block when comparing with high rate (plant crop) Fertiliser cost high rate () $501 Fertiliser cost () $389 Fertiliser cost saving () $112 Fertiliser cost saving over trial block ($) $894 Potential improvement in earnings over trial block when comparing with high rate (plant crop) Revenue less HC&L* high rate () $7,409 Revenue less HC&L* () $7,863 Potential increase in earnings () $454 Potential increase in earnings over trial block ($) $3,635 Increase in block profitability: $4,529 Potential increase in profitability over 100 hectares: $56,611 * Revenue less HC&L refers to revenue less harvesting costs and levies. Potential savings and increase in return will be dependent on environmental and seasonal factors such as soil variation across the farm, rainfall, management methods, harvest conditions. All prices are excluding GST. This case study compares the amount of nitrogen that the grower used before being involved in the trial with the SIX EASY STEPS rate calculated using.

31 31 Site 21 (Delta) Cane yield Sugar yield Relative Gross revenue Fertiliser costs Harvesting costs + levies Net revenue Date planted: 06/03/2015 Date harvested: 26/08/ $9,959 $389 $2,096 $7,474 Grower rate $9,518 $445 $2,096 $6,977 High rate $9,537 $501 $2,128 $6,908 DYP 150 District yield potential of 150 tc/ha District yield potential of 180 tc/ha Comparison of trial site and Productivity Group Productivity Group average 2016 () Trial block plant cane ()

32 32 Trial Results Delta The following trial results include all trials for the duration of the project. The trials cover all major soil types to ensure that findings of this project are applicable to all sugarcane growers in the Burdekin region TRIAL SITES The graphs contained in the following trial results use Relative to calculate revenue.
33 33 Trial results Site 1 Delta farm Dermosol Loam QDPI soil type BUfb Crop variety Q208 A 0.89% Mean results for tonnes of cane, sugar and for each nitrogen treatment Cane yield Sugar yield DYP Date planted: 03/05/2011 Date harvested: 20/09/ Grower rate High rate Revenue less fertiliser, harvesting costs and levies for plant cane $4,500 $4,000 $3,500 $4,035 $3,832 $3,914 $3,995 $3,000 $2,500 $2,000 $1,500 $1,000 $500 This trial site was generally well managed. The crop was established with few gaps and weed management was good over the development of the plant crop. In general irrigation management appeared to be adequate however crop vigour appeared to vary considerably throughout the block. $- DYP 150 Grower rate High rate Nitrogen rate
34 34 Trial results Site 3 Delta farm Dermosol Loam QDPI soil type BUfc Crop variety KQ228 A 0.9% Mean results for tonnes of cane, sugar and for each nitrogen treatment Cane yield Sugar yield Date planted: 06/05/2011 Date harvested: 24/08/2012 DYP Grower rate High rate DYP st Ratoon Date harvested: 17/07/ Grower rate High rate DYP nd Ratoon Date harvested: 04/08/ Grower rate High rate DYP * rd Ratoon Date harvested: 02/07/ * 18.5 Grower rate * 18.0 High rate * 17.5 DYP th Ratoon Date harvested: 07/07/ Grower rate High rate * Data from one strip only presented for each treatment due loss of rake data Revenue less fertiliser, harvesting costs and levies over full crop cycle excluding 3 rd ratoon This trial site was generally managed according to best management principles. $20,000 $18,000 $16,000 $14,000 $12,000 $10,000 $8,000 $6,000 $17,593 $17,415 $17,507 $16,911 The crop was established with few gaps and weed management was good over the five seasons. Good farm management practices combined with good soil fertility and in general good irrigation management have allowed this grower to achieve consistent cane and sugar yields over the duration of the trials. $4,000 $2,000 $0 DYP 150 Grower rate High rate Nitrogen rate

35 35 Trial results Site 4 Delta farm Dermosol Loam QDPI soil type BUmd Crop variety Q200 A 0.99% Mean results for tonnes of cane, sugar and for each nitrogen treatment Cane yield Sugar yield DYP Date planted: 04/05/2011 Date harvested: 14/09/ Grower rate High rate DYP st Ratoon Date harvested: 22/08/ Grower rate High rate Revenue less fertiliser, harvesting costs and levies for plant and 1 st ratoon $9,000 $8,000 $7,000 $6,000 $5,000 $4,000 $3,000 $2,000 $1,000 $0 $7,942 $7,848 DYP 150 Nitrogen rate $7,233 $7,428 Grower rate High rate The plant crop at this trial site was managed according to best management principles. The crop was established with few gaps, weed and irrigation management were also good, however there was change in the ownership of this trial site following the harvest of the plant crop which resulted in a change in management practices employed for the ratoon crop. Observation during the development of the ratoon crop revealed that the crop was not watered with the same frequency as previously and weed management was generally considerably poorer.
36 36 Trial results Site 7 Delta farm Dermosol Loam QDPI soil type CUfc Crop variety Q208 A 058% Mean results for tonnes of cane, sugar and for each nitrogen treatment Cane yield Sugar yield DYP Date planted: 19/05/2011 Date harvested: 26/10/ Grower rate 210 No data due to mechanical error when applying fertiliser High rate DYP st Ratoon Date harvested: 13/09/ Grower rate 250 No data due to mechanical error when applying fertiliser High rate DYP nd Ratoon Date harvested: 14/10/ Grower rate High rate DYP rd Ratoon Date harvested: 08/11/ Grower rate High rate $14,000 $12,000 $10,000 $8,000 $6,000 $4,000 $2,000 $13,155 $12,695 $11,959 Revenue less fertiliser, harvesting costs and levies for plant cane, 2 nd and 3 rd ratoon This trial site was generally managed according to best management principles. The crop was established with few gaps and weed management was good over the four seasons. Good farm management practices combined with good soil fertility have allowed this grower to achieve consistent cane and sugar yields over the duration of the trials. $0 DYP 150 Nitrogen rate High rate
37 37 Trial results Site 10 Delta farm Vertosol Clay loam QDPI soil type RUgb Crop variety Q208 A 0.84% Mean results for tonnes of cane, sugar and for each nitrogen treatment Cane yield Sugar yield Date planted: 03/08/2011 Date harvested: 13/09/2012 DYP Grower rate High rate DYP st Ratoon Date harvested: 02/08/ Grower rate High rate DYP nd Ratoon Date harvested: 12/07/ Grower rate High rate DYP rd Ratoon Date harvested: 16/10/ Grower rate High rate Revenue less fertiliser, harvesting costs and levies over full crop cycle $16,000 $14,000 $14,972 $15,126 $14,858 $14,569 $12,000 $10,000 $8,000 $6,000 This trial site was generally managed according to best management principles. The crop was established with few gaps and weed management was good over the four seasons. Good farm management practices combined with reasonable soil fertility have allowed this grower to achieve reasonable cane and sugar yields over the duration of the trials. $4,000 $2,000 $0 DYP 150 Grower rate High rate Nitrogen rate
38 38 Trial results Site 12 Delta farm Dermosol Loam QDPI soil type BGnb Crop variety Q208 A 0.74% Mean results for tonnes of cane, sugar and for each nitrogen treatment Cane yield Sugar yield Date planted: 08/06/2012 Date harvested: 30/07/ Grower rate 210 High rate 250 Mill data not available st Ratoon Date harvested: 28/09/2014 Grower rate High rate nd Ratoon Date harvested: 01/09/ rd Ratoon Date harvested: 15/06/2016 Grower rate High rate Grower rate High rate Revenue less fertiliser, harvesting costs and levies for 1 st, 2 nd and 3 rd ratoon* $9,000 $8,000 $7,000 $7,761 $7,263 $6,000 $6,818 $5,000 $4,000 This trial site suffered from significant weed and irrigation management issues over the duration of the trial. Monitoring of soil moisture levels was undertaken in the second and third ratoons crops. Weed pressure increased over the duration of the trials, and caused significant issues for the harvester in the 3 rd ratoon crop. Weed pressure may have been a significant factor in the decline of the 3 rd ratoon crop yield. $3,000 $2,000 $1,000 $0 * not included Grower rate Nitrogen rate High rate
39 39 Trial results Site 14 Delta farm Dermosol Loam QDPI soil type BUfb Crop variety Q183 A 0.81% Mean results for tonnes of cane, sugar and for each nitrogen treatment Cane yield Sugar yield Date planted: 06/08/2012 Date harvested: 11/07/ Grower rate High rate st Ratoon Date harvested: 05/09/2014 Grower rate High rate nd Ratoon Date harvested: 07/08/2015 Grower rate High rate DYP rd Ratoon Date harvested: 19/09/ Grower rate Revenue less fertiliser, harvesting costs and levies for plant to 2 nd ratoon This trial site was managed according to best management principles. $14,000 $12,000 $10,000 $12,182 $11,777 $11,552 The crop was established with few gaps and weed and irrigation management were very good over the four seasons. The plant crop which was a late plant did not perform to the expectations of the grower. $8,000 $6,000 $4,000 $2,000 $0 Grower rate High rate During the post-harvest soil sampling of the plant crop it was found that there was a compaction zone within the soil profile (30-50cm) across the trial site. It is likely that compaction limited the yield potential of the plant crop. Following discussion with the grower an implement was used to deep rip each side of the hill, which appeared to be effective in alleviating the compaction. Nitrogen rate
40 40 Trial results Site 15 Delta farm Vertosol Clay loam QDPI soil type RUgd Crop variety Q253 A 1.3% Mean results for tonnes of cane, sugar and for each nitrogen treatment Cane yield Sugar yield Date planted: 01/04/2013 Date harvested: 01/07/ Grower rate High rate DYP st Ratoon Date harvested: 30/06/ Grower rate DYP nd Ratoon Date harvested: 29/09/ Grower rate Revenue less fertiliser, harvesting costs and levies from plant cane to 2 nd ratoon $18,000 $16,000 $14,000 $15,257 $14,209 $12,000 $10,000 $8,000 $6,000 $4,000 $2,000 This trial site was managed according to best management principles. The crop was established with few gaps and weed management was very good over the three crop stages. Very good farm management practices combined with good soil fertility has allowed this grower to achieve consistent high cane and sugar yields over the duration of the trials. Moddus was applied to the plant, 1 st ratoon and 2 nd ratoon crops. $0 Nitrogen rate Grower rate * This graph compares only two rates as a high rate treatment was not applied at this trial site for the 1 st or 2 nd ratoons.
41 41 Trial results Site 16 Delta farm Dermosol Loam QDPI soil type BUfc Crop variety Q240 A 0.95% Mean results for tonnes of cane, sugar and for each nitrogen treatment Cane yield Sugar yield Date planted: 29/04/2014 Date harvested: 06/10/ Grower rate High rate DYP st Ratoon Date harvested: 02/08/ Grower rate Revenue less fertiliser, harvesting costs and levies for plant and 1 st ratoon $9,000 This trial site was managed according to best management principles. The crop was established with few gaps, weed and irrigation management was good over the two crop stages which were part of the trial. $8,000 $7,000 $6,000 $8,189 $7,785 Good farm management practices combined with good soil fertility has allowed this grower to achieve good consistent cane and sugar yields at this site. $5,000 $4,000 $3,000 $2,000 $1,000 $0 Nitrogen rate Grower rate * This graph compares only two rates as the high rate treatment was not retained for the 1 st ratoon.

42 42 Trial results Site 19 Delta farm Vertosol Clay loam QDPI soil type RUgb Crop variety Q183 A 1.35% Mean results for tonnes of cane, sugar and for each nitrogen treatment Cane yield Sugar yield Date planted: 06/05/2014 Date harvested: 11/08/2015 Following large legume crop Following large legume crop Following large legume crop DYP st Ratoon Date harvested: 03/11/ Grower rate Revenue less fertiliser, harvesting costs and levies for 1 st ratoon $5,000 $4,500 $4,000 $3,500 $3,000 $2,500 $2,000 $1,500 $1,000 $500 $0 $4,597 DYP 150 $4,297 $4,350 Nitrogen rate Grower rate Prior to planting the sugarcane crop the grower at this site grew a large soybean crop. This trial site was managed according to best management principles. The crop was established with few gaps, and weed and irrigation management were very good over the two crop stages. Very good farm management practices combined with good soil fertility have enabled this grower to achieve consistently high cane and sugar yields over the duration of the trials.

43 43 Trial results Site 21 Delta farm Dermosol Loam QDPI soil type BUfc Crop variety Q208 A 1.3% Mean results for tonnes of cane, sugar and for each nitrogen treatment Cane yield Sugar yield Date planted: 06/03/2015 Date harvested: 26/08/ Grower rate High rate Revenue less fertiliser, harvesting costs and levies for plant cane $8,000 $7,000 $7,474 $6,000 $6,977 $6,908 $5,000 This trial site was managed according to best management principles. The crop was established with few gaps, weed and irrigation management were good. Very good farm management practices combined with good soil fertility have allowed this grower to achieve very high cane and sugar yields. $4,000 $3,000 $2,000 $1,000 $0 Grower rate High rate Nitrogen rate

44 44 Trial results Site 23 Delta farm Dermosol Loam QDPI soil type BGnc Crop variety Q240 A 1.6% Mean results for tonnes of cane, sugar and for each nitrogen treatment Cane yield Sugar yield Date planted: 17/04/2015 Date harvested: 24/09/ Grower rate High rate Revenue less fertiliser, harvesting costs and levies for plant cane $7,000 $6,000 $6,161 $5,790 $5,000 $5,575 This trial site was managed according to best management principles. The crop was established with few gaps and weed and irrigation management were good. Good farm management, combined with good soil fertility have allowed this grower to achieve high yields at this site. $4,000 $3,000 $2,000 $1,000 $0 Grower rate High rate Nitrogen rate