Wholesale Price Index of Food Articles : All India (Base Year =100) Groups Oct-16 Nov-16 Dec-16 Jan-17 Feb-17 Mar-17
|
|
|
- Mark Malone
- 5 years ago
- Views:
Transcription
1
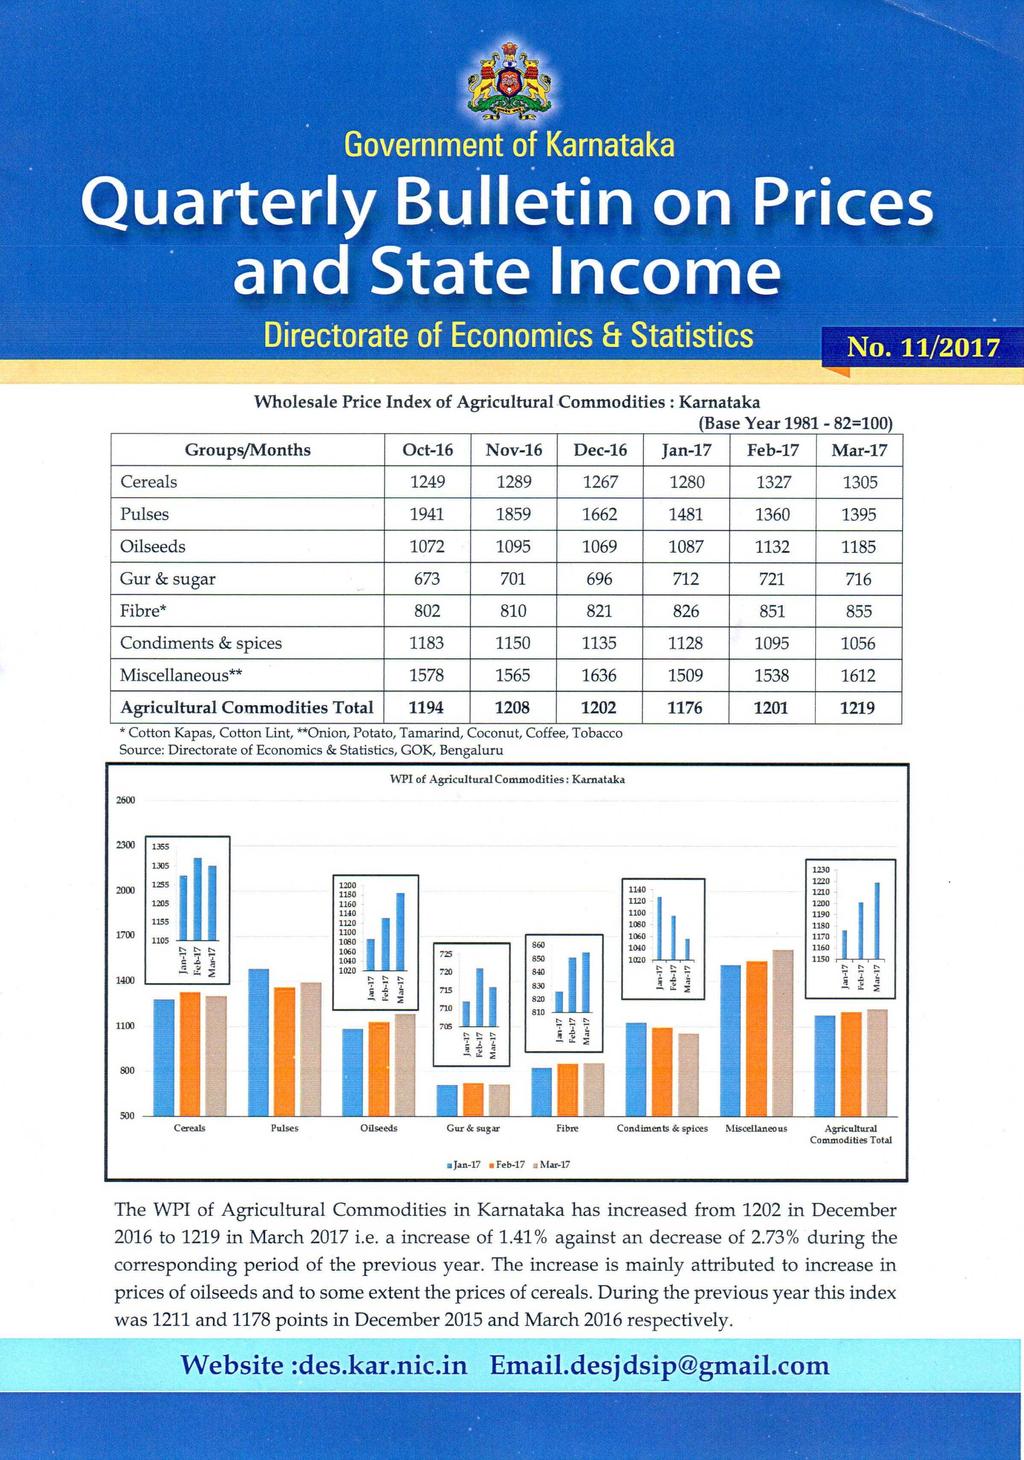
2 Wholesale Price Index of Food Articles : All India (Base Year =100) Groups Oct-16 Nov-16 Dec-16 Jan-17 Feb-17 Mar-17 Cereals Pulses Oilseeds Sugar Gur Fibres* Condiments & spices Other Food Articles** Food Articles Total * Raw Cotton, Raw Jute, Mesta, Raw Wool, Raw Silk, Coir Fibre, **Tea, Coffee Source: Office of Economic Adviser, Ministry of Commerce & Industry, GOI, New Delhi At the All-India level, the WPI of Food Articles which was in December 2016 increased to in March 2017 showing a increase of 0.65% and during the corresponding period of the previous year it was -2.98%. Higher increase in the index of Gur and Fibres has resulted increase in the index of Food Articles. During , the index of Food Articles decreased from in December 2015 to in March Wholesale Price Index of Agricultural Commodities : Karnataka (Base Year =100) Years/Months Oct Nov Dec Jan Feb Mar Source : Directorate of Economics & Statistics, GOK, Bengaluru Page 2 DES, Quarterly Bulletin

3 Wholesale Price Index of All Commodities : All India (Base Year =100) Years/Months Oct Nov Dec Jan Feb Mar Source: Office of Economic Adviser, Ministry of Commerce & Industry, GOI, New Delhi At the All-India level the WPI which was in December 2016 increased to in March 2017 showing a increase of 1.52% as against an decrease of 1.55% during the corresponding period of the previous year. During the previous year the WPI was in December 2015 and in March Consumer Price Index Numbers for Industrial Workers of 11 Centres State Series (Base Year =100) Centre /Months Oct-16 Nov-16 Dec-16 Jan-17 Feb-17 Mar-17 Davangere Harihara Tumakuru Mandya Ballari Raichur Kalaburagi Dandeli Mangaluru Hassan Bhadravathi Source : Directorate of Economics & Statistics, GOK, Bengaluru DES, Quarterly Bulletin Page 3
4 Consumer Price Index Numbers for Industrial Workers of Central Series : Karnataka (Base Year 2001=100) Centre / Months Oct-16 Nov-16 Dec-16 Jan-17 Feb-17 Mar-17 Bengaluru Belagavi Hubballi- Dharwad Mercara Mysuru Source : Labour Bureau, Ministry of Labour and Employment, GOI, Shimla In central series except Hubballi-Dharwad centre, remaining all the four centres Bengaluru, Belagavi, Mercara & Mysuru centres recorded the highest increase in index by 6 points in March 2017 over December During the corresponding period of the previous year Mercara centre index remained constant followed by Indices Bengaluru, Belagavi, Hubballi Dharwad and Mysuru centres declined. Consumer Price Index Numbers for Industrial Workers : All India & Karnataka (Base Year 1960=100) Months All India Karnataka Oct Nov Dec Jan Feb Mar Source: Directorate of Economics & Statistics, GOK, Bengaluru At All-India level, Consumer Price Index-IW which was 6277 in December 2016 remains the same in March 2017 as against an decrease of 23% during the corresponding period of the previous year. In Karnataka, CPI-IW moved to 6868 points in December 2016 from 7004 points in March 2017, recorded an increase of 136 points i.e. an increase of 1.98% and the corresponding decrease during the previous year was 1.50%. Page 4 DES, Quarterly Bulletin
5 Consumer Price Index Numbers for Industrial Workers of Major Cities : India (Base Year 2001=100) Cities/Months Oct-16 Nov-16 Dec-16 Jan-17 Feb-17 Mar-17 Delhi Mumbai Chennai Kolkata Hyderabad Bengaluru Source : Labour Bureau, Ministry of Labour and Employment, GOI, Shimla Among major cities, the CPI-IW of Bengaluru centre reported the maximum increase of 6 points followed by Delhi, Mumbai, Chennai and Hyderabad point each in March 2017 compared with December During the corresponding period of the previous year maximum decrease in index was observed in Bengaluru by 7 points and Chennai by 6 points and Hyderabad by 5 points. Monthly Inflation Rate : India Mar- Apr- May- Jun- Jul- Aug- Sep- Oct- Nov- Dec- Jan- Feb- Mar- Indices/ Months WPI CPI Source : WPI : Office of Economic Adviser, Ministry of Commerce & Industry, GOI, New Delhi CPI : Labour Bureau, Ministry of Labour and Employment, GOI, Shimla The annual rate of inflation based on monthly WPI Stood at 5.11% for the month of March 2017 (over February 2017) as compared to 5.51% for the previous month. The year on year inflation measured by monthly CPI stood at 2.61% for March 2017 as compared to 2.62% for the previous month and 5.51% during the corresponding month of the previous year. DES, Quarterly Bulletin Page 5
 Commodities Rice Ragi Wheat Jowar Tur Groundnut Sugar open Buffalo Cow Coconut Dry Onion Potato Coconut Oil market milk milk oil chillies Units Kg Kg Kg Kg Kg Per Litre Kg Per Per Litre Litre Kg Kg")

6 Urban Retail Prices : Karnataka (in.rs.) Commodities Rice Ragi Wheat Jowar Tur Groundnut Sugar open Buffalo Cow Coconut Dry Onion Potato Coconut Oil market milk milk oil chillies Units Kg Kg Kg Kg Kg Per Litre Kg Per Per Litre Litre Kg Kg Per Nut Per Litre Kg Oct Nov Dec Jan Feb Mar Source : Directorate of Economics & Statistics, GOK, Bengaluru Rural Retail Prices : Karnataka (in.rs.) Commodities Rice Ragi Wheat Jowar Turdal Groundnut Coconut Dry Sugar Milk Onion Potato Coconut Oil Oil chillies Units Kg Kg Kg Kg Kg Per Litre Kg Per Litre Kg Kg Per Nut Per Litre Kg Oct Nov Dec Jan Feb Mar Source : Directorate of Economics & Statistics, GOK, Bengaluru In Urban areas, the retail prices of Coconut, Onion, Ragi, Jowar, Sugar open market, Groundnut Oil, Coconut Oil, Wheat and Rice increased by 18.91%,15.83%, 10.28%, 10.09%, 5.79%, 4.05%, 3.35% 2.78% and 2.74% respectively, where as the prices of Tur and Potato decreased by 31.03% and 3.78% in March 2017 over December In Rural areas, the retail prices of Coconut, Ragi, Wheat, Onion, Sugar, Jowar, Rice, Milk and Coconut Oil increased by 22.72%, 18.16%, 10.28%, 8.05%, 7.47%, 6.80%, 3.13%, 1.55% and 1.15% respctively, where as the retail prices of Turdal, Drychillies and Potato decreased by 20.64%, 9.44%, and 3.60% respectively in March 2017 over December Page 6 DES, Quarterly Bulletin


7 Consumer Price Index for Agricultural Labourers : All India & Karnataka (Base Year =100) Months All India Karnataka Oct Nov Dec Jan Feb Mar Source : Labour Bureau, Ministry of Labour and Employment, GOI, Shimla Consumer Price Index for Agricultural Labourers at All-India level, the general index has decreased from 876 in December 2016 to 866 in March 2017, showing a decline of 1.14%. Where as in Karnataka the general index moved to 1027 in March 2017 from 1106 in December 2016 to showing a rise of 2.09%. Index of Industrial Production of Karnataka : to Base Year : Sector Weight Mining Manufacturing* Electricity General Index Total Source: Directorate of Economics & Statistics, GOK, Bengaluru, The general index of industrial production (IIP) of Karnataka covering Mining, Manufacturing and Electricity sectors for stood at has moved to with a growth of 1.82% in During , the indices of Mining, Manufacturing and Electricity sectors stood at 69.38, and showing a decline of, 4.41% in Electricity sector and positive growth of 2.34% in Manufacturing sector and 19.74% in Mining sector over a previous year i.e During , the corresponding indices stood at in Mining sector, in Manufacturing sector and in Electricity sector. The sector wise indices for the period from to with base year as are presented in above table. DES, Quarterly Bulletin Page 7


 63510 64201 64900 Per Capita GSDP(Rs.) 145141 159977 174606 10.2 9.")
8 GROSS STATE DOMESTIC PRODUCT OF KARNATAKA AT MARKET PRICES Rs in Crore GROWTH RATES Contribution Sl. NO Sectors SRE FRE AE FRE AE FRE AE 1 Primary Sector Secondary Sector Tertiary Sector Total GSVA at Basic Prices Product Taxes Product Subsidies Total GSDP at Market Prices Population (' 000) Per Capita GSDP(Rs.) Per Capita Income *Population projections as on 1 st October based on 2001 Census Source: Directorate of Economics & Statistics, GOK, Bengaluru Page 8 DES, Quarterly Bulletin