Crop Alternatives for Declining Water Resources
|
|
|
- Derek Newman
- 5 years ago
- Views:
Transcription


1 Crop Alternatives for Declining Water Resources Dr. Sangu Angadi Crop Stress Physiologist New Mexico State University Agricultural Science Center at Clovis
2 Outline Introduction Current & Future Challenges Why Alternative Crops? What Crops? Lessons Learned Canola Research Safflower Research Summary


3 Introduction Transpiration Evaporation Rainfall Conservation Irrigation Runoff More Crop per Drop Plant Uptake Market??? Dec 12, 06 Leaching
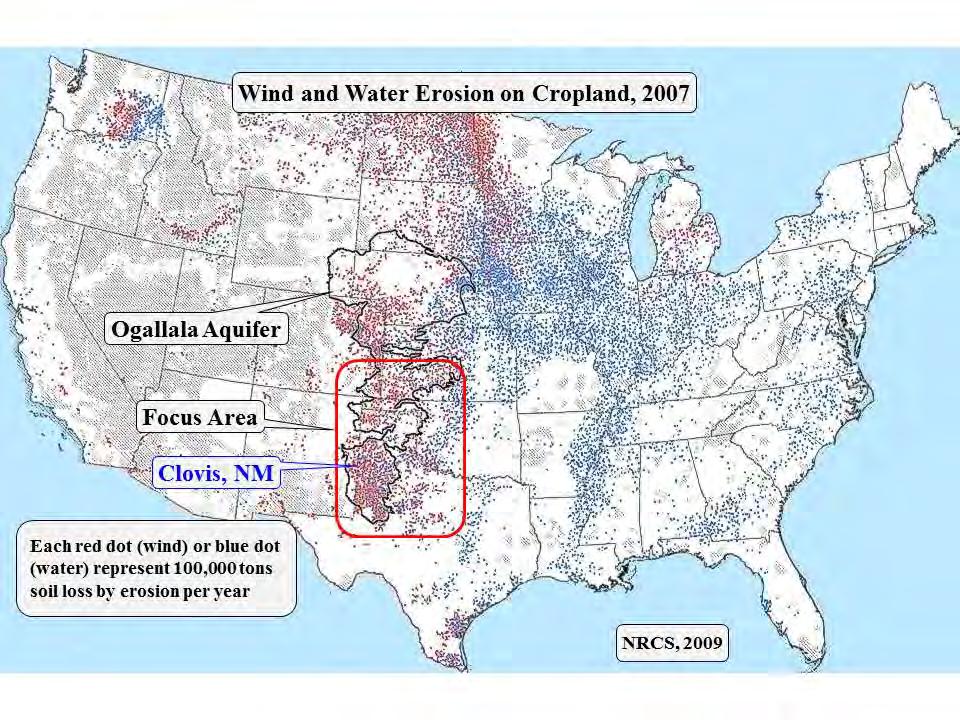
4 Current and Future Challenges Ogallala Aquifer/Irrigation Situation Uncertain Rainfall Wind Temperature Future Climate


5 Ogallala Water Situation WY SD NB Ogallala Aquifer CO KS Clovis NM OK TX

6 Ogallala Water Situation (From Google Earth)

7 Ogallala Water Situation (From Google Earth)

8 Hectares Irrigated by Method - USA Source: 1998, 2003, 2008 Farm and Ranch Irrigation Surveys USDA, National Agricultural Statistics Service (2012 estimates by Valmont Irrig.) 8

9 Texas Ground Water Districts limiting pumping to 15 to 20 inches Well Depth

10 Low and Uncertain Rainfall 18 inches Clovis
11 Rain (in) (8.8 in) 2013 (13.8 in) 2012 (9.5 in) (8.2 in) (17.5 in) (18.5 in) (16.8 in) Jan Feb Mar Apr May June July Aug Sept Oct Nov Dec
12 Seasonal Wind Patterns

13 Abiotic Stresses Wind (Clovis, 05/28/13)
14 Daily Wind Velocity Daily Max Wind Speed (Mean of 2011 &12) 15 Wind (mph) 12 9 Threshold Wind Speed for Saltation 6 Jan Feb Mar Apr May June July Aug Sept Oct Nov Dec Winter Wheat is the only annual crop at this time


15 Abiotic Stresses Wind


16 Sand Blasting Reseeding Or >50% evaporation
17

18 Tumble Weed Attack Exposed Clovis to National Media (CNJ, Clovis, Jan 28, 2014)
19 Temperature Extremes
")
20 Temperature Extremes: Cold!!! (Clovis, 2013)
21 Temperature Extremes Radiation (mj m -2 ) Temp ( o F) Mean Daily Max Temperature Mean Daily Min Temperature Daily Mean Solar Radiation (Mean of 2011 & 12) Jan Feb Mar Apr May June July Aug Sept Oct Nov Dec
22 Multiple Abiotic Stresses (Clovis, 2013) Heat Stress Air Temperature ( o F) Extreme Wind Killing Frost April 8, Day May 7, 2013 Field day

")
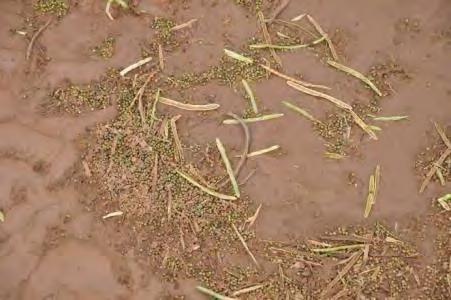
23 Rain Storms Future Climate (Clovis 7 th June 2014) Runoff
24 Why Alternative Crops? Improve Crop Diversity Rotational Benefits Buffer Seasonal Extremes Natural Resources Conservation Sustainable Use of Limited Resources
25 Why Alternative Crops? (contd) Improve Resource Use Efficiency Value Addition & Virtual Water Changing Consumer Demand Opportunistic or Alternative Uses Market Fluctuation
26 Improve Crop Diversity Stress Tolerant Cereals N Fixing & P solubilizing Legumes Deep rooted Oil seeds


27 Rotational Benefits: Wheat Yields W-W 10bu/ac C-W 25bu/ac Same Planting Date, Variety, and Fertility in the middle of the drought Canola production makes wheat farmer a better wheat farmer.


28 Rotational Benefits: Weed Control Roundup Osprey No herbicide (WSU, FS068E)
29 Buffer Seasonal Extremes: Low and high rainfall, hail storm, wind storm, heat and freeze temperatures


30 Hail Storm, Clovis (June 8, 2014)

 Not")
31 Canola and Wheat at Harvest 50% canola yield (combined) Not harvested

 (Aug")
32 Safflower Hail Damage and Regrowth Replanted Regrowth Hail Damaged Regrowth vs. Replanted (June 9, 2014) (Aug 17, 2014)


33 Alternative Crops: Hail Damage Corn: Hail damaged Safflower: Zero Hail damage Canola: Hail damaged (Clovis, 8/8/2012)
 Freeze Injury (Apr 17, 09) Recovery (Apr 30, 09) (Clovis,")
34 Canola Freeze Injury & Recovery Late Spring Frost (Mar 28, 09) Freeze Injury (Apr 17, 09) Recovery (Apr 30, 09) (Clovis, NM)
35 Multiple Abiotic Stresses (Clovis, 2013) Air Temperature ( o F) Heat Stress Extreme Wind W. wheat: failed completely W. Canola: Avg. of 50 cvs 2707 lbs Range 3494 to 1680 lbs Killing Frost Day May 7, 2013 April 8, 2013 Field day
 Guar (Recovered, Aug 15, 2014)")

36 Herbicide Drift Injury and Recovery Guar (Drift from neighbor, unknown herbicide, July 10, 2014) Guar (Recovered, Aug 15, 2014) Safflower is fairly tolerant to herbicide drift and recovers very well. We have not seen herbicide drift issues with Winter Canola.
37 Resource Use Efficiency Shallow Rooted Crop Nutrients, water Deep Rooted Crop Multispecies cover cropping uses similar principle. Dec 12, 06


38 Value Addition and Virtual Water Movement
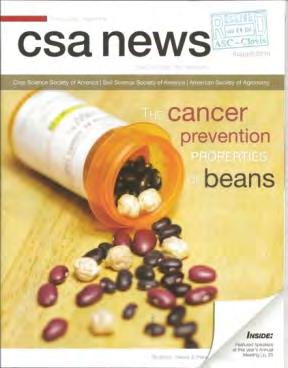
39 Changing Consumer Demand: healthy food, more fiber, nutrient profile, disease prevention

40 Changing Consumer Demand: Food for Energy, etc vs. Nutrition, healthy living


41 Healthy Chips Isle: Market Place, Lubbock Flax Spread: Laxmi Delights Oat Products: Sams, Lubbock Breakfast I am tired of


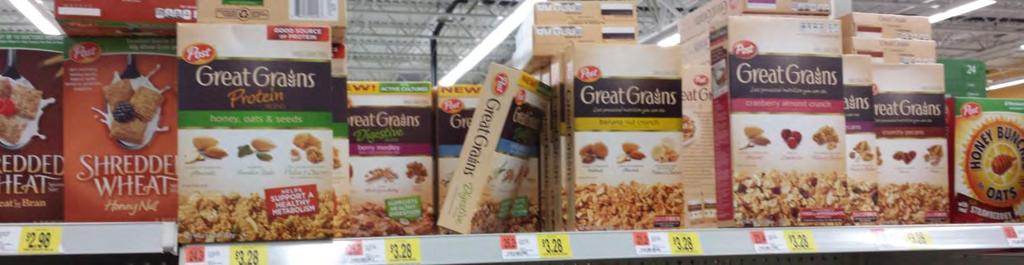


42 Even in Walmart


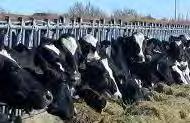
43 Opportunistic or Alternative Uses: guar for fracking, canola meal for cattle

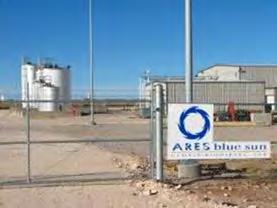
44 Canola Production Canola Production Processing Processing Canola Production Meal distribution to local dairies New Processing Oil Export Biodiesel Export
45 What Crops?? What is my ideal crop?? Spring vs. Winter Crops Dual Purpose Crops Low Input Requirement and Stress Tolerant Crop

46 Ideal Crop for the Region Productivity Water Use
47 Biomass Crops Water Use Water Use Jan Feb Mar Apr May June July Aug Sept Oct Nov Dec Months

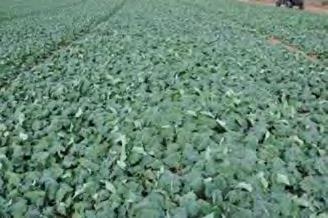
48 Alternate Biodiesel Crops Glycerin Canola Seeds Sunflower Protein supplement Mustard Safflower Camelina
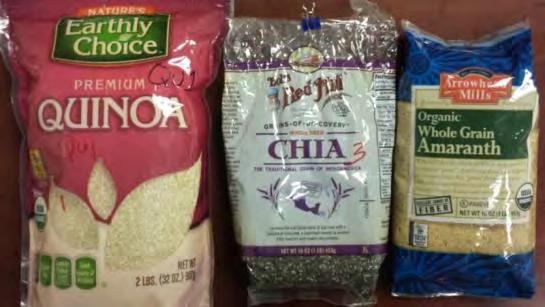
49 Quinoa
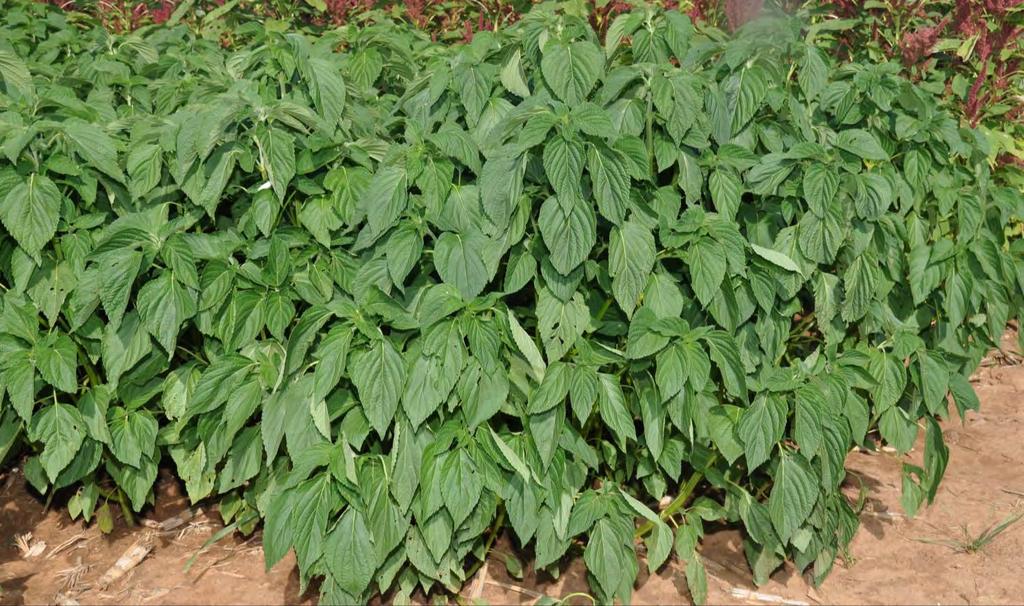
50 Chia
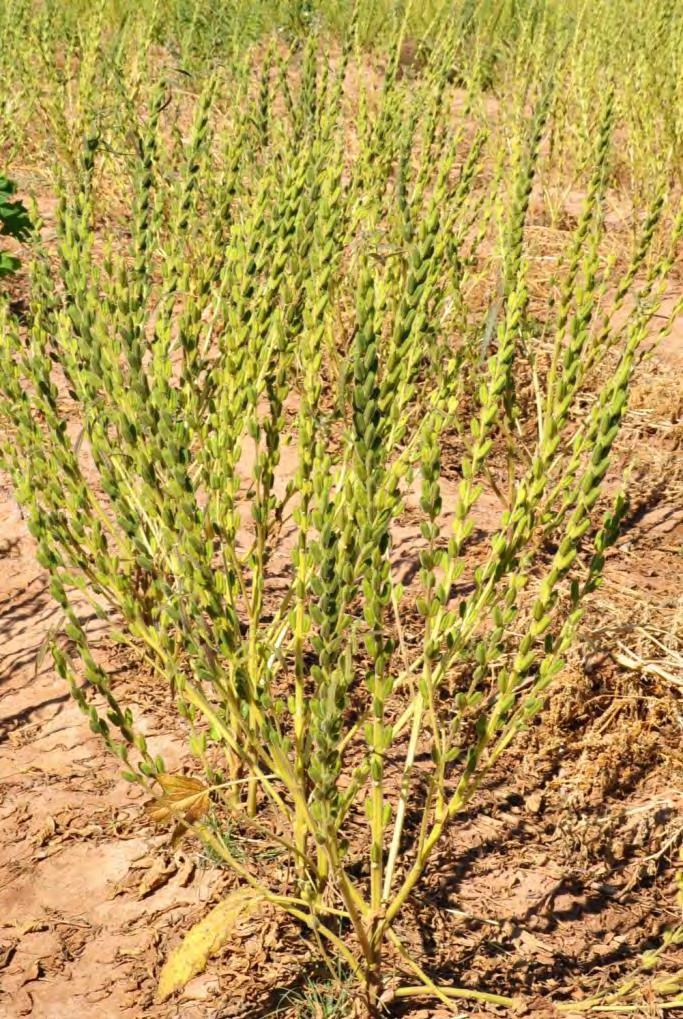
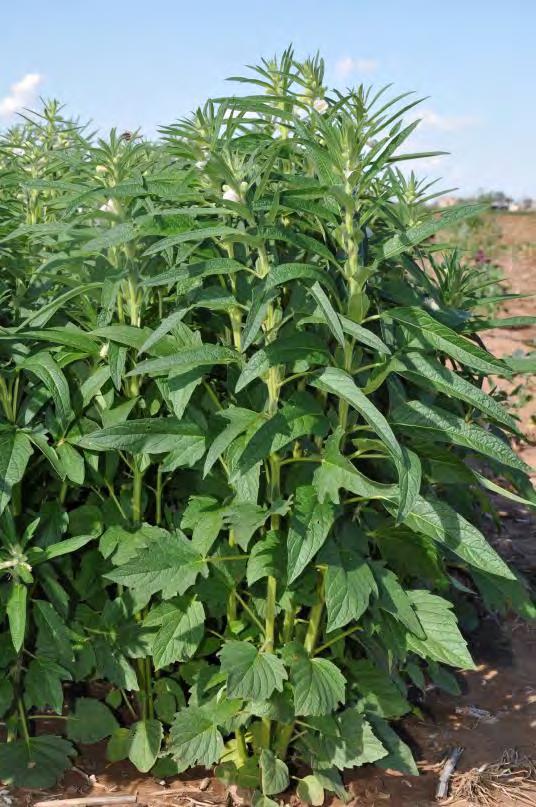
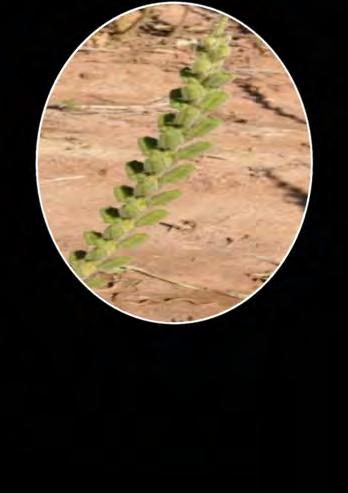
51 Sesame
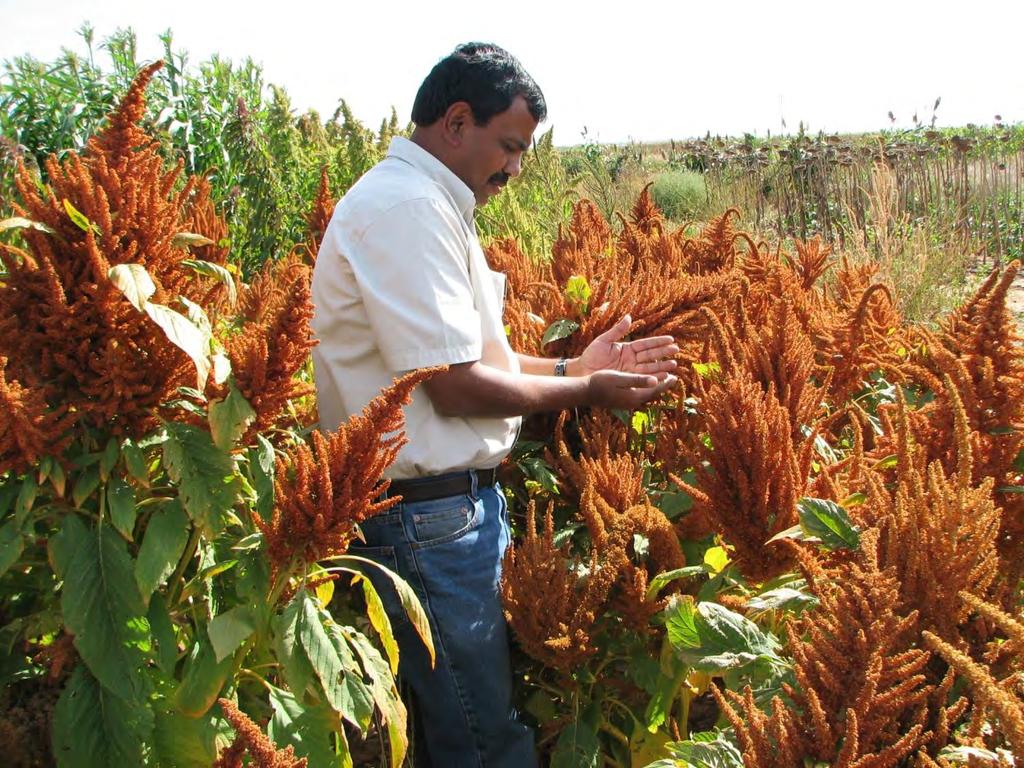
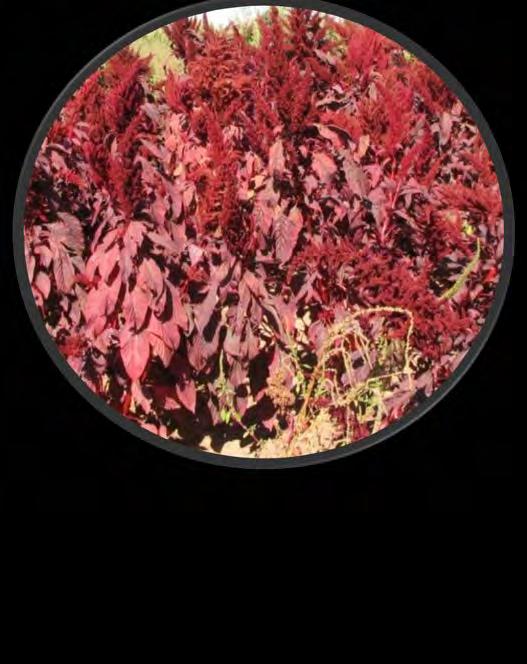
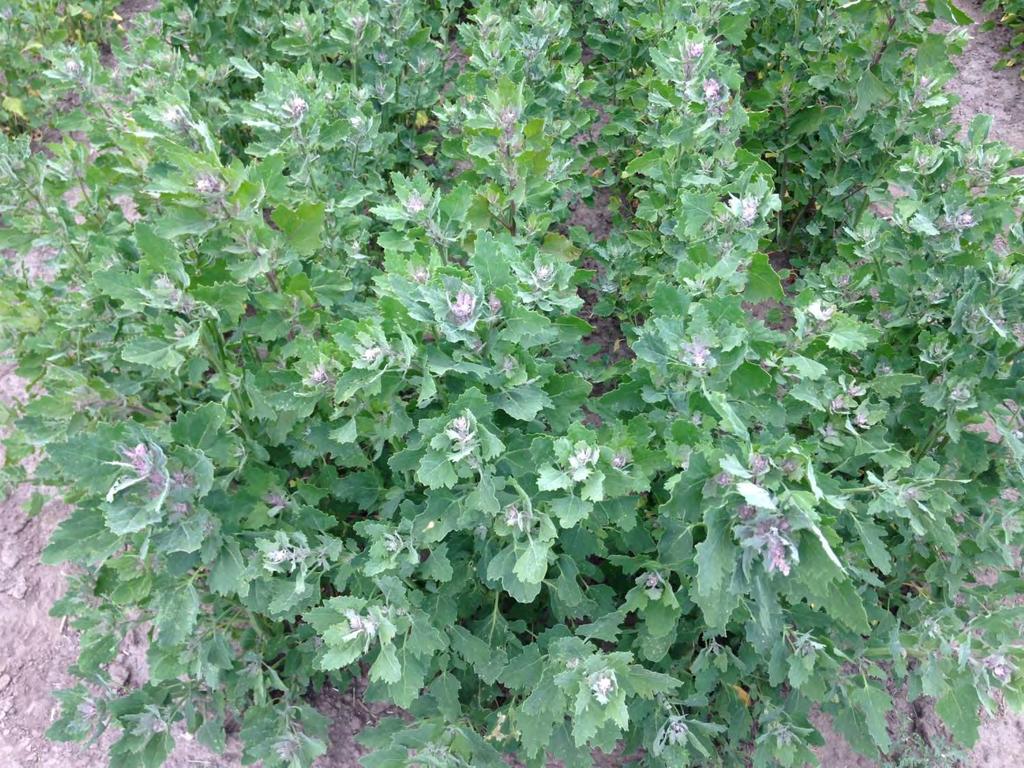
52 Amaranth
53 Lessons Learned Winter Crops Irrigation Trial Dual Purpose Canola Production Safflower Water Management

54 Winter Canola: Deficit Irrigation Management Develop water use and yield relationships for oilseed crops Compare water productivity with winter wheat
 Sept 1 Sept 15")
55 Canola Seeding Date (Our Experience) Sept 1 Sept 15 Oct 1

56 Winter Canola Root System and Water Needs (Clovis, 2014)
57 Water Extraction (Winter Canola (Winter& Canola) Wheat) Soil Moisture Content (m 3 m -3 ) Begining End of season Soil depth (cm) in 1.55 in 0.56 in 2.33 in 2.22 in 2.02 in in 6 in 12 in (Clovis, 2009)
58 Water Use and Forage Production By Winter Canola & Wheat SeedYield (Mg ha -1 ) Biomass Yield (Mg ha -1 ) Canola (DKW41-10) Canola (Rally) Wheat (TAM 111) Total Water Use (mm) (Clovis, )

59 Dual Purpose Crops What s for me!!!


60 Why Canola!!!
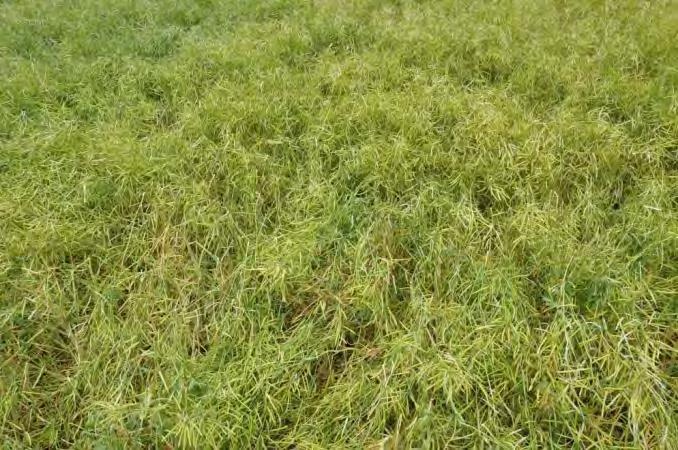
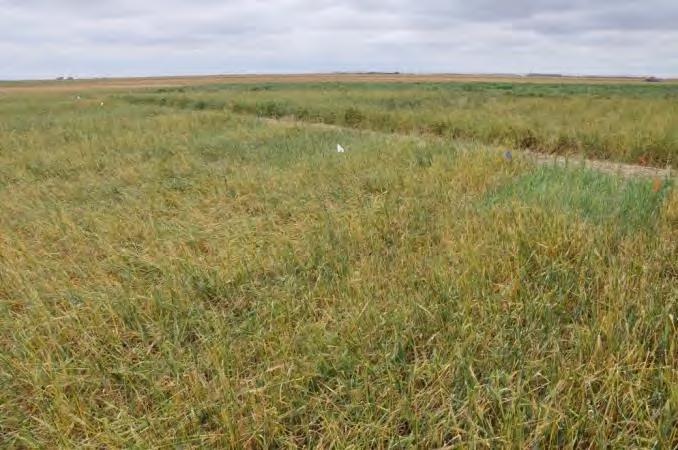
61 Winter Survival Canola vs. Wheat (Clovis, 2013)
62 Forage Productivity Forage Biomass (t ac -1 ) 5.0 Griffin DKW Saffron 4.0 Wheat Regrowth Harvest (Apr 17, 14) 1 st 2 nd 3 rd 4 th (Nov 29, 12) (Feb 13, 13) (Mar 13, 13) (Apr 17, 13) Forage Harvest (Clovis, )
63 Forage Quality Relative Feed Quality (RFQ) Griffin DKW Safran Wheat (Tam 111) st 2 nd 3 rd 4 th (Nov 29, 12) (Feb 13, 13) Forage Harvest (Mar 13, 13) (Apr 17, 13) (Clovis, )
64 Forage Nitrate Content Griffin DKW Safran Wheat (TAM 111) Nitrate (ppm) st 2 nd 3 rd 4 th (Nov 29, 12) (Feb 13, 13) (Mar 13, 13) (Apr 17, 13) Forage Harvest (Clovis, )
65 Grain Production No Forage Harvest Seed Yield (lb ac -1 ) Griffin DKW Saffron Wheat 1 st 2 nd 3 rd 4 th (Nov 29, 12) (Feb 13, 13) (Mar 13, 13) (Apr 17, 13) Control Forage Harvest (Clovis, )
66 Winter Canola: Farmer Experience Minimally Irrigated Rainfed Pivot Corner
67 Tips for grazing Use untreated canola seed. Adjust rate so new growth is consumed, and remove cattle when 50% of original growth remains. Have a minimum of 25% high-fiber hay. Treat as a concentrate use a bloat preventer. Closely monitor livestock. Test forage for nitrate. Graze after a hard freeze.
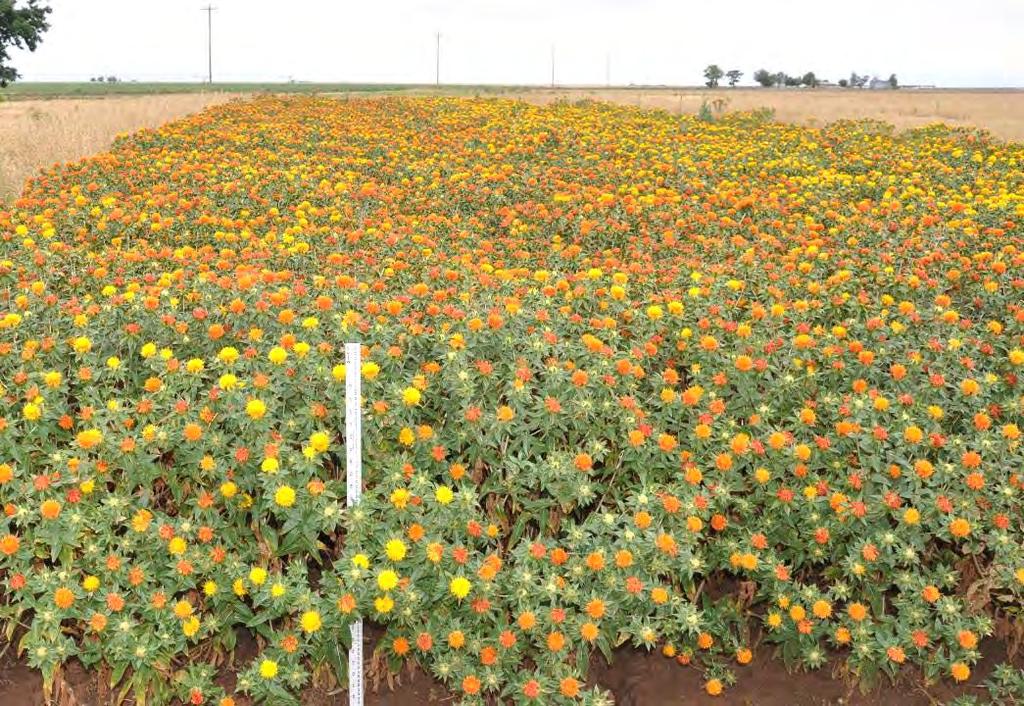
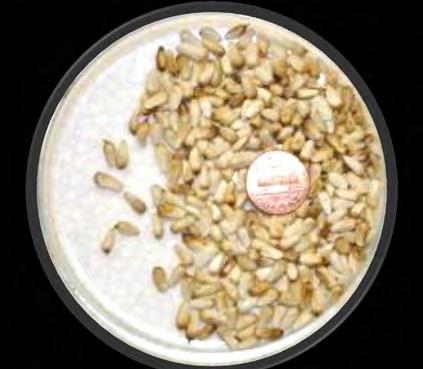


68 A New Generation of Desert Crops Safflower
 (160 mm) 2.")
 Irrigation levels: 5 I 1, I 2, I 3, I 4 and I 5 (75, 150, 225, 300 and")
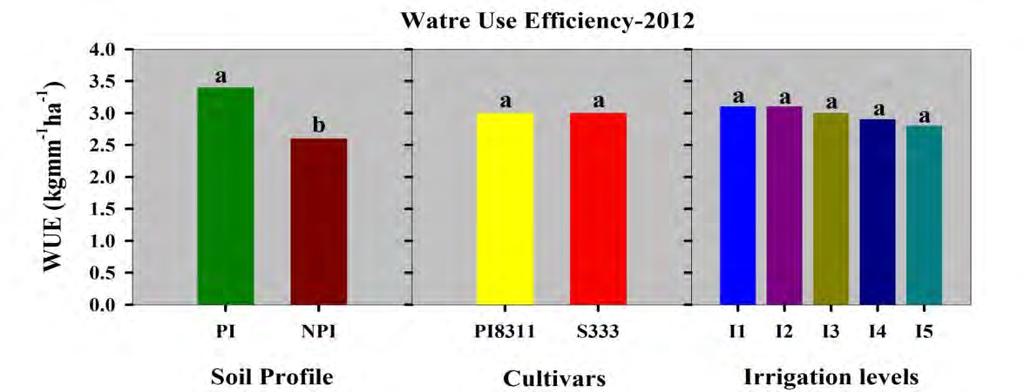
69 Pre-season and in-season irrigation management in safflower Experimental Design: Split Plot Main plot: Soil Profile 1. Pre-irrigation (PI) (160 mm) 2. No-pre-irrigation (NPI) (depleted soil profile) Sub plot: cultivars and irrigation levels Cultivars: 2 (S333 & PI8311) Irrigation levels: 5 I 1, I 2, I 3, I 4 and I 5 (75, 150, 225, 300 and 375 mm) NPI 6-12 Buffer PI Drip & central pivot irrigation


70 Safflower response to pre- and in-season irrigation cv. S333 cv. PI8311 No Pre-irrigation Pre-irrigation Plant Height (cm) I 5 I 4 I 3 I 2 I 1 I 5 I 4 I 3 I 2 I 1 Irrigation Levels 00
71
72 Treatment Heads plant -1 Seeds head Seed yield (kg ha -1 ) Oil yield (kg ha -1 ) Heads plant -1 Seeds head -1 Seed yield (kg ha -1 ) Oil yield (kg ha -1 ) PI 7.3 a 25.9 a 1459 a a 5.5 a 23.6 a 1284 a NPI 5.5 b 22.7 b 1047 b b 3.7 b 18.3 b 589 b Irrigation levels I d 21.2 c 880 d d 3.2 d 18.4 b 510 c I d 22.7 bc 1079 cd cd 4.3 c 19.1 b 584 c I c 24.6 ab 1253 bc bc 4.6 c 21.5 a 936 b I b 26.1 a 1426 ab ab 5.2 b 22.3 a 1269 a I a 26.7 a 1626 a a 5.8 a 23.7 a 1383 a Cultivars PI a 22.7 b 1280 a a 4.6 a 21.9 a 995 a S a 25.9 a 1226 a a 4.6 a 20.0 b 878 b
73 Pre-irrigation was beneficial to improve WUE and HI, however increase in irrigation level does not always aid to WUE and HI. Safflower yield responded positively to preirrigation and increased irrigation levels in both the years. Increase in yield was due to increase in head numbers, seeds per head and photosynthesis.

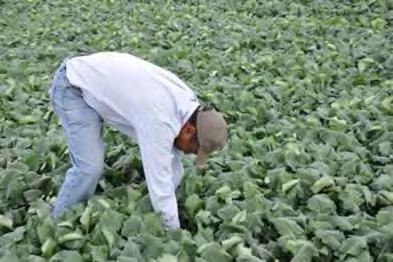
74 Safflower: Farmer Experience

75 Thank You (Clovis, 2013)