B.A. Stewart Dryland Agriculture Institute West Texas A&M University Canyon, TX
|
|
|
- Nancy Cannon
- 5 years ago
- Views:
Transcription

1 B.A. Stewart Dryland Agriculture Institute West Texas A&M University Canyon, TX
 2011 World Average Wheat Yield (1000 kg")
2 2011 World Average Corn Yield (750 kg water/kg corn) * U.S. Corn Average (600 kg water/kg corn) 2011 World Average Wheat Yield (1000 kg water/kg wheat)
 Rockström et al., Managing water in rainfed agriculture. International Water Management Institute.")
3 Only transpiration (T) results in crop growth, and T makes up only part (~40 to 70%) of evapotranspiration (ET) used to determine PWP. (added) Rockström et al., Managing water in rainfed agriculture. International Water Management Institute.

4 Salinity Management Guide

5 (FAO Irrigation and Drainage Paper 56)
6 The Transpiration Environment is determined by HOW HOT IT IS HOW SUNNY IT IS HOW DRY THE AIR IS HOW WINDY IT IS (at the under-leaf surface; not at the weather station)


7 High production maize fields have 80 to 90 thousand plants/ha compared to dryland fields that may have only 30 thousand plants/ha. The plant leaves in these fields have very different vapor pressure deficits even though the weather measurements may be the same.
8 GY = ET x T/ET x 1/TR x HI where GY is grain weight in kg/ha; ET is kg/ha water used (evapotranspiration) by the crop between seeding and harvest; T/ET is portion of ET used for transpiration; TR is the transpiration ratio expressed as kg water transpired to produce 1 kg of aboveground biomass; and HI is the harvest index which is the kg grain/kg aboveground biomass (all plant components are expressed as dry weights). (Stewart and Peterson, 2014 Agron. J.)
9 GY = ET x T/ET x 1/TR x HI Because this is a linear equation, increasing any one factor by 5%, for example, will only increase GY by 5%. However, changing any one of these factors almost always affects the other factors sometimes positive and sometimes negative. Increasing ET generally affects all the other factors in a positive manner, so LARGE increases in GY occur when ALL the factors are increased in a positive direction. That is why we like to irrigate. Doubling ET often increases GY four fold or more. The challenge is when ET is low and cannot be increased, How do we make the other factors more positive to increase GY?
10 Sinclair and Weiss states that C 4 crops such as corn and sorghum growing in a somewhat average transpiration environment of 2 kpa has a transpiration ratio of about 220 kg water for every kg of biomass produced. This ratio can be as low as approximately 160 for humid conditions and as high as 280 for arid conditions. A C 3 crop such as wheat has a transpiration ratio of about 330 kg water for a kg of biomass. (Sinclair and Weiss (2010); Principles of Ecology in Plant Production, 2 nd Edition, CABI.)
11 Despite claims that crop yields will be substantially increased by the application of biotechnology, the physical linkage between growth and transpiration imposes a barrier that is not amenable to genetic alteration. (T.R. Sinclair, North Carolina State University )
12 Hypothetical values of components for corn with increasing precipitation based on GY = ET x T/ET x 1/TR x HI Precip. (mm) ET (mm) T/ET TR (kg H 2 O/kg biomass) Harvest Index GY (kg ha -1 ) ,700 GY (bu/ac at 15% water)

13 Grassini et al., 2011 Field Crops Res. 120: (Nebraska dryland and irrigated corn yields) T/ET 0.70 TR 200 HI 0.55 T/ET 0.59 TR 230 HI 0.51 T/ET 0.61 TR 220 HI 0.54 T/ET 0.55 TR 240 HI 0.46 (Seasonal water supply assumed to equal ET in using GY=ETxT/ETx1/TRxHI)


14 GY = ET x T/ET x 1/TR x HI It is essential to reduce plant populations with increasing aridity because there will not be enough water during the grain filling stage and HI will be drastically reduced. Low plant populations, however, tends to negatively affect the other factors.


15 GY = ET x T/ET x 1/TR x HI Skip rows are sometimes used in dryland areas, but the only factor that is likely to be increased is the HI, and the other factors will likely be decreased. The 1/TR value is possibly improved because the plants in the planted rows are closer together than when every row is planted which should improve microclimate.


16 GY = ET x T/ET x 1/TR x HI Mulch is very beneficial because it tends to increase every factor. Furthermore, it increases soil water stored in the soil profile between crops. This has been perhaps the most important improvement in dryland areas in the past 40 years. The main problem is insufficient mulch in dry areas, and the competing uses for crop residues in developing countries.


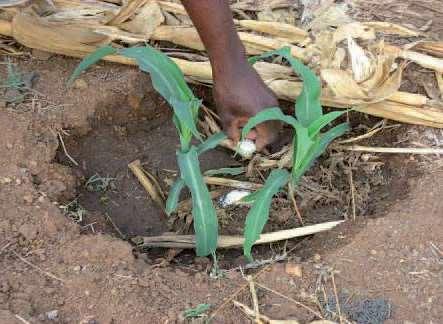
17 GY = ET x T/ET x 1/TR x HI A rather novel approach is growing plants in clumps rather than equally spacing the plants in rows. The hypothesis is the microclimate will be improved and tiller formation reduced. Best combined with mulch; otherwise T/ET may be decreased because of less shading of the soil surface.


18 GY = ET x T/ET x 1/TR x HI can be replaced with FY = ET x T/ET x 1/TR x HI If FORAGE is the harvestable product, the HI will be close to one so plant population can be increased to exploit soil water to maximize ET, increase T/ET, and improve microclimate to decrease TR. All factors become more positive so FY increases.
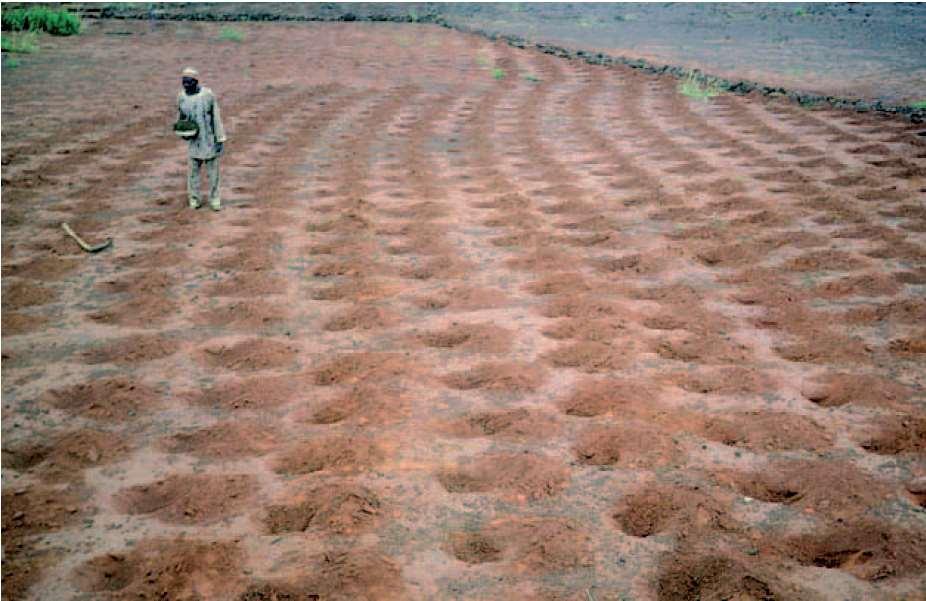
19 NIGER
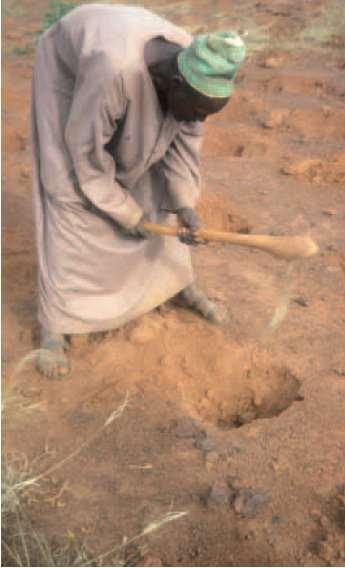
20 NIGER
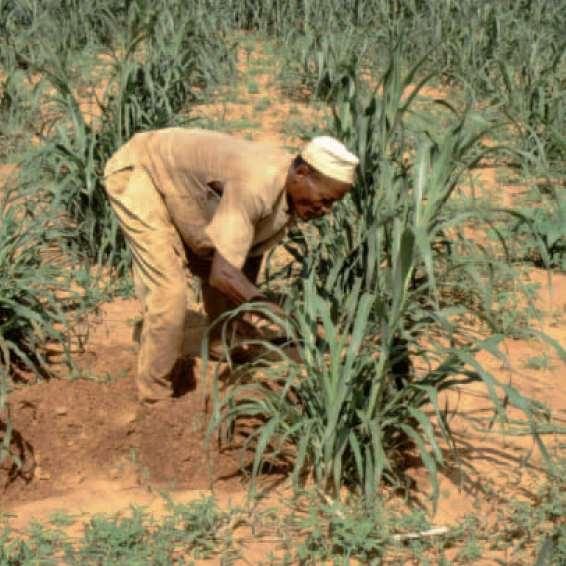
21 NIGER

22
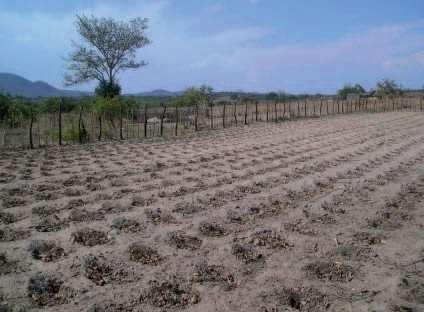
23 ZIMBABWE
24
25
26 ZIMBABWE
27 ZIMBABWE
28 Loomis (1983) said uniformity is ideal where resources are not limiting, but a useful generalization is when a resource like water or fertility is limited, non-uniformity is advantageous. Increasing availability of precision agriculture technologies may provide new opportunities for manipulating plants. (Loomis, R.S., Limitations to Efficient Water Use in Crop Production, ASA, CSSA, SSSA, Madison, WI)
29 ZIMBABWE
30
31 Wheat --- Twin rows with fertilizer banded between the rows (approximately 10 cm between twin rows with 60 cm intervals) Maize--- Three-plant clumps with fertilizer placed beneath (clumps would be approximately 75 cm apart)
32 SANREM Phase IV was timely, well conceived and executed. I strongly recommend a summary publication that pulls together data and information from the seven LTRAs. While the Conservation Agriculture Production Systems varied among the various LTRAs, all were developed using the three principles of conservation agriculture. The LTRAs spanned 13 countries, hilly and flat lands, areas where it never freezes and those that have cold winters, recently developed cropland and highly eroded cropland, high rainfall areas and low rainfall areas, and farms with livestock and those without. The common thread is that all LTRAs were for a 5-yr period, and mostly involved farmers that previously used conventional tillage. A publication that summarizes not only how crop yields were affected but how economic and gender conditions were altered would be a valuable contribution.