Phillip, L.E., Gray-Donald, K. C., Carvalho, R. M. P. de, Stanley, A., I. Granderson, I. Liburd- Willett, I. and Madramootoo, C.A.
|
|
|
- Dorcas O’Connor’
- 5 years ago
- Views:
Transcription


1 An integrated farm to fork approach to improving food and nutrition security in the Caribbean by linking agricultural productivity and diversity on small holder farms to school feeding programs Phillip, L.E., Gray-Donald, K. C., Carvalho, R. M. P. de, Stanley, A., I. Granderson, I. Liburd- Willett, I. and Madramootoo, C.A. Presented at the International Food Security Dialogue 2014 Theme: Nutritional security - relations between food, agriculture, health and nutrition Presented by Leroy E. Phillip Faculty of Agricultural and Environmental Sciences, McGill University, Montreal, Canada Sponsored By: Hosted By:

2 BACKGROUND: CARICOM Countries St. Kitts and Nevis St. Lucia Trinidad and Tobago Guyana
3 BACKGROUND: Food Import Bill TRENDS IN CARICOM AGRICULTURAL TRADE IN CROPS AND LIVESTOCK PRODUCTS Total EXPORTS U$M Total IMPORTS U$M U$ Million 4,500 4,000 3,500 3,000 2,500 2,000 1,500 1, Year Source: J. R. Deep Ford 2013; FAO
4 BACKGROUND: Food Availability Pattern Food Availability Availability 1 (Kcal/per capita/day) % of change RPG Surplus (+) or Deficit (-) relative to RPG (%) Total Food Calories (+) (+) Staples (+) (+) Fruits & Vegetables Sugar & Sweeteners Fats & Vegetable Oils (+) (-) (-) (+) (+) Protein (+) (+) 1 Kcal/per capita/day; 2 Recommended Population Goal (2002); 3 Staples= Cereals + Starchy Roots Source: Food Balance Sheets - FAOSTATS, April 2014
5 BACKGROUND: Food Availability Pattern Food Availability Availability 1 (Kcal/per capita/day) % of change RPG Surplus (+) or Deficit (-) relative to RPG (%) Total Food Calories (+) (+) Staples (+) (+) Fruits & Vegetables Sugar & Sweeteners Fats & Vegetable Oils (+) (-) (-) (+) (+) Protein (+) (+) 1 Kcal/per capita/day; 2 Recommended Population Goal (2002); 3 Staples= Cereals + Starchy Roots Source: Food Balance Sheets - FAOSTATS, April 2014
6 BACKGROUND: Obesity Problem Prevalence of Overwt / Obesity in the Caribbean in > 30 years old Males Barbados Trinidad and Tobago Dominica Jamaica Saint Lucia Bahamas Saint Kitts and Nevis Antigua and Barbuda Grenada Saint Vincent and the Grenadines Belize Suriname Guyana Haiti Prevalence of Obesity Females Source: J. R. Deep Ford 2013; FAO

7 BACKGROUND: Obesity Problem Changes in Childhood (0-5yr) Underweight and Overweight Status During a decade Percentage Under Weight Over Weight Source: CFNI
8 Problem Statement and Challenges : Food Insecurity in CARICOM CARICOM Food Insecurity has taken the form of overweight & obesity Obesity is high risk factor in NCDs, costing CARICOM 5-8% of GDP (Hospedales et al. 2011) Obesity, especially women, is rapidly increasing, and on the rise among children Obesity: linked to low intakes of fruits & vegetables, high intakes of fats, oils, sweeteners; Poor consumer food choices and lifestyles; Institutional and market constraints on domestic production of nutritious food Seasonality in crop and livestock productivity, floods and droughts Limited Institutional Capacity High food import bill (US $5 bil/yr) energy- dense food types
9 Project Goals Improve nutrition & health outcomes of CARICOM populations through increased availability of foods that would increase intake of vegetables & fruits, decrease caloric intake, and increase micronutrient intake; Develop food production systems based on agricultural diversification, water conservation & efficient use of land; Understand constraints to, and accelerate the rate of technology adoption by small farmers; Adapt international standards of food safety and quality for a healthy, market-oriented food supply chain; Build and test a Farm to Fork Model for CARICOM food and nutrition security; Expand and build human and institutional capacity to solve problems of food and nutrition insecurity in CARICOM;

10 MODEL BUILDING: Framework for change: CIFSRF Project Opportunity Effort CHANGE Build partnerships Policy instru ments Knowledge generation Agriculture Education Health NCD s
11 From Farm to Fork model building MODEL Building

12 MODEL Building: Farm to Fork Model for CARICOM Food Security Collective action Innovation Technology adoption Social capital Policy
13 Research Interventions Project Themes Community Nutrition & Health Research Interventions/ Activities Menu modification to school lunch St. Kitts and Nevis Trinidad and Tobago Guyana X X n/a Nutrition education n/a X n/a St. Lucia n/a n/a Food safety X X X X Socioeconomics Water and Land resources (Agricultural technologies) Policy and Institutions X X X X Food choice experiments/ Technology adoption Drip Irrigation for food crops X n/a X X X X Protected agriculture X X n/a Open field cropping systems X X X Post harvest Quality X X X X n/a X X X Silage-based small ruminant production X n/a n/a n/a


14 Pilot Countries MANSION STAPLETON SAN JUANLAVENTILLE SANGRE GRANDE Source: Adapted from Ezilon maps, 2014
15 School Lunch Feeding MODEL Building
 119 80 Trinidad and Tobago Nutrition education (NE) 99 54 MM+NE 150 101")
16 ( METHODOLOGY: Study Period ad Sample Size Country Treatment # of children (total=1871) # of children assessed (5-12 yr) (Total= 491) St. Kitts and Nevis Menu modification Control Menu modification (MM) Trinidad and Tobago Nutrition education (NE) MM+NE Control 97 68
17 Methodology : Menu Planning Goals Menu Planning goals in keeping with the US National School Meals Program, /3 of daily recommendations Fat: Reduce total fat to no more than 30 percent of calories. Sodium- Reduce intake of sodium to mg Iron include iron rich foods to provide approximately 2-4 mg Protein To include a variety of protein sources (peas and beans, fish and poultry) Energy Approximately 470 kcal Fiber Increase use of whole grains, roots and tubers Fruits Vegetables & 1 serving of whole fruit or 100% fruit Juice, and 1 serving of Vegetables


18 Methodology: Menu changes in St. Kitts Before Rice and beans, turkey wings, Noodles/ground meat Hot dogs Chicken soup with pumpkin and dumplings Cheese sandwich Sugar drink Added String beans, carrots Tomatoes, cucumbers Sweet potato, pumpkin Melon, green banana Mutton 18
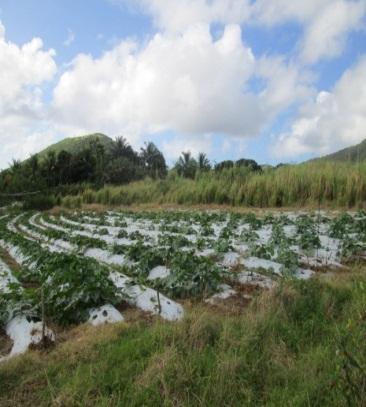
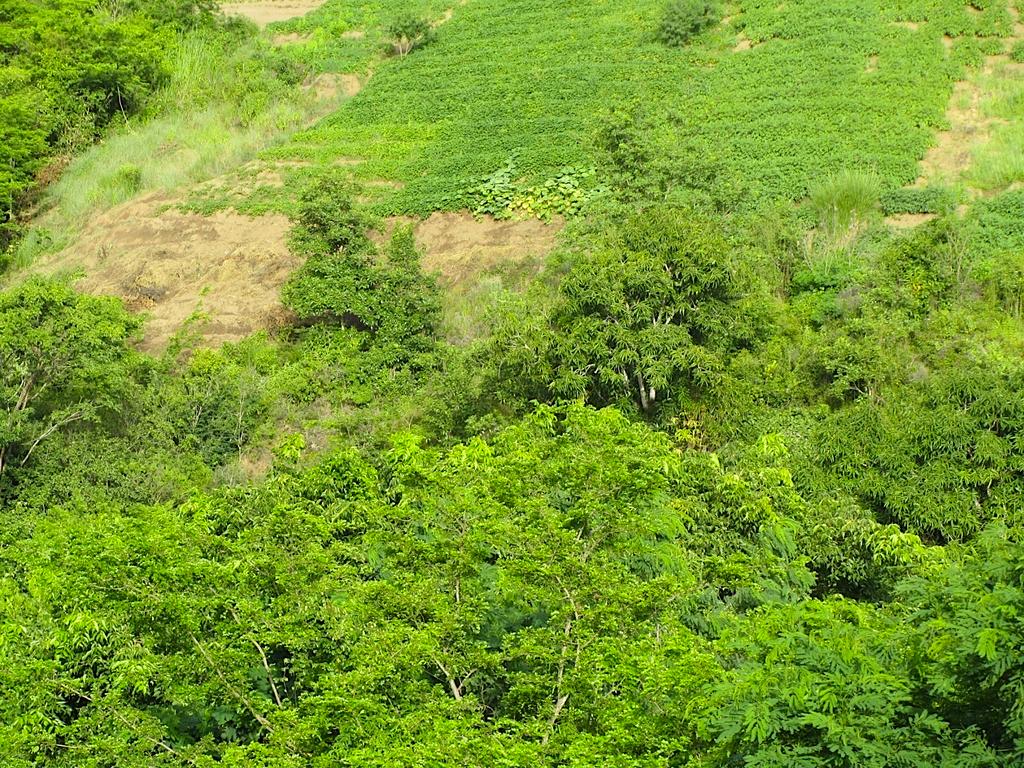
19 Model Building Agricultural technology for crop productivity and diversity
; 16 farmers in SK; 10 in east coast Guyana For St.")

 Study Design: 3 irrigation scheduling treatments")
20 Methodology Drip Irrigation Studies 4 on-farm experimental sites (2 in St. Kitts ; 2 Guyana); 16 farmers in SK; 10 in east coast Guyana For St. Kitts, the irrigated area was 1.84 ha in total; 0.66 in Stapleton and 1.18 in Mansion. In Guyana, the irrigated area was 1.65 ha in ( total; 0.85ha in Parika region and 0.80ha in Black Bush Polder). Crops : 13 different crops (F& V) Study Design: 3 irrigation scheduling treatments (Control, 80% of AWC and 100% of AWC) Measurements : crop yield, soil moisture, climate parameters


21 Technologies for diet diversity and quality Drip irrigation Post-harvest loss measurement (Penetrometer) Drip + mulching Mulato grass conservation for small ruminants
22 PROJECT RESULTS PROJECT RESULTS


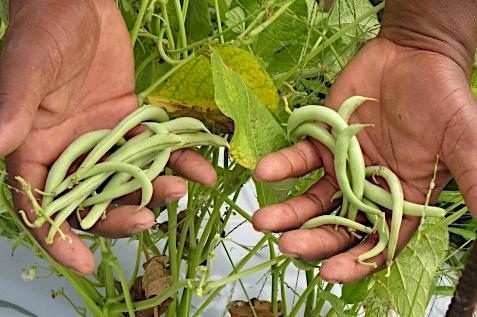
23 RESULTS: Drip Irrigation for crop productivity and diversity Melons Pumpkin Cucumbers Tomatoes Cabbage String beans Watermelon Carrots
24 RESULTS: Drip Irrigation for crop productivity and diversity Comparative project yield (Kg/ha) - St. Kitts Irrigated Not irrigated Carribean FAOSTATS 2012 values Pumpkin String beans Tomato Honeydew*
25 RESULTS: Drip Irrigation for crop productivity and diversity Comparative project yield (Kg/ha) - St. Kitts Irrigated Not irrigated Carribean FAOSTATS 2012 values Cabbage Carrot Cucumber Watermelon

26 RESULTS : Using the McGill IRRIMOD Soil Water Balance Model Average monthly irrigation requirement at the three study sites during


27 RESULTS: Post-harvest Losses Mapping


28 RESULTS: Controlling Post-harvest Losses Direct sunlight control Packaging materials Wrapping materials
29 School Feeding RESULTS: School Feeding
30 Baseline Data: food security; nutritional status; obesity Produce Procurement by school meals Centre: produce supplied by local Farmers Diversity of produce procured Cost of Improved lunch menu Menu Compliance Diet Quality : Nutrient content of meals as offered Meal Acceptance ( plate waste) Nutrition outcomes of children 24 h recall dietary intake Fruit and vegetable intake Anthropometry (BMI; height for age) School Feeding data Collected
31 BASELINE RESULTS: BMI of subjects in St. Kitts
32 Baseline RESULTS : Food Security vs nutrition in Trinidad and St. Kitts Food security status % of households % of thin children % of overweight and obesity children Food insecure Food secure Food Security: Based on USDA Six Item Short Form Household Food Security Survey Module, September 2012
33 Extent of produce supplied by Local Farmers (Project and Non Project Farmer) in St. Kitts relative to School Meal Centre Needs January 2013 to March 2014 school year Product Jan Feb Mar Apr May Jun Sept Oct Nov Dec Jan Feb Mar 19% 83% Tomato 26 surplus surplus Pumpkin % 14% Cucumber 63 surplus surplus String Beans Carrots % surplus 33 14% surplus Sweet Potato White Potato Cabbage Watermelon Cantaloupe Banana Other fruits Onion 28 8% Surplus 1% Surplus 42% Surplus 85 Mutton Extent of supplied (%) Surplus RESULTS: Food Procurement
 by local farmers (\"project\" and non-project farmers ) in relation to SMC needs- January 2013 until March 2014 school year % of Produce supplied 120 100 80 60 40 20 0")
34 RESULTS: Food Procurement Proportion (%) of produce supplied to St. Kitts School Meals Centre (SMC) by local farmers ("project" and non-project farmers ) in relation to SMC needs- January 2013 until March 2014 school year % of Produce supplied Jan-Jun 2013 Sept-Dec 2013 Jan-Mar 2014 Fruits Vegetables Pulses Roots Mutton Roots White potato, Sweet potato, Carrots and Breadfruit; Vegetables Tomato, Pumpkin, Cucumber, Cabbage. Collard leaves and Onions; Pulses String beans; Fruits Watermelon, Banana, Cantaloupe, Oranges, Sour orange, Star fruit and Lime; Mutton
35 RESULTS: Food Procurement 3000 Total quantity of all produce received by St. Kitts School Meals Centre from local farmers ("Project "and non-project farmers) - January 2013 until March 2014 school year 19.7 tonnes of produce January February March April May June September October November December* January February Quantity of produce (Kg) March All farmers Project farmers
36 RESULTS: Food Procurement Number of Vegetables and Fruits Diversity (number ) of Fruits, Vegetables, Pulses and Roots received by St. Kitts School Meals Centre from local farmers ("Project" and Non Project Farmers) -January 2013 to March 2014 school year 4 January 5 February March 5 4 April May 6 June 8 September October 11 8 November 7 7 December* January February March All farmers Project farmers
37 Energy intake (Kcal/child/d/lunch meal) by school children in St. Kitts 319 Calories (Kcal) Nutrient intake (g/child/d/lunch meal) by school children in St. Kitts Protein (g) Carbohydrates (g) 2 3 Fiber (g) 7 11 Fat (g) Control Schools Intervention Schools Control Schools Intervention Schools Vitamin intake ( per child/d/lunch meal) by school children in St. Kitts Control Schools Intervention Schools Vitamin A (IU) Vitamin C (mg)
38 Intervention 24hr recall End of project intake of fruit and vegetables (no. of servings) by children (8 to 12 year old) in Trinidad, based on 24 h dietary recall and the number of children eating the school lunch meals on recall day (preliminary results) 1.20 Intake of fruit and vegetable by children (8 to12 year old) No. of servings Fruit intake Control Improved menu Vegetable Intake
39 Lunch Meal cost & acceptance Process Evaluation Study in St. Kitts Control Test meal -April Test meal 2013 Sept-Oct 2013 Fruit /Veg servings % of Children accepting new foods (%) Compliance with test menu Cost per meal per child ($EC) N/A N/A 67% 89% 0.96 ($0.39 CAD) 1.57 ($0.64 CAD) 2.06 ($0.84 CAD)
40 Conclusions School feeding programs (SFP,s) are underutilized vehicles for reversing the obesity trends in CARICOM while providing market opportunity for small holder farmers ; Equipped with drip irrigation and other agricultural technologies, local farmers delivered about 20 tonnes of new nutritious produce in one year to the SFP in St. Kitts- a novelty in food procurement by the SFP in the Eastern Caribbean Project results from serve to construct a useful farm to fork model for regional application in finding solutions to CARICOM food and nutrition insecurity Findings from the Project could inform policy makers of a new, and integrated approach to addressing food insecurity in CARICOM
41 Acknowledgments Acknowledgements Funding for this project was provided by The Canadian International Food Security Research Fund (CIFSRF) a program of Canada s International Development Research Centre (IDRC) undertaken with the financial support of the Government of Canada provided through Foreign Affairs, Trade and Development Canada (DFATD). We acknowledge the enormous support and contribution for the institutional partners and personnel in St. Kitts-Nevis Special appreciation is expressed to Patrick Cortbaoui, all other Project Team members and Project Partners for their contributions to the project. Project website:


42 THANK YOU CARICOM Project website: