Energy Efficiency, Food Miles and Fuel Usage in Food Transport
|
|
|
- Millicent Gardner
- 5 years ago
- Views:
Transcription

1 Energy Efficiency, Food Miles and Fuel Usage in Food Transport CTRE Transportation Scholars Seminar February 10, 2006 Rich Pirog Marketing & Food Systems Program Leader Leopold Center for Sustainable Agriculture Iowa State University - Ames
2 Leopold Center for Sustainable Agriculture Created in 1987 (Iowa Groundwater Protection Act) State funded (Iowa general revenue fund and tax on N fertilizer and pesticides) Averaging 1.2 million per year in funded projects Focus on 3 initiative areas since 2001: Marketing and Food Systems Policy Ecology
3 Interest and demand for locally grown food products increases. From 1994 to percent increase in number of farmers markets 50 CSAs in 1990, more than 1,000 today Increase in independent restaurants serving local food products Increase in larger food service companies sourcing local products (SYSCO, Bon Appetit`)
4 Why the interest in local? Freshness, taste, quality Knowing the food story Supporting farmers Supporting the local economy Consumer connection back to the land
5 Energy Use in the Food System Food systems account for percent of total U.S. energy consumption* Transportation accounts for 11 percent of energy use within the food system* In the UK, agricultural/food production accounts for 28% of goods transported on UK roads, imposing external costs of 2.35 billion pounds per year** * Hendrickson, John, Energy Use in the Food System: A Summary of Existing Research and Analysis **From Farm costs and food miles: An assessment of the full cost of the UK weekly food basket (Jules Pretty et. al., Food Policy 30 (2005) 1-19).
6 340% U.S. total vegetable imports and per capita consumption trends relative to 1970 base year 310% 280% 250% 220% 190% 160% 130% 100% 4.1% vegetables imported in 1970 Vegetable import Vegetable consumption 11.6% vegetables imported in % Year Data from USDA Economic Research Service


7 200% U.S. total fresh fruit imports and per capita consumption trends relative to 1970 base year 190% 180% Fruit import Fruit consumption 38.9% fresh fruit imported in % 160% 150% 140% 130% 120% 110% 100% 20.8% fresh fruit imported in % Year Data from USDA Economic Research Service

8 In California more than 485,000 truckloads of fresh fruits and vegetables travel 100 to 3,100 miles to reach their destinations* *Hagen, J.W., D. Minami, B. Mason, and W. Dunton California s Produce trucking Industry: Characteristics and Important Issues
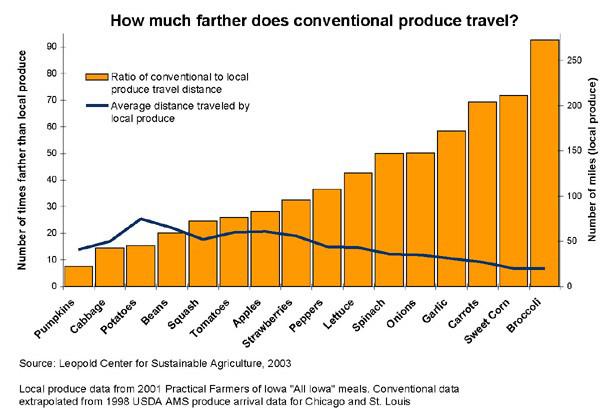
9 What are food miles? Distance food travels from where it is grown/raised to where it is purchased (consumer or end-user) 1969 DOE study 1,346 miles 1980 estimation (UW) for produce 1,500 miles Food miles in industrial nations have increased significantly in last 50 years
10 Weighted Average Source Distances (WASD) for Fresh Produce - Chicago Terminal Market Truck WASD continental U.S. (miles) Arrivals by truck overall (% of total) Arrivals by rail overall (% of total) Foreign arrivals (% of total) 1,245 miles 1,424 miles 1,518 miles 49.6% 68.6% 86.9% 50.4% 31.4% 13.1% 12.5% 16.4% 21.5%
11 Weighted average source distances calculated from USDA AMS arrival data Chicago Terminal Market. Estimations do not include distance from terminal market to point of retail sale
12 Tonnage and distance traveled by food in the UK ( ) Quantity (millions of tonnes) Average distance (kilometers) DETR, Transport of Goods by Road 1998, Dept. of the Environment Transport And the Regions. HMSO, London.
13
14
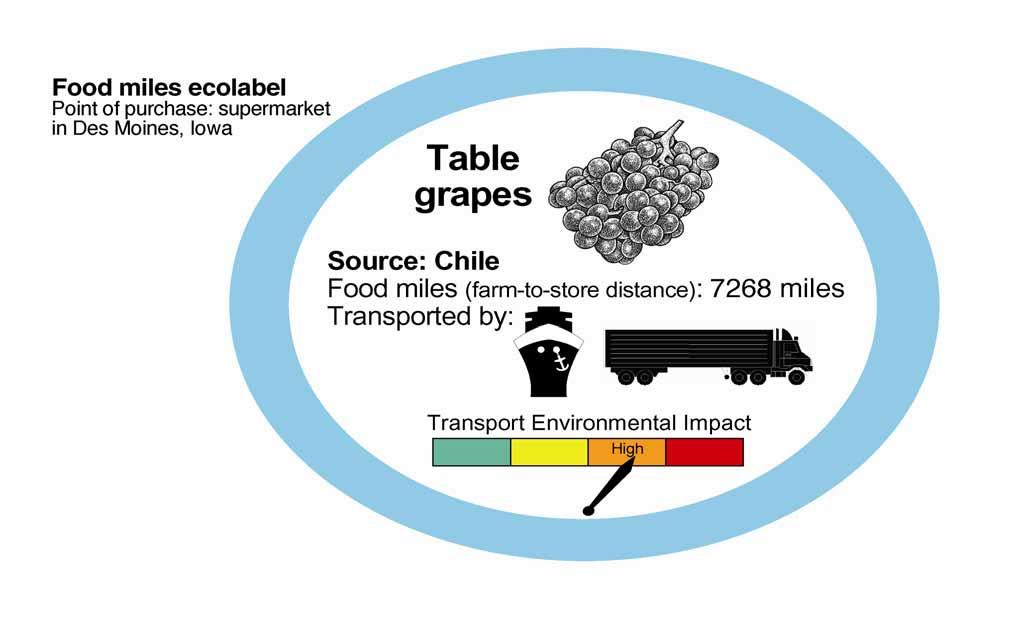
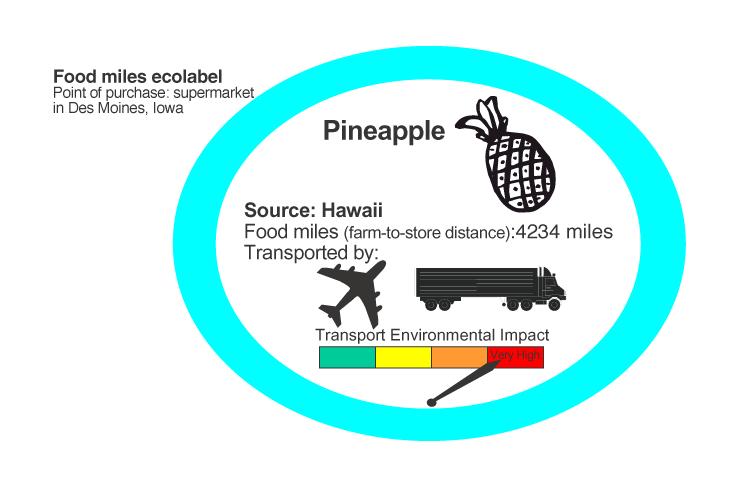
15 Ecolabel Value Assessment Phase I What do you consider "local" when making a food purchase or carrying a food product through your store or business? % responses no response Grow n 25 miles or less from purchase Grow n 100 miles or less from purchase Grow n in my state Grow n in the Midw est Other Business - No Ecolabel Consumer -No ecolabel

16
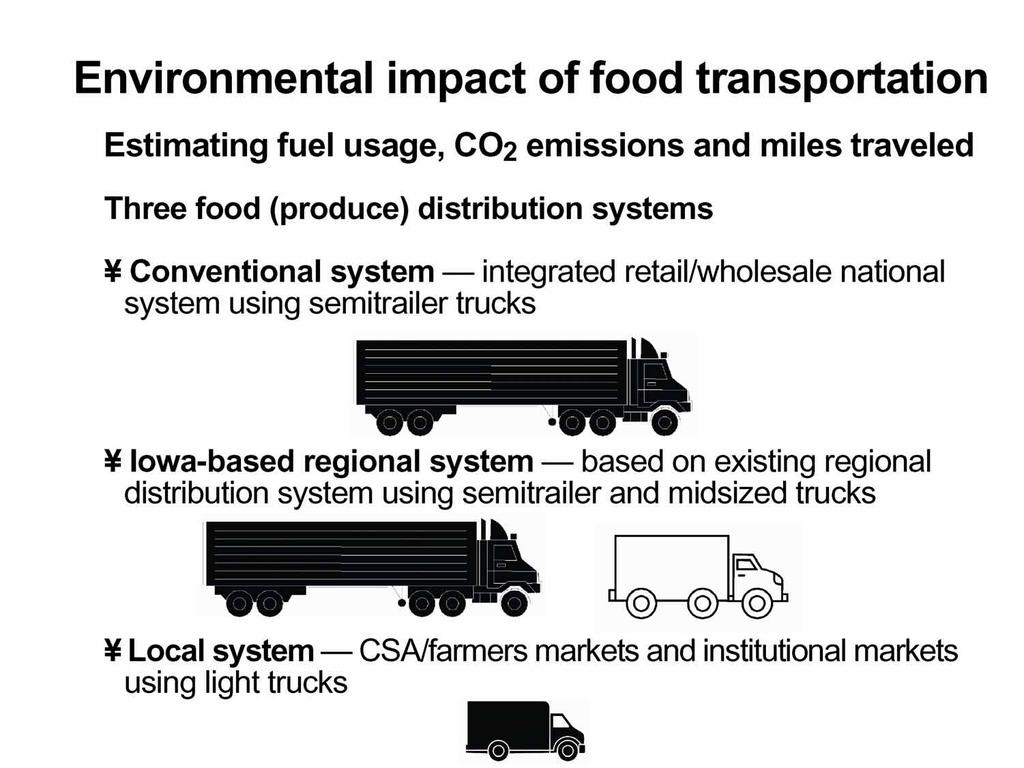
17 Estimated fuel consumption, CO2 emissions, and distance traveled for three truck-based food transport systems. Food transport system Fuel Consumption (gal/year) Co2 Emissions (lbs./year) Distance traveled (miles) National semitrailer 368,000 8,400,000 2,245,000 Regional midsize truck 44, , ,000 Local small truck (institutional) 88,000 1,730,000 1,518,000 From: Food, Fuel, and Freeways Leopold Center, Each system was to transport 10% of per capita consumption of fresh produce to feed Iowa
18 Food miles & CO 2 emissions in Japan CO2 emission levels from transportation sector in Japan is rising rapidly: 21% increase between , 1998, and 40% by Transportation of agricultural products is largely responsible : total distance traveled thru Japan s s food imports is 500 billion t-kmt km. Significance of local markets such as Teikei for minimizing environmental adverse effects from transportation needs to be verified. From CO2 Emissions from Transportation of Fresh Vegetables: Comparison among Local, National and International Markets Yoko Taniguchi et. al
19 Mode of transportation makes a big difference in fuel usage Air transport Truck (road transport) Rail Water
20

21
22
23
24
25 Limitations in using food miles Higher food miles for certain foods don t always translate into higher energy use Local foods grown in greenhouses might use more energy than foods grown in open fields and transported across U.S. Need to apply Life Cycle Analysis to agricultural products
26 Summary Food miles offer a simple metaphor to contrast food systems (local vs. global) Developing or redeveloping a local or regional food system may help reduce fuel use and greenhouse gas emissions (food transport) Mode of transport plays a key role in total fuel usage and greenhouse gas emissions Need to apply LCA to agricultural products
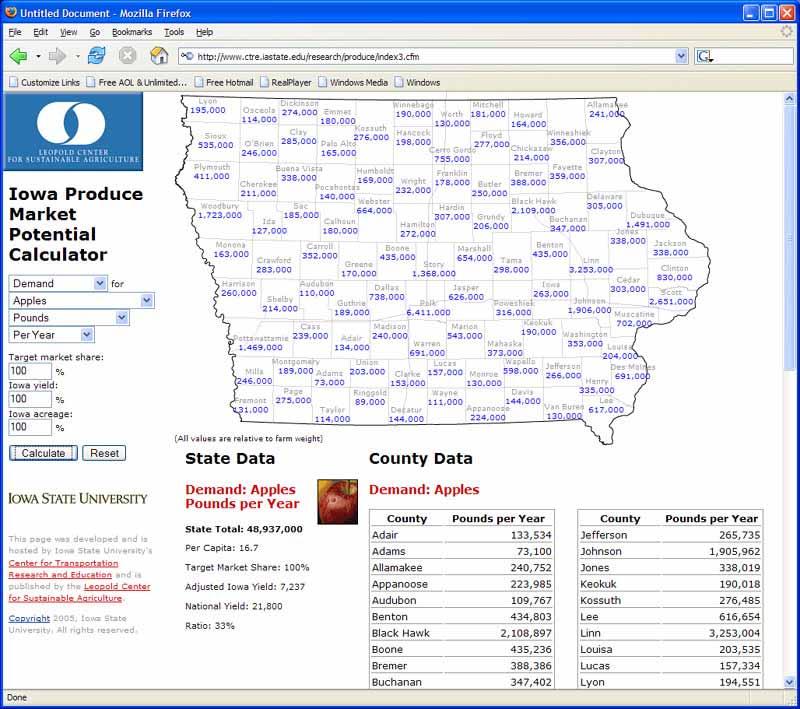
27 Iowa Produce Market Potential Calculator Uses national per capita consumption data USDA Ag Census and other production data Compares supply and demand Makes assumptions that markets are local and regional (these assumptions don t work for California, Texas, Florida for many of their produce items).
28 Iowa Produce Market Potential Calculator A market discovery tool for farmers A transportation/logistics tool for farmers, distributors, retailers An economic impact tool for local food groups
29
30 Scenario Twenty-five percent of 37 selected fruits and vegetables consumed in the state over a calendar year are grown by Iowa farmers Apples, Apricots, Asparagus, Beans (Snap),Blackberries, Blueberries, Broccoli, Cabbage, Cantaloupes, Carrots, Cauliflower, Cherries, Cucumbers, Eggplant, Garlic, Grapes, Greens/Collards, Lettuce (Head), Lettuce (Leaf), Nectarines, Okra, Onions, Peaches, Pears, Peppers s (Bell), Plums, Potatoes (Fresh), Potatoes (Sweet), Pumpkins, Radishes, Raspberries, Spinach, Squash, Strawberries, Sweet Corn, Tomatoes, Watermelons
31 Assumptions Increased production in fruits and vegetables will reduce corn and soybean production All new fruit and vegetable sales would be farmer to consumer (direct-market) sales Existing food store retail sales (actually retail margins) will be reduced by an amount proportionate to coincide with the new direct market sales All of the production to meet this goal of 25 percent is for in-state consumption
32 Baseline Values Scenario 1 Fruits Vegetables Total Farm Pounds 31,903, ,976, ,879,831 Farm Acres 4,881 10,508 15,389 Farm Receipts 8,921,120 28,149,128 37,070,249 Retail Pounds 26,450, ,047, ,498,306 Gross Retail Receipts 31,217, ,322, ,539,699 Retail Margin Offset (8,584,678) (28,963,738) (37,548,416) Corn Offset (785,053) (1,690,176) (2,475,228) Soybean Offset (486,896) (1,048,260) (1,535,155) Direct Marketing Output 22,295,891 77,173,559 99,469,451
33 Modeling Data Inputs Farm Pounds Farm Receipts Farm Acres Retail Pounds Retail Receipts Corn and soybean offsets
34 Modeling Foundations Iowa Produce Market Potential Calculator IMPLAN,, as modified for this assessment. IMPLAN is an I-O I O model that tracks the purchases and sales of goods between industries, businesses, and final consumers Census of Agriculture
35 Some definitions in the model Total output gross sales Labor income wages/salaries, cash-like benefits, as well as returns to labor and management Jobs number of positions in a sector Direct initial set of expenditures or production changes Indirect value of supplies and services purchases by Direct industry Induced workers in the Direct industry take their labor incomes and convert them into household-level level purchases Multiplier Quotient of the total economic values divided by the direct values
36 Fruit and Vegetable Farming Direct Indirect Induced Total Total Multiplier Total Industrial Output 37,070,248 9,007,737 9,515,237 55,593, Labor Income 9,629,401 3,319,123 3,056,805 16,005, Jobs Grain and Soybean Offset Direct Indirect Induced Total Total Multiplier Total Industrial Output (4,010,383) (1,261,203) (1,134,362) (6,405,948) 1.60 Labor Income (1,107,308) (406,059) (364,417) (1,877,784) 1.70 Jobs (41.8) (14.3) (14.3) (70.5) 1.69
37 Direct Marketing Direct Indirect Induced Total Total Multiplier Total Industrial Output 99,469,448 25,760,500 42,646, ,876, Labor Income 49,492,352 8,566,843 13,700,431 71,759, Jobs 2, , Retail Offset Direct Indirect Induced Total Total Multiplier Total Industrial Output (37,548,416) (5,848,227) (13,716,190) (57,112,831) 1.52 Labor Income (17,431,646) (2,049,468) (4,406,414) (23,887,528) 1.37 Jobs (933.9) (65.3) (172.9) (1,172.1) 1.26
38 Total Economic Effects Direct Indirect Induced Total Total Industrial Output (Sales) 94,980,897 27,658,807 37,311, ,951,155 Labor Income 40,582,799 9,430,439 11,986,405 61,999,644 Jobs 1, ,325.8 Total Economic Effects Accounting for All Existing Statewide Production Direct Indirect Induced Total Total Industrial Output 83,090,335 24,192,384 32,615, ,898,402 Labor Income 35,467,985 8,250,353 10,477,877 54,196,216 Jobs 1, ,031.5
39 Cautions Outputs (findings) are only as good as our inputs (data) IMPLAN and other input-output models make certain assumptions about the economy that may not totally apply to local/regional food enterprises This is a scenario the gap from current production levels to the scenario would require a significant investment in technical and financial resources Assumes that retail food stores and the traditional sources of production (California, Texas) would allow this to happen
40 For more information Web site: (Marketing web page) Phone: (515)