IN-FIELD PROFITABILITY ASSESSMENT. Analyses & Tools to Aid Profitable In-Field Outcomes Suzanne Fey Data Analyst
|
|
|
- Sherman Parsons
- 5 years ago
- Views:
Transcription


1 IN-FIELD PROFITABILITY ASSESSMENT Analyses & Tools to Aid Profitable In-Field Outcomes Suzanne Fey Data Analyst
2 Objectives 1. Talk about motivating factors and benefits of studying spatial variability at the field level. 2. Look at how we studied individual and aggregated field data and discuss what we found. 3. Present a few current fields of exploration and some farmer-friendly ISA Analytics tools to aid profitability.
3 Trend in the number of US farms and average size 7 years (-14,285 per year) -100,000 farms
4 Average commodity prices and input costs Average Corn Market Year Price ($/bu) vs. Est. Crop Production Costs in Iowa ($/bu) Avg. Soybean Market Year Price ($/bu) vs. Est. Crop Production Costs in Iowa ($/bu) $15.00 $15.00 $14.40 $13.50 $12.00 $13.50 $12.00 $12.60 $13.10 $10.50 $9.00 $10.50 $9.00 $10.50 $10.20 $9.52 $11.20 $9.96 $8.91 $9.34 $9.19 $7.50 $6.92 $7.50 $6.00 $4.50 $3.00 $6.20 $5.10 $4.94 $5.03 $5.23 $4.97 $4.93 $4.50 $4.63 $4.17 $4.32 $3.89 $4.08 $3.87 $4.23 $4.31 $4.29 $4.23 $4.29 $4.49 $3.99 $3.53 $4.10 $3.48 $3.40 $3.51 $3.59 $3.71 $2.96 $3.52 $3.35 $3.00 $6.00 $4.50 $3.00 $6.73 $7.79 $9.81 $8.67 $9.45 $10.92 $10.95 $11.13 $10.96 $10.67 $9.66 $1.50 $1.50 $ Production Cost Cn/Cn Production Cost Cn/Sb Sale Price Corn $ Production Cost Soybean Sale Price Soybean Iowa State University Extension and Outreach-(price source: USDA, NASS)
5 Farming is largely about risk management Farmers have limited control over key factors that significantly drive profitability: üinput costs what and how much to apply ümarket prices what to grow, when and how much to sell üweather when to plant, when to fertilize/protect against pests
6 Why study spatial variability in profit? q Although costs may be uniform across a field, yields are not, therefore average costs don t usually represent actual individual per bushel costs. q Even costs applied variably across a field won t necessarily produce uniform per-bushel costs.


 500")


7 Example: Yield compared to profit Normal Rainfall Wet Spring, Dry Summer Wet June, Dry July $1.85/bu $.52/bu $1.33/bu Profit ($ac) Field Profit $72,980 Field Profit -$25,600 Field Profit -$378 Avg. Yield 191bu/ac Avg. Yield 148 bu/ac Avg. Yield 225 bu/ac +34

8 550 site-years from 144 fields 42 Farmers
9 Data collection methodology Each field is represented by an average of 4 years of spatial yield data from between 2007 and Some fields had as many as 8 consecutive years of data. Farmer yield files and ISU annual Estimated Costs of Production were uploaded into the Profit Zone Manager tool, AgSolver, Inc.
10 Three spatial profitability measurements Mean Profit Return on Investment Standard Deviation Profit ($ac) ROI (%) Std. Dev. ($/ac) ROI Net Profit/Cost of Investment * 100


11 Profitability zones Northwest Iowa field Profit ($ac) Sb 2012 Cn 2014 Cn Std. Dev. ($/ac) ROI ($ac) Mean Profit Return on Investment Standard Deviation

12 Spatial data prepared for analyses Divided spatial profitability and ROI files into 10 x 10m cells. Added farmer management and 40+ soil and weather variables from publicly available sources to each cell. The average field in the study contains over 19,000 cells.
13 Central Iowa Des Moines Lobe 270 site years, 52 fields, 13 farmers
14 Eastern Iowa Iowan Surface 111 site years, 25 fields, 8 farmers

15 Count of cells with positive and negative profit Count of 10 X 10 m Cells 2007 Des Moines Lobe Soybean Corn after Soybean Corn after Corn Histograms help to illustrate relative differences and long term patterns Profit Value ($/ac)


 -400-200 0 200 400-400")
 Profit Value")


 ($/ac)")
16 Des Moines Lobe temporal variation Within-Field Profit Soybean Corn after Soybean Corn after Corn Profit Value ($/ac) Profit Value ($/ac) Profit Value ($/ac) Profit Value ($/ac) Bi-modal shape in some years indicates no single factor is responsible for profitability Profit Value ($/ac) Profit Value ($/ac) Profit Value ($/ac) Profit Value ($/ac)


 2011 2012")
")

17 Eastern Iowa temporal variation Within-Field Profit Soybean Corn after Soybean Corn after Corn Profit Value ($/ac) Profit Value ($/ac) Profit Value ($/ac) Profit Value ($/ac) Profit Value ($/ac) Profit Value ($/ac) Profit Value ($/ac) Profit Value ($/ac)

18 Factors driving spatial variability in mean profit Corn Suitability Rating values and profit 7 years of yield and management data Mean Profit Value CSR >80: $211.84/acre CSR 75-80: $150.21/acre CSR <75: $50.21/acre CSR explained ~25% of the variability in profit

19 Factors driving standard deviation in profit Multi-year std. dev. in profit Std. Dev. ($/ac) Multi-year std. dev. in profit C-S-R >80: $119.35/acre C-S-R 75-80: $148.59/acre C-S-R <75: $194.29/acre Variability tended to be high for low production areas. CSR explained ~25% of the variability in Standard Deviation


20 Factors driving spatial variability in profit 5 Years of yield and management data CSR explained ~16% of the variability in profit CSR >50: $28.91/acre CSR 35-50: -$52.61/acre CSR <35: -$102.26/acre Drainage explained ~22% of the variability in profit EXCESS: -$81.01 WELL: $68.86 POOR: $44.81 VERY POOR: -$ Soil Organic Matter explained ~15% of the variability in profit SOM > 3%: $44.81 SOM 2 to 3%: $39.23 SOM <2%: -$81.93
 500 400 300 200 100 0-100 -200-300 -400-500 Central Iowa Field Eastern Iowa Field")


21 Can we explain variability in spatial profit? Profit ($ac) Central Iowa Field Eastern Iowa Field In a multi-year profit analysis, no significant correlation to any of the selected variables appeared in the majority of 12 fields. 12 fields with yield from multiple years in Central and Eastern Iowa were studied for patterns in the impact of spatial variability in profit from: SOM Elevation Slope CSR Drainage Soil Types Spatial variability could not be explained by one or two individual factors in the majority of fields.
22 Trend identification through aggregation ØAggregating fields makes it possible to quantify effects less easily identified using individual fields. ØResults of quantifying aggregated data can then be usefully applied to individuals within the group. ØThrough aggregation, we examined the effect of weather on soils by crop rotation.
23 Central Iowa Des Moines Lobe 270 site years, 52 fields, 13 farmers

24 2013 NAIP imagery of fields with potholes Pothole areas - remnants of glacial activity

 Std. Dev.")

 Multi-Year ROI (%)")
 500 450 400 350 300")
25 Potholes are revealed on profitability maps Profit ($/ac) Std. Dev. ($/ac) Multi-Year Average Profit ($/acre) Multi-Year ROI (%) Multi-Year Std. Dev. ($/acre)
26 Effect of rainfall pothole areas only Soybean Corn after Soybean Corn after Corn May June Soybean fields (planted later) were unaffected by May rainfall and less affected by June rainfall.
 Corn after Soybean More profitable than Soybean in normal spring.")
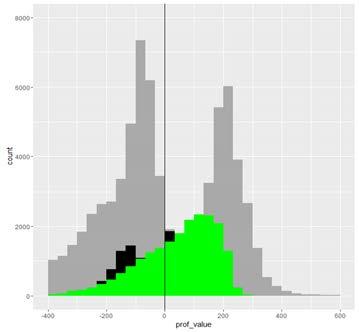
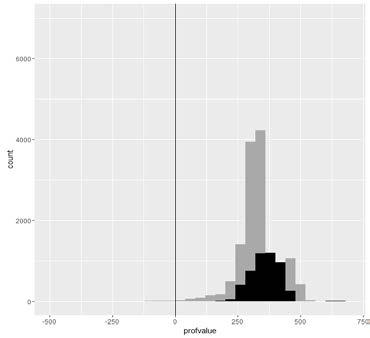
27 Wet and normal spring: pothole vs. upland areas Soybean Still largely profitable even in pothole areas in wet spring. A more vertical slope indicates less noise, which indicates less risk. Wet Spring: Potholes Upland Probability Field Level Population Profit ($/acre) Corn after Soybean More profitable than Soybean in normal spring. Normal Spring: Potholes Upland Corn after Corn More profitable in normal spring but not profitable in pothole areas in wet spring.

28 Eastern Iowa Iowan Surface 111 site years, 25 fields, 8 farmers

29 Iowan Surface: soil drainage effect All Crops Poorly Drained Well Drained Excessively Drained Slightly larger variability in poorly and excessively drained soils Profit Value ($/ac)
30 Eastern Iowa rainfall effect Soybean Corn after Soybean Corn after Corn Spring July Soybean fields were unaffected by Spring rainfall and less affected by July rainfall.
31 Eastern Iowa soil drainage Excess Well Poor Soybean Soybean is less affected by rainfall, but excessive drainage has more negative impact on profitability Probability Corn after Soybean Corn fields were less affected by excessive drainage Corn after Corn Corn fields were more profitable and less affected by excessive drainage than soybean
32 Key points 1. Spatial profitability comparisons quantify the temporal effects of management, weather, and soil. 2. Multi-year spatial data is valuable in detecting in-field patterns in spatial profitability even when no single factor correlations appear. 3. Aggregated field-level data can provide big-picture observations applicable at the individual field level. 4. When production costs exceed market price and weather is unpredictable, in-field knowledge helps farmers manage profitability.
33 ISA tools & projects to improve in-field profitability 1. Fungicide Economic Calculator (launched 2011) 2. Risk of Late-Season Nitrogen Deficiency Calculator (launched 2014) 3. Calibrate Agronomic Modeling of Cover Crops and Nitrogen (10:45 AM, room 314) 4. ISA On-Farm Trial Summarization Tool (launch 2018) (1:00 PM, room 314) 5. Study Aerial Imagery s accuracy to detect Nitrogen Stress (2:15 PM, room 314)
34 Fungicide Economic Calculator bu/acre 43% $-2.80 $/ac. From $ to $14.78 $/ac. 1 out of 7 years. * Based on the 7-year median yield increase of 2.4 bu/acre across all trials when March through Spring rainfall was more than 12 inches.


35 Late-Season Nitrogen Deficiency Calculator Daily, in-season May-June rainfall updates recalculate probability of N loss by practice. Risk table compliments graphic display. Map shows deviation from long-term rainfall.


36 ISA On-Farm Trial Summarization Aggregating historical trial and scouting results with site-specific data.


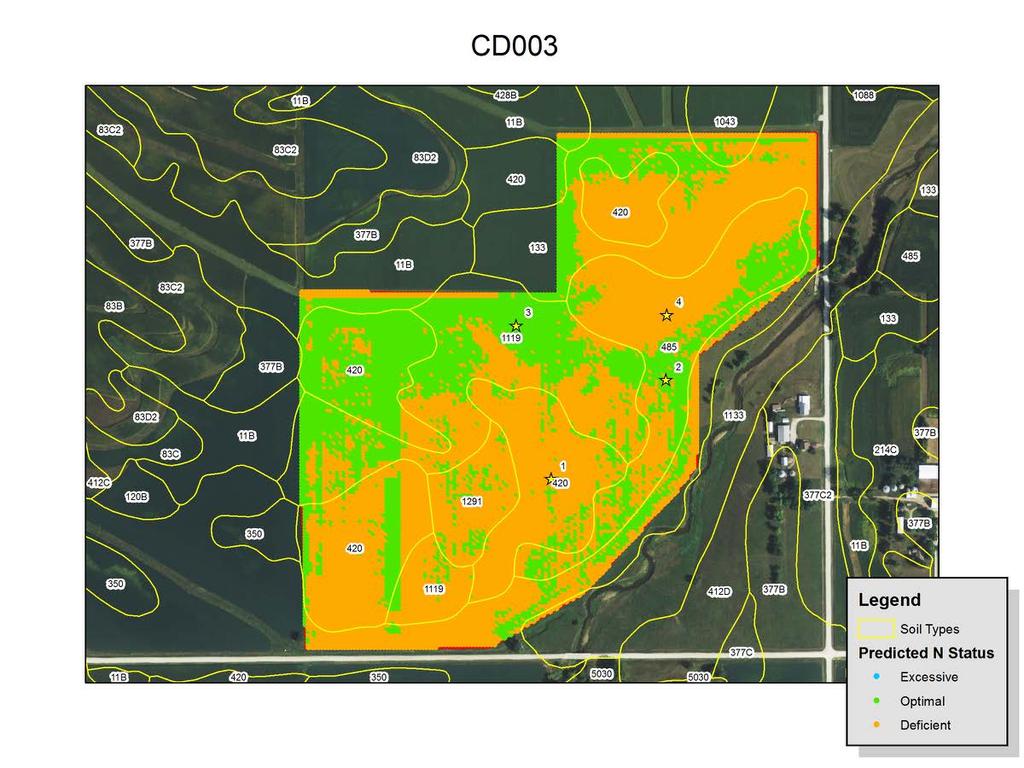

37 June - Harvest aerial imagery and late season ground-truthing To develop predictive analytics for late season nitrogen stress detection.


38 Modeled soil mineral N and rainfall Modeling to estimate field-specific N loss reduction potential of cover crops.
39 How can farmers assess and improve economic return? vgo to iasoybeans.com/programs/isa-research/get-informed/tools/ ØTrack in-season probability of N loss due to rainfall ØAccess the Fungicide Calculator ØTry out the new Strip Trial Summarization tool vparticipate in studies to assess to explore the economic and environmental impacts of cover crops and commercial products. vconsider spatial analyses of in-field profitability to guide sustainable land use.
40 Acknowledgments Most of all our Iowa soybean farmers AgSolver, Inc., technical staff, field specialists, and business staff Iowa Soybean Association On-Farm Network and Environmental Programs & Services Dr. Peter Kyveryga