2016 Risk and Profit Conference General Session Speakers. GENERAL SESSION IV Grain Market Situation and Outlook
|
|
|
- Domenic Barber
- 5 years ago
- Views:
Transcription

1 2016 Risk and Profit Conference General Session Speakers GENERAL SESSION IV Grain Market Situation and Outlook Dan O Brien, Kansas State University Daniel O Brien was raised on a grain and livestock farm in south central Nebraska. He received bachelors and masters degrees in Agricultural Economics from the University of Nebraska-Lincoln. After completing his Ph.D. at Iowa State, he worked as the Extension Agricultural Economist at the Northwest Research and Extension Center in Colby and was Northwest Area Extension Administrative Director starting in 2003 before returning to his Extension Agricultural Economist position in January His ongoing extension and applied research interests and efforts are in the areas of a) grain market supply-demand analysis, bioenergy impacts and risk management strategies, b) grain industry market structure, conduct and performance focusing on grain handling and transportation issues, and c) economic analysis of irrigated and dryland cropping systems, and associated cropland leasing arrangements. Abstract/Summary The focus of this Grain Market Outlook for session will be on key supply-demand factors that are driving U.S. and Kansas corn, grain sorghum, wheat, and soybean markets at this current time and the likelihood of alternative market supply-demand and price outcomes for major 2016 Kansas crops over the next months. Key issues addressed will include: a) the time periods and seasonal market factors to be aware of in making grain marketing decisions for current year 2016 and next year's 2017 crops; b) the magnitude of changes in World wheat, feedgrain, and soybean supplydemand that would have to happen to cause a recovery to occur in the U.S. grain market prices; c) the degree and length of time that large stocks of grains in Kansas elevators are likely to impact Kansas cash grain markets especially local grain basis levels; and d) the crop revenue outlook for major Kansas crops in the 2016/17 marketing year.
 Marketing the remaining 2016 Wheat & Other Crops 2) Marketing 2016 Fall Crops: Harvest vs Post-harvest sales 3) Storing & Handling of 2016 Crops into 2017 4) Crop")
2 Grain Market Outlook & Strategies for KSU Risk & Profit Conference, Manhattan, Kansas DANIEL O BRIEN EXTENSION AGRICULTURAL ECONOMIST Key Grain Market Decisions & Issues for Kansas Farmers & Agribusinesses 1) Marketing the remaining 2016 Wheat & Other Crops 2) Marketing 2016 Fall Crops: Harvest vs Post-harvest sales 3) Storing & Handling of 2016 Crops into ) Crop production plans for 2017 Prices & profitability? Planted Acres? Crop inputs? Storage availability in ?
3 Topics to be discussed.. 1) The Overall Grain Market Situation Kansas, U.S., & World 2) Currency Exchange Rate impacts on U.S. Grain Exports 3) Market Outlook for Corn, Sorghum, Wheat & Soybeans 4) Market Risks & Opportunities What is expected to happen in & what could change (& when) U.S. Dollar Index (ICE Futures) Monthly Chart: June 2007 July /18/ SEPT on 8/18/2016


4 Brazil Reals to One U.S. Dollar - Monthly U.S. Competitor in World Corn & Soybean Export Trade Euro & Australia Currency per U.S. Dollar U.S. Competitors in World Wheat Export Trade


5 Canada & Mexico Exchange Rates - Monthly U.S. NAFTA Partners (with Canada Wheat Exports) China Currency per U.S. Dollar - Monthly Key Buyer in World Soybean & Feedgrain Trade


6 Corn & Sorghum Markets CME Corn Futures Weekly Chart: June 2007 July /18/2016 SEPT 2016 $3.32 ½ 8/18/2016 $2.90 $3.18 ¼ $3.46 ¾ $3.32

7 Corn Basis Salina, Kansas Weekly: Calendar Years 2012 through 2016 Corn Basis Garden City, Kansas Weekly: Calendar Years 2012 through 2016
8 Sorghum Basis Salina, Kansas Weekly: Calendar Years 2012 through 2016

9 Sorghum Basis Garden City, Kansas Weekly: Calendar Years 2012 through 2016
10 Corn Cash & Futures Prices - Salina Salina, Kansas Local Elevators - August 18, 2016 Price $/bu $7.00 $6.00 $5.00 $4.00 $3.00 $2.00 $1.00 $0.00 $3.33 $3.42 $3.52 $3.59 $3.66 $2.78 $2.92 $2.49 $2.69 $ /mo $ /mo $ /mo $ /mo $2.05 $2.05 Futures Low Cash/FC$ High Cash/FC$ Mktg Loan Corn Cash & Futures Prices Garden City Garden City, Kansas Local Elevators - August 18, 2016 Price $/bu $7.00 $6.00 $5.00 $4.00 $3.00 $2.00 $1.00 $0.00 $2.95 $3.33 $3.42 $3.52 $3.59 $3.66 $3.06 $3.00 $ /mo $ /mo $ /mo $ /mo $2.98 $2.19 $2.19 Futures Low Cash/FC$ High Cash/FC$ Mktg Loan


11 Kansas Corn Seasonal Cash $ Index Monthly Prices: 1999/ /15 + Forecast MY 2016/17 Sorghum Cash & Corn Futures Salina Salina, Kansas Local Elevators August 18, 2016 Price $/bu $7.00 $6.00 $5.00 $4.00 $3.00 $2.00 $1.00 $0.00 $3.33 $3.42 $3.52 $3.59 $3.66 $2.63 $2.72 $2.26 $ /mo $ /mo $ /mo $ /mo $2.59 $1.90 $1.90 Futures Low Cash/FC$ High Cash/FC$ Mktg Loan

12 Sorghum Cash & Corn Futures Garden City Garden City, Kansas Local Elevators August 18, 2016 Price $/bu $7.00 $6.00 $5.00 $4.00 $3.00 $2.00 $1.00 $0.00 $3.32 $3.42 $3.52 $3.66 $3.66 $2.62 $2.72 $2.29 $ /mo $ /mo $ /mo $ /mo $2.59 $1.90 $1.90 Futures Low Cash/FC$ High Cash/FC$ Mktg Loan U.S. Corn Acreage


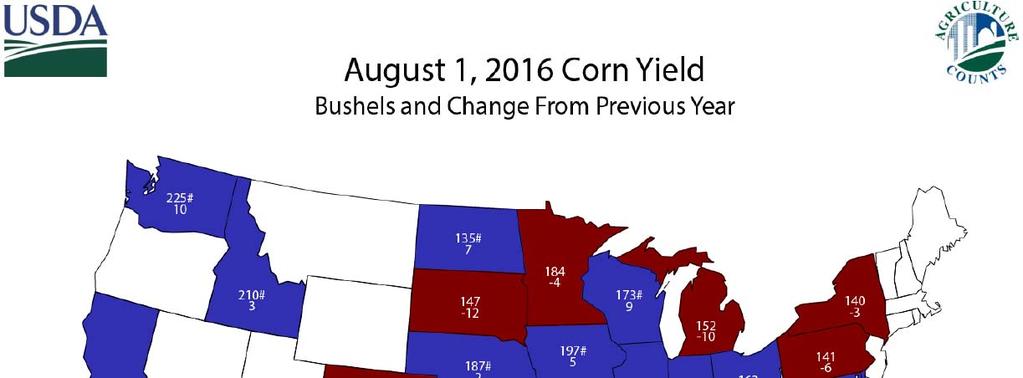

13 U.S. Corn Yields USDA 2016 USDA Forecast = 175.1

14 U.S. Corn Production & Supplies


15 U.S. Corn Use By Category U.S. Ethanol Production & Corn Use

16 U.S. Corn Use - With DDGS #s U.S. Corn Ending Stocks & % Stx/Use % End Stocks-to-Use , , ,731 1, ,409 5,000 4,000 3,000 2,000 1,000 0 Million Bushels Marketing Year


17 U.S. Corn % Stocks/Use vs Price$ U.S. Corn Price$ vs U.S. % Stocks-to-Use MY 1973/74 through New Crop MY 2016/17
")

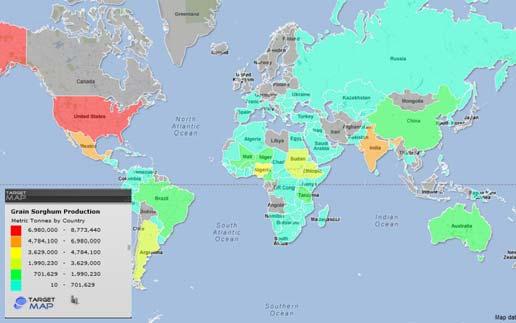
18 World Corn (Maize) Production Regions World Corn Supply, Use & Stocks

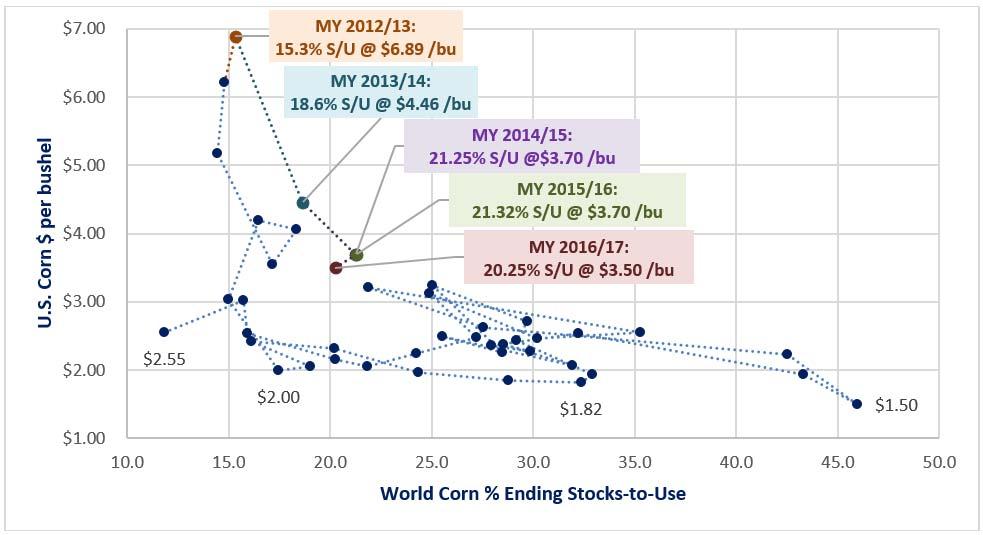
19 U.S. Corn Price$ vs World % Stocks-to-Use MY 1973/74 through New Crop MY 2016/17


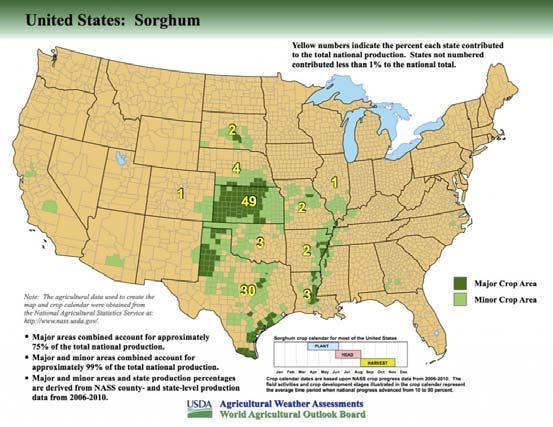
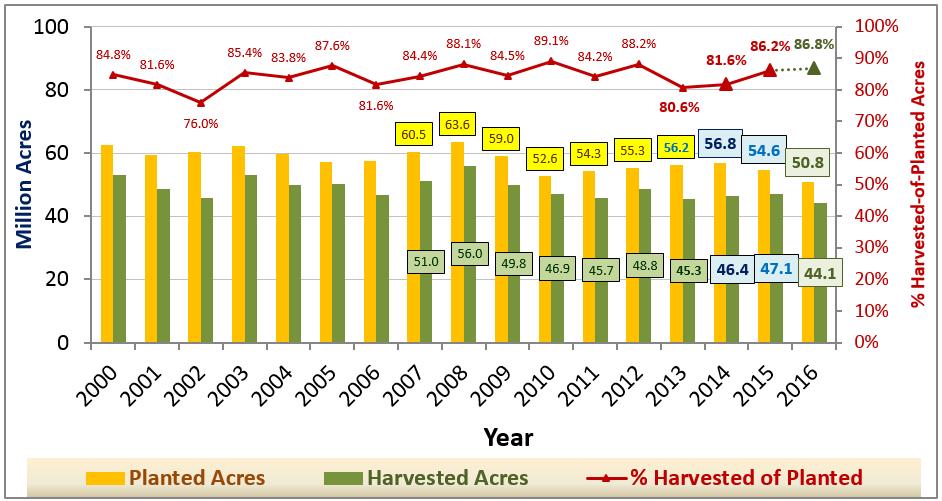
20 U.S. Sorghum Acreage U.S. Sorghum Yields USDA 2016 USDA Forecast = 67.3


21 U.S. Sorghum Production & Supplies U.S. Sorghum Use By Category
 o Corn Ethanol 2016/17 = 5.275 bln bu (record high vs 5.200 bb last 2 yrs) o Other FSI 2016/17 = 1.")
22 U.S. Sorghum & Corn % Stks/Use vs Sorghum $ U.S. Feedgrain Market Prospects: Low Prices helping Use, but Large Supplies limiting Record large World & U.S. feedgrain supplies Low Corn Prices have supported U.S. domestic use o Livestock Feed 2016/17 = bln bu (9 year high vs bb in 2007/08) o Corn Ethanol 2016/17 = bln bu (record high vs bb last 2 yrs) o Other FSI 2016/17 = bln bu (4 year high vs bb in 2011/12) o Exports 2016/17 = bln bu (9 year high vs bb in 2007/08) o Sorghum exports built demand from China run


23 World Coarse Grain Production Million Metric Tons MY 2014/15 MY 2015/16 MY 2016/17


24 Coarse Grain Exporters Million Metric Tons ** Note Weak Currencies! ** MY 2014/15 MY 2015/16 MY 2016/17 Coarse Grain Importers 50 Million Metric Tons No. Africa - Mdl. East China Japan South Korea Southeast Asia EU-28 Mexico Saudi Arabia Other MY 2014/15 MY 2015/16 MY 2016/17

25 World Coarse Grain Supply, Use & Stocks U.S. Sorghum Price$ vs World Coarse Grain % S/U MY 1973/74 through New Crop MY 2016/17


26 Wheat Markets CME Kansas Hard Red Winter Wheat Monthly Chart: June 2007 July /18/2016 SEPT 2016 $4.19 ¾ 8/18/2016 $6.01 $4.33 $4.59 $3.85 $4.18


27 Wheat Basis Salina, Kansas Weekly: Calendar Years 2012 through 2016 Wheat Basis Garden City, Kansas Weekly: Calendar Years 2012 through 2016

28 Wheat Cash & HRW Wheat Futures - Salina Salina, Kansas Local Elevators - August 18, 2016 Price $/bu $8.00 $7.00 $6.00 $5.00 $4.00 $3.00 $2.00 $3.03 $3.35 $4.20 $ /mo $ $ /mo $ /mo /mo $4.45 $4.61 $4.72 $4.82 $3.26 $3.26 $1.00 $0.00 Futures Low Cash/FC$ High Cash/FC$ Marketing Loan

29 Wheat Cash & HRW Wheat Futures Garden City, Kansas Local Elevators - August 18, 2016 Price $/bu $8.00 $7.00 $6.00 $5.00 $4.00 $3.00 $2.00 $2.95 $3.00 $4.20 $ /mo $ $ /mo $ /mo /mo $4.45 $4.61 $4.72 $4.82 $3.03 $3.03 $1.00 $0.00 Futures Low Cash/FC$ High Cash/FC$ Marketing Loan Kansas Wheat Seasonal Cash $ Index Monthly Prices: 1999/ /15 + New Crop MY 2016/27


30 U.S. Wheat Seeded Acreage U.S. Wheat Acreage


31 U.S. Wheat Yields Record High

32 U.S. Wheat Production & Supplies

33 U.S. Wheat Use by Category U.S. Wheat Ending Stocks & % Stx/Use % End Stocks-to-Use , ,000 3,500 3,000 2,500 2,000 1,500 1, Million Bushels Marketing Year

34 U.S. Wheat Ending Stocks & Prices U.S. Wheat Price vs U.S. Stocks-to-Use


35 World Wheat Production Regions


36 World Wheat Supply, Use & Stocks World Wheat Producers 200 Million Metric Tons MY 2014/15 MY 2015/16 MY 2016/17


37 World Wheat Exporters 50 ** Note Weak Currencies! ** Million Metric Tons MY 2014/15 MY 2015/16 MY 2016/17 World Wheat Importers Million Metric Tons North Africa 17 Middle East SE Asia Brazil EU-28 FSU-12 China Others MY 2014/15 MY 2015/16 MY 2016/
38 World Wheat Ending Stocks & % Stx/Use % Ending Stocks-to-Use Million Metric Tons Marketing Year U.S. Wheat Price ($) vs World %Stx/Use MY 1973/74 New Crop MY 2016/17
39 U.S. Wheat Market Prospects: Slow Exports, Large Stocks, & Weak Prices U.S. wheat exports are likely to remain weak until the high U.S. dollar &/or record World stocks situation changes U.S. Spring Wheat % protein & 62.2 lb test, 0.7% defects o Versus 14.2% protein, 61.4 lb test wt, 1.0% defects in 2015 U.S. HRW Wheat % protein, 60.6 lb test, 1.3% defects o Versus 12.3% protein, 59.3 lb test wt, 1.7% defects in 2015 U.S. SRW Wheat % protein & 57.9 lb test, 1.8% defects o Versus 9.9% protein, 56.9 lb test wt, 4.1% defects in 2015 World Wheat Market Prospects: Large Supplies A Buyer s Market Record World Supplies & Usage Forecast in 2016/17 o 4 consecutive record high World wheat crops Varying 2016/17 Crop Prospects by Country U.S., Australia, Russia, Kazakhstan, Arg., Canada, Pakistan, India E.U., N. Africa (with little change in Ukraine & China) World wheat exports to remain a buyer s market unless or until World supplies & stocks decline o U.S. & World Crop Uncertainty in 2016? (La Nina??)


40 Soybean Markets CME Soybean Futures Monthly Chart: June 2007 through July /18/2016 SEPT 2016 $ /18/2016 $10.30 $7.76 ¼ $8.53


41 Soybean Basis Salina, Kansas Weekly: Calendar Years 2012 through 2016 Soybean Basis Garden City, Kansas Weekly: Calendar Years 2012 through 2016

42 Soybean Cash & Futures Prices - Salina Salina, Kansas Local Elevators August 18, 2016 $ / bu $12 $9 $6 $3 $10.27 $10.08 $10.08 $10.01 $9.97 $9.97 $9.95 $9.30 $9.13 $9.06 $9.04 $5.01 $5.01 $0 Futures $s Low Cash/FC High Cash/FC Mktg Loan
43 Soybean Cash & Futures Prices Garden City, Kansas Local Elevators August 18, 2016 $ / bu $12 $9 $6 $3 $10.27 $10.08 $10.08 $10.01 $9.97 $9.97 $9.95 $9.28 $9.12 $9.04 $9.03 $4.84 $4.84 $0 Futures $s Low Cash/FC High Cash/FC Mktg Loan Kansas Soybean Seasonal Cash $ Index Monthly Prices: 1999/ /15 + New Crop MY 2016/27


44 U.S. Soybean Acreage U.S. Soybean Yields USDA 2016 = 48.9 bu/ac; 2016 Trend = 45.8


45 U.S. Soybean Production & Supplies U.S. Soybean Use & End Stocks


46 U.S. Soybean Ending Stocks & % Stx/Use % End Stocks-to-Use , Million Bushels Marketing Year U.S. Soybean % Stocks/Use vs Price$


47 U.S. Soybean $ vs U.S. Stx-to-Use MY 1973/74 through Next Crop MY 2016/17 World Soybean Supply, Use & Stocks


48 U.S. Soybean$ vs World %Stx/Use MY 1973/74 through New Crop MY 2015/16


49 Soybean Production 150 Million Metric Tons U.S. Brazil Argentina Paraguay China EU-28 Rest of World 2014/ / / Soybean Exporter Sales 75 Million Metric Tons U.S. Brazil Argentina Paraguay Rest of World 2014/ / /17

 o Exports 2016/17 = 1.9590 bln bu (record > 1.")
50 Soybean Importer Purchases % /yr 87 Million Metric Tons Chinese increase of 34.6 mmt in soybean imports over 6 years +0.7% /yr % /yr +2.4% /yr % /yr China EU-28 Japan Mexico Rest of World 30 Up 11.0 mmt over 6 years 2010/ / / / / / /17 U.S. Soybean Market Prospects: Strong Use & Exports, Large Stocks, & Weak Prices U.S. soybean exports in 2016/17 to remain historically large in spite of high U.S. Dollar o Depends on China import demand & 2017 South American crops Low Prices have supported U.S. Soybean Use o Crush 2016/17 = bln bu (record > bb in MY 2015/16) o Exports 2016/17 = bln bu (record > bb vs MY 2015/16) o Uncertainty re: 2017 South American soybean crop size


51 Questions? Daniel O Brien Extension Agricultural Economist Kansas State university dobrien@ksu.edu KSUGrains on Twitter & Facebook