Impact of climate change on disasters and agriculture in Bangladesh
|
|
|
- Hector Berry
- 5 years ago
- Views:
Transcription
1 Regional Conference on Climate Change: Challenges and Opportunities for South Asia Islamabad, Pakistan January 13 14, 2009 Impact of climate change on disasters and agriculture in Bangladesh Ahmadul Hassan Center for Environmental and Geographic Information Services (CEGIS) Bangladesh
 GDP (per capita): $397 (per person, 2006) Major Disasters Flood")
2 Bangladesh Total area 147,570 sq. km Population: million (2005) GDP (per capita): $397 (per person, 2006) Major Disasters Flood Cyclone/Tornado Drought Erosion

3 Disasters in Bangladesh Cyclone 16 coastal districts are vulnerable to Cyclone Total area: 42,500 km2 Total population: 31 million (BBS, 2001) History of major cyclones 1970 Storm Surge: 6-9 m Maximum Wind Speed: 223 km/hr Affected District: 5 Affected People: 1,100,000 No of Dead People: 470, Storm Surge: m Maximum Wind Speed: 225 km/hr Affected District:19 Affected People: 13,798,275 No of Dead People:138, Storm Surge: up to 10 m Maximum Wind Speed: up to 240 km/hr Affected District: 30 Affected People: 6,851,147 No of Dead People: 3,292 Total damage: BDT billion (US$ 1.7 billion) which is equivalent to 2.8% of Bangladesh s GDP(GOB, 2008)
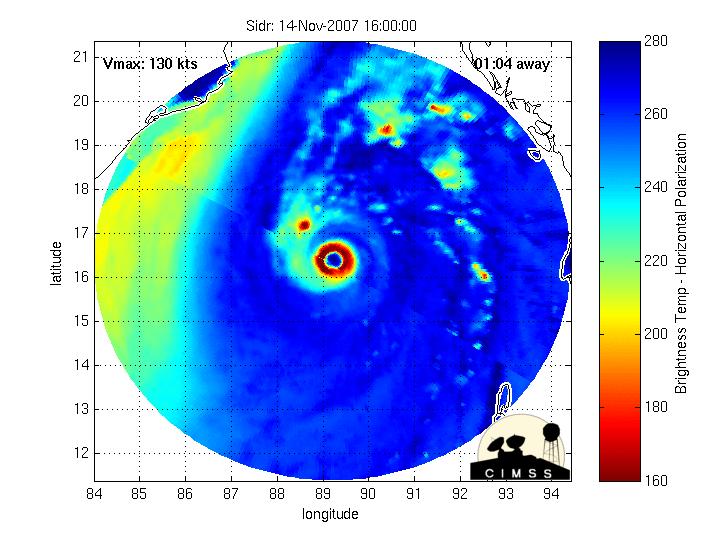
4 Cyclone Sidr Source:

5 Disasters in Bangladesh Flood Sources of Flood Upstream flow Increase in rainfall Unplanned urbanization Normally inundated area: 22%. inundated area (In Extreme floods like,1988): about 60%. Exposed population: Around 10 million Year District People Crops damaged Fully (Acre) Partially No. of House Fully damaged Partially No. of Dead People No. of Dead Livestock No. of Damaged Fully Institution Partially Road Damaged Fully Partially


6 Disasters in Bangladesh Flood Flooded Area: about 44,000 sq. km.
. T Aman is mainly exposed to draught.")
7 Disasters in Bangladesh Drought 19 droughts had occurred in Bangladesh during (Mirza and Paul, 1992). Typically affected About 47% area and 53% population are affected (Task Force, 1991). T Aman is mainly exposed to draught. Current trend: increase in area affected (6% in 28 years)
8 Flood classification and characteristics Value Meaning Value Meaning Onset >1 (moves Left) Early flood <1 (moves Right) Late flood Peak >1 (moves <1 (moves Above normal upward) downward) Below normal Duration >1 (moves Shorter Longer duration <1 (moves upward) downward) Duration Recession >1 (moves Delayed Quick <1 (moves Left) Right) Recession Recession Peak Onset -0.2 Recession Duration
9 Impact Assessment using Flood Classification Sector Thematic Onset Peak Recession Duration Aus - Agriculture Aman - Boro - + Fisheries Capture Culture - - Erosion Main River - + Regional River - +
 CCCmaA2 Flooded Area (%) North Central 32 32 29 North East 58 56 54 North West 24 18 12 South Central 18 16 16 South")
10 Predicted Impact Flooded area PRECISA2 Base Condition CCCmaA2 Hydrologic Region Time Period: Return Period: 1 in 2.33 year PRECISA2 Base ( ) CCCmaA2 Flooded Area (%) North Central North East North West South Central South East South West
11 Predicted impacts Change in Frequency Base( ) PRECISA2(2015 to 2035) 34 PRECISA2(2040 to 2060) Flooded Area (Percentage) CCCmaA2(2015 to 2035) CCCmaA2(2040 to 2060) CCCmaB2(2015 to 2035) CCCmaB2(2040 to 2060) CCSRNIESA2(2015 to 2035) CCSRNIESA2(2040 to 2060) For 1 in 50 years return period Max. Flooded Area: 36% (PRECIS_A2_2050s) Min. Flooded Area: 32.2% (CCSRNIES_A2_2025s) HadCM3A2(2015 to 2035) HadCM3A2(2040 to 2060) HadRM2(2015 to 2035) HadRM2(2040 to 2060) Return Period
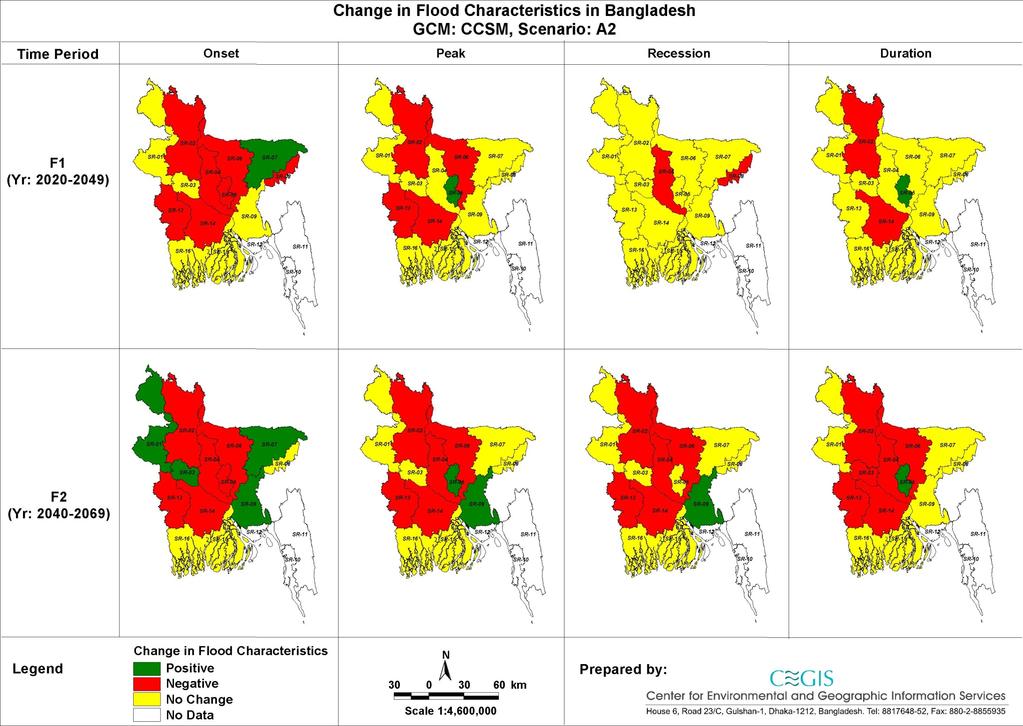
12 Changing Flooding Characteristics Brahmaputra Dependent Area Peak Peak Brahmaputra river on Bahadurabad Time Period: Brahmaputra river on Bahadurabad Time Period: Onset 0 Recession Onset -0.2 Recession Base Base Maximum of Minimum of Average of HadRM PRECISA2 Maximum of Minimum of Average of HadRM PRECISA2 Duration Duration Time period: Time period:
13 Changing Flooding Characteristics Ganges Dependent Area Peak 2 Peak Ganges river on Hardinge Bridge Time Period: Ganges river on Hardinge Bridge Time Period: Onset 0 Recession Onset 0 Recession Base Maximum of Minimum of Average of HadRM PRECISA2 Base Maximum of Minimum of Average of HadRM PRECISA2 Duration Time period: Duration Time period:
14 Changing Flooding Characteristics Meghna Dependent Area Peak 1.5 Peak Meghna river on Bhairab Bazar Time Period: Meghna river on Bhairab bazar Time Period: Onset 0 Recession Onset -0.2 Recession Base Maximum of Minimum of Average of HadRM PRECISA2 Base Maximum of Minimum of Average of HadRM PRECISA2 Duration Time period: Duration Time period:
15
16 Agricultural Production in Bangladesh Dependent Area Area (Sq Km) Aus Aman Boro Production ( 000 metric ton) Area (Sq Km) Production ( 000 metric ton) Area (Sq Km) Production ( 000 metric ton) Brahmaputra dependent area 1, ,314 1,303 7,443 2,622 Ganges dependent area 5, ,446 3,513 10,968 3,922 Meghna dependent area Other rivers dependent area 3, ,051 4,232 20,979 6, , , Total 10,258 1,500 52,799 9,819 40,639 13,817
 The total Aman (monsoon rice) Area is 4.")
17 Open water on all dates Seasonal open water Aman Agriculture Aman Rice Others Forest (Mangrove, Madhupur and Hill Tracts) The total Aman (monsoon rice) Area is million hectares (using RS).
 area is about 4.")
18 Agriculture Boro Rice The total Boro (winter rice) area is about 4.5 million hectares (CEGIS, 2008).
19 Yield t/ha Agriculture: Production Loss Aman : Bhairab Bazar y = -1E-05x R 2 = ,000 10,000 15,000 20,000 Discharge in 15 sep. Yield t/ha Boro: Bahadurabad y = -3E-06x R 2 = ,000 10,000 15,000 20,000 25,000 30,000 35,000 Boro Production Loss (%) Discharge 15 May Aman Production Loss (%) Model Location 2025s 2050s 2025s 2050s GCMmax Hardinge GCMmean Bridge GCMmin GCMmax Bahadurabad GCMmean GCMmin GCMmax Bhairab Bazar GCMmean GCMmin
20 Water Management Infrastructure Development Up to 1955 Up to 1998 Up to 1960 Up to 1965 Up to 1970 Up to 1995 Up to 1990 Up to 1985 Up to 1975 Up to 1980 Project Type No Area in Sq.Km Drainage Flood Control Flood Control & Drainage Flood Control Drainage/ Irrigation Irrigation & Drainage Irrigation Bank Protection B'desh Total There are about 10,000 km embankment of which 6400 km in non tidal areas And 3600 km in tidal areas
21 Water Management Infrastructures Changes in design return periods for embankments To provide same level of Safety Embankment s need to be raised around 30 cm Station Name Embankment Present Design Return Period Return Period due to climate change in 2050 Additional height need to raise (yr) (yr) m Hardinge Bridge Major River 1 in 50 1 in Regional River 1 in 30 1 in Bahadurabad Major River 1 in 50 1 in Regional River 1 in 30 1 in

 7,000 6,000 5,000")

22 River Bank Erosion Brahmaputra/Jamuna River Right bank Left bank Present Erosion: 2200 ha => 20,000 people permanently displaced every year. Brahmaputra-Jamuna River 8,000 Annual erosion (ha) 7,000 6,000 5,000 4,000 3,000 2,000 1,000 - y = e 2E-05x R 2 = ,000 40,000 60,000 80, , ,000 Max. Discharge (m 3 /s) CC impacts: 10% increase in extreme flood resutls 20% increase in erosion
23 Conclusion Climate change is causing increased frequency of Disasters like Flood, Cyclone, Drought, Erosion etc. These are ultimately impacting on Food security and Livelihoods of the people.
24 Thank You