Markets as incentives for sustainable models of on farm diversity in production systems Lessons from sub-tropical fruits from India
|
|
|
- Sophia Perkins
- 5 years ago
- Views:
Transcription


1 Markets as incentives for sustainable models of on farm diversity in production systems Lessons from sub-tropical fruits from India

2 TFT Diversity status CROP WISE AREA UNDER MAJOR FRUITS IN INDIA MANGO 50% APPLE 8% BANANA 16% LITCHI 2% GUAVAGRAPES 5% 1% CITRUS 18% PRODUCTION SHARE OF MAJOR FRUITS IN INDIA OTHERS 20% APPLE 2% BANANA 37% MANGO 23% LITC HI 1% GUAVA 4% GRAPES 3% CITRUS 10 %
3 Status of area and production of important fruits in India Area Production Productivity Highest productivity Crop ( 000 ha) ( 000 t) (t / ha) in India (t /ha) Apple ( J & K) Banana (Mah) Citrus (Kar) Grape (Mah) Guava (Chat) Litchi (Bih) Mango (U.P.) Papaya (T.N.) Pineapple (Kar) Pomegranate (Kar) Sapota (T.N.)
4 Status of diversity of TFT in India Fruit name Intra specific / Inter generic diversity No. of cultivars In active commercial cultivation Remarks Mango Intra specific 30 Largest producer with well developed markets for Citrus Inter specific 25 conservation Grape Inter specific 20 and above through utilisation Banana Intra specific 9 Litchi Intra specific 33 Absence of efforts
5 Contributing factors for agri-biodiversity maintenance Production oriented Market oriented Agro-climatic suitability multi layered cropping / specific crop Season of availability mixed orchards, orchards with intercrops Diversified utility table types, processing types Technological tissue culture, grafting etc., Consumer preference varietal preference price advantage premium price Institutional support specialized/ exclusive market infrastructure Favorable policy incentives for exports, special emphasis


6 Diversity of TFT Intra specific; inter specific

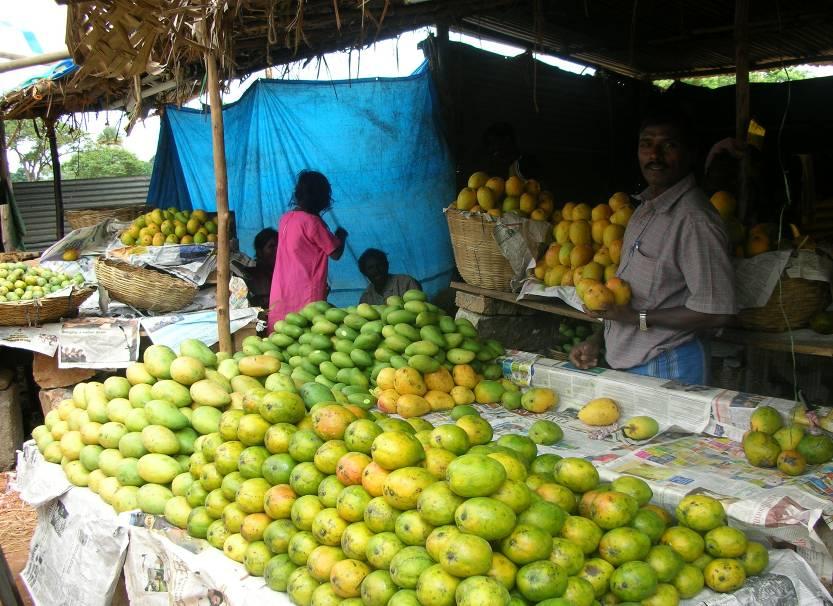
7 Diversity of Mango in India
 and Totapuri from South (Chittoor in Andhra Pradesh) are main sources of mango pulp for export and domestic use.")
8 Distribution of Diversity of the Mango Chittoor has ha, with t production, 70% is from totapuri, houses over 47 semiprocessing units Alphanso from West (Ratnagiri from Maharashtra) and Totapuri from South (Chittoor in Andhra Pradesh) are main sources of mango pulp for export and domestic use. Mango
9 Case Study : Mango Trend of mango pulp export quantity and value from india Farmers maintain about ten varieties on farm. While totapuri accounts for 50 % of the farm area, others like neelam, beneshan and badami also hold significant farm area Totapuri is mainly processed Export of mango pulp recorded a growth of 2 % per annum. Of the total Rs million earned, 50 % is from totapuri Different varieties are grown for different purposes. Neelam being late fetches a premium price Q u a n tity ( M t) years V alue R s. lakhs Quantity Value
10 Mango Diversity on Farm 6.00 Benishan 10% Badami 10% Dasheri 5% Local 5% Totapuri 50% Num ber of varieties Total Per acre Neelam 20% Cluster landholding mango Proportion of varieties/farm Distribution of diversity across farms


11 Mango market chain Producer Pre-harvest contractor Product flow: fresh processed Information & monetary flow: Wholesaler / commission agent Retailer Consumer Semi-processor Processor Exporter Source: own data Number of players Pre Harvest Contractor is the most prominent player Wholesaler/ Commission agent dominant actor Information flow is weak across the chain
12 Alternate Marketing Channels Fresh sale all mango Producer (P) -Pre Harvest Contractor (PHC)- Wholesaler/commission agent (WS/CA) Retailer (R) Consumer (C) : >60 % P PHC Co-operative market R C : 15 % P WS /CA- R- C : 15 % P C : 5% P Exporter Foreign market : 1% Sale for processing Producer (P) -Pre Harvest Contractor (PHC)- Wholesaler/commission agent (WS/CA) processor- Retailer (R)- Consumer (C) : >40 % P Processor ( Semiprocessing) Exporter Foreign market : 40 % Semi-processing Small- scale, Canning units, Three months in a year Custom processing, raw material and packing material provided by the buyer, Rs. 2250/t for converting to pulp. Sell to big processors or exporters
13 Costs and Margins in Fresh Vs Processed sales Costs and margins of mango fresh Vs processing sale Farmer Processed (Totapuri) Fresh (Neelam) 20 Net gain Costs 17.8% 14.8% 22.9% 7.4% Value ( R s/k g) P/R margin P/R cost Ws margin WS cost PHC Margin Costs WS Margin 15.2% 9.1% 8% 10.8% 4.5% 14% 0 Processing sale Fresh sale PHCs margin PHCs cost Farmers margin Farmers cost Costs Pro/ret Margin Costs 8% 4.9% 22% 3.5% 21% 16%
14 Contribution to Farm Income Percentage in total 70% 60% 50% 40% 30% 20% 10% 0% 60% 59% 49% 37% 33% 20% 10% 9% 1% 2% 5% 3% 4% 5% 3% Totapuri Neelam Malgova Banganpalli Others Nr of trees Yield Gross returns
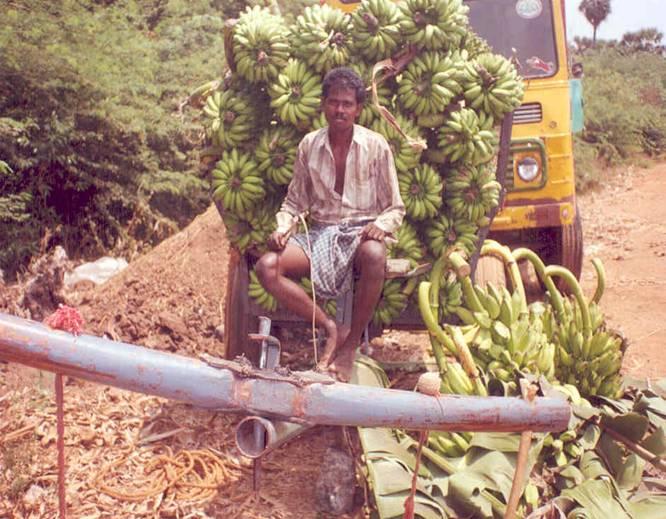
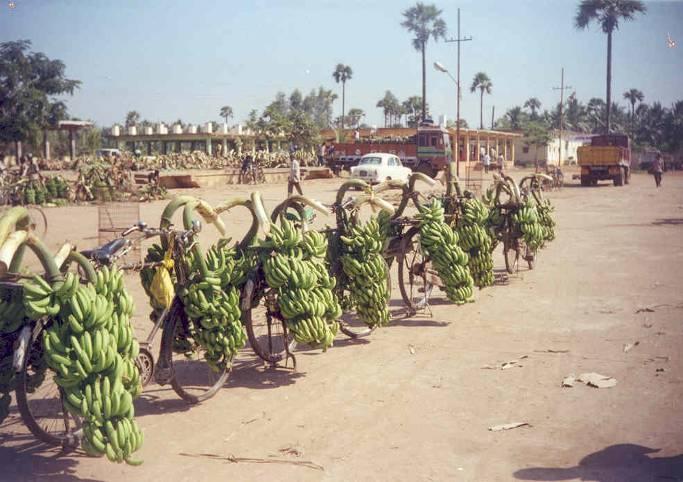
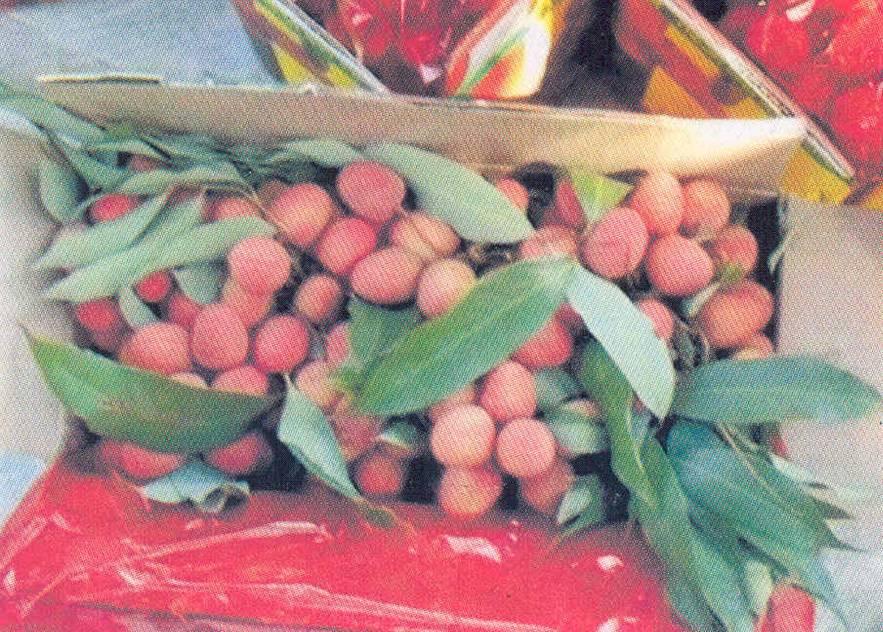
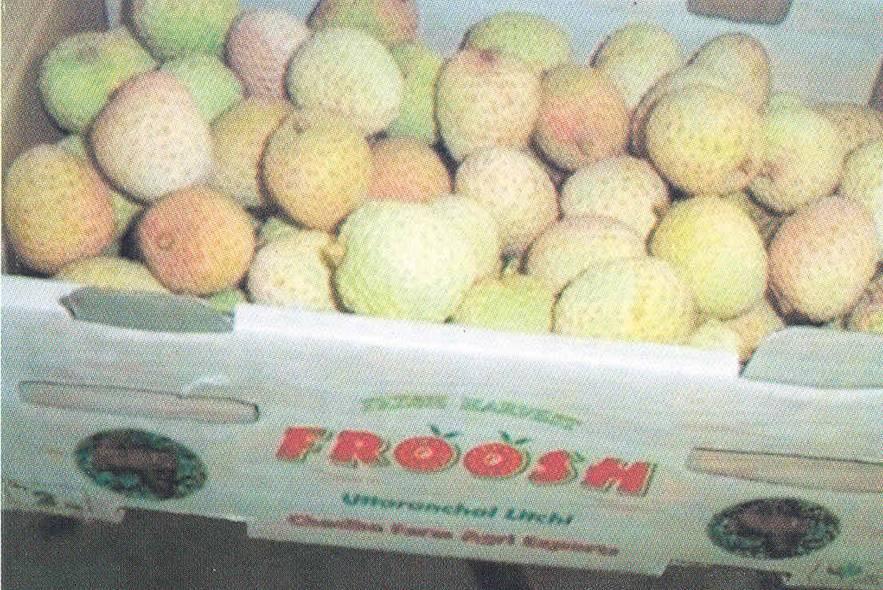
15 Case Study 2: Litchi Second largest producer in the world next to China (56,000 ha and t) Cascading production but available for two months in a year ( mid May to Early July) < 1 % exports Poor maintenance and under exploited. 33 varieties available, only 2 are commercially grown Main markets away from the production centres and exploitative middlemen and marketing practices
16 Varietal Distribution across growing regions States Bihar Uttar Pradesh West Bengal Haryana / Punjab Varieties Deshi, Purbi, China, Kasba, Bedana, Early Bedana, Late Bedana, Dehra Rose, Shahi, Manragi, Maclean, Longia, Kaselia and Swarna Rupa Early Large Red, Early Bedana, Late Large Red, Rose Scented, Late Bedana, Calcuttia, Extra Early, Gulabi, Pickling, Khatti, Dehra Dun, Piyazi Bombai, Ellaichi Early, China, Deshi, Purbi and Kasba Early Seedless, Late Seedless, Seedless-1, Seedless-2

17 Litchi Diversity on Farm Bedana 2% Kasba 3% Longia 3% China 42% Shahi 50%

18 Litchi market chain


19 Litchi arrivals into the mandi Exploitative Under Cover auction in progress
20 Sl No Particulars Price Spread in Domestic marketing 1 Price realised by the Producer Channel I (Sale Through PHC) Channel II (Self-Marketing) ) Price (Rs/Kg) Percent to Total Price (Rs/Kg) Percent to Total Cost for PHC/grower PHCs margin Commission agents price CA s Margin Stockists price Cost and Margin of the Stockist Retailers Price Retailers Cost Retailers margin Consumers Price Price Spread
21 Impact of non-performing market on diversity maintenance on farm Farmers do not take up self-marketing, Depend heavily on other marketing channels PHC gets benefit Farmer does not take care of his orchards, does not apply fertilizers or pesticides Does not have incentive to maintain different varieties or for different purposes.
22 Conclusions On farm diversity is a tool to augment risk Adds to farm income Varietal features could influence consumer preference and differential price Prolong season Support livelihoods On farm diversity maintenance may be slow but is influenced by markets Markets and infrastructure needs to be upgraded for increasing on farm diversity of tropical fruits
23 Thank you