World population to grow from 7.0 billion to 9.2 billion by Diets are improving with rapid growth of middle class
|
|
|
- Nicholas Bell
- 5 years ago
- Views:
Transcription


1 AGRIBUSINESS AND FOOD PRODUCTION ARE AMONG THE GREATEST GROWTH INDUSTRIES OF OUR ERA World population to grow from 7.0 billion to 9.2 billion by 2050 Global food production will need to increase 70% to meet higher demand Diets are improving with rapid growth of middle class Source: United Nations Food and Agricultural Organization 1 Nestle Dairy Story

2 GLOBAL DEMAND FOR ANIMAL PROTEIN CONTINUES TO GROW 2 Source: Meat Atlas (CC-BY-SA Heinrich Boell Foundation, Friends of the Earth Europe)
3 CHALLENGE: LIMITED RESOURCES At most, only 12% more arable land is available globally environmentally sensitive Only 5% more land is projected to be cultivated by 2050 Demand for water will outstrip supply by 40% by 2030 We must produce more food, with fewer resources and less environmental impact. Source: OECD-FAO, global water supply/demand model; agricultural production based on IFPRI computed general equilibrium model base case; A Daunting Task, Prof. Robert Thompson (2010) 3


4 OPTIMIZING YIELD THROUGH BIG DATA V WHY AND WHY NOW? Mike Vande Logt 4


5 1) TECHNOLOGY DRIVING CROP YIELD CORN YIELD Biotech Genetics : 3.5+bu/yr Yield (bu/a) : 1.5+bu/yr Insights Precision Ag Biotech Genetics Source: Winfield Dr. Solutions, Fred Below, LLCUniversity of Illinois
6 CORN YIELD HAS INCREASED BU/A
7 AND CORN PRICE HAS INCREASED BU/A $8.00 $7.00 $6.00 $5.00 $4.00 $3.00 $2.00 $1.00 $- Dollars/A 7
8 LIFE HAS BEEN GREAT FOR ALL AG-INDUSTRY PARTICIPANTS Average U.S. Grower Per Acre Revenue $ $

9 THE BIG SIX AG COMPANIES R&D SPEND CONTINUES TO ACCELERATE % CAGR % CAGR Monsanto Syngenta Bayer Dupont BASF Dow 9


10 CORE ASSUMPTIONS DRIVING MARKET PLACE CHANGE 1. Yield potential exceeding management level 2. Molecular plant breeding dramatically increasing high end yield potential. Yield monitors don t lie. Seed now most expensive crop input. Coops must grow it! 3. Drought tolerance improving even faster than yield 4. Rainfall optimization will drive production practices 5. Cannot risk pre-plant placement of all inputs 6. Yield optimization enabled by data driven in season crop management including weather 7. Enabled by innovations in application equipment. 10

11 360 Y UNDERCOVER DROP AND UNDERCOVER AT R1 11


12 2) THE WORLD IS GETTING DIGITIZED Digital Data is a Representation About a Real World Condition 12
13 ELECTRONIC CIRCUITS ARE GETTING CHEAPER AND MORE POWERFUL 32x improvement in capability per spend in past 10 years Source: Wikipedia.org, anandtech.com, Intel, CNET.com, processortimeline.info, thocp.net 13


14 WIRELESS SENSORS EVERYWHERE 100B sensors installed over next 4 years Source: Semico Research,
15 WIRELESS DATA TRANSFER IS GETTING CHEAPER $400 $350 $300 $250 $373 $251 75% drop in price over 4 years $200 $150 $100 $50 $160 $103 $ Source: Cisco (global wireless data use) and Statista (global carrier data revenue estimate) 15


16 MORE CONNECTED MOBILE DEVICES THAN PEOPLE Global Connections by Technology, B B B B B B B B B B Source: GSMA Wireless Intelligence, Machina Research, A.T. Kearney Analysis 16


17 WIRELESS ACCESS EVERYWHERE US 3G Network Coverage Becoming Ubiquitous Source: AT&T and Verizon Wireless 17
18 STORING DATA IS GETTING CHEAPER Average Price Per Gigabyte, $200,000 $180,000 $160,000 $140,000 $120,000 $100,000 $80,000 $60,000 $40,000 $20,000 $0 $192,308 $119,950 97% Drop in Price per Gigabyte Over Past 10 Years $44,950 97% drop in price per gigabyte over past 10 Years $176 $6.21 $0.70 $0.07 $ Source: Wayback Machine (Statistics Brain) 18
19 AGRICULTURE IMPLICATIONS: ENVIRONMENTAL AND OPERATING DATA 19

20 PEOPLE IN BOTH FIELDS (WALL STREET & BASEBALL) OPERATE WITH BELIEFS AND BIASES. TO THE EXTENT YOU CAN ELIMINATE BOTH AND REPLACE THEM WITH DATA, YOU GAIN A CLEAR ADVANTAGE.. Michael Lewis, Moneyball 20


21 WHERE IS THE OPPORTUNITY FOR AG RETAIL 21


22 Every farmer makes an average of 40 decisions each year Planning Pre-Planting Production Planning Crop Rotation Weed Control Program Pre-Plant Irrigation Fertility Program Planting Seed Depth In-Season Row Spacing Variety/Hybrid Selection Refuge Options Plant Population Seed Treatment Soil Insecticides Soil Nematicides ph Management Burn-Down Program Tillage Level Primary Tillage Program Planting Speed Through the Field Other Planting Operation Decisions Plant Population Starter Fertilizer Herbicide Application Soil Insecticides Fungicide Application In- Furrow Variety/Hybrid Selection In-Field Keep Stand or Re-Plant Post-Emergent Herbicide Application Foliar Insect Control Fertility Program Foliar Disease Control Irrigation Application In-Season Micronutrients/Fertility Management Harvest Equipment 22 Crop Diagnostics Crop Marketing Support 22 SOURCE: Monsanto team The above boxes refer to some of the decisions farmers face in growing their crops. Timing Storage Post-Harvest Assessment
23 THREE TYPES OF DATA IN USE Traditional Experimental Data (Answer Plot ) Controlled experimental design to test chosen agronomic factors Example; nitrogen levels, populations, etc. Remote Sensing (R7 Satellite Imagery) Evaluating the current state of the crop Predictive Modeling (Climate Pro ) Simulates and predicts final results based on management decisions 23

24 TRADITIONAL DATA DRIVEN PLOT WORK > 1.2M Plots LSDs < 2 bu. Largest applied ag - research program in U.S. 24


25 OPTIMIZING GENETIC PERFORMANCE Starts With the Seller & the Grower s Field! Answer Plot Data Characterized in First Year RTP, RTN, TCOC 25 Variable Rate Technology

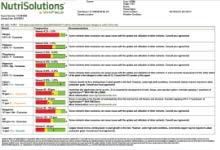
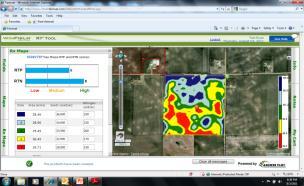


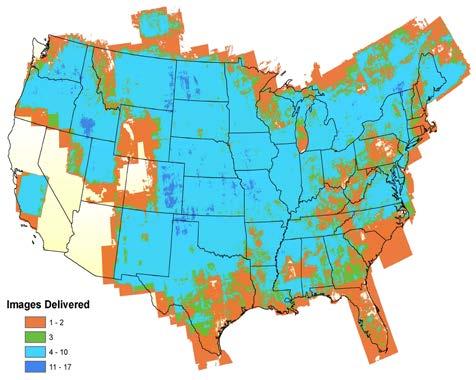
26 OPTIMIZING PLANT NUTRITION In Season Imagery 7 to 14 images / year 26


27 CROP HEALTH MONITOR DEFEND YIELD Daily crop insights Daily low resolution imagery Instantly see variability between fields, and yesterday versus today. Ground truth the issue Take action to protect and improve yields 27 27
28 2014 = 175 bu/ac x $4.25 = $ = 180 bu/ac x $3.65 = $657 Average U.S. Grower Per Acre Revenue $225 $340 28


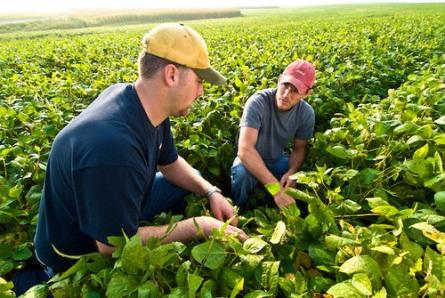
29 Getting the Right Bushels is as Important as Getting the Right Price! Where and how do farmers get the right bushels? 29
30 BIG DATA CONCERNS 77.5% Feared regulators and other government officials might gain access to their private information 76% concerned others could use their information for commodity market speculation 82% are unclear how companies will use my data For example (Selling my yield information to landlords) 30
31 TRUST IN AIDED SOURCES Nearly two-thirds of growers trust their Crop Consultant to provide a product/service like the one described, followed by a Local Co-Op and Precision Ag Company. Trust completely (5) (4) Moderately trust (3) (2) Not trust at all (1) a. Crop consultant 18% 45% 24% 10% 3% b. Local co-op 12% 36% 32% 14% 6% i. Precision ag company 9% 36% 37% 13% 5% d. Farmer dealer 8% 29% 36% 20% 7% e. Independent dealer 8% 35% 38% 14% 5% h. Equipment manufacturer 8% 31% 38% 17% 7% g. Crop input manufacturer 5% 21% 35% 25% 15% c. Retailer 4% 21% 42% 26% 7% f. Crop input distributor 4% 42% 23% 8% 0% 20% 40% 60% 80% 100% Percent of Growers (n=332) 31 Q1. Based on the description you just read, how much would you trust each of the providers listed to offer this new product/service?
 Security and Control of Data Sharing (Consultant,")
32 COOPERATIVE DATA SILO What is the Data Silo? Locally Branded Cloud Storage & Backup Geospatial Transformation & Conversion OADA Cloud to Cloud Integration (Deere, Climate Corp, etc ) Security and Control of Data Sharing (Consultant, Cooperative, Winfield, Monsanto, individuals) Bi-Directional Local Retailer Access and Sharing of Data Basic Analysis and Dashboards Advanced Search Grower Owned Data Member Owned Solution Access Control In Hands of Growers or Designees Locally Branded Most Trusted Solution 32 R&D in 2015

33 33